Embed Size (px)
Citation preview

Dean A. Bangsund
F. Larry Leistritz
Department of Agricultural EconomicsAgricultural Experiment StationNorth Dakota State University
Fargo, North Dakota 58105
Agricultural Economics Report No. 395 May 1998
Economic Contribution of the Sugarbeet
Industry to North Dakota and Minnesota

ACKNOWLEDGMENTS
Our appreciation and thanks are extended to Lois Chase, American Crystal Sugar Company; RonBailey, Southern Minnesota Beet Sugar Cooperative; and Bruce Fronning, Minn-Dak FarmersCooperative; for their cooperation and efforts in providing financial information. The information suppliedby the sugarbeet cooperatives provided the basis for most of this study's analysis.
Thanks are given to Shelly Swandal for document preparation, Gary Moran for editorialassistance, and to our colleagues who reviewed this manuscript.
Financial support was provided by the Sugarbeet Research and Education Board of Minnesota andNorth Dakota. We express our appreciation to this organization for their support. This report can also befound at this web site: http://agecon.lib.umn.edu/ndsu.html.
The authors assume responsibility for any errors of omission, logic, or otherwise.
NOTICE:
The analyses and views reported in this paper are those of the author. They are notnecessarily endorsed by the Department of Agricultural Economics or by North Dakota StateUniversity.
North Dakota State University is committed to the policy that all persons shall have equalaccess to its programs, and employment without regard to race, color, creed, religion, nationalorigin, sex, age, marital status, disability, public assistance status, veteran status, or sexualorientation.
Information on other titles in this series may be obtained from: Department ofAgricultural Economics, North Dakota State University, P.O. Box 5636, Fargo, ND 58105. Telephone: 701-231-7441, Fax: 701-231-7400, or e-mail: [email protected].
Copyright © 1998 by Dean A. Bangsund and F. Larry Leistritz. All rights reserved. Readers may make verbatim copies of this document for non-commercial purposes by any means,provided that this copyright notice appears on all such copies.

TABLE OF CONTENTSPage
List of Tables . . . . . . . . . . . . . . . . . . . . . . . . . . . . . . . . . . . . . . . . . . . . . . . . . . . . . . . . . . . . . . . . . . . . ii
List of Figures . . . . . . . . . . . . . . . . . . . . . . . . . . . . . . . . . . . . . . . . . . . . . . . . . . . . . . . . . . . . . . . . . . . . ii
Abstract . . . . . . . . . . . . . . . . . . . . . . . . . . . . . . . . . . . . . . . . . . . . . . . . . . . . . . . . . . . . . . . . . . . . . . . . iii
Highlights . . . . . . . . . . . . . . . . . . . . . . . . . . . . . . . . . . . . . . . . . . . . . . . . . . . . . . . . . . . . . . . . . . . . . . iv
Introduction . . . . . . . . . . . . . . . . . . . . . . . . . . . . . . . . . . . . . . . . . . . . . . . . . . . . . . . . . . . . . . . . . . . . . . 1
Objectives . . . . . . . . . . . . . . . . . . . . . . . . . . . . . . . . . . . . . . . . . . . . . . . . . . . . . . . . . . . . . . . . . . . . . . . 2
Procedures . . . . . . . . . . . . . . . . . . . . . . . . . . . . . . . . . . . . . . . . . . . . . . . . . . . . . . . . . . . . . . . . . . . . . . . 3Sugarbeet Production . . . . . . . . . . . . . . . . . . . . . . . . . . . . . . . . . . . . . . . . . . . . . . . . . . . . . . . . 3Sugarbeet Production Expenditures . . . . . . . . . . . . . . . . . . . . . . . . . . . . . . . . . . . . . . . . . . . . . . 6Sugarbeet Cooperative Expenditures . . . . . . . . . . . . . . . . . . . . . . . . . . . . . . . . . . . . . . . . . . . . . 6Input-output Analysis . . . . . . . . . . . . . . . . . . . . . . . . . . . . . . . . . . . . . . . . . . . . . . . . . . . . . . . . 6
Economic Impacts . . . . . . . . . . . . . . . . . . . . . . . . . . . . . . . . . . . . . . . . . . . . . . . . . . . . . . . . . . . . . . . . . 7Direct Impacts . . . . . . . . . . . . . . . . . . . . . . . . . . . . . . . . . . . . . . . . . . . . . . . . . . . . . . . . . . . . . . 7
Sugarbeet Production . . . . . . . . . . . . . . . . . . . . . . . . . . . . . . . . . . . . . . . . . . . . . . . . . . 7Sugarbeet Processing . . . . . . . . . . . . . . . . . . . . . . . . . . . . . . . . . . . . . . . . . . . . . . . . . . 8
Secondary Impacts . . . . . . . . . . . . . . . . . . . . . . . . . . . . . . . . . . . . . . . . . . . . . . . . . . . . . . . . . 10Tax Revenue . . . . . . . . . . . . . . . . . . . . . . . . . . . . . . . . . . . . . . . . . . . . . . . . . . . . . . . . . . . . . . 12Total Economic Impacts . . . . . . . . . . . . . . . . . . . . . . . . . . . . . . . . . . . . . . . . . . . . . . . . . . . . . 13Previous Industry Impacts . . . . . . . . . . . . . . . . . . . . . . . . . . . . . . . . . . . . . . . . . . . . . . . . . . . . 13
Conclusions . . . . . . . . . . . . . . . . . . . . . . . . . . . . . . . . . . . . . . . . . . . . . . . . . . . . . . . . . . . . . . . . . . . . . 14
References . . . . . . . . . . . . . . . . . . . . . . . . . . . . . . . . . . . . . . . . . . . . . . . . . . . . . . . . . . . . . . . . . . . . . . 17
AppendicesAppendix A Sugarbeet Production Budget . . . . . . . . . . . . . . . . . . . . . . . . . . . . . . . . . . . . . 19Appendix B Sugarbeet Processor Expenditures Survey . . . . . . . . . . . . . . . . . . . . . . . . . . . . 23

ii
List of Tables
Table Page
1 Sugarbeet Production, by County, North Dakota and Minnesota, 1996 . . . . . . . . . . . . . . . . . . . . 5
2 Direct Economic Impacts from Sugarbeet Production in Eastern North Dakotaand Minnesota, 1996 . . . . . . . . . . . . . . . . . . . . . . . . . . . . . . . . . . . . . . . . . . . . . . . . . . . . . . . . . 8
3 Direct Economic Impacts from Sugarbeet Processing in North Dakotaand Minnesota, 1997 . . . . . . . . . . . . . . . . . . . . . . . . . . . . . . . . . . . . . . . . . . . . . . . . . . . . . . . . . 9
4 Direct, Secondary, and Total Economic Impacts from the SugarbeetIndustry in Minnesota and North Dakota, 1997 . . . . . . . . . . . . . . . . . . . . . . . . . . . . . . . . . . . . 11
5 Estimated Tax Collections Generated by the Sugarbeet Industry inNorth Dakota and Minnesota, 1997 . . . . . . . . . . . . . . . . . . . . . . . . . . . . . . . . . . . . . . . . . . . . . 12
6 Economic Size of the Sugarbeet Industry in North Dakotaand Minnesota, Selected Years . . . . . . . . . . . . . . . . . . . . . . . . . . . . . . . . . . . . . . . . . . . . . . . . 15
List of Figures
Figure Page
1 Distribution of Sugarbeet Production and Processing Facilities in Eastern North Dakota and Minnesota, 1996 . . . . . . . . . . . . . . . . . . . . . . . . . . . . . . . . . . . . . . . . . . . . . . . . . . . 4

iii
Abstract
Agricultural industries in small geographical areas with limited acreage tend to be overlooked bythose not associated with the growing region or industry. Sugarbeets continue to be produced in arelatively small geographic area and with relatively limited acreage in North Dakota and Minnesota. Thesefactors, along with continued debate over policies affecting domestic sugar industries and recent industryexpansions, help justify a continued assessment of the economic importance of the sugarbeet industry to theregional economy.
Revenues from sugarbeet production and expenditures by processors to North Dakota andMinnesota entities in fiscal 1997 represented the direct economic impacts from the industry. Expenditureinformation was provided by sugarbeet processing and marketing cooperatives. Secondary economicimpacts were estimated using input-output analysis.
The sugarbeet industry planted 654,400 acres and harvested 11.9 million tons in 1996. Productionand processing activities generated $831.1 million in direct economic impacts. Total (direct and secondary)annual economic impacts from the sugarbeet industry were estimated at $2.3 billion. Direct and secondaryemployment in the industry was 2,486 and 30,436 full-time equivalent jobs, respectively. Tax revenuesgenerated by the industry in North Dakota and Minnesota were $51 million.
In real terms, gross business volume of the sugarbeet industry in the two states has increased 74percent since 1987. Increases in business activity from the industry have resulted from expanded acreageand increased processing activities. The sugarbeet industry remains an important agricultural industry inNorth Dakota and Minnesota.
Key words: sugarbeet industry, North Dakota, Minnesota, economic impact
iv
Highlights
Agriculture has remained a dominant economic sector in North Dakota due to cropproduction and in Minnesota due to crop and livestock production. Unlike most traditional crops,sugarbeets are produced on relatively few acres and in limited geographic areas. However,Minnesota and North Dakota produced over 45 percent of the nation's sugarbeet crop in 1996.
Sugarbeet production and processing facilities are concentrated in the Red River Valley ofNorth Dakota and Minnesota and in west central Minnesota. Sugarbeets, unlike most traditionalcrops, are difficult and expensive to transport long distances and have unique storage problems. As a result, several processing facilities have been established in the sugarbeet-producing areas.
Farmers and producers generate direct economic impacts to the area economy through (1)expenditures for production outlays and (2) spending net returns from enterprise operations. Acrop production budget was developed to estimate the direct economic impacts from sugarbeetproduction. Total direct impacts from sugarbeet production in the two states were estimated to be$832 per acre or $544.6 million.
Similarly, sugarbeet cooperatives and their processing facilities impact local economiesthrough expenditures for processing inputs, labor, and investment in facilities and capital. Threesugarbeet cooperatives located in eastern North Dakota (Minn-Dak Farmers Cooperative) andMinnesota (American Crystal Sugar Company and Southern Minnesota Beet Sugar Cooperative)were surveyed to obtain cash expenditures made within North Dakota and Minnesota in the 1997fiscal year. Direct impacts from the cooperatives were estimated at $286.5 million in fiscal 1997,with about 42 and 58 percent of the direct impacts generated in North Dakota and Minnesota,respectively.
Total direct economic impacts from the sugarbeet industry (sugarbeet production andprocessing) were estimated at $831 million in 1997. An input-output model was used to estimatethe secondary economic impacts. The $831 million in direct impacts generated another $1.5billion in secondary impacts. Total economic activity (direct and secondary impacts) wasestimated at $2.3 billion in Minnesota and North Dakota. Total collections generated by thesugarbeet industry from sales and use, personal income, and corporate income taxes wereestimated at $51 million in 1997. The cooperatives also employed an equivalent of 2,486 full-timeworkers and indirectly supported an additional 30,400 full-time equivalent jobs in the two-statearea.
Examinations of previous studies of the economic contribution of the sugarbeet industryrevealed that the industry has experienced substantial real growth (inflation removed) in the lastdecade. Since 1987, planted acreage and tons processed have increased 42 percent and 67percent, respectively. Correspondingly, in real terms, gross business volume generated by thesugarbeet industry in North Dakota and Minnesota has increased 24 percent since 1992 and nearly74 percent since 1987.
v
The characteristics of the sugarbeet-growing area suggest most of the industry’s economicactivity affects local economies, since expenditures for crop inputs (Retail Trade sector) andreturns to growers (Households sector), which represent a majority of the economic activity, areevenly distributed throughout the growing area. Although the sugarbeet industry in Minnesota andNorth Dakota is not large in terms of acres or geographic area, the magnitude of key economicmeasures (i.e., retail trade activity, personal income, business activity, and secondary employment)clearly indicates that the industry contributes substantially to local economies and the two-stateeconomy.

*Research scientist and professor, respectively, Department of Agricultural Economics, NorthDakota State University, Fargo.
Economic Contribution of the SugarbeetIndustry to the Economy of North Dakota and Minnesota
Dean A. Bangsund and F. Larry Leistritz*
INTRODUCTION
Agriculture has historically been the largest component of North Dakota's economic base. During the 1980s, in the face of severe drought and reduced commodity prices, agriculturecontinued to be the single most important basic sector in the North Dakota economy. Eventhough other sectors of North Dakota's economy have recently increased, agriculture stillcomprises over 35 percent of total sales to final demand (Coon and Leistritz 1998). As a result,the economy of North Dakota still depends on the agriculture sector for a large portion of itseconomic activity.
Minnesota also relies heavily on agriculture for much of its economic activity. Agriculturein Minnesota, not including the forest industry, accounted for 22 percent of all out-of-state salesin 1990 (Senf et al. 1993). Agriculture was the single largest sector, contributing more to out-of-state sales than high technology manufacturing, durable goods, or forest products. Measured interms of overall economic activity, agriculture generated 13 percent of all economic activity inMinnesota in 1990.
Agriculture in North Dakota is dominated by crop production, while in Minnesota cropand livestock production are more equal in importance. North Dakota typically is considered asmall grain-producing state. The reputation as a small grain-producing state is justified, since thestate has consistently been ranked third or better nationally in nearly all categories of small grainproduction. In addition to small grains, North Dakota also is a national leader in the productionof sunflower and dry edible beans and annually ranks in the top ten in potato production (NorthDakota Agricultural Statistics Service various years). Minnesota, much of which is part of thecorn belt region of the Midwest, ranks in the top five states for the production of corn, soybeans,sunflowers, navy beans, spring wheat, and alfalfa hay. Also, Minnesota ranks nationally in severallivestock categories (dairy, turkeys, hogs, and cattle) (Minnesota Agricultural Statistics Servicevarious years).
Sugarbeet production is often overlooked in its contribution to the agriculture sector, duepartially to the sheer acreage of other crops in the two states. For example, North Dakota in1996 planted about 12.7 million acres of wheat, while Minnesota planted 13.5 million acres ofcorn and soybeans (North Dakota Agricultural Statistics Service various years; MinnesotaAgricultural Statistics Service various years). In comparison, North Dakota and Minnesotaplanted about 227,000 and 441,000 acres of sugarbeets, respectively. However, both Minnesotaand North Dakota have been national leaders in sugarbeet production for several decades.
2
Minnesota has been the leading sugarbeet-producing state since 1989 and the leading state 12 outof the last 15 years, while North Dakota has been ranked in the top five for the last 10 years. In1996, Minnesota and North Dakota produced nearly 45 percent of the nation's sugarbeet crop andaccounted for about 48 percent of the nation’s planted sugarbeet acreage.
Sugarbeet production is more capital intensive and geographically concentrated than smallgrains and most row crops; this, along with local processing facilities, has historically contributedto the industry's impact on the two-state economy. Coon and Leistritz (1988) and Bangsund andLeistritz (1993) estimated the economic contribution of the sugarbeet industry in North Dakotaand Minnesota in previous years. However, continued debate over the future of national sugarpolicies and recent expansions by the industry, both in acreage and processing capacity, hasprompted a reevaluation of the industry’s economic importance.
Often agricultural commodities that are contained in geographically concentrated areaswith limited acreage tend to be overlooked by those not associated with the growing region orindustry. Sugarbeets continue to be produced in a relatively small geographic area with relativelylimited acreage. These factors, along with continued debate over the future of federal farmprograms, help to justify a continued assessment of the economic importance of the sugarbeetindustry to the regional economy. A reassessment of the industry’s economic importance to theregion would be helpful to (1) demonstrate the economic significance of future policy changesaffecting domestic sugar industries and (2) document the economic effect of recent industryexpansions. Information from an impact or contribution study can be valuable for industry,educational, and public relations efforts.
OBJECTIVES
The purpose of this report was to estimate the economic contribution (direct andsecondary effects) of the sugarbeet industry to the economy of North Dakota and Minnesota.
Specific objectives include:
1) quantifying sugarbeet acreage and production in eastern NorthDakota and Minnesota,
2) estimating the direct economic impacts of the sugarbeet industryto the North Dakota and Minnesota economies, and
3) estimating the secondary economic impacts of the sugarbeet industryto the North Dakota and Minnesota economies.

3
PROCEDURES
An economic contribution analysis, as defined in this study, represents an estimate of allrelevant expenditures and returns associated with an industry (i.e., economic activity fromsugarbeet production and processing). The economic contribution approach to estimatingeconomic activity has been used for several similar studies (Bangsund and Leistritz 1998;Bangsund and Leistritz 1995; Coon and Leistritz 1988). The methods and analysis used in thisreport paralleled those used by Bangsund and Leistritz (1993).
Analysis of the sugarbeet industry required several steps. Discussion of the proceduresused in the study was divided into the following sections: (1) sugarbeet production in easternNorth Dakota and Minnesota, (2) sugarbeet production expenditures, (3) sugarbeet cooperativeexpenditures, and (4) application of input-output analysis to estimate secondary impacts.
Sugarbeet Production
Sugarbeet production and processing facilities are concentrated in the Red River Valley ofNorth Dakota and Minnesota and in west central Minnesota (Figure 1). Sugarbeet production iscentered around processing plants operated by three producer-owned cooperatives: AmericanCrystal Sugar Company with headquarters in Moorhead, Minnesota; Minn-Dak FarmersCooperative located in Wahpeton, North Dakota; and Southern Minnesota Beet SugarCooperative located in Renville, Minnesota. Generally, the growing conditions in the Red RiverValley and west central Minnesota are conducive to sugarbeet production. Sugarbeets, unlikemost traditional crops (e.g., small grains, corn, beans), are difficult and expensive to transportlong distances. They also have unique storage problems not found with most crops (i.e., they arebulky, require specialized handling equipment, have limited storage life, and must be stored incold conditions). As a result, processing facilities and sugarbeet production are located in closeproximity to each other. The geographic concentration of sugarbeet production and processing ineastern North Dakota and Minnesota accentuates the industry's economic impact.
North Dakota had seven counties that collectively produced about 3.9 million tons ofsugarbeets for American Crystal Sugar Company and Minn-Dak Farmers Cooperative in 1996(Table 1). Two western counties in North Dakota produced a small amount of irrigatedsugarbeets; however, those sugarbeets were transported to Montana for processing, and theacreage and production from those counties were not included in this study. Minnesota had over20 counties that collectively produced nearly 8 million tons of sugarbeets in 1996 (Table 1). Thetwo states had over 654,000 acres of sugarbeets in 1996, with about two-thirds of the acreage inMinnesota. The three sugar cooperatives processed about 11.7 million tons of sugarbeets fromthe 1996 crop. The difference between tons processed and total yield reported by North Dakotaand Minnesota Agricultural Statistics Services is probably attributable to differences inmeasurement techniques, storage and transportation loss, and shrink.

4
30,001 to 50,000 acresGrant
Tra
vers
e
Swift
Yellow Medicine
Redwood
Meeker
Sibley
McLeod
Red Lake
Steele
Otter Tail > 50,000 acres
Becker
Norman
Clay
Walsh Marshall
KittsonPembina
PolkTraill
Grand Forks
Cass
Wilk
in
Ric
hlan
d
Renville
Kan
diyo
hi
10,000 to 30,000 acres
less than 10,000 acres
Sugarbeet processing facility
Chipp-ewa
Figure 1. Distribution of Sugarbeet Production and Processing Facilities in Eastern North Dakotaand Minnesota, 1996
Sources: North Dakota Agricultural Statistics Service (various years) and MinnesotaAgricultural Statistics Service (various years).

5
Table 1. Sugarbeet Production, by County, North Dakota and Minnesota, 1996 Acreage State/County Planted Harvested Yield Production North Dakotaa ---------- acres ---------- - tons/acre - ---- tons ----
Cass 23,100 23,000 19.7 454,100Grand Forks 26,400 26,200 18.4 482,800Pembina 57,400 57,000 19.0 1,080,900Richland 29,900 29,800 17.9 534,000Steele 900 900 19.0 17,100Traill 31,600 31,200 19.1 594,700Walsh 44,100 44,000 17.6 774,400 State 213,400 212,100 18.6 3,938,000
MinnesotaBecker 2,400 2,400 22.7 54,400Chippewa 33,300 33,100 18.5 613,600Clay 62,500 62,400 18.4 1,145,800Grant 9,200 9,100 18.3 166,600Kandiyohi 13,500 13,500 20.3 273,700Kittson 28,200 28,000 15.8 443,400Marshall 33,700 33,200 16.7 553,900McLeod 1,000 900 20.1 18,100Meeker 1,600 1,600 19.1 30,500Norman 42,200 41,600 19.7 821,100Otter Tail 2,400 2,400 19.0 45,700Polk 103,100 102,900 17.4 1,794,800Red Lake 1,700 1,700 16.8 28,600Redwood 3,500 3,400 18.3 62,300Renville 40,200 39,900 19.5 777,000Sibley 6,200 6,100 20.9 127,200Swift 4,700 4,700 16.8 79,000Traverse 7,900 7,800 17.5 136,700Wilkin 36,900 36,600 18.3 668,700Yellow Medicine 3,600 3,500 20.4 71,300Other Countiesb 3,200 3,200 18.3 58,600 State 441,000 438,000 18.2 7,971,000
North Dakotaand Minnesota 654,400 650,100 18.3 11,909,000 a Does not include sugarbeet production in Williams and McKenzie Counties.b A breakdown of the counties in this category was not available.
Sources: North Dakota Agricultural Statistics Service (various years) and Minnesota AgriculturalStatistics Service (various years).
6
Sugarbeet Production Expenditures
Crop expenses were obtained from the Farm Business Management Programs in NorthDakota and Minnesota (Minnesota and North Dakota Farm Business Management 1997). Budgets obtained were for sugarbeet production on owned land and rented land in the Red RiverValley in North Dakota and Minnesota. Expenses were averaged between budgets for sugarbeetsproduced on owned land and rented land by the ratio of owned and rented farm land in each state(U.S. Department of Commerce 1994a, 1994b). Revenues from sugarbeet production wereestimated from payments made to producers by the sugarbeet cooperatives.
Cash outlays by sugarbeet farmers represent money spent for fuel, seed, fertilizer,chemicals, machinery, and other items which impact local economies. The budget contained somenoncash expenditures, which are considered appropriate production costs, but do not represent acash expenditure. Non-cash expenditures were treated as revenues retained by the producer.
Sugarbeet Cooperative Expenditures
The three sugarbeet cooperatives located in eastern North Dakota (Minn-Dak FarmersCooperative) and Minnesota (American Crystal Sugar Company and Southern Minnesota BeetSugar Cooperative) were asked to provide the amounts of processing, research, distribution, andadministrative cash expenditures made within North Dakota and Minnesota in the last fiscal year(Appendix B). Expenditures made in North Dakota and Minnesota by United Sugars were alsoobtained. Non-cash outlays or expenditures made to entities outside of the two-state area werenot included. Itemizations of the expenditures for each cooperative were not included due toconfidentiality.
Input-output Analysis
Economic activity from a project, program, or policy can be categorized into direct andsecondary impacts. Direct impacts are those changes in output, employment, or income thatrepresent the initial or direct effects of a project, program, or event. Secondary impacts(sometimes further categorized into indirect and induced effects) result from subsequent rounds ofspending and respending within an economy. This process of spending and respending issometimes termed the multiplier process, and the resultant secondary effects are sometimesreferred to as multiplier effects (Leistritz and Murdock 1981).
Input-output (I-O) analysis is a mathematical tool that traces linkages among sectors of aneconomy and calculates the total business activity resulting from a direct impact in a basic sector(Coon et al. 1985). The North Dakota I-O Model has 17 economic sectors, is closed with respectto households (households are included in the model), and was developed from primary (survey)data from firms and households in North Dakota. Empirical testing has shown the North DakotaInput-Output Model is sufficiently accurate in estimating economic impacts in neighboring states(Coon and Leistritz 1994; Coon et al. 1984; Leistritz et al. 1990).

7
ECONOMIC IMPACTS
The economic contribution from the sugarbeet industry was estimated from productionand processing expenditures. Both production and processing expenditures represent the directeconomic impacts from the sugarbeet industry. Subsequently, the direct impacts were used withan input-output model to estimate the secondary impacts. Secondary impacts result from theturnover or respending of direct impacts within the area economy. The following section isdivided into five major parts: (1) direct impacts, (2) secondary impacts, (3) tax revenue, (4) totaleconomic impacts, and (5) previous industry impacts.
Direct Impacts
From an economic perspective, direct impacts are those changes in output, employment,or income that represent the initial or direct effects of a project, program, or event. The directimpacts from the sugarbeet industry on the economy of North Dakota and Minnesota include (1)expenditures and returns in the production of sugarbeets and (2) expenditures and returns fromprocessing sugarbeets into refined sugar. The following sections describe these direct economicimpacts.
Sugarbeet Production
Farmers and producers generate direct economic impacts to the area economy through (1)expenditures for production outlays and (2) net returns. Direct economic impacts from sugarbeetproduction (i.e., production outlays and producer returns) were estimated by developing a cropproduction budget. The sugarbeet production budget contained estimated revenue, variable andfixed costs, and returns to unpaid labor, management, and equity (Appendix A). Gross revenueper acre was calculated by dividing sugarbeet payments (i.e., payments made by the cooperativesto the growers) by estimated planted sugarbeet acreage. Variable and fixed costs were estimatedby averaging expenses from owned and rented land in 1996. Net returns were defined as thedifference between revenue and estimated production expenses.
Production outlays were handled as direct impacts generated by sugarbeet growers ineastern North Dakota and Minnesota. Returns to invested resources (i.e., unpaid labor,management, and equity) were considered direct impacts generated by sugarbeet producers eventhough they did not represent a cash expenditure. These items were considered retained by theproducer, eventually resulting in personal or business purchases. Cash and non-cash expensesfrom sugarbeet production, variable and fixed, were considered as direct impacts.
Total direct impacts per acre from sugarbeet production should be equal to the grossrevenue per acre, providing all economic activity (production expenses and returns to unpaidlabor, management, and equity) remains in the North Dakota and Minnesota economies. Allexpenses and returns associated with sugarbeet production in 1996 were assumed to remainwithin the two-state economy (i.e., there were no economic leakages associated with the
8
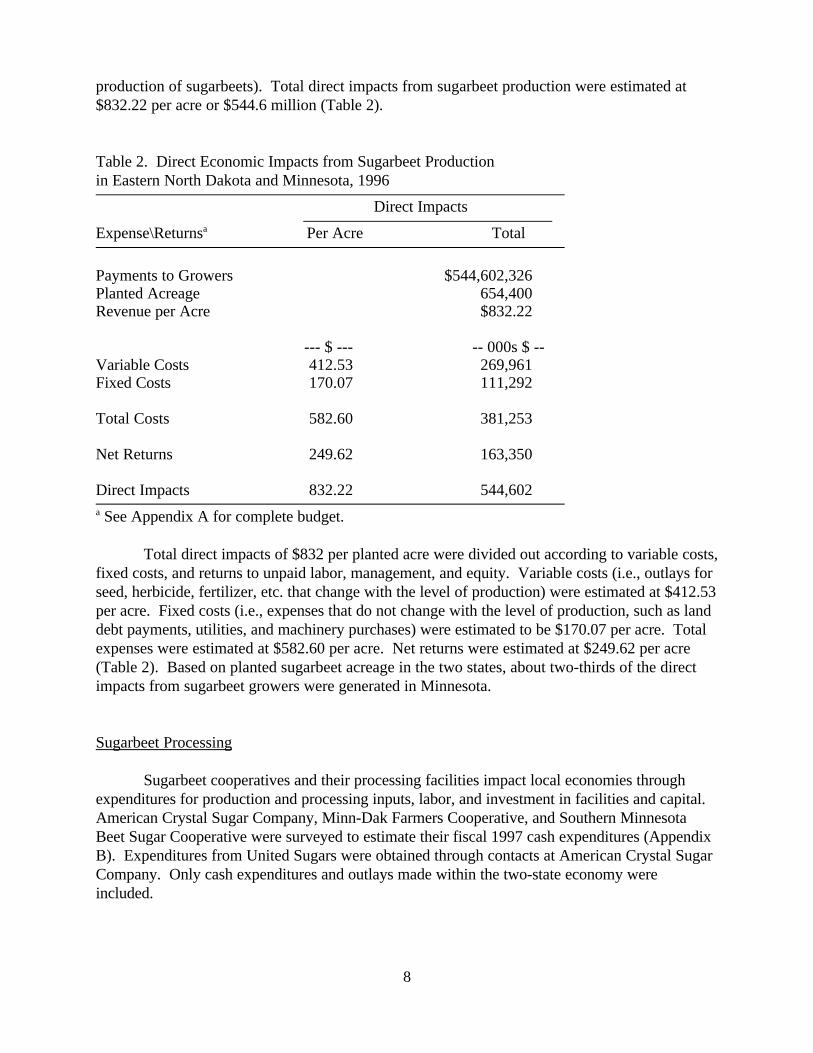
production of sugarbeets). Total direct impacts from sugarbeet production were estimated at$832.22 per acre or $544.6 million (Table 2).
Table 2. Direct Economic Impacts from Sugarbeet Productionin Eastern North Dakota and Minnesota, 1996 Direct Impacts Expense\Returnsa Per Acre Total
Payments to Growers $544,602,326Planted Acreage 654,400Revenue per Acre $832.22
--- $ --- -- 000s $ --Variable Costs 412.53 269,961Fixed Costs 170.07 111,292
Total Costs 582.60 381,253
Net Returns 249.62 163,350
Direct Impacts 832.22 544,602 a See Appendix A for complete budget.
Total direct impacts of $832 per planted acre were divided out according to variable costs,fixed costs, and returns to unpaid labor, management, and equity. Variable costs (i.e., outlays forseed, herbicide, fertilizer, etc. that change with the level of production) were estimated at $412.53per acre. Fixed costs (i.e., expenses that do not change with the level of production, such as landdebt payments, utilities, and machinery purchases) were estimated to be $170.07 per acre. Totalexpenses were estimated at $582.60 per acre. Net returns were estimated at $249.62 per acre(Table 2). Based on planted sugarbeet acreage in the two states, about two-thirds of the directimpacts from sugarbeet growers were generated in Minnesota.
Sugarbeet Processing
Sugarbeet cooperatives and their processing facilities impact local economies throughexpenditures for production and processing inputs, labor, and investment in facilities and capital. American Crystal Sugar Company, Minn-Dak Farmers Cooperative, and Southern MinnesotaBeet Sugar Cooperative were surveyed to estimate their fiscal 1997 cash expenditures (AppendixB). Expenditures from United Sugars were obtained through contacts at American Crystal SugarCompany. Only cash expenditures and outlays made within the two-state economy wereincluded.
9
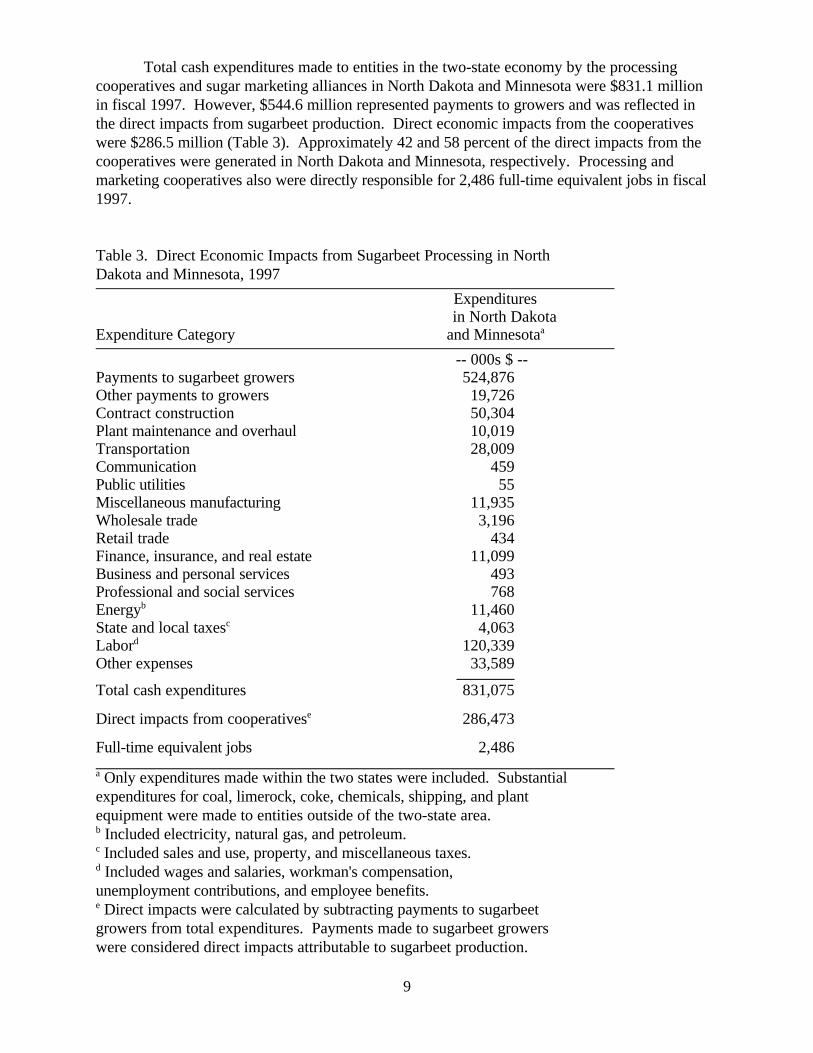
Total cash expenditures made to entities in the two-state economy by the processingcooperatives and sugar marketing alliances in North Dakota and Minnesota were $831.1 millionin fiscal 1997. However, $544.6 million represented payments to growers and was reflected inthe direct impacts from sugarbeet production. Direct economic impacts from the cooperativeswere $286.5 million (Table 3). Approximately 42 and 58 percent of the direct impacts from thecooperatives were generated in North Dakota and Minnesota, respectively. Processing andmarketing cooperatives also were directly responsible for 2,486 full-time equivalent jobs in fiscal1997.
Table 3. Direct Economic Impacts from Sugarbeet Processing in NorthDakota and Minnesota, 1997
Expenditures in North DakotaExpenditure Category and Minnesotaa
-- 000s $ --
Payments to sugarbeet growers 524,876Other payments to growers 19,726Contract construction 50,304Plant maintenance and overhaul 10,019Transportation 28,009Communication 459Public utilities 55Miscellaneous manufacturing 11,935Wholesale trade 3,196Retail trade 434Finance, insurance, and real estate 11,099Business and personal services 493Professional and social services 768Energyb 11,460State and local taxesc 4,063Labord 120,339Other expenses 33,589
Total cash expenditures 831,075
Direct impacts from cooperativese 286,473
Full-time equivalent jobs 2,486 a Only expenditures made within the two states were included. Substantialexpenditures for coal, limerock, coke, chemicals, shipping, and plantequipment were made to entities outside of the two-state area.b Included electricity, natural gas, and petroleum.c Included sales and use, property, and miscellaneous taxes.d Included wages and salaries, workman's compensation,unemployment contributions, and employee benefits.e Direct impacts were calculated by subtracting payments to sugarbeetgrowers from total expenditures. Payments made to sugarbeet growerswere considered direct impacts attributable to sugarbeet production.

10
Total direct impacts from the sugarbeet industry (production and processing) in NorthDakota and Minnesota were estimated at $831.1 million in fiscal 1997. Sugarbeet productionaccounted for 66 percent ($544.6 million) of all direct impacts, while sugarbeet processingaccounted for 34 percent ($286.5 million) of all direct impacts. Total direct impacts in Minnesotawere estimated at $535.6 million ($164.8 million from cooperatives and $370.8 million fromgrowers). Total direct impacts in North Dakota were estimated at $295.5 million ($121.6 millionfrom cooperatives and $173.8 million from growers). Minnesota sugarbeet growers, sugarbeetprocessing in Minnesota, North Dakota sugarbeet growers, and sugarbeet processing in NorthDakota accounted for 44.6 percent, 19.8 percent, 20.9 percent, and 14.6 percent of all directimpacts in the two-state economy in fiscal 1997, respectively.
Secondary Impacts
The secondary impacts of the sugarbeet industry in North Dakota and Minnesota wereestimated using the North Dakota Input-Output Model. The North Dakota Input-Output Modeltraces linkages among sectors of an economy and calculates total business activity resulting froma direct impact in a basic sector (Coon et al. 1985).
This process of spending and respending can be explained by using an example. A singledollar from an area sugarbeet producer (Households sector) may be spent for a bag of sugar atthe local store (Retail Trade sector); the store uses part of that dollar to pay for the nextshipment of sugar (Transportation and Agricultural Processing sectors) and part to pay thestore employee (Households sector) who shelved or sold the sugar; the sugar processor uses partof that dollar to pay for the sugarbeets used to make the sugar (Agriculture-Crops sector) ... andso on.
Sugarbeet production expenditures, returns to sugarbeet growers, and production outlaysby sugarbeet cooperatives were allocated to various economic sectors of the North Dakota Input-Output Model. Seed, herbicide, fungicide, insecticide, fertilizer, fuel, lubrication, repairs, andmachinery expenses were allocated to the Retail Trade sector. Custom hire expenses wereallocated to the Business and Personal Services sector. Crop insurance and interest expenseswere allocated to the Finance, Insurance, and Real Estate sector. Property taxes wereallocated to the Government sector. Utility expenses were allocated to the Communicationand Public Utilities sector. Hired labor, land rent, beet stock charges, and net returns wereallocated to the Households sector.
The sugarbeet cooperatives' expenditures were allocated to sectors of the North DakotaInput-Output Model in the same manner as production outlays. Contract construction wasallocated to the Construction sector. Transportation expenses were allocated to theTransportation sector. Miscellaneous manufacturing, wholesale trade expenses, and 20 percentof plant maintenance and overhaul expenses were allocated to the Agricultural Processing andMiscellaneous Manufacturing sector. Twenty percent of plant maintenance and overhaul andone-third of “other” expenses were allocated to Business and Personal Services sector. Expenses allocated to the Retail Trade sector included 40 percent of plant maintenance andoverhaul and two-thirds of “other” expenses. Expenses for petroleum, natural gas,

11
communications, and other utilities were allocated to the Communications and Public Utilitiessector. Employee benefits, insurance, and interest expenses were allocated to the Finance,Insurance, and Real Estate sector. Sugarbeet research was allocated to the Professional andSocial Services sector. All taxes, unemployment, and workmens compensation were allocated tothe Government sector. Salary and wage expenses were allocated to the Households sector.
The Households and Retail Trade sectors collectively accounted for 41 percent of alldirect impacts (Table 4). The Construction sector accounted for 18 percent of direct impacts,reflecting recent plant expansions by the cooperatives. Noticeable direct impacts were alsogenerated in the Finance, Insurance, and Real Estate (13 percent of total) and AgriculturalProcessing and Miscellaneous Manufacturing (10 percent of total) sectors.
Total direct impacts of $831.1 million from the sugarbeet industry in North Dakota andMinnesota generated about $1.5 billion in secondary impacts (Table 4). Secondary economicimpacts were greatest in the Households ($496 million), Retail Trade ($452 million), Finance,Insurance, and Real Estate ($100 million), Communications and Public Utilities ($73 million)and Government ($72 million) sectors. The economic activity in the Households sectorrepresents economy-wide personal income resulting from industry expenditures and theirsubsequent secondary effects. Each dollar of direct impacts generated $1.79 in secondaryimpacts.
Table 4. Direct, Secondary, and Total Economic Impacts from the Sugarbeet Industryin North Dakota and Minnesota, 1997 Economic Impacts of the Sugarbeet Industry Economic Sector Direct Secondary Total
-------------------- (000s) $ ---------------------
Agriculture-livestock 0 57,575 57,575Agriculture-crops 0 32,891 32,891Nonmetal Mining 0 5,127 5,127Construction 52,307 53,953 106,260Transportation 28,009 8,260 36,269Communication and Public Utilities 15,895 72,635 88,530Agricultural Processing and Miscellaneous Manufacturing 17,135 46,916 64,051Retail Trade 228,189 452,157 680,346Finance, Insurance, and Real Estate 90,220 99,947 190,167Business and Personal Service 26,740 38,223 64,963Professional and Social Service 3,252 54,956 58,208Households 349,618 496,161 845,779Government 19,708 71,669 91,377 Totals 831,073 1,490,470 2,321,543
Direct employment (FTE) 2,486Secondary employment (FTE) 30,436

12
Tax Revenue
Tax collections are another important measure of the economic impact of an industry onan economy. Tax implications have become an increasingly important measure of local and state-level impacts. Some of the interest in estimating tax revenue generated by an industry hasstemmed from public awareness of the importance of tax revenue to local and state governments. In an era of reduced federal funding, revenue shortfalls, and growing public demand ongovernments to balance their budgets while providing constant or increased levels of services andbenefits, tax collections have become an important factor in assessing economic impacts.
Business activity alone does not directly support government functions; however, taxes onpersonal income, retail trade, real estate property, and corporate income are important revenuesources for local and state governments. Total economic impacts in the Retail Trade sector wereused to estimate revenue from sales and use taxes. Economic activity in the Households sectorwas used to estimate personal income tax collections. Similarly, corporate income was estimatedfrom the economic activity in all business sectors (excluding the Households, Government, andAgriculture sectors). The sugarbeet cooperatives and growers paid an estimated $12.6 million inproperty taxes in North Dakota and Minnesota in 1997. Property taxes were included in thedirect impacts.
Tax collections were estimated separately for North Dakota and Minnesota. Directeconomic impacts, those from sugarbeet production and processing, were estimated for eachstate. I-O analysis was used to estimate total business activity in each state. Total businessactivity, which is comprised of personal income, retail trade, and other business activity, was usedto estimate tax revenue. Tax revenue generated by the sugarbeet industry in North Dakotaincluded $11 million in sales and use taxes, $4 million in personal income taxes, and $1.4 millionin corporate income taxes in fiscal 1997 (Table 5). The sugarbeet industry in Minnesotagenerated $12.7 million in sales and use taxes, $18.9 million in personal income taxes, and $3million in corporate income taxes in fiscal 1997 (Table 5). Total tax collections generated by thesugarbeet industry in fiscal 1997 from these three taxes alone in North Dakota and Minnesotawere about $51 million.
Table 5. Estimated Tax Collections Generated by theSugarbeet Industry in North Dakota and Minnesota, 1997
NorthTax Dakota Minnesota Total
------------------------- million dollars -------------------------
Sales and Use 11.0 12.7 23.7
Personal Income 4.0 18.9 22.9
Corporate Income 1.4 3.0 4.4
Total Taxes 16.4 34.6 51.0

13
Total Economic Impacts
Total business activity from sugarbeet industry expenditures and returns in Minnesota andNorth Dakota was estimated at $2.3 billion in fiscal 1997 (Table 4). The economic areas of thetwo-state economy with the greatest total economic impact included the Households ($846million), Retail Trade ($680 million), Finance, Insurance, and Real Estate ($190 million),Construction ($106 million), Government ($91 million), and Communications and PublicUtilities ($89 million) sectors.
The North Dakota I-O Model also estimates secondary employment. Employmentestimates represent the number of full-time jobs generated as a result of total business activity. The sugarbeet cooperatives were directly responsible for 2,486 full-time equivalent jobs andindirectly supported an additional 30,436 full-time equivalent jobs. The sugarbeet industry alsogenerated about $16.4 million in tax revenue in North Dakota and another $34.6 million in taxrevenue in Minnesota (not including property taxes).
The number of jobs created directly from sugarbeet production is difficult to estimatebecause most sugarbeet farmers also raise other crops. This complicates the employment estimatesince if they did not raise sugarbeets, they likely would remain employed raising other crops. Also, sugarbeet labor requirements are seasonal, requiring substantial additional labor duringplanting, weeding, thinning, and harvesting. Thus, estimating full-time employment equivalents isdifficult. Although full-time employment equivalents for additional part-time hired labor areunknown, most of the seasonal employment (i.e., migrant workers, harvest labor, and truckdrivers) is captured in the input-output analysis. Secondary employment was calculated based ontotal business activity and expressed in full-time equivalents. Seasonal employment, measured interms of individuals employed, would be higher than the number of full-time equivalents, sincethose workers are employed for short time periods.
Previous Industry Impacts
Previous estimates of the economic contribution of the sugarbeet industry were comparedto analyze the changing economic importance of the industry. Two prior studies examining theeconomic contribution of the sugarbeet industry in North Dakota and Minnesota have employedsimilar methodologies at various points in time. Thus, valid comparisions of previous estimatescan be made by adjusting previous industry estimates to reflect real dollars (effects of inflationremoved). Previous estimates from Coon and Leistritz (1988) and Bangsund and Leistritz (1993)were adjusted using the Consumer Price Index (U.S. Department of Labor 1998) to reflect 1997equivalent dollars.
Using a survey of area cooperatives to obtain processing, research, and distributionexpenditures and using crop budgets to estimate farmers' production expenditures, Coon andLeistritz (1988) estimated the overall business activity generated from the sugarbeet industry inNorth Dakota and Minnesota in 1987. Using similar methodologies, Bangsund and Leistritz

14
(1993) also surveyed sugarbeet cooperatives to obtain their operating expenditures and producerpayments in North Dakota and Minnesota. However, Bangsund and Leistritz (1993) includedproducer (grower) net returns and land expenses associated with sugarbeet production in theirstudy, two items not included in the study by Coon and Leistritz (1988). This study differs fromthe study by Bangsund and Leistritz (1993) by including expenditures by United Sugars to entitiesin North Dakota and Minnesota. All other aspects of the three studies remained similar.
Adjusting previous estimates of industry size for inflation revealed that the sugarbeetindustry exhibited real growth (size has increased after adjusting for inflation) over the last decade(Table 6). Since 1987, planted acreage and tons processed have increased 42 percent and 67percent, respectively. Planted acreage in 1987 was about 460,000 acres, while planted acreage in1996 increased to 654,000 acres. Correspondingly, in real terms (inflation removed), grossbusiness volume generated by the sugarbeet industry in North Dakota and Minnesota hasincreased 24 percent since 1992 and nearly 74 percent since 1987. Other economic indicatorsalso have shown real growth since 1987, such as a 72 percent increase in tax revenue generatedby the industry and a 14 percent increase in direct employment within the industry.
Recent changes in the economic impact of the industry have not been proportional inNorth Dakota and Minnesota. The economic size of the sugarbeet industry in North Dakotaincreased 32 percent in real terms since 1992, while the sugarbeet industry in Minnesota increased20 percent during the same period. Estimates of the economic impact of the sugarbeet industryby state were not available for 1987. North Dakota currently captures about 36 percent of theindustry’s economic activity, up from 33 percent in 1992.
Although this assessment represents the most comprehensive economic study of thesugarbeet industry to date, previous studies have been sufficiently similar in approach that validcomparisons were made of industry size over time. The economic size and importance of thesugarbeet industry in North Dakota and Minnesota has increased dramatically in the last decade,with subtle shifts in economic growth favoring North Dakota over Minnesota.
CONCLUSIONS
The sugarbeet industry analyzed in this study is geographically limited to the Red RiverValley of North Dakota and Minnesota and to west central Minnesota. Within this area,sugarbeets are produced and processed into refined sugar. The industry is concentratedgeographically and structurally, which boosts the economic effect of the industry on localeconomies. However, because sugarbeets are produced in a relatively small area compared toother traditional crops and livestock within the two states and with relatively few acres, theeconomic impact generated by the industry can be overlooked or underestimated.

15
Table 6. Economic Size of the Sugarbeet Industry in North Dakota and Minnesota,Selected Years
Sugarbeet Industry Activity in Various Years Economic Indicators 1987a 1992b 1997c
Gross Business Volume (nominal dollars) 985,709,000 1,635,800,000 2,321,500,000
Gross Business Volume (1997 dollars)d 1,337,300,000 1,871,300,000 2,321,500,000
Direct Employment 2,175 2,410 2,486Secondary Employment 14,898 20,942 30,436
Tax Revenue Generated (1997 dollars) 29,700,000 38,400,000 51,000,000
Planted Acreage 460,000 554,400 654,400Economic Impact per Acre (1997 dollars) 2,907 3,375 3,548
Tons of Sugarbeets Processede 7,000,000 9,273,819 11,690,823Economic Impact per Ton (1997 dollars) 191.04 201.78 198.57
Gross Business Volume by State (1997 dollars)
North Dakota na 626,886,000 825,357,000Minnesota na 1,244,414,000 1,496,186,000
na--not available.a Coon and Leistritz (1988).b Bangsund and Leistritz (1993).c Current figures include producer net returns, land expenses in sugarbeet production, andexpenditures from associated marketing efforts. All three items were excluded from Coon andLeistritz (1988). Expenditures from associated marketing efforts (i.e., United Sugars) wereexcluded from Bangsund and Leistritz (1993).d Adjusted using the Consumer Price Index (U.S. Department of Labor 1998).e Exact amount of sugarbeets processed was not available from Coon and Leistritz (1988).
The purpose of this study was to estimate the economic contribution of the sugarbeetindustry to the North Dakota and Minnesota economy in 1997. An economic contributionanalysis, as used in this study, represents in absolute terms an estimate of all relevant expendituresand their subsequent effects associated with an industry.
A sugarbeet production budget was developed to estimate costs of production and returnsfrom growing sugarbeets in the two states. The sugarbeet processing cooperatives and jointmarketing entities in Minnesota and North Dakota were surveyed to obtain in-state expenditures. Combined expenditures and returns from sugarbeet production and processing in North Dakota

16
and Minnesota were estimated at $831.1 million in fiscal 1997. The $831.1 million in directimpacts, based on input-output analysis, generated another $1.5 billion in secondary impacts. Thesugarbeet industry employed 2,486 full-time equivalent workers and, based on total businessactivity, supported an additional 30,436 full-time equivalent jobs in the two-state area. Totaleconomic activity (direct and secondary impacts) was estimated at $2.3 billion annually, including$846 million in economy-wide personal income and $680 million in annual retail sales. Also, thesugarbeet industry generated about $51 million in tax revenue, including tax collections of $16.4million in North Dakota and $34.6 million in Minnesota. About 36 percent of the economicimpacts were generated in North Dakota and 64 percent in Minnesota.
For every dollar the sugarbeet industry spent in North Dakota and Minnesota, $1.79 inadditional business activity was generated. Each acre of sugarbeets planted generated about$3,550 in total business activity (production, processing, and secondary impacts) or, expressedalternatively, each ton of sugarbeets processed generated about $198 in total business activity.
Examinations of previous studies of the economic contribution of the sugarbeet industryrevealed that the industry has experienced substantial real growth (inflation effects removed) in thelast decade. Since 1987, planted acreage and tons processed have increased 42 percent and 67percent, respectively. Correspondingly, in real terms, gross business volume generated by theindustry in North Dakota and Minnesota has increased 24 percent since 1992 and nearly 74percent since 1987.
The sugarbeet industry in Minnesota and North Dakota contributes substantially to thetwo-state economy. Not only was the dollar volume of business activity considerable, but mostprocessing plants are located in rural areas of the two states. Even though the sugarbeet industryhas processing plants located throughout the sugarbeet-growing area, the size of the sugarbeet-growing area suggests much of its economic activity affects local economies. Expenditures forcrop inputs and returns to growers, which represent a majority of the economic activity, areevenly distributed throughout the growing area. Substantial impacts in two major sectors of theeconomy, Households and Retail Trade, help to support this conclusion. In contrast, economicactivity in other sectors of the economy may represent a concentration of economic activity in oneor two major cities or with a few large firms (e.g., Communications and Public Utilities).
Although the sugarbeet industry in Minnesota and North Dakota is not large in terms ofacres or geographic area, if measured in terms of personal income, retail sales, total businessactivity, tax revenue collections, and employment (direct and secondary), its economiccontribution is highly apparent. The industry is an important and substantial contributor to bothlocal economies and the two-state economy.

17
REFERENCES
Bangsund, Dean A. and F. Larry Leistritz. 1998. Economic Contribution of the Barley Industryin North Dakota, South Dakota, and Minnesota. Agricultural Economics Report No. 391,Department of Agricultural Economics, North Dakota State University, Fargo.
Bangsund, Dean A. and F. Larry Leistritz. 1995. Economic Contribution of the Unites StatesSunflower Industry. Agricultural Economics Report No. 327, Department of AgriculturalEconomics, North Dakota State University, Fargo.
Bangsund, Dean A. and F. Larry Leistritz. 1993. Economic Contribution of the SugarbeetIndustry to the Economy of North Dakota and Minnesota. Agricultural EconomicsReport No. 305, Department of Agricultural Economics, North Dakota State University,Fargo.
Coon, Randal C. and F. Larry Leistritz. 1998. The State of North Dakota: Economic,Demographic, Public Service and Fiscal Conditions. Department of AgriculturalEconomics, North Dakota State University, Fargo.
Coon, Randal C. and F. Larry Leistritz. 1994. An Update of North Dakota’s Economic BaseData. Agricultural Economics Statistical Series No. 54, Department of AgriculturalEconomics, North Dakota State University, Fargo.
Coon, Randal C. and F. Larry Leistritz. 1988. The Economic Contribution of the SugarbeetIndustry of Eastern North Dakota and Minnesota. Agricultural Economics MiscellaneousReport No. 115, Agricultural Experiment Station, North Dakota State University, Fargo.
Coon, Randal C., Carlena F. Vocke, and F. Larry Leistritz. 1984. Expansion and Adaptation ofthe North Dakota Economic-Demographic Assessment Model (NEDAM) for Minnesota: Technical Description. Agricultural Economics Miscellaneous Report No. 76,Agricultural Experiment Station, North Dakota State University, Fargo.
Coon, Randal C., F. Larry Leistritz, Thor A. Hertsgaard, and Arlen G. Leholm. 1985. The NorthDakota Input-Output Model: A Tool for Analyzing Economic Linkages. AgriculturalEconomics Report No. 187, Agricultural Experiment Station, North Dakota StateUniversity, Fargo.
Leistritz, F. Larry and Steve H. Murdock. 1981. Socioeconomic Impact of ResourceDevelopment: Methods for Assessment. Westview Press, Boulder, CO.
Leistritz, F. Larry, Steve H. Murdock, and Randal C. Coon. 1990. “Developing Economic-Demographic Assessment Models for Substate Areas.” Impact Assessment Bulletin8(4):49-65.

18
Minnesota Agricultural Statistics Service. Various years. Minnesota Agricultural Statistics. Minnesota Agricultural Statistics Service, Minnesota Department of Agriculture and U.S.Department of Agriculture, St. Paul.
Minnesota and North Dakota Farm and Ranch Business Management. 1997. 1997 Red RiverValley Report. Minnesota Farm Business Management and North Dakota Farm andRanch Business Management, Bismarck, ND.
North Dakota Agricultural Statistics Service. Various years. North Dakota AgriculturalStatistics. North Dakota Agricultural Statistics Service, North Dakota State Universityand U.S. Department of Agriculture, Fargo.
Senf, Dave, Wilbur Maki, and James Houck. 1993. "Measuring the Size of Minnesota'sAgricultural Economy." Minnesota Agricultural Economist. No. 672, MinnesotaExtension Service, University of Minnesota, St. Paul.
U.S. Department of Commerce. 1994a. 1992 Census of Agriculture, Minnesota. Bureau of theCensus, U.S. Department of Commerce, Washington, D.C.
U.S. Department of Commerce. 1994b. 1992 Census of Agriculture, North Dakota. Bureau ofthe Census, U.S. Department of Commerce, Washington, D.C.
U.S. Department of Labor. 1998. Consumer Price Index (extracted from BLS web site). Bureauof Labor Statistics, U.S. Department of Labor, Washington, D.C.

APPENDIX AAPPENDIX A
Sugarbeet Production BudgetSugarbeet Production Budget

20
Blank page for duplicating.
21
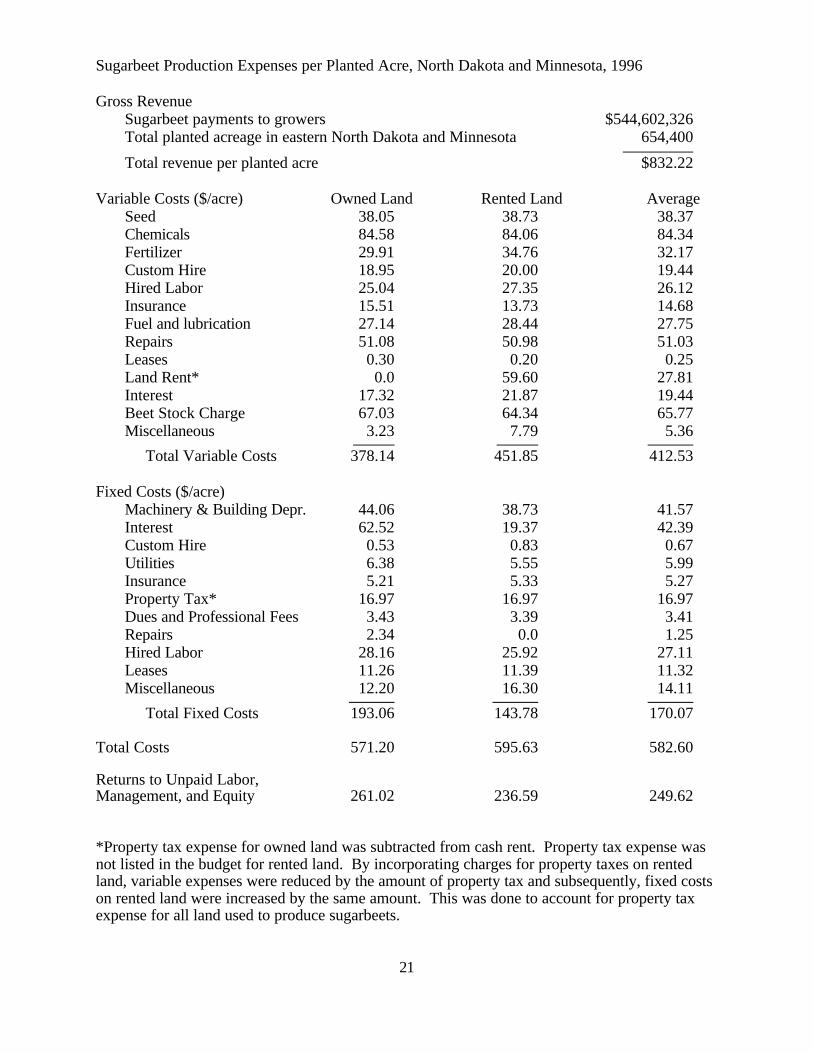
Sugarbeet Production Expenses per Planted Acre, North Dakota and Minnesota, 1996
Gross RevenueSugarbeet payments to growers $544,602,326Total planted acreage in eastern North Dakota and Minnesota 654,400 Total revenue per planted acre $832.22
Variable Costs ($/acre) Owned Land Rented Land AverageSeed 38.05 38.73 38.37Chemicals 84.58 84.06 84.34Fertilizer 29.91 34.76 32.17Custom Hire 18.95 20.00 19.44Hired Labor 25.04 27.35 26.12Insurance 15.51 13.73 14.68Fuel and lubrication 27.14 28.44 27.75Repairs 51.08 50.98 51.03Leases 0.30 0.20 0.25Land Rent* 0.0 59.60 27.81Interest 17.32 21.87 19.44Beet Stock Charge 67.03 64.34 65.77Miscellaneous 3.23 7.79 5.36 Total Variable Costs 378.14 451.85 412.53
Fixed Costs ($/acre)Machinery & Building Depr. 44.06 38.73 41.57Interest 62.52 19.37 42.39Custom Hire 0.53 0.83 0.67Utilities 6.38 5.55 5.99Insurance 5.21 5.33 5.27Property Tax* 16.97 16.97 16.97Dues and Professional Fees 3.43 3.39 3.41Repairs 2.34 0.0 1.25Hired Labor 28.16 25.92 27.11Leases 11.26 11.39 11.32Miscellaneous 12.20 16.30 14.11 Total Fixed Costs 193.06 143.78 170.07
Total Costs 571.20 595.63 582.60
Returns to Unpaid Labor,Management, and Equity 261.02 236.59 249.62
*Property tax expense for owned land was subtracted from cash rent. Property tax expense wasnot listed in the budget for rented land. By incorporating charges for property taxes on rentedland, variable expenses were reduced by the amount of property tax and subsequently, fixed costson rented land were increased by the same amount. This was done to account for property taxexpense for all land used to produce sugarbeets.

22
Budget Sources and General Composition
Expenses for sugarbeet production on owned land and rented land were obtained fromMinnesota and North Dakota Farm Business Management (1997). Expenses represented anaverage of production costs for sugarbeet production in the Red River Valley for both NorthDakota and Minnesota. Expenses for the Red River Valley were used for sugarbeet production insouth central Minnesota (Southern Minnesota Beet Sugar Cooperative acreage). Budgets forowned and rented land were averaged by the amount of owned-to-rented farmland in NorthDakota and Minnesota (U.S. Department of Commerce 1994a, 1994b). Per acre revenue wasdetermined by dividing total grower payments (sugarbeet payments and other payments) by totalplanted acreage.
APPENDIX BAPPENDIX B
Sugarbeet Processor Expenditures SurveySugarbeet Processor Expenditures Survey

24
Blank page for duplicating.

INSTRUCTIONS
Data provided from this survey will be used to estimate the contribution the
sugarbeet industry makes to the economies of North Dakota and Minnesota. All the
information you provide will be kept strictly confidential. The following general
instructions are suggested for completing the questionnaire.
1. Use information from the most recently completed fiscal year.
2. Information should be recorded in dollar terms.
3. Include information for all of the organization’s processing facilities on thisquestionnaire.
4. Include relevant information from all business ventures and othercooperative arrangements (United Sugars, Midwest Agri-Commodities,ProGold, others)
4. If you cannot identify whether expenditures were made to North Dakota orMinnesota entities, please indicate this on the form.
5. When exact information is not available, please estimate.
6. Definitions for selected expenditure items and their corresponding StandardIndustrial Classification (SIC) code listing are included to help indetermining allocation of expenditures.
7. If you have questions, please contact:
Dean Bangsund (701-231-7471 fax 701-231-7400)Larry Leistritz (701-231-7455)Department of Agricultural EconomicsNorth Dakota State UniversityFargo, ND 58105-5636

DEFINITIONS FOR EXPENDITURE ITEMS(According to the Standard Industrial Classification Manual)
Construction: Includes building construction--general contractors engaged inconstruction of residential, farm, industrial, public, and other buildings.(Major Groups 15, 16, and 17)
Transportation: Includes railroad, motor freight, water transportation, air transportation,pipeline transportation of petroleum, and other transportation to include packingand crating services, and rental of transportation equipment.(Major Groups 40, 41, 42, 43, 44, 45, 46, and 47)
Communications: Includes establishments engaged in telephone, telegraph, radio,television, and other communication services. (Major Group 48)
Public Utilities: Includes natural gas companies engaged in the transmission, storage, ordistribution of natural gas. Also, water supply and sanitary services are included.(Major Group 49 except Group 491)
Wholesale Trade: Includes establishments primarily engaged in selling merchandise toretailers; to industrial, commercial, institutional, or professional users; or to otherwholesalers, or acting as agents in buying merchandise for or selling merchandiseto such persons or companies.(Major Groups 50 and 51)
Retail Trade: Includes establishments engaged in selling merchandise for personal,household, or farm consumption, and rendering services incidental to the sale ofgoods. (Major Groups 52, 53, 54, 55, 56, 57, 58, and 59)
Finance, Insurance, and Real Estate: Includes institutions engaged in banking or otherfinancial institutions, insurance, and real estate.(Major Groups 60, 61, 62, 63, 64, 65, 66, and 67)
Business and Personal Services: Includes firms operating lodging services, repair,laundry, entertainment, other personal services predominantly to privateindividuals, credit collectional, janitorial, and stenographic services.(Major Groups 70, 72, 73, 75, 76, 78 and 79)
Professional and Social Services: Includes establishments engaged in furnishing health,medical, legal, educational, research and development, and other professionalservices. (Major Groups 80, 81, 82, 83, 84, 86, 88, and 89)

SUGARBEET PROCESSOR EXPENDITURES SURVEY
Cooperative:
Location:
I. Expenditures ( year).
Items For WhichExpenditures are Made
Estimated Annual Expenditure InNorth Dakota Minnesota
dollars
Payments to sugarbeet growers (sugarbeet production)
Other payments to sugarbeet growers (capital returns,etc.)
Contract construction
Plant maintenance and overhaul
Transportation
Communications
Public utilities
Miscellaneous manufacturing
Wholesale trade
Retail trade
Finance, insurance, and real estate
Business and personal services
Professional and social services
Coal
Electricity
Petroleum/natural gas
Wages and salaries
Benefits
Sugarbeet research funded
Government (taxes paid in ND and MN only)
Property taxes
Sales and use taxes

Workman's compensation
Unemployment
Other taxes (please specify)
Other Expenses (please specify)
II. Total annual revenue (from all ventures): $
III. Number of employees in full-time equivalents: full-time equivalent jobs
IV. Sugarbeets processed: tons
V. Sugarbeet acreage: acres planted acres harvested
VI. Comments: