Embed Size (px)
Citation preview
Economic contribution and payments to governments Report 2015

Our purpose is to create long-term shareholder value through the discovery, acquisition, development and marketing of natural resources.
Our strategy is to own and operate large, long-life, low-cost, expandable, upstream assets diversified by commodity, geography and market.
Our Values
Sustainability Putting health and safety first, being environmentally responsible and supporting our communities.
Integrity Doing what is right and doing what we say we will do.
Respect Embracing openness, trust, teamwork, diversity and relationships that are mutually beneficial.
Performance Achieving superior business results by stretching our capabilities.
Simplicity Focusing our efforts on the things that matter most.
Accountability Defining and accepting responsibility and delivering on our commitments.
We are successful when:
Our people start each day with a sense of purpose and end the day with a sense of accomplishment.
Our communities, customers and suppliers value their relationships with us.
Our asset portfolio is world-class and sustainably developed.
Our operational discipline and financial strength enables our future growth.
Our shareholders receive a superior return on their investment.
Andrew Mackenzie Chief Executive Officer
We are BHP Billiton, a leading global resources company.
Our Charter
BHP Billiton Limited. ABN 49 004 028 077. Registered in Australia. Registered office: 171 Collins Street, Melbourne, Victoria 3000, Australia. BHP Billiton Plc. Registration number 3196209. Registered in England and Wales. Registered office: Neathouse Place, London SW1V 1LH, United Kingdom. Each of BHP Billiton Limited and BHP Billiton Plc is a member of the BHP Billiton Group, which is headquartered in Australia. BHP Billiton is a Dual Listed Company structure comprising BHP Billiton Limited and BHP Billiton Plc. The two entities continue to exist as separate companies but operate as a combined Group known as BHP Billiton.
The headquarters of BHP Billiton Limited and the global headquarters of the combined BHP Billiton Group are located in Melbourne, Australia. BHP Billiton Plc is located in London, United Kingdom. Both companies have identical Boards of Directors and are run by a unified management team. Throughout this publication, the Boards are referred to collectively as the Board. Shareholders in each company have equivalent economic and voting rights in the BHP Billiton Group as a whole.
Contents Our Charter 1 Chief Financial Officer’s Introduction 12 2015 total payments to governments 23 Approach to transparency and tax 44 Operating Model and global value chain 65 Our broader contribution 96 Enhancing tax system effectiveness 127 Our payments to governments 148 Tax disclosed in our 2015 Financial Statements and reconciliation of taxes paid 209 Basis of report preparation 2110 Glossary 2311 Independent Auditor’s report 24Corporate Directory

Economic contribution and payments to governments Report 2015 1
1 Chief Financial Officer’s Introduction
I am pleased to introduce BHP Billiton’s Economic contribution and payments to governments Report for 2015. This inaugural Report is another important step in BHP Billiton’s ongoing leadership in transparency.
BHP Billiton has a strong commitment to demonstrating the highest standards of corporate governance and transparency. We began our journey of voluntarily disclosing our payments of taxes and royalties in 2000 when we first disclosed these payments in our annual Sustainability Report. Since then, we have progressively increased the detail of these annual disclosures in line with feedback from our key stakeholders.
This Report discloses the payments we have made to governments during the 2015 financial year on a country-by-country and project-by-project basis. This disclosure is voluntary as it is in advance of any regulatory requirement to do so in the jurisdictions in which we operate.
Our payments of taxes and royalties reflect the fact that governments bestow upon us the responsibility of converting their natural resource endowments into revenue streams. Through this, governments can provide their citizens with the services and infrastructure necessary to improve their citizens’ quality of life. In 2015, we paid US$7.3 billion globally in taxes, royalties and other payments to governments. For 2015, our global adjusted effective tax rate was 31.8 per cent. This is higher than the average corporate income tax rate of 25 per cent for Organisation for Economic Co-operation and Development (OECD) countries. For 2015, our global effective income tax and royalties paid rate is in excess of 45 per cent.
Payments of taxes and royalties are one element of our broader economic and social contribution. In 2015, our total economic contribution was US$35.7 billion, which included payments to suppliers, wages and employee benefits, dividends, taxes and royalties. This includes the voluntary contribution we make to our host communities. In 2015, we invested US$225 million in communities. It also includes the returns we generate for our shareholders and investors. In 2015, we contributed US$6.6 billion to our shareholders by way of dividend.
At a time of subdued global growth and declining commodity prices, tax and broader economic policy is rightly a major subject of discussion in many jurisdictions. This Report aims to contribute to these discussions by explaining our Operating Model and our views on the principles that should underpin effective taxation system design and mandatory disclosure regimes.
BHP Billiton was a founding supporter of the Extractive Industries Transparency Initiative (EITI) in 2002 and an early adopter of best practice in disclosure and transparency. BHP Billiton is committed to being a leader in further enhancing disclosure and transparency. For example, we support the establishment of a globally consistent disclosure framework that includes formal equivalency agreements between jurisdictions.
We look forward to discussing this Report with our stakeholders around the world and continuing our leadership role in this critically important area.
Peter Beaven Chief Financial Officer
US$7.3 billionTotal payments to governments
US$35.7 billionTotal economic contribution

2 Economic contribution and payments to governments Report 2015
2 2015 total payments to governments
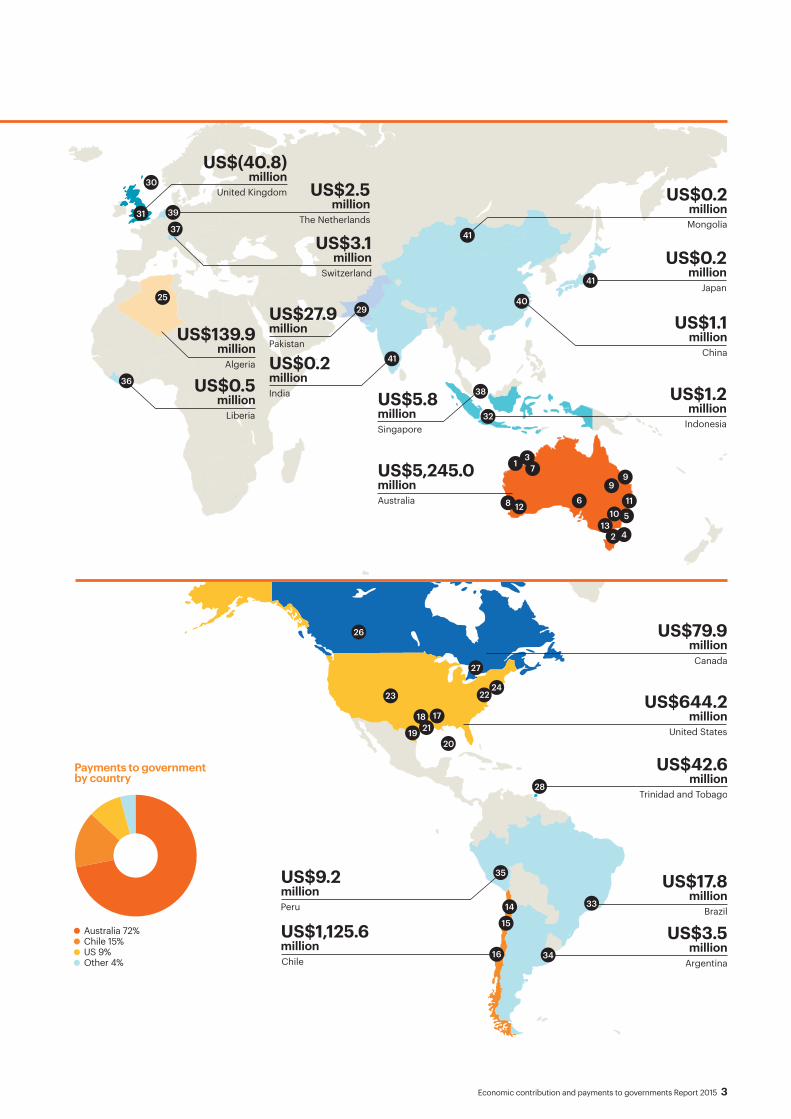
BHP Billiton pays taxes, royalties and other payments in accordance with the tax regulations and laws applying in the jurisdictions in which we operate. This section outlines our payments to governments by country in 2015.
Ref Business Projects Description
Australia1 Petroleum and Potash North West Shelf Joint interest offshore oil and gas fields in Western Australia
5,245.0
2 Petroleum and Potash Bass Strait Joint interest offshore oil and gas fields in Victoria3 Petroleum and Potash Australia Production Unit –
Western AustraliaOperated offshore oil and onshore gas processing facilities in Western Australia
4 Petroleum and Potash Australia Production Unit – Victoria Operated offshore oil and onshore gas processing facilities in Victoria5 Petroleum and Potash Head Office entities Petroleum and Potash Head Office entities in Australia6 Copper Olympic Dam Underground mine and processing, smelting and refining facilities
producing copper cathode, uranium oxide, gold and silver7 Iron Ore Western Australia Iron Ore Integrated iron ore mines, rail and port operations in the Pilbara region
of Western Australia8 Iron Ore Head Office entities Iron Ore Head Office entities in Australia9 Coal Queensland Coal BHP Billiton Mitsubishi Alliance – Open-cut and underground metallurgical
coal mines in the Bowen Basin and the Hay Point Coal terminal, QueenslandBHP Billiton Mitsui Coal – Two open-cut metallurgical coal mines in the Bowen Basin, Central Queensland
10 Coal New South Wales Energy Coal Open-cut energy coal mine and preparation plant in New South Wales11 Coal Head Office entities Coal Head Office entities in Australia12 Group and Unallocated Nickel West Integrated sulphide mining, concentrating, smelting and refining operation
in Western Australia13 Group and Unallocated Corporate Head Office Corporate Head Office entities in AustraliaChile14 Copper Escondida Open-cut mine and processing facilities, producing copper concentrate
and copper cathode, located in northern Chile 1,125.6 15 Copper Pampa Norte Two open-cut mines, producing copper cathode in northern Chile
16 Copper Head Office entities Copper Head Office entities in ChileUnited States17 Petroleum and Potash Onshore US (Fayetteville) Onshore shale liquids and gas fields in Arkansas
644.2
18 Petroleum and Potash Onshore US (Haynesville) Onshore shale liquids and gas fields in Louisiana19 Petroleum and Potash Onshore US (Permian Basin, Eagle Ford) Onshore shale liquids and gas fields in Texas20 Petroleum and Potash Gulf of Mexico Offshore oil and gas fields in the Gulf of Mexico21 Petroleum and Potash Head Office entities Petroleum and Potash Head Office entities in the United States22 Copper Head Office entities Copper Head Office entities in the United States23 Coal New Mexico Coal Energy coal mine in New Mexico24 Group and Unallocated Corporate Head Office Corporate Head Office entities in the United StatesAlgeria25 Petroleum and Potash Algeria Joint Interest Unit Joint interest onshore oil and gas unit 139.9 Canada26 Petroleum and Potash Potash Jansen Potash Project
79.9 27 Copper Head Office entities Copper Head Office entities in CanadaTrinidad and Tobago28 Petroleum and Potash Trinidad and Tobago Production Unit Operated offshore oil and gas fields 42.6Pakistan29 Petroleum and Potash Pakistan Production Unit Operated onshore oil and gas fields 27.9 United Kingdom30 Petroleum and Potash United Kingdom Production Unit Operated offshore oil and gas fields
(40.8) (2)
31 Group and Unallocated Corporate Head Office Corporate Head Office entities in the United KingdomIndonesia32 Coal IndoMet Seven coal contracts of work covering a large metallurgical coal resource 1.2 Other33 Petroleum and Potash;
Iron OreHead Office entities Petroleum and Potash and Iron Ore Head Office entities for Businesses
located in Brazil 17.8
34 Petroleum and Potash Head Office entities Petroleum Head Office entities in Argentina 3.5 35 Copper Head Office entities Copper Head Office entities in Peru 9.2 36 Iron Ore Head Office entities Iron Ore Head Office entities in Liberia 0.5 37 Group and Unallocated Marketing and Corporate Head Offices Marketing and Corporate Head Offices for activities in Switzerland 3.1 38 Group and Unallocated Marketing and Corporate Head Offices Marketing and Corporate Head Offices for activities in Singapore 5.8 39 Group and Unallocated Marketing and Corporate Head Offices Marketing and Corporate Head Offices for activities in The Netherlands 2.540 Group and Unallocated Marketing and Corporate Head Offices Marketing and Corporate Head Offices for activities in China 1.1 41 Group and Unallocated Marketing and Corporate Head Offices Marketing and Corporate Head Offices for activities in India, Japan and Mongolia 0.6 Total 7,309.6
(1) Payments to governments have been prepared on the basis set out in section 9 ‘Basis of report preparation’.(2) The negative US$40.8 million includes refunds received in FY2015 in respect of Petroleum Revenue Tax (PRT) paid in FY2014 (US$3.7 million), and corporate income
taxes paid in FY2012 (US$41.8 million). Corporate income tax and PRT paid in respect of FY2014, FY2013 and FY2012 (excluding refunds received in FY2015) was US$13.9 million, US$119.2 million, and US$102.5 million respectively.
Payments to governments
(US$M) (1)
Economic contribution and payments to governments Report 2015 3
2
5
413
10116
3
99
128
71
29
41
37
39
38
32
40
41
41
25
36
30
31
Algeria
United Kingdom
Switzerland
Australia
Singapore
Pakistan
US$5,245.0million
US$5.8million
US$27.9million
India
US$0.2million
US$3.1 million
US$(40.8) million
US$139.9 million
Liberia
US$0.5 million
Japan
US$0.2 million
The Netherlands
US$2.5 million
Indonesia
US$1.2million
China
US$1.1 million
Mongolia
US$0.2 million
Chile
US$1,125.6million
17
22
182119
28
14 33
34
35
20
15
16
26
27
2324
United States
US$644.2 million
Canada
US$79.9 million
Trinidad and Tobago
US$42.6 million
Peru
US$9.2million
Brazil
US$17.8 million
Argentina
US$3.5 million
Australia 72%Chile 15%US 9%Other 4%
Payments to government by country

4 Economic contribution and payments to governments Report 2015
3.1 Overview
BHP Billiton Transparency Principles
Corruption directly impedes development, denying millions of people around the world their rights to the education and training necessary to earn a livelihood, to basic health services and to the essential infrastructure to improve their lives.
Good governance of natural resource wealth for the benefit of a country’s citizens is the domain of sovereign governments, to be exercised in the interests of their national development and on behalf of their citizens. We believe that transparency around revenue flows from the extraction of natural resources is an important element in the fight against corruption. To this end, BHP Billiton has been a supporter of the Extractive Industries Transparency Initiative (EITI) since its inception in 2002.
A level playing field will ensure all companies disclose on the same basis and reduce the reporting burden for those operating in multiple jurisdictions. To this end, appropriate national and extra-territorial mandatory corporate reporting should complement EITI and provide a globally consistent regulatory framework for all extractive industry companies.
Principles Responsibility Governments, civil society and the corporate sector must work in partnership to support transparency and help fight corruption. We are committed to acting transparently and publicly reporting the payments we make to governments.
Openness Transparency is in the best interest of our shareholders, employees, contractors, partners, customers and the communities and societies in which we operate, and is essential to good governance and responsible investment.
Fairness Nations that share resource wealth and are accountable to their communities have the potential to attract greater, more responsible and longer-term investment. Ensuring our host communities share in our success is critical to the long-term future of our business.
Accessibility Revenue transparency information must be meaningful, practical and presented in a form that is easily captured, reported and understood. Governments, corporations and civil society organisations all have important roles to play in ensuring communities have the capacity to analyse and effectively interpret the information provided.
3 Approach to transparency and tax
The scale and long-term nature of our operations enables us to make a significant and long-term economic contribution to the countries in which we operate. We support local and national economies through the payment of taxes and royalties to our host governments, as well as through the creation of direct and indirect jobs, and the purchase of goods and services. It follows that we must act responsibly, including in relation to our tax affairs, in order to be able to provide our host communities with the best opportunity to prosper.
Communities should have a clear understanding about the revenue gained by their governments from the extraction of natural resources and how this is allocated in their country’s economic and social development. When companies provide transparent information about revenue, the potential for corruption is reduced. Countries that transparently and effectively allocate natural resource wealth for the benefit of their communities have the potential to attract greater, more responsible and longer-term business investment. It is imperative that businesses, governments and civil society work in partnership to support transparency.
Our Transparency Principles guide our approach to transparency and disclosure initiatives.

Economic contribution and payments to governments Report 2015 5
2000BHP discloses aggregate global payments of taxes and royalties.
2005BHP Billitondiscloses aggregate payments of taxes and royalties by global geographic regions.
2010BHP Billiton discloses payments of taxes and royalties to host governments at a national level.
Discloses taxes and royalty payments on a country-by-country basis.
2011 BHP Billiton discloses taxes borne and taxes collected on a country-by-country basis.
2012–2014 BHP Billiton discloses taxes borne and taxes collected on a country-by-country basis with the listing of o�ices/assets in those countries.
2015BHP Billiton discloses payments of taxes, royalties and other payments to governments at a sub-national level and on a project-by-project basis.
Our increasing transparency disclosure
3 Approach to transparency and tax
BHP Billiton’s transparency journey
In 2000, we first disclosed our aggregate payments of taxes and royalties. Since then, our level of disclosure in relation to payments to governments has continued to increase. BHP Billiton has been a member of the Extractive Industries Transparency Initiative (EITI) since its inception in 2002. The EITI provides a global standard to promote open and accountable management of natural resources and ensures disclosure of taxes, royalties and other indirect tax payments made by oil, gas and mining companies to governments, in an annual report submitted to EITI. BHP Billiton is a direct participant in the EITI multi-stakeholder groups developing models for potential EITI implementation in Australia and the United States.
3.2 Our transparency journey
3.3 BHP Billiton’s approach to taxIn 2015, there has been increased government and media interest about the use of ‘tax havens’ by global companies. Given the scale, locality and complexity of operating globally in extractive industries, there can be operational and commercial reasons (such as proximity to customers, regulatory regimes and structures acquired in historical acquisitions) for subsidiaries being tax resident in countries with low tax rates.
Our global company structure (refer section 4.1 ‘BHP Billiton Operating Model’) means that all foreign subsidiaries within the Group are controlled foreign companies of either BHP Billiton Limited or BHP Billiton Plc. This means that, in addition to the local country tax rules, they also come within the scope of the international and anti-avoidance tax rules applying in Australia or the United Kingdom to prevent multinational companies from obtaining inappropriate tax advantages by operating through low rate jurisdictions.
Our approach to tax is underpinned by Our BHP Billiton Charter values, including accountability and integrity.
As a global company with operations in many countries, we are subject to multiple and, at times, complex tax regimes. Regardless of where we operate, we meet our tax and royalty obligations in accordance with the laws of each jurisdiction. We do not engage in aggressive tax planning strategies. Rather, when we seek to invest, we consider a range of different factors and scenarios to ensure we comply with all necessary obligations and provide strong returns to our shareholders. At all times we seek to have transparent and cooperative relationships with tax authorities in the countries in which we operate.
In 2014, BHP Billiton was ranked the most transparent mining company and fourth overall in the world in the 2014 Transparency in Corporate Reporting (TRAC) report compiled by international non-government organisation Transparency International. The TRAC report evaluates the transparency of corporate reporting by the world’s 124 largest publicly listed companies and assesses the disclosure practices of companies with respect to their anti-corruption programs, company holdings and key financial information.
We take an active role in contributing to transparency initiatives and work with governments and other stakeholders to develop further reform. For further information, refer to section 6 ‘Enhancing tax system effectiveness’.

6 Economic contribution and payments to governments Report 2015
MarketingBusiness
Exploration and evaluationDiscovery through exploration, evaluating our portfolio and divestment and acquisition.
Undertake and evaluate the results of brownfield and greenfield exploration to identify future growth projects consistent with our strategy.
Develop the Company-wide view of markets and guide potential future growth projects, acquisitions and divestments.
DevelopmentEvaluating and developing projects.
Assess feasibility and execute projects to sustain and grow our business.
Support the Businesses to maximise value through analysis of commodity market demand and outlook.
Extraction, processing and transportationOpen-pit and underground mining, extracting conventional and unconventional oil and gas, processing and refining.
Safely operate our assets to produce commodities to market through mining, extracting, processing and transporting commodities.
Provide the Businesses with information on product demand and customer specifications to maximise productivity and reduce operational costs.
Marketing and logisticsManage the sales and global supply of our commodities to customers.
Ensure commodities meet Marketing’s specification and are delivered to the customers’ schedule.
Develop strong integrated relationships between BHP Billiton and customers. Responsible for the sale of the Company’s products. Manages the global logistics of transporting product from our operations to customers.
OPE
RATI
ON
SG
ROU
P FUN
CTIO
NS
support Marketing and Businesses
4.1 BHP Billiton Operating Model
4 Operating Model and global value chain
Our strategy is to own and operate, large, long-life, low-cost, expandable, upstream assets diversified by commodity, geography and market. We are among the world’s top producers of major commodities including iron ore, metallurgical coal, copper and uranium, and have substantial interests in conventional and unconventional oil and gas, energy coal and nickel. We employ a workforce of approximately 80,000 employees and contractors.
BHP Billiton operates under a Dual Listed Company structure, with two parent companies BHP Billiton Limited and BHP Billiton Plc operating as a single economic entity, run by a unified Board and management team. BHP Billiton Limited has a primary listing on the Australian Securities Exchange in Australia. BHP Billiton Plc has a premium listing on the UK Listing Authority’s Official List and its ordinary shares are admitted to trading on the London Stock Exchange in the United Kingdom. It also has a secondary listing on the Johannesburg Stock Exchange in South Africa. In addition, BHP Billiton Limited American Depositary Receipts (ADRs) and BHP Billiton Plc ADRs trade on the New York Stock Exchange in the United States.
To deliver our strategy our Operating Model is designed to deliver a simple, scalable and productive organisation.
Our Operating Model organises and sets out relationships and accountabilities into four Businesses (Petroleum and Potash, Copper, Iron Ore, and Coal), Group Functions and a centralised Marketing organisation. These dedicated organisational units ensure that we apply specialist knowledge and expertise to each activity within the BHP Billiton global value chain and locate these core units closest to their main activities (refer to map on page 7). Our Businesses are focused on the safe and productive extraction of resources. Our Marketing operations are focused on achieving the best price for our commodities.
BHP Billiton makes significant investments throughout each phase of the value chain. During each phase, we are faced with a range of financial, technical, operating and market risks in exploring, developing and operating our assets.
How we operateThe table below outlines the activities of our Businesses (left hand side) and our Marketing operations (right hand side) at each phase of the value chain, as supported by Group Functions.
Economic contribution and payments to governments Report 2015 7
Petroleum Head O�iceMarketing O�ice
Houston
Jansen Potash Project
Saskatoon
Copper Head O�ice
SantiagoGlobal Headquarters
Melbourne
Coal Head O�ice
Marketing Head O�iceGroup Function O�ice
Iron Ore Head O�ice
Location of major customers
Group Function O�ice
Brisbane
Perth
London
Singapore
Corporate o�ice
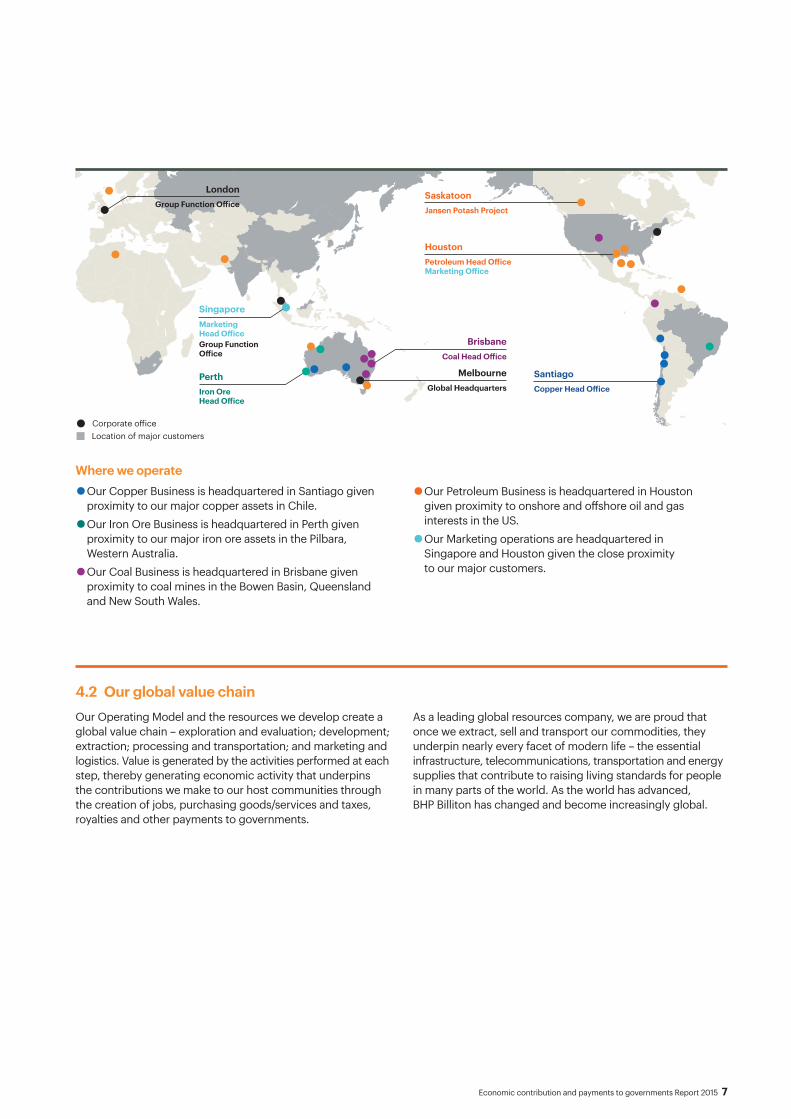
Where we operate
• Our Copper Business is headquartered in Santiago given proximity to our major copper assets in Chile.
• Our Iron Ore Business is headquartered in Perth given proximity to our major iron ore assets in the Pilbara, Western Australia.
• Our Coal Business is headquartered in Brisbane given proximity to coal mines in the Bowen Basin, Queensland and New South Wales.
• Our Petroleum Business is headquartered in Houston given proximity to onshore and offshore oil and gas interests in the US.
• Our Marketing operations are headquartered in Singapore and Houston given the close proximity to our major customers.
4.2 Our global value chainAs a leading global resources company, we are proud that once we extract, sell and transport our commodities, they underpin nearly every facet of modern life – the essential infrastructure, telecommunications, transportation and energy supplies that contribute to raising living standards for people in many parts of the world. As the world has advanced, BHP Billiton has changed and become increasingly global.
Our Operating Model and the resources we develop create a global value chain – exploration and evaluation; development; extraction; processing and transportation; and marketing and logistics. Value is generated by the activities performed at each step, thereby generating economic activity that underpins the contributions we make to our host communities through the creation of jobs, purchasing goods/services and taxes, royalties and other payments to governments.

8 Economic contribution and payments to governments Report 2015
Evaluation and exploration Development
Extraction,processing andtransportation
Chile
Marketing and logistics
Singapore Korea
Convert
World
Sell computer
Taiwan
Design Build
BHP Billiton Smelter Worldwidemarket
Computer andcomponents assembly
Operations
4 Operating model and global value chain continued
BHP Billiton Marketing Operations
To ensure close proximity to our major customers, the primary location for our marketing activities is Singapore, while marketing of our oil and gas is headquartered in Houston, United States.
Our marketing operations add value by making a significant contribution at each step of the value chain – from the initial step of exploration and evaluation (our marketing operations develop a Company-wide view of markets and guide potential future growth products) to the final step of selling the products (our marketing operations are responsible for obtaining the best price for our products by developing strong integrated relationships with our customers). Further details are contained in the table ‘How we operate’ in section 4.1.
StructureBHP Billiton Marketing AG (BMAG) is BHP Billiton’s principal marketing entity operating in Singapore. It is owned 58 per cent by BHP Billiton Limited and 42 per cent by BHP Billiton Plc, reflecting the relative value of BHP Limited and Billiton Plc at the time the dual listed structure was created. BHP Billiton entities around the world sell commodities to BMAG at arm’s length prices which are determined consistent with OECD principles and the transfer pricing laws of the countries in which we operate.
Singapore tax incentiveBMAG has been granted a tax incentive by the Government of Singapore for its contribution to the development of Singapore’s commodity sector. In 2015, all of BMAG’s income in Singapore was eligible for the tax incentive.
Australian taxation treatmentAll of the profits which BHP Billiton generates in Australia from the production and processing of Australian commodities are subject to Australian tax at the corporate tax rate of 30 per cent.
In 2015, BMAG generated US$646 million in profits in Singapore. (1) These profits were mostly from the on-sale of Australian-sourced commodities. A substantial proportion of the profits earned by BMAG relating to Australian commodities is subject to Australian tax. In particular, BHP Billiton pays tax in Australia under the Australian Controlled Foreign Companies Rules on 58 per cent of the profits which BMAG earns in Singapore from the on-sale of commodities acquired from Australian entities controlled by BHP Billiton Limited. This ‘top-up tax’ is in addition to the tax we pay in Australia on 100 per cent of the profits from the production of Australian commodities. The other 42 per cent of BMAG’s Singapore profits belong to BHP Billiton Plc reflecting our dual listed structure.(1) This excludes profits referable to commodities produced by entities
which were demerged to form South32.
Below is an illustration of this broader value chain as it relates to the conversion of copper from our operations in Chile, into a computer ultimately purchased by consumers throughout the world. On a worldwide basis, economic value creation will be maximised when each part of the value chain is carried out in the most efficient and cost effective location. These locations will tend to differ for each part of the value chain as individual locations have competitive advantages over the other for these activities. This maximises the efficiency of the use of resources on a global basis. Throughout each phase of the broader value chain, taxes and other relevant payments are generally made to each host government in which that part of the value chain is undertaken. In addition, companies also purchase local goods and services and provide employment opportunities at each stage of the value chain. In this way, activities associated with each part of the value chain deliver economic contribution to local and national economies. Sound commercial and economic policy settings are key criteria for companies in determining where value chain activities take place.

Economic contribution and payments to governments Report 2015 9
Community
Evaluation and exploration
Development
Extraction,processing andtransportation
Marketing and logistics
Community contribution (2)
US$225m
Total economic contribution (1)
US$35.7b
Income taxesRoyalty-relatedincome taxesRoyaltiesOther payments to governments
Total payments to governments
US$7.3b
Government
Suppliers
US$16.1b
Employees
US$4.9b
Shareholders and investors
US$7.2b (3)
5 Our broader contribution
The contribution we make to the communities in which we operate extends beyond taxes, royalties and other payments to governments. Our commodities support economic development and contribute to improved living standards. Through employment, taxes and royalties, we support local, regional and national economies. Where possible, we purchase local goods and services and develop infrastructure that benefits entire communities.
Through our engagement with communities, we identify social needs and existing resources on which we can build through our own voluntary social investment. This has resulted in a wide range of positive outcomes for the communities in which we operate.
The diagram below illustrates BHP Billiton’s global value chain and the total economic contribution our Company makes to communities around the world. In 2015, this amounted to US$35.7 billion.
BHP Billiton’s global value chain (1)
(1) The total economic contributions made during the financial year ended 30 June 2015 of US$35.7 billion is determined by combining total payments to governments of US$7.3 billion (determined on a cash paid basis), payments to suppliers of US$16.1 billion, employee expenses of US$4.9 billion, distributions to shareholders and investors of US$7.2 billion (determined on an accruals basis) and community contribution of US$225 million.
(2) Community contribution includes cash, and in-kind support transferred directly to communities and administrative costs (US$142 million) and funds transferred to BHP Billiton Foundation for which communities are the future beneficiaries (US$83 million). Includes payments made by equity accounted investments and operations demerged to form South32.
(3) Shareholders and investors includes US$6.6 billion of dividends attributable to members of the BHP Billiton Group and US$0.6 billion of interest expense.
10 Economic contribution and payments to governments Report 2015
US$ million
2
4
6
8
10
12
14
0
FY20
11
FY20
12
FY20
13
FY20
14
FY20
15
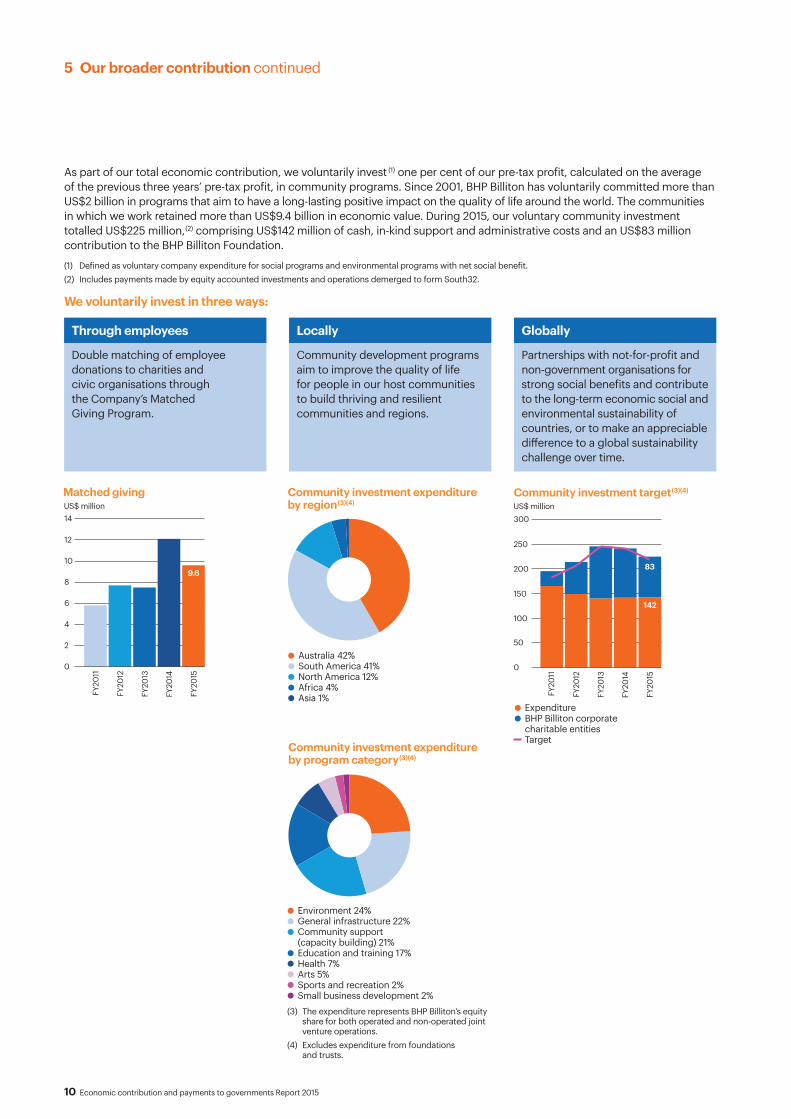
9.6
Matched giving
300
250
200
150
50
100
0
FY20
12
FY20
11
FY20
13
FY20
14
FY20
15
142
83
US$ millionCommunity investment target(3)(4)
ExpenditureBHP Billiton corporate charitable entitiesTarget
Environment 24%General infrastructure 22%Community support (capacity building) 21%Education and training 17%Health 7%Arts 5%Sports and recreation 2%Small business development 2%
Community investment expenditure by program category(3)(4)
Australia 42%South America 41%North America 12%Africa 4%Asia 1%
Community investment expenditure by region(3)(4)
5 Our broader contribution continued
As part of our total economic contribution, we voluntarily invest (1) one per cent of our pre-tax profit, calculated on the average of the previous three years’ pre-tax profit, in community programs. Since 2001, BHP Billiton has voluntarily committed more than US$2 billion in programs that aim to have a long-lasting positive impact on the quality of life around the world. The communities in which we work retained more than US$9.4 billion in economic value. During 2015, our voluntary community investment totalled US$225 million, (2) comprising US$142 million of cash, in-kind support and administrative costs and an US$83 million contribution to the BHP Billiton Foundation.
(1) Defined as voluntary company expenditure for social programs and environmental programs with net social benefit. (2) Includes payments made by equity accounted investments and operations demerged to form South32.
We voluntarily invest in three ways:
Through employees Locally Globally
Double matching of employee donations to charities and civic organisations through the Company’s Matched Giving Program.
Community development programs aim to improve the quality of life for people in our host communities to build thriving and resilient communities and regions.
Partnerships with not-for-profit and non-government organisations for strong social benefits and contribute to the long-term economic social and environmental sustainability of countries, or to make an appreciable difference to a global sustainability challenge over time.
(3) The expenditure represents BHP Billiton’s equity share for both operated and non-operated joint venture operations.
(4) Excludes expenditure from foundations and trusts.

Economic contribution and payments to governments Report 2015 11
Regional and national 54%Local 42%External to home country 4%
Distribution of supply expenditure
Local spend refers to spend within the communities in which we operate. Regional and national spend refers to spend within the regions, such as states and provinces, and the home country of operation, excluding local spend.
CASE STUDY
Improving health in communities
Our investments in community health aim to improve the quality of, and access to, general medical care. Where a high prevalence of diseases exists in our areas of activity, we facilitate control programs that are offered to our employees and to our host communities. These initiatives range from a project to help maternal and child health in South Africa and Mozambique, to the refurbishment of a hospital emergency department in regional Australia.
Through BHP Billiton Sustainable Communities, our UK-based charity, we invested more than US$35 million in community health partnerships. This included a US$10 million contribution to The Global Fund to Fight AIDS, Tuberculosis and Malaria to support the Mozambique Government’s five-year malaria prevention program. It also included a US$25 million contribution to a five-year partnership with health organisation, PATH, to support the Window of Opportunity project to improve maternal and child health and development in five districts in South Africa and Mozambique.
BHP Billiton Sustainable Communities contributed A$2.5 million to the refurbishment project of the Muswellbrook Hospital, in New South Wales, Australia, which opened in April 2015. The project, in partnership with Hunter New England Health, includes a new, state-of-the-art emergency department featuring additional beds and clinical treatment areas, improved visitor and staff facilities and new ambulance bays. It also incorporates the latest digital and telehealth technology to link Muswellbrook with specialists and clinicians at other hospitals, to enable them to provide real-time specialist healthcare, advice and assistance to staff treating critically ill patients.
Further information on our other community contribution initiatives is available online at www.bhpbilliton.com/casestudies.
Supporting local businessesDue to the size and scale of our operations, we require a range of products and services to enable our Businesses to operate effectively at the local level. Where our requirements can be met, we choose to source these products and services locally from our host communities, benefitting our local suppliers and our local communities. In 2013, we set a target for all our assets to have local procurement plans. This was achieved in 2015. Our assets have also made progress to meet the specific targets included within their local procurement plans.
In 2015, 42 per cent of our Company’s spend was with local suppliers, with the largest local spends made by operations in the United States and Australia, 46 per cent and 31 per cent, respectively. An additional 54 per cent of our spend was within the regions in which we operate.

12 Economic contribution and payments to governments Report 2015
6 Enhancing tax system effectiveness
6.1 BHP Billiton’s perspective on mandatory disclosure BHP Billiton supports the establishment of a globally consistent regulatory disclosure framework, including equivalency provisions between jurisdictions. This would create a consistent basis for companies to disclose payments to governments, minimise compliance costs and facilitate ease of comparison between jurisdictions, regardless of the country of operation or industry.While there has been development of mandatory disclosure initiatives in a number of jurisdictions in recent years, BHP Billiton is concerned by the considerable policy uncertainty that remains as to whether a globally consistent disclosure framework will ultimately emerge to allow for equivalency provisions across jurisdictions. Four such initiatives relevant to BHP Billiton include:• In Europe, the European Union Accounting Directive
was approved by the European Union (EU) in 2013. The Directive requires EU member states to implement legislation, at the latest for financial years commencing on or after 1 January 2016. Under the UK implementing legislation, companies will be required to disclose reports on payments to governments covering financial years commencing on or after 1 January 2015.
• In the United States, in 2011 the Securities and Exchange Commission (SEC) approved rules requiring US-listed producers of minerals, oil and natural gas to disclose certain payments made to governments on a project-by-project basis. In July 2013, the US District Court for the District of Columbia issued an opinion vacating the rules, which the SEC adopted under the Dodd Frank Act. The SEC is currently redrafting the rules, with new rules expected to be released in 2016.
• In Canada, the Extractive Sector Transparency Measures Act was proclaimed in June 2015 and establishes new reporting standards for Canadian oil, gas and mining companies.
• In Australia, in May 2015, it was announced that the Board of Taxation has been tasked with developing a voluntary Corporate Disclosure Code.
It is in the interests of all stakeholders that a globally consistent disclosure framework emerges from these multiple initiatives. To this end BHP Billiton will continue to engage with governments and regulators in relevant jurisdictions.
As an example of BHP Billiton’s commitment to these initiatives, we have prepared this Report taking into account the intent of the EU Accounting Directive and would be supportive of a globally consistent mandatory disclosure regime based on this Directive.

Economic contribution and payments to governments Report 2015 13
Tax policy settings have a critical impact on economic outcomes. In this context, we believe the following principles should underpin the design of effective, efficient and competitive taxation systems:
Competitiveness The tax system should support international competitiveness in order to ensure that returns from growth and development opportunities are sufficient to attract the required global investment capital.
Efficiency Tax regulations should minimise impediments to activities that generate economic growth such as investment, innovation and saving.
SimplicityTax regulations should minimise the administrative burden for business, uncertainty of interpretation and, in so doing, promote more effective and voluntary compliance.
StabilityGovernments should promote stability by pursuing necessary changes through a coherent program of reform that is underpinned by a rigorous analysis of the problem, effective consultation and a thorough implementation plan.
SustainabilityTax regulations should be fair and be capable of adapting to economic, technological and other global developments.
ConfidenceThe public must be confident that the tax system is transparent, has integrity and delivers outcomes that support economic growth and sustainable revenue flows.
BHP Billiton supports multilateral efforts to develop effective global approaches to taxation reform through the Base Erosion and Profit Shifting (BEPS) Action Plan being pursued by the OECD and supported by the G20. We believe this is the best way to combat the risk of double taxation and business uncertainty, which is inherent in unilateral actions. In addition, it is critical that unilateral action does not act as an impediment to cross-border trade and investment, thereby placing further pressure on economic growth.
In assessing the merits of proposed actions to address BEPS, BHP Billiton believes the following should apply:• Tax should be levied in the jurisdiction where the value
creating activity is carried out.• Efforts to increase tax transparency through enhanced
reporting should be easy to comply with and simple to report and understand.
• Efforts to address BEPS should be internationally coordinated to avoid the possibility of both double taxation and non-taxation.
• New corporate tax measures should be prospective in their application.
• Companies should not be penalised for responding to national and international tax regimes put in place by governments with the aim of fostering local economic growth.
We are committed to working constructively with relevant governments and other stakeholders in relation to tax reform.
6.2 Global taxation reform

14 Economic contribution and payments to governments Report 2015
Taxes paid by classification and country are presented in this section and have been prepared on the basis set out in section 9 ‘Basis of report preparation’ of this Report.
US$ millions
Corporate income
taxesRoyalty-related
income taxes
Taxes levied on
productionTotal
taxes paid RoyaltiesProduction
entitlements Fees
Payments for infrastructure
improvements
Total payments as defined by the EU
Accounting Directive Other paymentsTotal payments
to governments Taxes collected (2)
Total payments to governments 2,877.0 1,148.1 282.4 4,307.5 2,257.9 178.6 111.0 61.9 6,916.9 392.7 7,309.6 1,426.3
Algeria – – – – – 139.9 – – 139.9 – 139.9 –Government of Algeria – – – – – 139.9 – – 139.9 – 139.9 <1
Argentina 3.5 – – 3.5 – – – – 3.5 – 3.5 –Government of Argentina 3.5 – – 3.5 – – – – 3.5 – 3.5 –
Australia 1,931.2 1,012.9 81.2 3,025.3 1,933.2 – 28.7 – 4,987.2 257.8 5,245.0 1,052.5Government of Australia 1,931.2 1,012.9 81.2 3,025.3 182.4 – 0.9 – 3,208.6 35.4 3,244.0 1,052.5State of Western Australia – – – – 1,137.6 – 10.6 – 1,148.2 110.3 1,258.5 –Town of Port Hedland (Western Australia) – – – – – – 0.5 – 0.5 3.7 4.2 –Shire of East Pilbara (Western Australia) – – – – – – – – – 3.4 3.4 –Shire of Ashburton (Western Australia) – – – – – – 1.3 – 1.3 0.5 1.8 –Shire of Wiluna (Western Australia) – – – – – – – – – 0.8 0.8 –Shire of Leonara (Western Australia) – – – – – – – – – 0.8 0.8 –City of Kalgoorlie-Boulder (Western Australia) – – – – – – – – – 0.2 0.2 –Shire of Meekatharra (Western Australia) – – – – – – – – – 0.1 0.1 –City of Rockingham (Western Australia) – – – – – – – – – 0.1 0.1 –State of Queensland – – – – 479.7 – 11.2 – 490.9 43.6 534.5 –Isaac Regional Council (Queensland) – – – – – – – – – 14.9 14.9 –Central Highlands Regional Council (Queensland) – – – – – – – – – 6.7 6.7 –Mackay Regional Council (Queensland) – – – – – – – – – 1.4 1.4 –State of New South Wales – – – – 84.3 – 3.3 – 87.6 9.5 97.1 –Shire of Muswellbrook (New South Wales) – – – – – – – – – 5.3 5.3 –State of South Australia – – – – 49.2 – 0.9 – 50.1 11.2 61.3 –State of Victoria – – – – – – – – – 9.9 9.9 –
Brazil 13.5 – – 13.5 – – – – 13.5 4.3 17.8 –Government of Brazil 13.5 – – 13.5 – – – – 13.5 4.3 17.8 <1
Canada 2.4 – – 2.4 – – 6.4 61.9 70.7 9.2 79.9 21.5Government of Canada 2.4 – – 2.4 – – – – 2.4 7.1 9.5 21.5Government of Saskatchewan – – – – – – 6.2 52.6 58.8 – 58.8 –Rural Municipality of Leroy (Saskatchewan) – – – – – – – 8.0 8.0 2.0 10.0 –Rural Municipality of Prairie Rose (Saskatchewan) – – – – – – – 1.3 1.3 – 1.3 –Government of British Columbia – – – – – – 0.1 – 0.1 – 0.1 –Government of Ontario – – – – – – – – – 0.1 0.1 –Government of Quebec – – – – – – 0.1 – 0.1 – 0.1 –
Chile (1) 874.4 138.9 – 1,013.3 – – 14.0 – 1,027.3 98.3 1,125.6 143.0Government of Chile 874.4 138.9 – 1,013.3 – – 14.0 – 1,027.3 96.2 1,123.5 143.0Municipalidad De Pozo Almonte – – – – – – – – – 0.8 0.8 –Municipalidad De Sierra Gorda – – – – – – – – – 0.7 0.7 –Municipalidad De Antofagasta – – – – – – – – – 0.6 0.6 –
China 1.1 – – 1.1 – – – – 1.1 – 1.1 2.5China Tax Bureau 1.1 – – 1.1 – – – – 1.1 – 1.1 2.5
India 0.2 – – 0.2 – – – – 0.2 – 0.2 –Government of India 0.2 – – 0.2 – – – – 0.2 – 0.2 –
7.1 Payments made by country and level of government
7 Our payments to governments
(1) Income and mining taxes are paid in Chile on a calendar year basis. However, for the purpose of this Report, taxes paid are included for BHP Billiton’s financial year (1 July 2014 to 30 June 2015). For reference, income tax and specific tax on mining activities paid by Escondida and Pampa Norte for calendar year 2014 amount to US$924,672,687 and US$101,280,150 respectively.
(2) Taxes collected represent tax payments made to governments on behalf of our employees. These payments have been presented in the Report for information purposes only. They are not included in the total payments to governments of US$7.3 billion.

Economic contribution and payments to governments Report 2015 15
Taxes paid by classification and country are presented in this section and have been prepared on the basis set out in section 9 ‘Basis of report preparation’ of this Report.
US$ millions
Corporate income
taxesRoyalty-related
income taxes
Taxes levied on
productionTotal
taxes paid RoyaltiesProduction
entitlements Fees
Payments for infrastructure
improvements
Total payments as defined by the EU
Accounting Directive Other paymentsTotal payments
to governments Taxes collected (2)
Total payments to governments 2,877.0 1,148.1 282.4 4,307.5 2,257.9 178.6 111.0 61.9 6,916.9 392.7 7,309.6 1,426.3
Algeria – – – – – 139.9 – – 139.9 – 139.9 –Government of Algeria – – – – – 139.9 – – 139.9 – 139.9 <1
Argentina 3.5 – – 3.5 – – – – 3.5 – 3.5 –Government of Argentina 3.5 – – 3.5 – – – – 3.5 – 3.5 –
Australia 1,931.2 1,012.9 81.2 3,025.3 1,933.2 – 28.7 – 4,987.2 257.8 5,245.0 1,052.5Government of Australia 1,931.2 1,012.9 81.2 3,025.3 182.4 – 0.9 – 3,208.6 35.4 3,244.0 1,052.5State of Western Australia – – – – 1,137.6 – 10.6 – 1,148.2 110.3 1,258.5 –Town of Port Hedland (Western Australia) – – – – – – 0.5 – 0.5 3.7 4.2 –Shire of East Pilbara (Western Australia) – – – – – – – – – 3.4 3.4 –Shire of Ashburton (Western Australia) – – – – – – 1.3 – 1.3 0.5 1.8 –Shire of Wiluna (Western Australia) – – – – – – – – – 0.8 0.8 –Shire of Leonara (Western Australia) – – – – – – – – – 0.8 0.8 –City of Kalgoorlie-Boulder (Western Australia) – – – – – – – – – 0.2 0.2 –Shire of Meekatharra (Western Australia) – – – – – – – – – 0.1 0.1 –City of Rockingham (Western Australia) – – – – – – – – – 0.1 0.1 –State of Queensland – – – – 479.7 – 11.2 – 490.9 43.6 534.5 –Isaac Regional Council (Queensland) – – – – – – – – – 14.9 14.9 –Central Highlands Regional Council (Queensland) – – – – – – – – – 6.7 6.7 –Mackay Regional Council (Queensland) – – – – – – – – – 1.4 1.4 –State of New South Wales – – – – 84.3 – 3.3 – 87.6 9.5 97.1 –Shire of Muswellbrook (New South Wales) – – – – – – – – – 5.3 5.3 –State of South Australia – – – – 49.2 – 0.9 – 50.1 11.2 61.3 –State of Victoria – – – – – – – – – 9.9 9.9 –
Brazil 13.5 – – 13.5 – – – – 13.5 4.3 17.8 –Government of Brazil 13.5 – – 13.5 – – – – 13.5 4.3 17.8 <1
Canada 2.4 – – 2.4 – – 6.4 61.9 70.7 9.2 79.9 21.5Government of Canada 2.4 – – 2.4 – – – – 2.4 7.1 9.5 21.5Government of Saskatchewan – – – – – – 6.2 52.6 58.8 – 58.8 –Rural Municipality of Leroy (Saskatchewan) – – – – – – – 8.0 8.0 2.0 10.0 –Rural Municipality of Prairie Rose (Saskatchewan) – – – – – – – 1.3 1.3 – 1.3 –Government of British Columbia – – – – – – 0.1 – 0.1 – 0.1 –Government of Ontario – – – – – – – – – 0.1 0.1 –Government of Quebec – – – – – – 0.1 – 0.1 – 0.1 –
Chile (1) 874.4 138.9 – 1,013.3 – – 14.0 – 1,027.3 98.3 1,125.6 143.0Government of Chile 874.4 138.9 – 1,013.3 – – 14.0 – 1,027.3 96.2 1,123.5 143.0Municipalidad De Pozo Almonte – – – – – – – – – 0.8 0.8 –Municipalidad De Sierra Gorda – – – – – – – – – 0.7 0.7 –Municipalidad De Antofagasta – – – – – – – – – 0.6 0.6 –
China 1.1 – – 1.1 – – – – 1.1 – 1.1 2.5China Tax Bureau 1.1 – – 1.1 – – – – 1.1 – 1.1 2.5
India 0.2 – – 0.2 – – – – 0.2 – 0.2 –Government of India 0.2 – – 0.2 – – – – 0.2 – 0.2 –

16 Economic contribution and payments to governments Report 2015
7 Our payments to governments continued
US$ millions
Corporate income
taxesRoyalty-related
income taxes
Taxes levied on
productionTotal
taxes paid RoyaltiesProduction
entitlements Fees
Payments for infrastructure
improvements
Total payments as defined by the EU
Accounting Directive Other paymentsTotal payments
to governments Taxes collected (2)
Indonesia – – – – 0.1 – 1.1 – 1.2 – 1.2 1.5Pemerintah Indonesia – – – – 0.1 – 1.1 – 1.2 – 1.2 1.5
Japan 0.2 – – 0.2 – – – – 0.2 – 0.2 –Government of Japan 0.2 – – 0.2 – – – – 0.2 – 0.2 <1
Liberia – – – – – – 0.1 – 0.1 0.4 0.5 –Government of the Republic of Liberia – – – – – – 0.1 – 0.1 0.4 0.5 <1
Mongolia – – – – – – – – – 0.2 0.2 –Government of Mongolia – – – – – – – – – 0.2 0.2 –
Netherlands 2.5 – – 2.5 – – – – 2.5 – 2.5 –Government of Netherlands 2.5 – – 2.5 – – – – 2.5 – 2.5 –
Pakistan 11.2 – – 11.2 8.9 – 0.1 – 20.2 7.7 27.9 2.4Government of Pakistan 11.2 – – 11.2 8.9 – 0.1 – 20.2 7.7 27.9 2.4
Peru 7.8 – – 7.8 – – 1.4 – 9.2 – 9.2 0.6Republica Del Peru 7.8 – – 7.8 – – 1.4 – 9.2 – 9.2 0.6
Singapore 5.8 – – 5.8 – – – – 5.8 – 5.8 –Government of Singapore 5.8 – – 5.8 – – – – 5.8 – 5.8 <1
Switzerland 3.1 – – 3.1 – – – – 3.1 – 3.1 –Government of Switzerland 3.1 – – 3.1 – – – – 3.1 – 3.1 <1
Trinidad and Tobago – – – – – 38.7 3.9 – 42.6 – 42.6 3.0Government of the Republic of Trinidad and Tobago – – – – – 38.7 3.9 – 42.6 – 42.6 3.0
United Kingdom * (41.8) (3.7) – (45.5) – – – – (45.5) 4.7 (40.8) 16.9Government of United Kingdom (41.8) (3.7) – (45.5) – – – – (45.5) 1.3 (44.2) 16.9City of Westminster – – – – – – – – – 3.4 3.4 –
United States 61.9 – 201.2 263.1 315.7 – 55.3 – 634.1 10.1 644.2 182.4Government of United States 41.1 – – 41.1 282.0 – 45.9 – 369.0 8.4 377.4 176.5State of Texas 12.0 – 160.3 172.3 25.4 – 9.1 – 206.8 – 206.8 –State of Louisiana 8.8 – 22.8 31.6 7.0 – 0.1 – 38.7 – 38.7 1.2State of Arkansas – – 12.2 12.2 1.3 – – – 13.5 1.6 15.1 0.8State of New Mexico – – 5.9 5.9 – – – – 5.9 – 5.9 3.6State of Arizona – – – – – – 0.2 – 0.2 0.1 0.3 0.3
Discontinued Operations 188.6 – – 188.6 198.2 – – – 386.8 91.2 478 264.6South32 (3) 188.6 – – 188.6 198.2 – – – 386.8 91.2 478 264.6
7.1 Payments made by country and level of government continued
(2) Taxes collected represent tax payments made to governments on behalf of our employees. These payments have been presented in the Report for information purposes only. They are not included in the total payments to governments of US$7.3 billion.
(3) Other payments include US$55.7 million of stamp and transfer duties paid by BHP Billiton in relation to the demerger of South32.
* The negative balances are refunds received in FY2015 in respect of Petroleum Revenue Tax (PRT) paid in FY2014 (US$3.7 million), and corporate income taxes paid in FY2012 (US$41.8 million). Corporate income tax and PRT paid in respect of FY2014, FY2013 and FY2012 (excluding refunds received in FY2015) was US$13.9 million, US$119.2 million, and US$102.5 million respectively.

Economic contribution and payments to governments Report 2015 17
US$ millions
Corporate income
taxesRoyalty-related
income taxes
Taxes levied on
productionTotal
taxes paid RoyaltiesProduction
entitlements Fees
Payments for infrastructure
improvements
Total payments as defined by the EU
Accounting Directive Other paymentsTotal payments
to governments Taxes collected (2)
Indonesia – – – – 0.1 – 1.1 – 1.2 – 1.2 1.5Pemerintah Indonesia – – – – 0.1 – 1.1 – 1.2 – 1.2 1.5
Japan 0.2 – – 0.2 – – – – 0.2 – 0.2 –Government of Japan 0.2 – – 0.2 – – – – 0.2 – 0.2 <1
Liberia – – – – – – 0.1 – 0.1 0.4 0.5 –Government of the Republic of Liberia – – – – – – 0.1 – 0.1 0.4 0.5 <1
Mongolia – – – – – – – – – 0.2 0.2 –Government of Mongolia – – – – – – – – – 0.2 0.2 –
Netherlands 2.5 – – 2.5 – – – – 2.5 – 2.5 –Government of Netherlands 2.5 – – 2.5 – – – – 2.5 – 2.5 –
Pakistan 11.2 – – 11.2 8.9 – 0.1 – 20.2 7.7 27.9 2.4Government of Pakistan 11.2 – – 11.2 8.9 – 0.1 – 20.2 7.7 27.9 2.4
Peru 7.8 – – 7.8 – – 1.4 – 9.2 – 9.2 0.6Republica Del Peru 7.8 – – 7.8 – – 1.4 – 9.2 – 9.2 0.6
Singapore 5.8 – – 5.8 – – – – 5.8 – 5.8 –Government of Singapore 5.8 – – 5.8 – – – – 5.8 – 5.8 <1
Switzerland 3.1 – – 3.1 – – – – 3.1 – 3.1 –Government of Switzerland 3.1 – – 3.1 – – – – 3.1 – 3.1 <1
Trinidad and Tobago – – – – – 38.7 3.9 – 42.6 – 42.6 3.0Government of the Republic of Trinidad and Tobago – – – – – 38.7 3.9 – 42.6 – 42.6 3.0
United Kingdom * (41.8) (3.7) – (45.5) – – – – (45.5) 4.7 (40.8) 16.9Government of United Kingdom (41.8) (3.7) – (45.5) – – – – (45.5) 1.3 (44.2) 16.9City of Westminster – – – – – – – – – 3.4 3.4 –
United States 61.9 – 201.2 263.1 315.7 – 55.3 – 634.1 10.1 644.2 182.4Government of United States 41.1 – – 41.1 282.0 – 45.9 – 369.0 8.4 377.4 176.5State of Texas 12.0 – 160.3 172.3 25.4 – 9.1 – 206.8 – 206.8 –State of Louisiana 8.8 – 22.8 31.6 7.0 – 0.1 – 38.7 – 38.7 1.2State of Arkansas – – 12.2 12.2 1.3 – – – 13.5 1.6 15.1 0.8State of New Mexico – – 5.9 5.9 – – – – 5.9 – 5.9 3.6State of Arizona – – – – – – 0.2 – 0.2 0.1 0.3 0.3
Discontinued Operations 188.6 – – 188.6 198.2 – – – 386.8 91.2 478 264.6South32 (3) 188.6 – – 188.6 198.2 – – – 386.8 91.2 478 264.6

18 Economic contribution and payments to governments Report 2015
7 Our payments to governments continued
Taxes paid by classification and project are presented in this section and have been prepared on the basis set out in section 9 ‛Basis of report preparation’ of this Report.
US$ millions
Corporate income
taxesRoyalty-related
income taxes
Taxes levied on
productionTotal
taxes paid RoyaltiesProduction
entitlements Fees
Payments for infrastructure
improvements
Total payments as defined by the EU
Accounting Directive Other paymentsTotal payments
to governments Taxes collected (4)
Total payments to governments 2,877.0 1,148.1 282.4 4,307.5 2,257.9 178.6 111.0 61.9 6,916.9 392.7 7,309.6 1,426.3
Petroleum and Potash 555.9 921.0 267.6 1,744.5 492.0 178.6 66.3 61.9 2,543.3 20.2 2,563.5 206.3Australia Production Unit – Western Australia 23.6 469.0 5.7 498.3 – – 1.8 – 500.1 1.3 501.4 21.2Australia Production Unit – Victoria 3.5 25.3 – 28.8 – – – – 28.8 – 28.8 –Bass Strait 123.2 430.4 – 553.6 – – – – 553.6 – 553.6 –North West Shelf 307.3 – 66.6 373.9 182.3 – – – 556.2 – 556.2 –Gulf of Mexico 14.8 – – 14.8 266.8 – 44.6 – 326.2 0.9 327.1 113.0Onshore US (Fayetteville) – – 12.2 12.2 1.3 – – – 13.5 1.6 15.1 5.8Onshore US (Haynesville) – – 22.8 22.8 7.3 – 0.1 – 30.2 0.5 30.7 0.1Onshore US (Permian Basin, Eagle Ford) 7.2 – 160.3 167.5 25.4 – 9.2 – 202.1 – 202.1 31.9Trinidad and Tobago Production Unit – – – – – 38.7 2.3 – 41.0 – 41.0 3.0Algeria Joint Interest Unit – – – – – 139.9 – – 139.9 – 139.9 –UK Production Unit (1) (41.8) (3.7) – (45.5) – – – – (45.5) – (45.5) –Pakistan Production Unit 11.2 – – 11.2 8.9 – 0.1 – 20.2 7.7 27.9 –Head Office – Broken Hill Proprietary (USA) Inc. – – – – – – – – – 0.5 0.5 9.8Head Office – BHP Billiton Petroleum International Pty. Ltd. 101.3 – – 101.3 – – – – 101.3 – 101.3 –Head Office – BHP Petroleum (Argentina) S.A. 3.5 – – 3.5 – – – – 3.5 – 3.5 –Head Office – BHP Billiton Brasil Investimentos Ltda. 0.3 – – 0.3 – – – – 0.3 – 0.3 –Exploration – BHP Billiton Petroleum (New Ventures) Corporation – – – – – – 1.6 – 1.6 – 1.6 –Potash 1.8 – – 1.8 – – 6.3 61.9 70.0 7.5 77.5 21.5Closed Mines – – – – – – 0.3 – 0.3 0.2 0.5 –
Copper 796.1 138.9 0.7 935.7 49.2 – 16.7 – 1,001.6 110.4 1,112.0 243.0Escondida 768.6 138.9 – 907.5 – – 8.4 – 915.9 96.3 1,012.2 104.2Pampa Norte 97.0 – – 97.0 – – 1.7 – 98.7 1.9 100.6 10.5Olympic Dam (2) (60.2) – 0.7 (59.5) 49.2 – 1.2 – (9.1) 12.2 3.1 99.4Head Office – BHP Chile Inc 0.7 – – 0.7 – – 3.8 – 4.5 – 4.5 28.9Head Office – BHP Billiton World Exploration Inc. – – – – – – 1.4 – 1.4 – 1.4 –Head Office – BHP Billiton Mineral Resources Inc. – – – – – – 0.2 – 0.2 – 0.2 –Head Office – RAL Cayman Inc. 7.8 – – 7.8 – – – – 7.8 – 7.8 –Head Office – BHP Peru Holdings Inc. (17.8) – – (17.8) – – – – (17.8) – (17.8) –
Iron Ore 1,887.2 88.2 1.2 1,976.6 1,118.0 – 7.2 – 3,101.8 125.3 3,227.1 440.9Western Australia Iron Ore 1,887.2 88.2 1.2 1,976.6 1,118.0 – 7.1 – 3,101.7 120.6 3,222.3 440.9Head Office – BHP Billiton Brasil Ltda – – – – – – – – – 4.3 4.3 –Head Office – BHP Billiton (Liberia) Inc. – – – – – – 0.1 – 0.1 0.4 0.5 –
Coal (122.6) – 9.3 (113.3) 579.1 – 17.0 – 482.8 97.1 579.9 383.8Queensland Coal (2) (144.2) – 1.7 (142.5) 479.7 – 11.3 – 348.5 75.3 423.8 296.7New Mexico 13.0 – 5.8 18.8 15.0 – 1.2 – 35.0 6.6 41.6 23.6New South Wales Energy Coal 10.9 – 1.8 12.7 84.3 – 3.3 – 100.3 14.5 114.8 57.6IndoMet – – – – 0.1 – 1.1 – 1.2 – 1.2 1.5Head Office – BHP Billiton MetCoal Holdings Pty Ltd (2) (2.3) – – (2.3) – – 0.1 – (2.2) 0.7 (1.5) 4.4
Group & Unallocated (239.6) – 3.6 (236.0) 19.6 – 3.8 – (212.6) 39.7 (172.9) 152.3Corporate Head Office (2) (217.2) – – (217.2) – – – – (217.2) 24.2 (193.0) 86.1Marketing Offices 15.9 – – 15.9 – – – – 15.9 – 15.9 4.0Nickel West (2) (38.3) – 3.6 (34.7) 19.6 – 3.8 – (11.3) 15.5 4.2 62.2
Discontinued Operations 188.6 – – 188.6 198.2 – – – 386.8 91.2 478 264.6South32 (3) 188.6 – – 188.6 198.2 – – – 386.8 91.2 478 264.6
7.2 Payments made on a project-by-project basis
(1) The negative balances are refunds received in FY2015 in respect of Petroleum Revenue Tax (PRT) paid in FY2014 (US$3.7 million), and corporate income taxes paid in FY2012 (US$41.8 million). Corporate income tax and PRT paid in respect of FY2014, FY2013 and FY2012 (excluding refunds received in FY2015) was US$13.9 million, US$119.2 million, and US$102.5 million respectively.
(2) The corporate income tax amount does not represent a refund from a government. Instead it represents the allocation of the Australian corporate income tax payment amongst members of the Australian tax consolidation group. For further information, please refer to section 9 ‘Basis of report preparation’.
(3) Other payments include US$55.7 million of stamp and transfer duties paid by BHP Billiton in relation to the demerger of South32.(4) Taxes collected represent tax payments made to governments on behalf of our employees. These payments have been presented in the Report for information
purposes only. They are not included in the total payments to governments of US$7.3 billion.

Economic contribution and payments to governments Report 2015 19
Taxes paid by classification and project are presented in this section and have been prepared on the basis set out in section 9 ‛Basis of report preparation’ of this Report.
US$ millions
Corporate income
taxesRoyalty-related
income taxes
Taxes levied on
productionTotal
taxes paid RoyaltiesProduction
entitlements Fees
Payments for infrastructure
improvements
Total payments as defined by the EU
Accounting Directive Other paymentsTotal payments
to governments Taxes collected (4)
Total payments to governments 2,877.0 1,148.1 282.4 4,307.5 2,257.9 178.6 111.0 61.9 6,916.9 392.7 7,309.6 1,426.3
Petroleum and Potash 555.9 921.0 267.6 1,744.5 492.0 178.6 66.3 61.9 2,543.3 20.2 2,563.5 206.3Australia Production Unit – Western Australia 23.6 469.0 5.7 498.3 – – 1.8 – 500.1 1.3 501.4 21.2Australia Production Unit – Victoria 3.5 25.3 – 28.8 – – – – 28.8 – 28.8 –Bass Strait 123.2 430.4 – 553.6 – – – – 553.6 – 553.6 –North West Shelf 307.3 – 66.6 373.9 182.3 – – – 556.2 – 556.2 –Gulf of Mexico 14.8 – – 14.8 266.8 – 44.6 – 326.2 0.9 327.1 113.0Onshore US (Fayetteville) – – 12.2 12.2 1.3 – – – 13.5 1.6 15.1 5.8Onshore US (Haynesville) – – 22.8 22.8 7.3 – 0.1 – 30.2 0.5 30.7 0.1Onshore US (Permian Basin, Eagle Ford) 7.2 – 160.3 167.5 25.4 – 9.2 – 202.1 – 202.1 31.9Trinidad and Tobago Production Unit – – – – – 38.7 2.3 – 41.0 – 41.0 3.0Algeria Joint Interest Unit – – – – – 139.9 – – 139.9 – 139.9 –UK Production Unit (1) (41.8) (3.7) – (45.5) – – – – (45.5) – (45.5) –Pakistan Production Unit 11.2 – – 11.2 8.9 – 0.1 – 20.2 7.7 27.9 –Head Office – Broken Hill Proprietary (USA) Inc. – – – – – – – – – 0.5 0.5 9.8Head Office – BHP Billiton Petroleum International Pty. Ltd. 101.3 – – 101.3 – – – – 101.3 – 101.3 –Head Office – BHP Petroleum (Argentina) S.A. 3.5 – – 3.5 – – – – 3.5 – 3.5 –Head Office – BHP Billiton Brasil Investimentos Ltda. 0.3 – – 0.3 – – – – 0.3 – 0.3 –Exploration – BHP Billiton Petroleum (New Ventures) Corporation – – – – – – 1.6 – 1.6 – 1.6 –Potash 1.8 – – 1.8 – – 6.3 61.9 70.0 7.5 77.5 21.5Closed Mines – – – – – – 0.3 – 0.3 0.2 0.5 –
Copper 796.1 138.9 0.7 935.7 49.2 – 16.7 – 1,001.6 110.4 1,112.0 243.0Escondida 768.6 138.9 – 907.5 – – 8.4 – 915.9 96.3 1,012.2 104.2Pampa Norte 97.0 – – 97.0 – – 1.7 – 98.7 1.9 100.6 10.5Olympic Dam (2) (60.2) – 0.7 (59.5) 49.2 – 1.2 – (9.1) 12.2 3.1 99.4Head Office – BHP Chile Inc 0.7 – – 0.7 – – 3.8 – 4.5 – 4.5 28.9Head Office – BHP Billiton World Exploration Inc. – – – – – – 1.4 – 1.4 – 1.4 –Head Office – BHP Billiton Mineral Resources Inc. – – – – – – 0.2 – 0.2 – 0.2 –Head Office – RAL Cayman Inc. 7.8 – – 7.8 – – – – 7.8 – 7.8 –Head Office – BHP Peru Holdings Inc. (17.8) – – (17.8) – – – – (17.8) – (17.8) –
Iron Ore 1,887.2 88.2 1.2 1,976.6 1,118.0 – 7.2 – 3,101.8 125.3 3,227.1 440.9Western Australia Iron Ore 1,887.2 88.2 1.2 1,976.6 1,118.0 – 7.1 – 3,101.7 120.6 3,222.3 440.9Head Office – BHP Billiton Brasil Ltda – – – – – – – – – 4.3 4.3 –Head Office – BHP Billiton (Liberia) Inc. – – – – – – 0.1 – 0.1 0.4 0.5 –
Coal (122.6) – 9.3 (113.3) 579.1 – 17.0 – 482.8 97.1 579.9 383.8Queensland Coal (2) (144.2) – 1.7 (142.5) 479.7 – 11.3 – 348.5 75.3 423.8 296.7New Mexico 13.0 – 5.8 18.8 15.0 – 1.2 – 35.0 6.6 41.6 23.6New South Wales Energy Coal 10.9 – 1.8 12.7 84.3 – 3.3 – 100.3 14.5 114.8 57.6IndoMet – – – – 0.1 – 1.1 – 1.2 – 1.2 1.5Head Office – BHP Billiton MetCoal Holdings Pty Ltd (2) (2.3) – – (2.3) – – 0.1 – (2.2) 0.7 (1.5) 4.4
Group & Unallocated (239.6) – 3.6 (236.0) 19.6 – 3.8 – (212.6) 39.7 (172.9) 152.3Corporate Head Office (2) (217.2) – – (217.2) – – – – (217.2) 24.2 (193.0) 86.1Marketing Offices 15.9 – – 15.9 – – – – 15.9 – 15.9 4.0Nickel West (2) (38.3) – 3.6 (34.7) 19.6 – 3.8 – (11.3) 15.5 4.2 62.2
Discontinued Operations 188.6 – – 188.6 198.2 – – – 386.8 91.2 478 264.6South32 (3) 188.6 – – 188.6 198.2 – – – 386.8 91.2 478 264.6

20 Economic contribution and payments to governments Report 2015
8 Tax disclosed in our 2015 Financial Statements and reconciliation of taxes paid
8.1 Reconciliation Income Tax Paid to Income Tax ExpenseThe Corporate income taxes and Royalty-related income taxes presented in section 7 ‘Our payments to governments’, reflect the Income Taxes and Royalty-related taxes paid/refunded as presented in the Consolidated Cash Flow Statement in the BHP Billiton Annual Report 2015. The table below presents a reconciliation of these taxes paid to the Income Tax Expense amount that is presented on an accrual basis in note 4 ‘Income tax expense’ of BHP Billiton’s Consolidated Financial Statements.
2015 US$M
Income tax and Royalty-related income taxation paid (1) 4,025
Tax paid relating to prior periods (601)Tax to be refunded (451)Taxes paid in-kind (non-cash) (2) 258Other movements (63)
Tax expense in respect of current period taxable income (Current tax expense) 3,168
Future tax arising from differences between accounting values and tax values (Deferred tax expense) 498
Total taxation expense (Current and Deferred tax expense) (3) 3,666
(1) As disclosed in section 7 as the combined total of Corporate income taxes of US$2,877.0 million and Royalty-related income taxes of US$1,148.1 million.(2) Taxes in-kind include production entitlements of governments delivered and deliverable in respect of current period production.(3) As disclosed in BHP Billiton’s Consolidated Income Statement shown in the 2015 Annual Report.
Tax expense compared with tax paidThere are a number of reasons why the tax paid in any year will not be the same as the tax charge. As tax instalments are generally based on historical profits, the amount of tax paid in any particular year may differ from the tax accrued on the profits for the year. Further, tax expense includes amounts for deferred taxation, representing timing differences between the accounting for transactions and when tax becomes due, and amounts for uncertain and unresolved tax positions.
8.2 Income tax expenseExtract of note 4 ‘Income tax expense’ of BHP Billiton’s Consolidated Financial Statements reconciling statutory effective tax rate to adjusted effective tax rate.
2015
Profit Income tax before taxation expense US$M US$M %
Statutory effective tax rate 8,056 (3,666) 45.5Adjusted for:Exchange rate movements – 339
Exceptional items (1) 3,196 (250)
Adjusted effective tax rate 11,252 (3,577) 31.8
(1) Exceptional items after tax include impairment of Onshore US assets of US$1,958 million, impairment of Nickel West assets of US$290 million and the remeasurement of deferred tax upon repeal of Minerals Resource Rent Tax legislation of US$698 million.

Economic contribution and payments to governments Report 2015 21
9 Basis of report preparation
FeesPayments to governments in the form of fees typically levied on the initial or ongoing right to use a geographical area for exploration, development and/or production. Includes licence fees, rental fees, entry fees and other payments for licences and/or concessions.
Payments for infrastructure improvementsPayments to governments for the construction of public infrastructure such as roads, bridges and port facilities.
Dividend paymentsPayments to governments with ownership interests in specific assets; not payments to governments as holders of ordinary equity shares in BHP Billiton. There were no dividend payments to governments for the year ended 30 June 2015.
Signature, discovery or production bonusesPayments to governments upon signing an oil and gas lease, when discovering natural resources, and/or when production has commenced. There were no payments of signature, discovery or production bonuses to governments for the year ended 30 June 2015.
Other paymentsPayments to governments under other legislated tax rules such as Payroll Tax, Fringe Benefits Tax, Customs and Excise duties, Property Tax, Land Tax, stamp duties, and Black Lung Tax. These payments are not specifically required to be disclosed by the EU Transparency and Accounting Directive.
Excluded amountsThe following are not included in total payments to governments:Taxes collectedTax payments made to governments on behalf of our employees. These payments have been presented in this Report for information purposes only. Where the payroll year-end date is different to BHP Billiton’s financial year-end date, the most recent annual data has been used.
Indirect taxesTax payments made to, or received from, governments in the nature of Sales Tax, Value Added Tax and Goods and Services Tax.
Penalties and interestPayments to governments resulting from the imposition of penalties, fees or interest.
Other Any payment, whether made as a single payment or as a series of related payments below US$100,000.
Taxes, royalties and other payments to governments are presented in this Report on a cash paid and cash received basis for the year ended 30 June 2015. This Report includes all such payments paid/received by BHP Billiton in respect of each of our operations, including joint operations. However, it excludes payments paid/received by entities that are accounted for as an equity accounted investment in BHP Billiton’s Financial Statements, such as Antamina, Cerrejón and Samarco. This Report also excludes payments to governments paid/received by entities that were demerged during the year to form South32.
Taxes, royalties and other payments, both cash and in-kind (non-cash), to governments, net of refunds, are collectively referred to in this Report as Total payments to governments and include the following payment categories:Corporate income taxesPayments to governments based on taxable profits under legislated income tax rules. This also includes withholding taxes on dividends, royalties and interest.
Royalty-related income taxesPayments to governments in relation to profits from the extraction of natural resources, including Minerals Resource Rent Tax (MRRT), Petroleum Resource Rent Tax (PRRT), and Specific Tax on Mining Activities (STMA). Royalty-related income taxes are presented as income tax in the Consolidated Income Statement in the BHP Billiton Annual Report 2015.
Taxes levied on productionPayments to governments in relation to crude excise, carbon tax and severance tax on the extraction of natural resources. Taxes levied on production are presented as expenses, not income tax, in the Consolidated Income Statement.
RoyaltiesPayments to governments in relation to revenue or production generated under licence agreements. Royalties are presented as expenses, not income tax, in the Consolidated Income Statement in the BHP Billiton Annual Report 2015. Royalty-related income taxes are excluded from Royalties.
Production entitlements Payments to governments entitled to a share of production under production sharing agreements. Production entitlements are most often paid in-kind. In-kind payments are measured based on the market value of the commodity on the date of delivery to the government.
22 Economic contribution and payments to governments Report 2015
9 Basis of report preparation continued
OtherSection 7.2 ‘Payments made on a project-by-project basis’ present corporate income tax amounts for each project/entity taking into account the effects of tax consolidation in Australia. These include the following:• Losses from one entity can be offset against taxable income
of another entity within the same tax consolidated group;• Only the head entity of a tax consolidated group is liable
to make corporate income tax payments to the Australian Taxation Office (the ATO);
• Typically, corporate tax groups allocate the aggregate corporate income tax payments made by the head entity to the ATO amongst entities within the Australian tax consolidated group.
In relation to BHP Billiton, the aggregate of all positive and negative allocations to members of the BHP Billiton Australian tax consolidated groups, together with tax payments made by stand-alone Australian entity taxpayers, totals US$1,931.2 million in 2015.
We have prepared this Report taking into account the intent of the EU Accounting Directive by reference to the UK Reports on Payments to Government Regulations 2014. These Regulations do not come into force until financial years beginning on or after 1 January 2015. As such, BHP Billiton will prepare the first Report that is mandatory under these Regulations for the financial year ending 30 June 2016.
Payments made on a project-by-project basis (section 7.2 ‘Payments made on a project-by-project basis’) present payments by entity when not specifically attributable to a project.
Economic contribution and payments to governments Report 2015 23
10 Glossary
BHP BillitonBeing both companies in the Dual Listed Company structure, BHP Billiton Limited and BHP Billiton Plc.
CompanyBHP Billiton Limited, BHP Billiton Plc and their subsidiaries.
Current tax expenseThe amount of Corporate income tax and Royalty-related income tax and Production entitlements currently payable and attributable to the year, measured at rates enacted or substantively enacted at year-end, together with any adjustment to those taxes payable in respect of previous years.
Deferred tax expenseThe amount of Corporate income tax and Royalty-related income tax and Production entitlements attributable to the current year but payable in future years provided using the balance sheet liability method.
Adjusted effective tax rateComprises Total taxation expense excluding remeasurement of deferred tax assets associated with the Minerals Resource Rent Tax (MRRT), exceptional items and exchange rate movements included in taxation expense divided by Profit before taxation and exceptional items.
Effective income tax and royalties paid rateTotal Corporate income tax, Royalty-related income tax and Royalties paid divided by Profit before taxation, Royalties paid and exceptional items.
Group BHP Billiton Limited, BHP Billiton Plc and their subsidiaries.
GovernmentGovernment means any national, regional or local authority of a country, and includes a department, agency or undertaking that is a subsidiary undertaking where the authority is the parent undertaking.
Income tax expenseThe total of Current tax expense and Deferred tax expense.
ProjectConsistent with the EU Accounting Directive, a project is defined as the operational activities that are governed by a single contract, licence, lease, concession or similar legal agreements and form the basis for payment liabilities with a government. If multiple such agreements are ‘substantially interconnected’ they may be considered a project. For these purposes ‘substantially interconnected’ means forming a set of operationally and geographically integrated contracts, licences, leases or concessions or related agreements with substantially similar terms that are signed with a government, giving rise to payment liabilities.
ReportThe Report has been prepared for the financial year from 1 July 2014 to 30 June 2015 of BHP Billiton.

24 Economic contribution and payments to governments Report 2015
Independent Audit Report to the directors of BHP Billiton
11 Independent Auditor’s report
Our opinion In our opinion, the Total Payments to Governments of US$7,309.6 million (“Total payments to governments”) as presented in section 7.1 and 7.2 of the BHP Billiton Group’s (BHP Billiton) Economic Contribution and Payments to Governments Report 2015 (the “Report”) is prepared, in all material respects, in accordance with the Basis of report preparation set out in Section 9 of the Report.
We have been engaged by BHP Billiton to audit the Total payments to governments as defined above in the Report.
Basis of report preparation and use of this audit reportWithout modifying our opinion, we draw attention to Section 9 of the Report, which sets out the Basis of report preparation. This audit report has been prepared for BHP Billiton in accordance with our engagement letter and is intended solely for the directors of BHP Billiton.
We disclaim any assumption of responsibility for any reliance on this audit report, or the Report to which it relates, to any person other than the directors of BHP Billiton, or for any purpose other than that for which it was prepared.
Management’s responsibility Management is responsible for the preparation and presentation of the Report. Management has established a framework in which the Total payments to governments and other related information in the Report has been prepared. Management has determined that the framework as set out in the Basis of report preparation in Section 9 is appropriate to meet their needs. Management is also responsible for such internal control and processes as management determines is necessary to ensure the preparation and presentation of the Report is free from material misstatement, whether due to fraud or error.
Our responsibilityOur responsibility is to express an opinion on the Total payments to governments based on our audit. We conducted our audit in accordance with Australian Auditing Standards. Those standards require that we comply with relevant ethical requirements and plan and perform the audit to obtain reasonable assurance about whether the Total payments to governments has been prepared in all material respects in accordance with the Basis of report preparation in Section 9 of the Report.
An audit involves performing procedures to obtain audit evidence about the Total payments to governments. The procedures selected depend on the auditor’s judgement, including the assessment of the risks of material misstatement of the Total payments to governments, whether due to fraud or error. In making those risk assessments, the auditor considers internal control relevant to the preparation of the Total payments to governments in order to design audit procedures that are appropriate in the circumstances, but not for the purpose of expressing an opinion on the effectiveness of the internal control. An audit also includes evaluating the appropriateness of the Basis of report preparation in relation to the Total payments to governments.
We believe that the audit evidence we have obtained is sufficient and appropriate to provide a basis for our audit opinion.
IndependenceIn conducting our audit, we have complied with the independence requirements of the Accounting Professional and Ethical Standards Board.
KPMG Melbourne 10 September 2015

Corporate Directory
BHP Billiton Group Registered OfficesBHP Billiton Limited Australia171 Collins Street Melbourne VIC 3000Telephone 1300 554 757 (within Australia) +61 3 9609 3333 (outside Australia) Facsimile +61 3 9609 3015
BHP Billiton Plc United KingdomNeathouse Place London SW1V 1LHTelephone +44 20 7802 4000 Facsimile +44 20 7802 4111
Group Company SecretaryMargaret Taylor
Share Registrars and Transfer Offices
AustraliaBHP Billiton Limited Registrar Computershare Investor Services Pty Limited Yarra Falls, 452 Johnston Street Abbotsford VIC 3067 Postal Address – GPO Box 2975 Melbourne VIC 3001Telephone 1300 656 780 (within Australia) +61 3 9415 4020 (outside Australia) Facsimile +61 3 9473 2460 Email enquiries: www.investorcentre.com/bhp
New ZealandComputershare Investor Services Limited Level 2/159 Hurstmere Road Takapuna Auckland 0622 Postal Address – Private Bag 92119 Auckland 1142Telephone +64 9 488 8777 Facsimile +64 9 488 8787
BHP Billiton Corporate CentresChileCerro El Plomo 6000 Piso 18 Las Condes 7560623 SantiagoTelephone +56 2 2579 5000 Facsimile +56 2 2207 6517
United StatesOur agent for service in the United States is Maria Isabel Reuter at: 1360 Post Oak Boulevard, Suite 150 Houston, TX 77056-3020Telephone +1 713 961 8500 Facsimile +1 713 961 8400
United KingdomBHP Billiton Plc Registrar Computershare Investor Services PLC The Pavilions, Bridgwater Road Bristol BS13 8AE Postal Address (for general enquiries) – The Pavilions, Bridgwater Road Bristol BS99 6ZZTelephone +44 844 472 7001 Facsimile +44 870 703 6101 Email enquiries: www . investorcentre . co .uk / contactus
South AfricaBHP Billiton Plc Branch Register and Transfer Secretary Computershare Investor Services (Pty) Limited 70 Marshall Street Johannesburg 2001 Postal Address – PO Box 61051 Marshalltown 2107Telephone +27 11 373 0033 Facsimile +27 11 688 5217 Email enquiries: [email protected] of shares dematerialised into Strate should contact their CSDP or stockbroker.
Marketing OfficesSingapore10 Marina Boulevard, #50-01 Marina Bay Financial Centre, Tower 2 Singapore 018983Telephone +65 6421 6000 Facsimile +65 6421 7000
United StatesComputershare Trust Company, N.A. 250 Royall Street Canton, MA 02021 Postal Address – PO Box 43078 Providence, RI 02940-3078Telephone +1 888 404 6340 (toll-free within US) Facsimile +1 312 601 4331ADR Depositary, Transfer Agent and Registrar Citibank Shareholder Services PO Box 43077 Providence, RI 02940-3077Telephone +1 781 575 4555 (outside of US) +1 877 248 4237 (+1-877-CITIADR) (toll-free within US) Facsimile +1 201 324 3284 Email enquiries: [email protected] Website: www.citi.com/dr
BHP Billiton produces a range of publications, which can be viewed or downloaded at www.bhpbilliton.com. If you are a shareholder, you can also elect to receive a paper copy of the Annual Report through the Share Registrar (above).
Annual Report Sustainability Report
Latest news
Reports and presentationsCompany overview (including Our BHP Billiton Charter, Structure and Governance)
Subscribe to receive news alerts sent directly to your email address
www.linkedin.com/company/bhp-billiton www.youtube.com/bhpbilliton www.twitter.com/bhpbilliton