Embed Size (px)
Citation preview
Economic burden of impairment in children withsevere or difficult-to-treat asthmaStanley J. Szefler, MD*; Robert S. Zeiger, MD, PhD†; Tmirah Haselkorn, PhD‡*;David R. Mink, MS§; Tripthi V. Kamath, PhD‡; James E. Fish, MD‡¶; and Bradley E. Chipps, MD�
Background: The cost associated with asthma impairment in children with severe asthma has not been determined.Objective: To assess the asthma cost burden in children with severe or difficult-to-treat asthma based on asthma impairment.Methods: Children aged 6 to 12 years in The Epidemiology and Natural History of Asthma: Outcomes and Treatment Regimens
study with available data at baseline (n � 628), month 12 (n � 385), and month 24 (n � 280) corresponding to the National Heart,Lung, and Blood Institute asthma guidelines’ impairment domain were included. Children were categorized as either very poorlycontrolled (VPC), not well controlled (NWC), or well controlled (WC) and assessed cross-sectionally and longitudinally. Mean totalasthma costs based on direct (medication usage, unscheduled office visits, emergency department visits, hospitalizations) and indirect(school/work days lost) asthma costs were assessed.
Results: Mean annual total asthma costs were more than twice as high in the VPC group compared with NWC and WC groups(baseline: $7,846, $3,526, $3,766.44, respectively; month 12: $7,326, $2,959, $2,043, respectively; month 24: $8,879, $3,308, $1,861,respectively (all P � .001). Indirect costs accounted for approximately half the total asthma costs for VPC asthma patients at each timepoint. Significantly lower costs were observed for patients whose impairment status improved or temporarily improved from VPC afterbaseline.
Conclusion: The economic burden of severe or difficult-to-treat asthma in children is associated with VPC asthma and improvementin asthma control and is associated with reducing cost. Further attention to patients with poorly controlled asthma, through bettermanagement strategies or more effective medications, may significantly reduce this burden of illness.
Ann Allergy Asthma Immunol. 2011;107:110–119.
INTRODUCTIONAsthma, one of the most common chronic diseases, affects20% of children worldwide.1,2 Among children younger than18 years of age in the United States, 13.0% have beendiagnosed with asthma, and 8.9% (6.5 million) currently haveasthma.3 Recent analysis of data from the 2003/2004 NationalSurvey of Children’s Health demonstrated a significant rela-tionship between severe asthma and lower health-relatedquality of life (P � .005).4
In 2007, the total incremental cost of asthma to society was$56 billion, with direct costs accounting for $50.1 billion, pro-ductivity losses attributable to morbidity accounting for $3.8billion, and productivity losses attributable to mortality account-ing for $2.1 billion.5 More than 80% of healthcare resources areused by 20% of asthma patients,6 likely reflecting a patientsubgroup with severe or uncontrolled disease, because overallcosts are related to severity7 and uncontrolled disease.8
Studies of children with asthma indicate that high rates ofmedication use and healthcare utilization (HCU) are relatedto uncontrolled disease9 and increased cost burden.9-12 Al-though studies have assessed the costs associated with pedi-atric asthma as a whole,13-15 none has focused on the costs ofuncontrolled asthma or whether changes in control affectcosts. The Epidemiology and Natural History of Asthma:Outcomes and Treatment Regimens (TENOR) observationalstudy assessed a large cohort of patients with severe ordifficult-to-treat asthma and provided relevant data regardingthis understudied population.9,16,17 The current analysis as-sessed the burden in children aged 6 to 12 years in relation to
Affiliations: * National Jewish Health, Denver, Colorado; † Kaiser-Perma-nente Medical Center, San Diego, California; ‡ Genentech, Inc., South SanFrancisco, California; § ICON Clinical Research, San Francisco, California;� Capital Allergy & Respiratory Disease Center, Sacramento, California ¶ Cur-rent affiliation: Merck Research Laboratories, North Wales, Pennsylvania
Funding Sources: Genentech, Inc., South San Francisco, CA, and No-vartis Pharmaceuticals, East Hanover, NJ, provided support for the prepara-tion of this manuscript.
Disclosures: Dr. Szefler has consultant arrangements with Abbott, Boehringer-Ingelheim, Genentech, GlaxoSmithKline, Merck, and Novartis, received grant/re-search support from GlaxoSmithKline, and currently receives grant support from theNational Heart, Lung, and Blood Institute (NHLBI), the National Institute of Allergyand Infectious Diseases (NIAID), National Institutes of Environmental Health Sci-ences/Environmental Protection Agency, the Colorado Cancer, Cardiovascular, andPulmonary Disease Program, and the Caring for Colorado Foundation. Dr. Zeigerhas consultant arrangements with AstraZeneca, Aerocrine, Genentech, GlaxoSmith-Kline, MedImmune, Merck, and Schering-Plough and receives grant/research sup-port from AstraZeneca, Aerocrine, Genentech, GlaxoSmithKline, and Merck. Dr.Haselkorn is a paid consultant to Genentech. Mr. Mink is employed by ICONClinical Research. Dr. Kamath is an employee of Genentech. Dr. Fish was anemployee of Genentech at the time the study was conducted and is currently anemployee of Merck. Dr. Chipps has consultant arrangements with Alcon, Aventis,Genentech, AstraZeneca, GlaxoSmithKline, Medpoint, Novartis, Schering, Sepra-cor, and Merck, has received grant/research support from Alcon, Aventis, Genen-tech, AstraZeneca, GlaxoSmithKline, Novartis, Schering, Sepracor, and Merck, andhas participated on speaker bureaus for Alcon, Aventis, Genentech, AstraZeneca,Boehringer-Ingelheim, GlaxoSmithKline, Medpoint, Novartis, Pfizer, Schering-Plough, Sepracor, and Merck.
Received for publication November 15, 2010; Received in revised formApril 13, 2011.
© 2011 American College of Allergy, Asthma & Immunology.Published by Elsevier Inc. All rights reserved.
doi:10.1016/j.anai.2011.04.008
110
ANNALS OF ALLERGY, ASTHMA & IMMUNOLOGY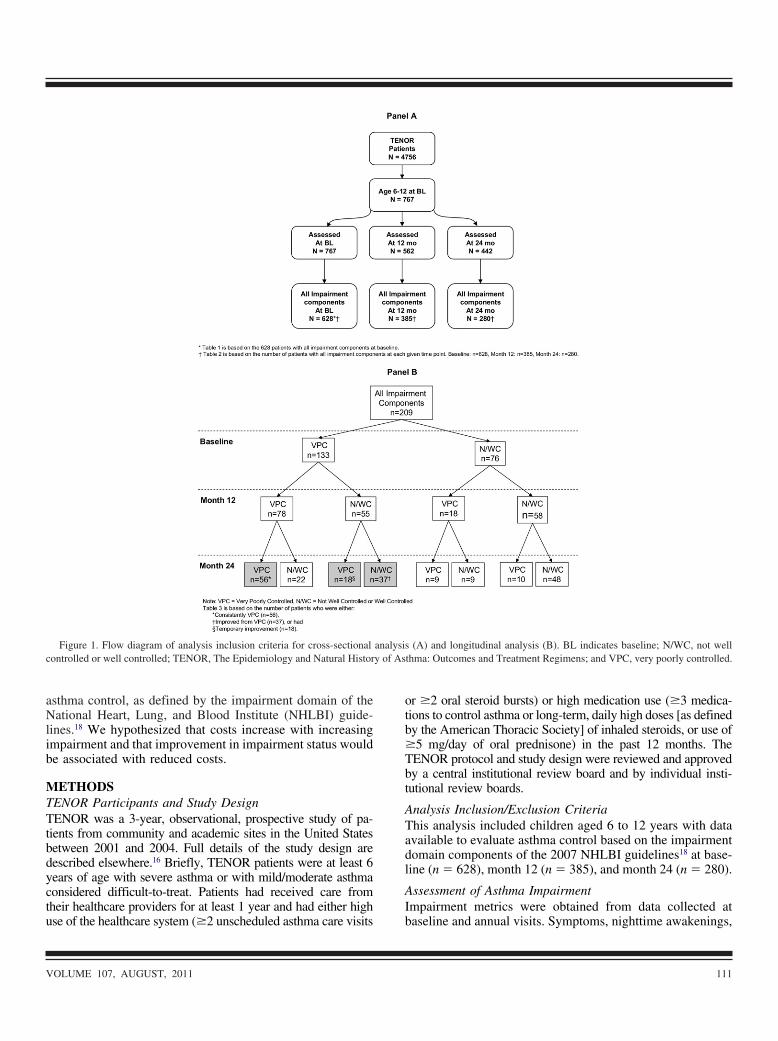
otb�Tbt
ATadl
AI
y of As
asthma control, as defined by the impairment domain of theNational Heart, Lung, and Blood Institute (NHLBI) guide-lines.18 We hypothesized that costs increase with increasingimpairment and that improvement in impairment status wouldbe associated with reduced costs.
METHODSTENOR Participants and Study DesignTENOR was a 3-year, observational, prospective study of pa-tients from community and academic sites in the United Statesbetween 2001 and 2004. Full details of the study design aredescribed elsewhere.16 Briefly, TENOR patients were at least 6years of age with severe asthma or with mild/moderate asthmaconsidered difficult-to-treat. Patients had received care fromtheir healthcare providers for at least 1 year and had either high
Figure 1. Flow diagram of analysis inclusion criteria for cross-sectionalcontrolled or well controlled; TENOR, The Epidemiology and Natural Histor
use of the healthcare system (�2 unscheduled asthma care visits b
VOLUME 107, AUGUST, 2011
r �2 oral steroid bursts) or high medication use (�3 medica-ions to control asthma or long-term, daily high doses [as definedy the American Thoracic Society] of inhaled steroids, or use of5 mg/day of oral prednisone) in the past 12 months. TheENOR protocol and study design were reviewed and approvedy a central institutional review board and by individual insti-utional review boards.
nalysis Inclusion/Exclusion Criteriahis analysis included children aged 6 to 12 years with datavailable to evaluate asthma control based on the impairmentomain components of the 2007 NHLBI guidelines18 at base-ine (n � 628), month 12 (n � 385), and month 24 (n � 280).
ssessment of Asthma Impairmentmpairment metrics were obtained from data collected at
(A) and longitudinal analysis (B). BL indicates baseline; N/WC, not wellthma: Outcomes and Treatment Regimens; and VPC, very poorly controlled.
analysis
aseline and annual visits. Symptoms, nighttime awakenings,
111
wcNw1pVVidmg
pone
and interference with normal activity were obtained from thePediatric Asthma Quality of Life Questionnaire with Stan-dardized Activities (PAQLQ[S]).19 The PAQLQ(S), a vali-dated questionnaire for asthma patients aged 7 to 17 years,was based on recall of the previous 1-week period. Althoughthe age range for use of this instrument does not include6-year-olds, the individual items provided requisite data formapping responses to the guidelines for the current analysisof 6- to 12-year-olds (see eTable 1).18 Lung function wasmeasured using spirometry in accordance with AmericanThoracic Society guidelines.20 Medication adherence wasmeasured using a proxy from the Asthma Therapy Assess-ment Questionnaire (ATAQ),21 “What best describes how
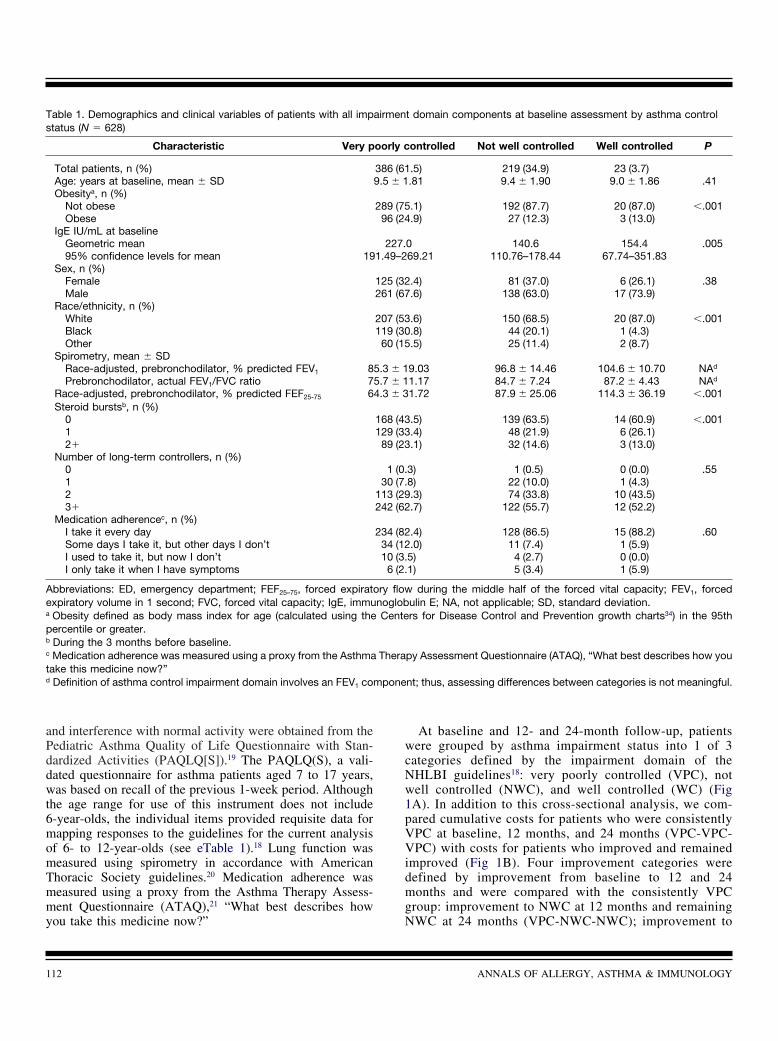
Table 1. Demographics and clinical variables of patients with all impstatus (N � 628)
Characteristic Very p
Total patients, n (%)Age: years at baseline, mean � SDObesitya, n (%)
Not obeseObese
IgE IU/mL at baselineGeometric mean95% confidence levels for mean 19
Sex, n (%)FemaleMale
Race/ethnicity, n (%)WhiteBlackOther
Spirometry, mean � SDRace-adjusted, prebronchodilator, % predicted FEV1 8Prebronchodilator, actual FEV1/FVC ratio 7
Race-adjusted, prebronchodilator, % predicted FEF25-75 6Steroid burstsb, n (%)
012�
Number of long-term controllers, n (%)0123�
Medication adherencec, n (%)I take it every daySome days I take it, but other days I don’tI used to take it, but now I don’tI only take it when I have symptoms
Abbreviations: ED, emergency department; FEF25–75, forced expiratoexpiratory volume in 1 second; FVC, forced vital capacity; IgE, immua Obesity defined as body mass index for age (calculated using thepercentile or greater.b During the 3 months before baseline.c Medication adherence was measured using a proxy from the Asthmatake this medicine now?”d Definition of asthma control impairment domain involves an FEV1 com
you take this medicine now?” N
112
At baseline and 12- and 24-month follow-up, patientsere grouped by asthma impairment status into 1 of 3
ategories defined by the impairment domain of theHLBI guidelines18: very poorly controlled (VPC), notell controlled (NWC), and well controlled (WC) (FigA). In addition to this cross-sectional analysis, we com-ared cumulative costs for patients who were consistentlyPC at baseline, 12 months, and 24 months (VPC-VPC-PC) with costs for patients who improved and remained
mproved (Fig 1B). Four improvement categories wereefined by improvement from baseline to 12 and 24onths and were compared with the consistently VPC
roup: improvement to NWC at 12 months and remaining
t domain components at baseline assessment by asthma control
ontrolled Not well controlled Well controlled P
.5) 219 (34.9) 23 (3.7).81 9.4 � 1.90 9.0 � 1.86 .41
.1) 192 (87.7) 20 (87.0) �.001
.9) 27 (12.3) 3 (13.0)
0 140.6 154.4 .00569.21 110.76–178.44 67.74–351.83
.4) 81 (37.0) 6 (26.1) .38
.6) 138 (63.0) 17 (73.9)
.6) 150 (68.5) 20 (87.0) �.001
.8) 44 (20.1) 1 (4.3)
.5) 25 (11.4) 2 (8.7)
9.03 96.8 � 14.46 104.6 � 10.70 NAd
1.17 84.7 � 7.24 87.2 � 4.43 NAd
1.72 87.9 � 25.06 114.3 � 36.19 �.001
.5) 139 (63.5) 14 (60.9) �.001
.4) 48 (21.9) 6 (26.1)
.1) 32 (14.6) 3 (13.0)
3) 1 (0.5) 0 (0.0) .558) 22 (10.0) 1 (4.3).3) 74 (33.8) 10 (43.5).7) 122 (55.7) 12 (52.2)
.4) 128 (86.5) 15 (88.2) .60
.0) 11 (7.4) 1 (5.9)5) 4 (2.7) 0 (0.0)1) 5 (3.4) 1 (5.9)
during the middle half of the forced vital capacity; FEV1, forcedulin E; NA, not applicable; SD, standard deviation.rs for Disease Control and Prevention growth charts34) in the 95th
py Assessment Questionnaire (ATAQ), “What best describes how you
nt; thus, assessing differences between categories is not meaningful.
airmen
oorly c
386 (619.5 � 1
289 (7596 (24
227.1.49–2
125 (32261 (67
207 (53119 (3060 (15
5.3 � 15.7 � 14.3 � 3
168 (43129 (3389 (23
1 (0.30 (7.
113 (29242 (62
234 (8234 (1210 (3.
6 (2.
ry flownoglobCente
Thera
WC at 24 months (VPC-NWC-NWC); improvement to
ANNALS OF ALLERGY, ASTHMA & IMMUNOLOGY

chrmdvPtpi3a
n use.
NWC at 12 months and WC at 24 months (VPC-NWC-WC); improvement to WC at 12 months, but reverting toNWC at 24 months (VPC-WC-NWC); and improvement toWC at 12 months and remaining WC at 24 months (VPC-WC-WC). We also examined patients who demonstratedtemporary improvement to NWC or WC at 12 months, butreverted back to VPC at 24 months (VPC-NWC-VPC) and(VPC-WC-VPC) (Fig 1B). The results for this groupshould be interpreted with caution because of the smallsample size (n � 18).
Primary Outcomes and Assessment of CostThe primary outcome was mean annual total asthma costs for the
Table 2. Mean annual number of healthcare utilization visits and cos
Very poorly controlled(n � 386)
Not w(n
Direct asthma costsPhysician visits
n 386Mean (SD) 12.1 � 14.1 9Subcost($) 934.9795% CI subcost($) 825, 1,047 6
Hospital nightsn 386Mean (SD) 1.8 � 6.2 0Subcost($) 1,341.4595% CI subcost($) 917, 1,811 1
ED Visitsn 386Mean (SD) 2.0 � 5.1 0Subcost($) 586.8995% CI subcost($)c 452, 747 1
Mean drug costd 2,119.5795% CI subcost($) 2,062, 2,177 1,87
Mean direct coste 4,982.8895% CI subcost($) 4,429, 5,559 2,94
Indirect asthma costsSchool/work days lost
n 320Mean (SD) 17.9 � 45.4 2Subcost($) 3,077.7995% CI subcost($) 2,250, 3,996 1
Mean indirect cost 3,077.7995% CI subcost($) 2,250, 3,996 1
Mean total asthma costf 7,846.0395% CI cost($) 6,809, 9,005 3,10
Abbreviations: SD, standard deviation; CI, confidence interval; ED, ea Table 2 is based on the number of patients with all impairment comMonth 24: n � 280 (See Fig 1A); Burden and associated costs wereb Significance was assessed by analysis of variance.d Drug costs included inhaled corticosteroids, oral/systemic corticosand leukotriene modifiers.f Mean total cost includes variables relating to indirect costs (school dcosts of the two components do not sum to the total because it is oc Confidence intervals are based on 1,000 bootstrap samples.e Direct costs include costs from healthcare utilization and medicatio
various asthma control groups, which was based on direct asthma a
VOLUME 107, AUGUST, 2011
osts (asthma-related medications, unscheduled physician visits,ospitalizations, and emergency department [ED] visits) and indi-ect asthma costs (school/work days lost). Use of asthma-relatededications was captured on the assessment date. School/work
ays lost because of asthma were measured by recall for the pre-ious 7 days using an asthma-specific adaptation of the Workroductivity and Activity Impairment instrument,22 a self-reporting
ool validated for measuring asthma-related work or classroomroductivity impairment. Asthma-related hospitalizations, ED vis-ts, and unscheduled physician visits were self-reported for the-month period before the assessment date. One-year cost wasssessed using data collected at an annual and a previous semi-
ross-sectional asthma control statusa
e Month 12
trolled9)
Well controlled(n � 23)
Pb Very poorly controlled(n � 179)
9 23 179.6 10.4 � 8.4 .042 8.8 � 7.15.04 807.44 681.295 560, 1083 606, 763
9 23 1794 1.0 � 5.0 .006 1.2 � 3.32.42 767.49 871.117 0, 2522 523, 1238
9 23 1797 0.5 � 1.8 .005 1.2 � 2.25.94 152.31 339.235 0, 389 255, 4418.53 1,860.71 �.001 2310.335 1,681, 2,041 2,225, 2,4055.93 3,587.95 �.001 4,201.959 2,454, 5,676 3,754, 4,695
9 20 152.0 0.0 � 0.0 �.001 18.1 � 43.79.32 0.00 3,118.150 0, 0 1,958, 4,4639.32 0.00 3,118.150 0, 0 1,958, 4,4636.38 3,766.44 �.001 7,326.072 2,453, 6,025 5,958, 8,841
cy department.ts at each given time point. Baseline: n � 628, Month 12: n � 385,ted per year for each measure.
, short- and long-acting beta agonists, methylxanthines, cromolyns,
t), and direct costs (healthcare utilization and medication use). Meanpatients with both components.
ts by c
Baselin
ell con� 21
21.4 � 10
7230, 83
21.4 � 2.
3219, 57
21.9 � 2.
2564, 36
1,948, 2,01
3,233, 3,62
17.1 � 11
3640, 68
3640, 68
3,525, 4,01
mergenponencalcula
teroids
ays losnly for
nnual visit.
113

pp
SDgeffutsccipCm
tw
Cost of school absences was estimated by applying sex-specific dollar amounts for one parent’s lost days of work.23
Costs were inflated and adjusted to 2002 dollars to matchother considered costs, using data from the Bureau of LaborStatistics Inflation Calculator,24 and were determined as fol-lows: (1) Cost of a lost day of work for a male adult: $208.94;(2) Cost of a lost day of work for a female adult: $125.37; (3)Blended cost for male or female: $172.38. For this analysis,the number of school days missed in the past week wasextrapolated to calculate the number of school days missed ina year. This result was then multiplied by the inflation-adjusted blended cost to obtain the cost for the number ofschool days lost per patient for the year.
Average transaction prices for resource use were derivedfrom an administrative claims database (PharMetrics Inte-grated Outcomes Database, 2002) containing patient-levelreimbursement claims for more than 22 million managed-carepatients in the United States during a 4-year period. Medica-tion cost estimates were based on US average wholesaleprices minus 15% to approximate actual acquisition costs.Total medication cost estimates were calculated using aver-
Table 2. (Continued) Mean annual number of healthcare utilization vi
Month 12
Not well controlled(n � 172)
Well controlled(n � 34)
Direct asthma costsPhysician visits
n 172 34Subcost($) 5.8 � 7.9 3.2 � 2.8 �Mean (SD) 445.38 250.3595% CI subcost($) 362, 547 183, 331
Hospital nightsn 172 34Mean (SD) 0.2 � 2.1 0.0 � 0.0 �Subcost($) 119.73 0.0095% CI subcost($) 0, 399 0, 0
ED Visitsn 172 34Mean (SD) 0.4 � 1.6 0.1 � 0.3 �Subcost($) 128.99 17.1795% CI subcost($)c 69, 210 0, 57
Mean drug costd 1,984.58 1,640.03 �95% CI subcost($) 1,893, 2,060 1,452, 1,832
Mean direct coste 2,681.84 1,907.55 �95% CI subcost($) 2,388, 3,122 1,696, 2,105
Indirect asthma costsSchool/work days lost
n 154 27Mean (SD) 1.4 � 8.0 1.0 � 5.0 �Subcost($) 247.38 166.0095% CI subcost($) 49, 504 0, 560
Mean indirect cost 247.38 166.0095% CI subcost($) 49, 504 0, 560
Mean total asthma costf 2,959.78 2,043.60 �95% CI cost($) 2,560, 3,486 1,713, 2,480
age recommended daily dose by medication (standard dose t
114
er day) and were not adjusted to account for patient com-liance. All costs were adjusted to 2002 dollars.24
tatistical Methodsemographic and clinical characteristics were stratified by 3roups of asthma impairment (VPC, NWC, and WC) andvaluated by descriptive statistics. P values comparing dif-erences among these groups were computed using �2 testsor categorical variables and analysis of variance for contin-ous variables. Costs were summarized by outcome at eachimepoint by asthma control category. The n, mean, andtandard deviation were reported for each HCU outcome andonverted into costs. Costs were added to mean drug costs toompute the mean total cost estimates, and 95% confidencentervals (CIs) were computed based on 1,000 bootstrap sam-les. Because of the skewed distribution of costs, bootstrapIs are preferred and were computed instead of para-etric CIs.25
Patients were excluded from the cross-sectional analyses ifhe assessment did not occur or if a component of impairmentas missing; patients missing asthma impairment data at any
costs by cross-sectional asthma control statusa
Month 24
ery poorly controlled(n � 120)
Not well controlled(n � 134)
Well controlled(n � 26)
Pb
120 134 268.0 � 8.5 5.0 � 5.5 3.4 � 4.0 �.001
619.04 385.75 261.90504, 740 318, 458 149, 386
120 134 261.8 � 6.0 0.4 � 1.9 0.0 � 0.0 .013
1,348.44 307.38 0.00601, 2,266 97, 593 0, 0
120 134 261.1 � 2.5 0.5 � 1.3 0.1 � 0.4 .003
330.85 130.71 22.46213, 468 75, 208 0, 76
2,298.19 1,994.55 1,605.16 �.0012,174, 2,416 1,882, 2,097 1,355, 1,859
4,596.52 2,815.27 1,889.52 �.0013,691, 5,629 2,491, 3,168 1,607, 2,186
104 122 2424.8 � 59.8 2.8 � 15.5 0.0 � 0.0 �.001
4,277.18 477.58 0.002,445, 6,434 72, 1,014 0, 0
4,277.18 477.58 0.002,445, 6,434 72, 1,014 0, 0
8,879.73 3,308.40 1,861.22 �.0016,623, 11,370 2,764, 3,949 1,571, 2,149
sits and
Pb V
.001
.001
.001
.001
.001
.001
.001
ime were excluded from the longitudinal analysis (see On-
ANNALS OF ALLERGY, ASTHMA & IMMUNOLOGY

2b
TMi(mm(ta
CSAastasmta
bv
line Repository for additional information regarding patientsexcluded from the analysis and lost to follow-up). Patientsexcluded from the analysis were not appreciably differentfrom those included, but were slightly older (10.0 � 1.9 yearsvs 9.4 � 1.8 years; P � .0005) and heavier (43.8 � 17.2 kgvs 40.6 � 16.5 kg; P � .0415).
RESULTS
Patient CharacteristicsBaseline demographics and clinical characteristics for 628eligible children are presented in Table 1. Based on NHLBIcriteria, most children (61.5%) were VPC, fewer were NWC(34.9%), and very few (3.7%) were WC. Children in the VPCgroup were more likely to be obese (P � .001) than childrenin the NWC and WC groups. Children in the VPC group alsohad higher immunoglobulin E (IgE) levels (P � .005), weremore likely to be of nonwhite race/ethnicity (P � .001), tohave greater pulmonary obstruction (FEF25-75; P � .001), andto have had 2 or more steroid bursts in the 3 months beforebaseline (P � .001) than children in the NWC and WCgroups. Patient age, sex, long-term controller use, and med-ication adherence were similar among the 3 groups.
Association of Asthma Impairment Status with BurdenBaseline assessments indicated that the mean number of HCUvisits was significantly greater for the VPC group than for theNWC and WC groups (P � .05; Table 2). The largestdifferences were seen in the mean number of school/workdays lost across asthma control groups, with the VPC groupdemonstrating substantially higher mean number of days lostcompared with the NWC and WC groups (17.9 � 45.4 vs.2.1 � 11.0 vs. 0.0 � 0.0, respectively; P � .001). Thesedifferences persisted at month 12 and month 24.
In general, the number of HCU visits was fewer at eachtimepoint for the 3 asthma control groups, reflecting a trendtoward regression to the mean, likely attributable to theprospective, observational nature of TENOR’s study design.
Direct Asthma CostsGreater impairment was associated with greater cost burden.Increased annual HCU visits in the VPC group reflected ahigher overall mean annual direct cost in this group comparedwith the NWC and WC groups (VPC: $4,983, $4,202,$4,597; NWC: $3,236, $2,682, $2,815; WC: $3,588, $1,908,$1,890; all P � .001) (Table 2, Fig 2). Mean drug costsconsumed the highest portion of the direct costs, with theVPC group incurring the greatest cost: ($2,120, $2,310, and$2,298 at baseline, month 12, and month 24, respectively;P � .001), followed by the NWC group ($1,949, $1,985, and$1,995, respectively; P � .001), and the WC group ($1,861,$1,640, and $1,605, respectively; P � .001).
Indirect Asthma CostsAt baseline, month 12, and month 24, the VPC group exhibited anover 8-fold increase in costs attributable to school/work days lostcompared with NWC patients (VPC: $3,078, $3,118, and $4,277;
P � .001; NWC: $369, $247, $478, respectively P � .001) (Table rVOLUME 107, AUGUST, 2011
, Fig 2). Patients with WC asthma exhibited no or negligible costsecause of school/work days lost.
otal Asthma Costsean annual total asthma costs were more than twice as high
n the VPC group compared with NWC and WC groupsbaseline: $7,846, $3,526, $3,766, respectively (P � .001);onth 12: $7,326, $2,960, $2,044, respectively (P � .001);onth 24: $8,880, $3,308, $1,861, respectively, (P � .001)
Table 2, Fig 2). Indirect costs accounted for almost half theotal costs at baseline and month 12 for VPC asthma patientsnd more than half the total costs at month 24.
hange in Cost Associated with Change in Impairmenttatust each timepoint, significantly lower direct and indirect
sthma costs were observed for patients whose impairmenttatus improved from VPC after baseline and those pa-ients who demonstrated temporary improvement in theirsthma control compared with patients who remained con-istently VPC (Table 3). Significant differences in totalean asthma costs per year were marginally higher be-
ween patients whose asthma control improved temporarilynd those whose asthma control improved from VPC and
Figure 2. Burden of cost in relation to asthma control status. BL indicatesaseline; ER, emergency room; M12, month 12; M24, month 24; and VPC,ery poorly controlled.
emained improved over the course of the study. Patients
115

cc
tt
n use.
who remained consistently VPC exhibited the highest totalmean annual asthma costs compared with those whoseasthma control improved temporarily and those whoseasthma control improved and remained improved fromVPC. Total mean asthma costs appeared to increase over
Table 3. Mean annual number of healthcare utilization visits and cos
Consistently verypoorly
controlled [a](n � 56)
Temporimprovem
(n � 1
Direct asthma costsPhysician visits
n 56Mean (SD) 13.4 � 10.6 8.7 � 1
Subcost($) 1033.58 695% CI subcost($) 845, 1,233 376, 10
Hospital nightsn 56Mean (SD) 2.6 � 8.1 1.3 � 4Subcost($) 1,943.85 995% CI subcost($) 623, 3,637 0, 25
ED visitsn 56Mean (SD) 2.4 � 3.6 0.9 � 2Subcost($) 708.97 295% CI subcost($) 467, 982 0, 5
Mean drug costc 2,474.70 2,1
95% CI cost($) 2,326, 2,626 1,962, 2,3Mean direct costd 6,161.10 4,0
95% CI subcost($) 4,689, 8,081 2,580, 6,2Indirect asthma costs
School days lostn 44Mean (SD) 16.4 � 44.0 0.0 � 0
Subcost($) 2,826.6495% CI subcost($)e 879, 5,466 0
Mean indirect cost 2,826.6495% CI subcost($) 879, 5,466 0
Mean total asthma costf 8,963.77 4,1
95% CI cost($) 6,310, 12,111 2,577, 6,4
Abbreviations: SD, standard deviation; CI, confidence interval; ED, ea Table 3 is based on the number of patients who were either: Conimprovement (n � 18); Burden and associated costs were calculatedb Significance was assessed by Student’s t-test for each pairwise coP-values based on the proportion of bootstrap samples with positivec Drug costs included inhaled corticosteroids, oral/systemic corticosand leukotriene modifiers.f Mean total cost includes variables relating to indirect costs (producticosts of the 2 components do not sum to the total because it is onlye Confidence intervals are based on 1,000 bootstrap samples.d Direct costs include costs from healthcare utilization and medicatio
time for patients who were consistently VPC and to de- g
116
rease for patients who remained improved during theourse of the study.
The difference in total asthma costs was primarily at-ributable to the difference in school/work days lost be-ween the consistently VPC and improved from VPC
ngitudinal asthma control statusa
seline Month 12
Improved fromvery poorly
controlled [c](n � 37)
Pb
[a] vs. [b][a] vs. [c][b] vs. [c]
Consistentlyvery poorly
controlled [a](n � 56)
37 568.4 � 6.3 .10, .012, .92 9.9 � 7.1
652.50 768.27497, 815 626, 900
37 560.0 � 0.0 .51, .050, .052 1.1 � 3.0
0.00 814.310, 0 305, 1430
37 560.4 � 1.6 .088, .002, .38 1.2 � 1.8
126.24 354.490, 292 226, 4942,088.59 �.001, �.001, .63 2,509.31
1,905, 2,259 2,347, 2,6802,867.33 .11, �.001, .27 4,446.38
2,535, 3,192 3,817, 5,211
32 4726.8 � 50.2 .13, .34, .033 13.6 � 43.3
4,621.94 2,336.301,635, 7,794 647, 4,818
4,621.94 2,336.301,635, 7,794 647, 4,818
7,534.49 .012, 0.48, .082 6,977.91
4,508, 10,853 5,055, 9,514
cy department.ly VPC (n � 56), Improved from VPC (n � 37), or had Temporaryar for each measure.
on of units. Significance of costs assessed by computing one-tailednces and multiplying by 2 to obtain a two-tailed P-value.
, short- and long-acting beta agonists, methylxanthines, cromolyns,
s), and direct costs (healthcare utilization and medication use). Meantients with both components.
ts by lo
Ba
aryent [b]8)
180.1
70.6363
18.180.6822
18.259.495645.79
0656.59
28
17.0
0.00, 00.00
, 038.05
46
mergensistentper ye
mparisdiffere
teroids
vity losfor pa
roups.
ANNALS OF ALLERGY, ASTHMA & IMMUNOLOGY

Wsctr
aVmbbnpcr
DISCUSSIONThis is the first analysis to assess the economic burden ofasthma, as defined by the impairment domain of the NHLBIguidelines,18 in children with severe or difficult-to-treatasthma. We observed that greater impairment was associatedwith greater total cost burden. Mean annual total asthma costswere more than twice as high in the VPC group comparedwith the NWC and WC groups, with indirect costs accountingfor approximately half the total costs for VPC asthma pa-tients. Patients with VPC asthma had a higher mean annualnumber of HCU visits compared with NWC and WC groups,reflecting a 2 to 3 times higher overall mean annual directasthma cost in this group. Mean drug costs consumed ap-proximately half the direct costs. At all timepoints, the VPCgroup exhibited a more than 8-fold increase in costs because
Table 3. (Continued) Mean annual number of healthcare utilization vi
Month 12
Temporaryimprovement [b]
(n � 18)
Improved fromvery poorly
controlled [c](n � 37)
P[a] v[a] v[b] v
Direct asthma costsPhysician visits
n 18 37Mean (SD) 4.7 � 3.9 4.4 � 2.9 .004, �
.80Subcost($) 361.11 342.9895% CI subcost($) 232, 500 270, 416
Hospital nightsn 18 37Mean (SD) 0.0 � 0.0 0.0 � 0.0 .12, .0Subcost($) 0.00 0.0095% CI subcost($) 0, 0 0, 0
ED visitsn 18 37Subcost($) 0.1 � 0.5 0.2 � 0.6 .013, .0Mean (SD) 32.44 63.1295% CI subcost($) 0, 103 15, 131
Mean drug costc 2,013.18 1,996.75 �.001.91
95% CI cost($) 1,821, 2,209 1,780, 2,187Mean direct costd 2,406.72 2,402.85 �.001,
.9895% CI subcost($) 2,130, 2,701 2,154, 2,649
Indirect asthma costsSchool days lostn 17 34Mean (SD) 0.0 � 0.0 3.8 � 12.9 .20, .2
Subcost($) 0.00 659.1095% CI subcost($)e 0, 0 0, 1,547
Mean indirect cost 0.00 659.1095% CI subcost($) 0, 0 0, 1547
Mean total asthma costf 2,333.04 3,034.50 �.001,.12
95% CI cost($) 2,079, 2,618 2,239, 4,104
of school/work days lost compared with NWC patients. h
VOLUME 107, AUGUST, 2011
hen examined longitudinally, patients who remained con-istently VPC exhibited the highest total mean annual asthmaosts compared with those whose asthma control improvedemporarily and those whose asthma control improved andemained improved from VPC.
Importantly, we found that indirect costs accounted forlmost half the total costs at baseline and month 12 for thePC asthma patients, and more than half the total costs atonth 24. Although direct costs are most closely scrutinized
y third-party payers, indirect costs should not be overlooked,ecause they appear to be a significant portion of the eco-omic burden of asthma, particularly VPC asthma, in theediatric population. In addition, our measure of indirectosts was based on the number of school/work days lost,eemphasizing the impact of loss of daily activity on the
costs by longitudinal asthma control statusa
Month 24
Consistentlyvery poorly
controlled [a](n � 56)
Temporaryimprovement [b]
(n � 18)
Improved fromvery poorly
controlled [c](n � 37)
Pb
[a] vs. [b][a] vs. [c][b] vs. [c]
56 18 378.4 � 6.9 5.6 � 8.5 4.8 � 4.0 .15, .005, .64
652.20 429.89 368.08511, 793 190, 810 264, 472
56 18 373.3 � 8.3 0.0 � 0.0 0.3 � 1.4 .10, .036, .32
2,390.41 0.00 238.54989, 4,047 0, 0 0, 592
56 18 371.5 � 2.7 0.3 � 0.8 0.5 � 1.1 .079, .035, .60
437.90 97.31 142.02245, 643 0, 209 51, 251
2,450.32 2,146.81 1,909.15 .098, �.001,.25
2,288, 2,625 1,816, 2,447 1,702, 2,106, 5,930.83 2,674.01 2,657.79 �.001, �.001,
.914,269, 7,852 2,237, 3,110 2,198, 3,177
46 18 3520.2 � 52.0 20.2 � 47.7 0.0 � 0.0 .99, .024,
.0143,483.20 3,485.91 0.00
1,131, 6,187 0, 7,712 0, 03,483.20 3,485.91 0.00
1,131, 6,187 0, 7,712 0, 0, 9,399.39 6,159.91 2,640.95 .27, �.001,
.0826,046, 13,237 2,441, 10,684 2,164, 3,197
sits and
b
s. [b]s. [c]s. [c]
.001,
25, —
02, .53
, .002,
�.001
1, .23
�.001
ealthcare system and missed educational opportunities for
117

atWm$wttr
Tacbnosstcaovpfalimmr
ntrttiagladialw
iaarpab
the pediatric population. A recent analysis of Missouri stu-dents (N � 3,812; aged 8–17 years) demonstrated a stronginverse relationship between absenteeism and performance(P � .001) on the Missouri Assessment Program (MAP)test.26 Children absent for a mean of 7 days of the 176-dayschool year achieved a Missouri Assessment Program testlevel of “proficient”; those absent for a mean of 12 daysachieved a level of “below progressing.”
Mean total annual costs for patients whose impairmentstatus improved or temporarily improved after baseline weresignificantly lower compared with patients whose conditionremained very poorly controlled during the study period.Although some of these differences were apparent at base-line, indicating an association and not necessarily a cause-and-effect relationship, the data suggest that even an im-provement from VPC to NWC could result in a reduction ofassociated costs. In fact, the disparity in total costs becamemore evident longitudinally in patients who sustained theirasthma control status, that is, total mean asthma costs ap-peared to increase over time for patients who remained con-sistently VPC and to decrease for patients who remainedimproved during the course of the study, demonstrating along-term reduction in cost burden in patients who maintainimprovement in their asthma control.
Medication costs accounted for nearly half of direct asthmacosts. Indeed, approximately half to two-thirds of pediatricpatients in TENOR were using 3 or more long-term controllermedications. Despite the use of multiple medications in thissevere or difficult-to-treat asthma population, patients con-tinue to experience a high level of morbidity.9 These findingscould mean that physicians treat patients with higher morbid-ity with increased numbers of controller medications; how-ever, they also suggest that the prescribed medications do notprevent morbidity adequately. Nonadherence with increasednumbers of prescribed medications cannot be excluded, how-ever. Although we attempted to capture medication compli-ance in this analysis, no direct measure was made of medi-cation adherence in TENOR. Thus, we relied on a proxy fromthe self-reported ATAQ, which indicated that medicationadherence was high in children and adolescents. Still, inchildren, low adherence often has been noted in self-reportedassessments and in assessments submitted by their par-ents.27-29 We recommend close monitoring of the 6- to 12-year age group in their asthma management program toreinforce adherence to medication. Assessments should in-clude pulmonary function tests and asthma questionnaires(eg, the Asthma Control Test)30 and should be performedfrequently. Recently, 85% of children who actively partici-pated in a comprehensive structured program of regularasthma care achieved asthma control within 6 visits.31
Overall, total asthma costs in children are higher than thosein adults. Although the findings in the current analysis are notdirectly comparable to those in adults with severe or difficult-to-treat asthma (different impairment criteria were used),8 ourdata suggest that improvement of asthma control may have
greater impact on total cost reduction in children than in f118
dults. In the adult analysis, mean total costs were consis-ently approximately 2-fold greater for the VPC than for the
C impairment group at baseline ($5,964 vs $2,422), 12onths ($4,530 vs $2,410), and 24 months ($4,046 vs
2,194). In contrast, the total costs in our pediatric analysisere also approximately 2-fold greater for the VPC than for
he WC impairment group at baseline ($7,846 vs $3,766), buthis difference increased to 4- and 5-fold at 12 and 24 months,espectively ($7,326 vs $2,044 and $8,880 vs $1,861).
Although the sample size and breadth of variables inENOR provided a unique, real-world opportunity to analyzen array of clinical and patient-reported outcomes within theontext of the NHLBI guidelines, our evaluation of economicurden has inherent limitations. Lost school/work time wasoted to be a large component of cost in our study. Becausef the challenges in “fixing” a cost for a child not attendingchool (including missed education) for 1 day, this measurehould be interpreted with caution. Namely, one could arguehat parents of these children may not be working or mayontinue to go to work even if the child misses school. Inddition, the reported number of school days lost reflectednly the 7-day period immediately preceding each annualisit. Because we did not have complete information onarent occupation and missed work because of sick children,urther study is warranted. Other limitations include the rel-tively small sample size of the asthma control groups for theongitudinal analysis, particularly patients who temporarilymproved, the inability to directly measure or adjust foredication compliance, possibly inflating the reported cost ofedications, and the introduction of recall bias with self-
eport of HCU data.An objective of TENOR has been to understand the unmet
eeds of patients with severe or difficult-to-treat asthma. Tohis end, data from pediatric asthma patients in TENOR haveevealed high rates of HCU and loss of lung function despitereatment with long-term controllers,9 and have demonstratedhat consistently poorly controlled asthma, as defined by thempairment domain of the 2007 NHLBI asthma guidelines, is
robust predictor of future severe exacerbations in this ageroup.32 Furthermore, consistently VPC children are lessikely to have private insurance, more likely to be treated by
pulmonologist, more likely to have a history of atopicermatitis, and tend to take more long-term controller med-cations than patients improved from VPC.33 The currentnalysis provides further insight into this underserved popu-ation of children and highlights the burden of cost associatedith inadequate asthma control.In summary, our report indicates a direct association of
ncreased asthma impairment with increased total cost andsthma burden in children with severe or difficult-to-treatsthma. Also, improvement in asthma control and associatededuced impairment results in lower total costs. Cost ofarent productivity loss attributable to school/work days lostnd medication use are the largest contributors to this costurden. These findings emphasize the importance of identi-
ying and monitoring children with VPC asthma, vis-a-vis theANNALS OF ALLERGY, ASTHMA & IMMUNOLOGY

1
1
2
2
2
2
2
2
2
2
2
2
3
3
3
3
3
RTG1S
increased likelihood for obesity, high IgE, and poorer lungfunction in this group, to reduce impairment and, ultimately,total costs of care. Attention to better management strategiesincluding careful monitoring of control and adherence, aswell as the identification of new medications are needed toreduce asthma burden in this population of children.
SUPPLEMENTARY DATASupplementary data associated with this article can be found,in the online version, at doi:10.1016/j.anai.2011.04.008.
REFERENCES1. Bousquet J, Bousquet PJ, Godard P, Daures J-P. The public health
implications of asthma. Bull World Health Organ. 2005;83:548–554.2. Jenkins HA, Cherniack R, Szefler SJ, Covar R, Gelfand EW, Spahn JD.
A comparison of the clinical characteristics of children and adults withsevere asthma. Chest. 2003;124:1318–1324.
3. Bloom B, Dey AN, Freeman G. Summary health statistics for U.S.children: National Health Interview Survey, 2005. Vital Health Stat 10.2006;231:1–84.
4. Simon AE, Chan KS, Forrest CB. Assessment of children’s health-related quality of life in the United States with a multidimensional index.Pediatrics. 2008;121:e118–e126.
5. Barnett SB, Nurmagambetov TA. Costs of asthma in the United States:2002-2007. J Allergy Clin Immunol. 2011;127:145–152.
6. Smith DH, Malone DC, Lawson KA, Okamoto LJ, Battista C, SaundersWB. A national estimate of the economic costs of asthma. Am J RespirCrit Care Med. 1997;156:787–793.
7. Godard P, Chanez P, Siraudin L, Nicoloyannis N, Duru G. Costs ofasthma are correlated with severity: a 1-yr prospective study. Eur RespirJ. 2002;19:61–67.
8. Sullivan SD, Rasouliyan L, Russo PA, Kamath T, Chipps BE; TENORStudy Group. Extent, patterns, and burden of uncontrolled disease insevere or difficult-to-treat asthma. Allergy. 2007;62:126–133.
9. Chipps BE, Szefler SJ, Simons FER, et al. Demographic and clinicalcharacteristics of children and adolescents with severe or difficult-to-treat asthma. J Allergy Clin Immunol. 2007;119:1156–1163.
10. Ungar WJ, Coyte PC. Prospective study of the patient-level cost ofasthma care in children. Pediatr Pulmonol. 2001;32:101–108.
11. Herjavecz I, Nagy GB, Gyurkovits K, et al. Cost, morbidity, and controlof asthma in Hungary: the Hunair Study. J Asthma. 2003;40:673–681.
12. Weinmann S, Kamtsiuris P, Henke KD, Wickman M, Jenner A, WahnU. The costs of atopy and asthma in children: assessment of direct costsand their determinants in a birth cohort. Pediatr Allergy Immunol.2003;14:18–26.
13. Beyhun NE, Soyer OU, Kuyucu S, et al. A multi-center survey ofchildhood asthma in Turkey—I: the cost and its determinants. PediatrAllergy Immunol. 2009;20:72–80.
14. Sun HL, Kao YH, Lu TH, Chou MC, Lue KH. Health-care utilizationand costs in Taiwanese pediatric patients with asthma. Pediatr Int.2007;49:48–52.
15. To T, Dell S, Dick P, Cicutto L. The burden of illness experienced byyoung children associated with asthma: a population-based cohort study.J Asthma. 2008;45:45–49.
16. Dolan CM, Fraher KE, Bleecker ER, et al. Design and baseline charac-teristics of the epidemiology and natural history of asthma: Outcomesand Treatment Regimens (TENOR) study: a large cohort of patients withsevere or difficult-to-treat asthma. Ann Allergy Asthma Immunol. 2004;92:32–39.
17. Sullivan SD, Wenzel SE, Bresnahan BW, et al; for the TENOR StudyGroup. Association of control and risk of severe asthma-related events in
VOLUME 107, AUGUST, 2011
8. National Heart, Lung, and Blood Institute, National Asthma Educationand Prevention Program. Expert Panel Report 3: Guidelines for theDiagnosis and Management of Asthma. Full Report 2007. Bethesda,MD: U.S. Department of Health and Human Services, National Institutesof Health; 2007. Publication 97-4051.
9. Juniper EF, Guyatt GH, Feeny DH, Ferrie PJ, Griffith LE, Townsend M.Measuring quality of life in children with asthma. Qual Life Res.1996;5:35–46.
0. American Thoracic Society. Standardization of spirometry. 1994 update.Am J Respir Crit Care Med. 1995;152:1107–1136.
1. Asthma Therapy Assessment Questionnaire (ATAQ). Whitehouse Sta-tion, NJ: Merck & Co., Inc.; 2008.
2. Chen H, Blanc PD, Hayden ML, Bleecker ER, Chawla A, Lee JH.Assessing productivity loss and activity impairment in severe or diffi-cult-to-treat asthma. Value Health. 2008;11:231–239.
3. Grosse S. Productivity loss tables. In: Haddix A, Teutsch S, Corso P,eds. Prevention Effectiveness. 2nd ed. New York: Oxford UniversityPress; 2003;245–257.
4. Databases, Tables & Calculators by Subject. CPI Inflation Calendar.United States Department of Labor, Bureau of Labor Statistics Website.Available at http://www.bls.gov/data/inflation_calculator.htm. AccessedMarch 4, 2011.
5. Lord J, Asante MA. Estimating uncertainty ranges for costs by thebootstrap procedure combined with probabilistic sensitivity analysis.Health Econ. 1999;8:323–333.
6. Moonie S, Sterling DA, Figgs LW, Castro M. The relationship betweenschool absence, academic performance, and asthma status. J Sch Health.2008;78:140–148.
7. Bender B, Wamboldt FS, O’Connor SL, et al. Measurement of chil-dren’s asthma medication adherence by self report, mother report, can-ister weight, and Doser CT. Ann Allergy Asthma Immunol. 2000;85:416–421.
8. Jentzsch NS, Camargos PA. Methods of assessing adherence to inhaledcorticosteroid therapy in children and adolescents: adherence rates andtheir implications for clinical practice. J Bras Pneumol. 2008;34:614–621.
9. Milgrom H, Wamboldt F, Bender B. Monitoring adherence to thetherapy of asthma. Curr Opin Allergy Clin Immunol. 2002;2:201–205.
0. Nathan RA, Sorkness CA, Kosinski M, et al. Development of the asthmacontrol test: a survey for assessing asthma control. J Allergy ClinImmunol. 2004;113:59–65.
1. Jones CA, Clement LT, Morphew T, et al. Achieving and maintainingasthma control in an urban pediatric disease management program: theBreathmobile Program. J Allergy Clin Immunol. 2007;119:1445–1453.
2. Haselkorn T, Zeiger RS, Chipps BE, Mink DR, Szefler SJ. Recentasthma exacerbations predict future exacerbations in children with se-vere or difficult-to-treat asthma. J Allergy Clin Immunol. 2009;124:921–927.
3. Haselkorn T, Fish JE, Zeiger RS, et al; for the TENOR Study Group.Consistently very poorly controlled asthma, as defined by the impair-ment domain of the Expert Panel Report 3 guidelines, increases risk forfuture severe asthma exacerbations in The Epidemiology and NaturalHistory of Asthma: Outcomes and Treatment Regimens (TENOR) study.J Allergy Clin Immunol. 2009;124:895–902.
4. Kuczmarski RJ, Ogden CL, Guo SS, et al. 2000 CDC growth charts forthe United States: methods and development. Vital Health Stat 11.2002;246:1–190.
equests for reprints should be addressed to:mirah Haselkorn, PhDenentech, Inc.DNA Way, MS 58B
outh San Francisco, CA 94080
severe or difficult-to-treat asthma patients. Allergy. 2007;62:655–660. e-mail: [email protected]119

R1
categ
eMethodsPatients were excluded from the cross-sectional analyses only if theassessment did not occur (12 months, n � 205; 24 months, n �325) or if a component of impairment was missing at the assess-ment (baseline, n � 139; month 12, n � 180; month 24, n � 162).Patients were excluded from the longitudinal analysis if they werenot in the consistently very poorly controlled group or the improvedfrom very poorly controlled group. In addition, patients who weremissing the outcome variable of interest for a time point wereexcluded from that calculation.
Of the children in the very poorly controlled group at baseline(n � 386), 282 (73.4%) and 228 (59.4%) remained in the studyat 12 and 24 months, respectively; of the children in the not wellcontrolled group at baseline (n � 219), 167 (76.3%), and 131(59.8%) remained at 12 and 24 months, respectively; and of thechildren in the well controlled group at baseline (n � 23), 17(73.9%) and 13 (56.5%) remained at 12 and 24 months,
eTable 1. National Heart, Lung, and Blood Institute (NHLBI) impairme
Assessment ofimpairment
Classification of asthma c
Well controlled Not wel
Symptoms �2 d/wk but not morethan once daily
�2 d/wk oon �2 d/
Nighttime awakenings �1 time/mo �2 time/mInterference with normal
activityNone Some limita
Short-acting �2-agonist usefor symptom control
�2 d/wk �2 d/wk
FEV1 or peak flow �80%predicted/personalbest
60%–80%Predicted
FEV1/FVC �80% 75%
FEV1 indicates forced expiratory volume in 1 second; FVC, forced vitStandardized Activities.a National Heart, Lung, and Blood Institute, National Asthma EducaDiagnosis and Management of Asthma. Full Report 2007. Publicationb For this study, items numbered 4, 10, 12, 14, 18, and 23 from the pwere used to determine the Symptom component of the impairment daged 6-12 years. Similarly, items numbered 16 and 20 were used to d22 were used to determine the Normal Activities Interference componthe last week did you feel out of breath because of your asthma?” o7-point ordinal scale with 1 corresponding to either “All of the time” o“Not bothered.” A symptom component score of 1 or 2 (“Extremely overy poorly controlled category (“Throughout the day”); 3 (“Quite botdays per week”); 4, 5, 6, or 7 (“Somewhat, A bit, Hardly at all, or Nothe well controlled category (“Less than or equal to 2 days per weekbothered” and “All or Most of the time”) was used to approximate the v3 or 4 (“Quite or Somewhat bothered” and “Quite often or Some of thper month”); 5, 6, or 7 (“A bit, Hardly at all, or Not bothered” and “On(“Less than or equal to 1 time per month”). A normal activity interferencof the time”) was used to approximate the very poorly controlled catebothered” and “Quite often, Some of the time, Once in a while, or Ha(“Not bothered” and “None of the time”) the well controlled category (“beta agonist use and lung function components, patients were assignfor each patient was assigned based on the most severe impairment
respectively.
119.e1
EFERENCE. National Heart, Lung, and Blood Institute, National Asthma Education
and Prevention Program. Expert Panel Report 3: Guidelines for theDiagnosis and Management of Asthma. Full Report 2007. Publication97-4051. Bethesda, MD: National Institutes of Health; 2007.
essment of asthma control in patients 5 to 11 years of agea
(Children 5–11 years)TENOR assessment (patients
6–12 years)olledVery poorlycontrolled
le times Throughout the day
PAQLQ(S)b�2 time/wkExtremely limited
Several times daily Medication use
nal best�60% Predicted/
personal best�75%
Spirometry
�75%
city; PAQLQ(S), Pediatric Asthma Quality-of-Life Questionnaire with
nd Prevention Program. Expert Panel Report 3: Guidelines for the51. Bethesda, MD: National Institutes of Health; 2007.reported Pediatric Asthma Quality of Life Questionnaire [PAQLQ(S)]of the 2007 NHLBI guidelines definition of asthma control in childrene the Nighttime Awakenings component, and items 1, 3, 13, 19, andtients responded to questions such as “In general, how often duringbothered have you been during the last week by wheezing?” on a
emely bothered” and 7 corresponding to either “None of the time” orothered” and “All or most of the time”) was used to approximate theand “Quite often”) the not well controlled category (“Greater than 2red” and “Some, Once in a while, Hardly any, or None of the time”)ighttime awakening component score of 1 or 2 (“Extremely or Veryorly controlled category (“Greater than or equal to 2 times per week”);”) the not well controlled category (“Greater than or equal to 2 timeswhile, Hardly any, or None of the time”) the well controlled categoryponent score of 1 or 2 (“Extremely or Very bothered” and “All or MostExtremely limited”); 3, 4, 5, or 6 (“Quite, Somewhat, A Bit, or Hardlyy of the time”) the not well controlled category (“Some limitation”); 7tation”). For each of these components, as well as for the short acting1 of the 3 asthma control categories. Overall level of asthma controlory.
nt ass
ontrol
l contr
r multipwkotion
/perso
–80%
al capa
tion a97-40atient-omaineterminent. Par “Howr “Extrr very bhered”t bothe”). A nery poe timece in ae comgory (“rdly anNo limied to
ANNALS OF ALLERGY, ASTHMA & IMMUNOLOGY