Embed Size (px)
Citation preview

SURVEY OF HOUSEHOLD FINANCES (EFF) 2008: METHODS, RESULTS AND CHANGES
SINCE 2005

BANCO DE ESPAÑA 91 ECONOMIC BULLETIN, JULY 2011 SURVEY OF HOUSEHOLD FINANCES (EFF) 2008: METHODS, RESULTS AND CHANGES SINCE 2005
SURVEY OF HOUSEHOLD FINANCES (EFF) 2008: METHODS, RESULTS AND CHANGES
SINCE 2005
The Spanish Survey of Household Finances (“EFF” by its Spanish acronym) is a survey by
the Banco de España which allows the linking of income, assets, debt and spending of
each household unit. The third edition of the EFF (EFF2008), referring to the end of the first
quarter of 2009, has been designed to give continuity to this statistical source, from which
data were collected for the first time in 2002 and subsequently in 2005. The EFF2008 up-
dates the information on household finances and thus allows an assessment of the chang-
es in the financial position of Spanish households in the period from the end of 2005 to the
end of the first quarter of 2009 (2009 Q1), while offering a more up-to-date picture of the
structure of household assets and debts.
The usefulness of the information contained in a survey such as the EFF has prompted
the system of euro area central banks to decide to conduct a financial survey in all the
euro area countries, following a methodology similar to that of the EFF. Thus the EFF2008
will allow a harmonised comparison with the new European surveys of the financial posi-
tion of households.
An important characteristic of the three editions of the EFF is that their samples contain a
large number of high-wealth households. Since the distribution of wealth is heavily skewed
and some types of asset are only held by a small fraction of the population, in the absence
of very large samples, it is important to oversample the wealthiest households. This is what
the EFF does, to ensure that its sample is representative not only of the population as a
whole, but also of the aggregate wealth of the economy, in order to facilitate the study of
financial behaviour at the top of the wealth distribution.
Another important characteristic of the EFF is that, from the second edition onwards,
some of the households that participated in previous editions have been re-interviewed,
while a refreshment sample has been incorporated to preserve the representativeness of
the overall sample. Thus, the EFF2002, EFF2005 and EFF2008 samples contain a common
sub-set of households that can be observed at various points in time, considerably ex-
panding the possibilities for analysing the nature of the changes observed.
These characteristics (which are highly desirable for a survey of this kind) have been ob-
tained by means of a system of blind collaboration with the National Statistics Institute
(“INE” by its Spanish acronym) and the tax authorities (TA), which respects strict tax con-
fidentiality requirements and response anonymity. However, first and foremost, we are
most grateful for the generosity of the households that have participated in this project,
especially those that have participated in various waves of the EFF.
This article describes the results of the EFF2008 and the changes observed in the financial
position of households between 2005 and 2009 Q1.1 It also contains a box summarising
the main methodological characteristics of the EFF2008 (see Box 1), which are described
in more detail in Bover (2011). The first section reviews some important aspects of the
socio-economic background to the period from 2005 to 2009 Q1. The second section
Introduction
1 For this purpose the tables referring to the financial position of households at the end of 2009 Q1 and those refer-
ring to 2005 have both been included, the variables relating to the value of assets, debt, income and spending
being expressed in March 2009 euro in both cases. Tables 1.A and 1.B on income and net wealth provide, in
addition, information relating to 2002 in March 2009 euro.

BANCO DE ESPAÑA 92 ECONOMIC BULLETIN, JULY 2011 SURVEY OF HOUSEHOLD FINANCES (EFF) 2008: METHODS, RESULTS AND CHANGES SINCE 2005
Questionnaire
The EFF questionnaire is divided into nine main sections, reflect-
ing the variables studied, which are as follows:
1 Demographics
2 Real assets and their associated debts
3 Other debts
4 Financial assets
5 Pension plans and insurance
6 Labour market status and related income
7 Non-labour income in the previous calendar year (2007)
8 Means of payment
9 Consumption and savings
The questions on assets and debts refer to the household as a
whole, while those on labour market status and related income are
for each household member over the age of 16. Most of the infor-
mation relates to the time of the interview, although information is
also collected on all pre-tax income in the calendar year prior to
the Survey, i.e., in this case, 2007. The information was collected
by means of personal interviews with the households, conducted
between November 2008 and June 2009. Given the data collec-
tion schedule, the period covered by the Survey is up to the end of
2009 Q1. Owing to the complexity of the questionnaire, the inter-
views were computer-assisted.
Sample design
As in the second edition of the EFF, the design of the third edi-
tion had two main objectives. First, to maintain the same quality
characteristics, in particular, to provide a representative sample
of the population with oversampling of wealth. Second, there
was a desire that part of the 2008 sample should be longitudinal,
i.e. that it should include households that participated in the
second edition (and sometimes in the first edition). To achieve
these aims, a refreshment sample was designed to supplement
the longitudinal component (in order to make a total sample of
7,000 households) and to ensure that, when used in combina-
tion with the longitudinal one, the overall sample should satisfy
the representativeness and oversampling requirements. This
sample was achieved thanks to the collaboration of the National
Statistics Institute (INE) and the tax authorities (TA), through a
complex coordination mechanism that enabled strict confidenti-
ality and anonymity requirements to be observed at all times.
Specifically, the TA devised a wealth strata-based random sam-
ple, additional to the longitudinal sample, drawing on the Padrón
Continuo (a continuously updated municipal population census)
provided by the INE, following the guidelines of the sample de-
sign prepared by the latter. This ensures the representativeness
of the information obtained, while securing accurate information
on the behaviour of the richest household segment and includ-
ing a longitudinal component. A complex procedure for replac-
ing non-respondent households was incorporated into the sam-
ple design, thus ensuring the maintenance of the sample’s desir-
able characteristics.
Interviews
The total number of valid interviews was 6,197, of which 3,967 cor-
responded to households who participated in the EFF2005. Of
these 3,967 households, 1,925 have participated since 2002 and
2,042 since 2005. The percentage of households that could not be
contacted accounted for 5.4% of the total, and the cooperation rate
was, overall, 61.9%.1 This rate diminishes as the wealth stratum
rises. However, for the longitudinal component the collaboration
rate is 76.6%, with no significant reductions at the highest wealth
strata. Overall, the degree of oversampling in the final sample is
satisfactory. For example, the highest percentile of the wealth distri-
bution is represented in the EFF2008 sample by 587 households. In
the absence of oversampling, and if the response rate were uniform
across the different strata, scarcely 62 households might be expect-
ed at best in this percentile, which would hamper statistical analysis
of the population segment in which the most complex financial de-
cisions are concentrated. Finally, the quality tests carried out using
the information contained in other national statistics and similar sur-
veys carried out in other countries give satisfactory results.
Weights and imputation
To obtain magnitudes representative of the population, use is made
of weights, i.e. the frequency with which households in the sample
are to be found in the total household population. To calculate the
weights, account is taken mainly of the characteristics of the sample
design, but various adjustments are made, in particular to reflect the
different response rate by income and wealth level.
The lack of a reply to certain questions is an inherent characteristic
of wealth surveys. This type of non-response arises when a house-
hold agrees to reply to the Survey but leaves one or several ques-
tions unanswered, owing to a lack of knowledge or to other rea-
sons. Any analysis based exclusively on cases with fully completed
questionnaires might bias the results substantially. Consequently,
the Banco de España has devised a system of imputations for the
non-observed values to facilitate data analysis. These imputations
are based on advanced statistical techniques, with several esti-
mates being obtained for each non-observed value so as to take
into account the uncertainty associated with the imputation.2 The
statistics of interest are obtained by combining the information on
these multiple imputations.3
BOX 1THE DATA USED: EFF2008 METHODS
1 The cooperation rate is defined as the ratio of the number of completed
interviews to the sum of the number of completed interviews and the
number of refusals to participate.
2 Five imputations are provided in the EFF for each non-observed value.
3 The data presented in this report will foreseeably be revised slightly
upon conclusion of the process of imputation of the EFF variables not
used in the compilation of the report.

BANCO DE ESPAÑA 93 ECONOMIC BULLETIN, JULY 2011 SURVEY OF HOUSEHOLD FINANCES (EFF) 2008: METHODS, RESULTS AND CHANGES SINCE 2005
presents the results for household income and net wealth. The third section analyses
households’ holdings of real and financial assets. The fourth section provides information
on the debt and debt burden of households. The fifth section focuses on aspects relating
to household spending. Finally, the sixth section contains some concluding remarks.
The distributions of most of the important variables, such as those relating to the vari-
ous assets and debts, have very high values for a relatively small number of house-
holds. Typical values of the distribution are therefore better approximated by the me-
dian than by the mean, so this is the statistic included in the tables. All the variables
relating to income, wealth, debt and spending levels are expressed in real terms. More
specifically, all euro amounts have been expressed in March 2009 euro using the con-
sumer price index (CPI).2
Following an expansionary phase that lasted more than a decade, during 2007 economic
activity took a decelerating path, which gave way to a sharp adjustment in 2008 that per-
sisted with particular virulence in the first half of 2009. Although the annual average growth of
GDP in 2008 was still positive (0.9%), the year ended with a decrease of 1.4% in year-on-year
terms and at the end of 2009 Q1 the fall in output amounted to 3.5%. The adjustment was
very sharp also in the labour market. The unemployment rate reached 11.3% of the labour
force in 2008, rising to 18% in the first half of 2009, following the historical low of 8% in the
middle months of 2007. The inflation rate measured in terms of the CPI was 2.8% on average
for the period 2006-2008, with rates near -1% being recorded in the first half of 2009. In 2008
Q4 there were also significant falls in asset values. All these changes, which are reflected in
the data of the EFF2008, are important when it comes to interpreting the Survey. In particular,
the Survey was conducted at a time when, although the effects of the crisis were already
clearly apparent in the behaviour of the financial and confidence indicators, the effects of the
growing unemployment and the changes in disposable income, which move more gradually,
cannot yet be appreciated in all their magnitude in the EFF data.3
Following the sustained rises between 2005 and mid-2008, interest rates took a downward
path in late 2008 which continued throughout the following year. Household wealth de-
creased as a result of the fall-off in financial asset values, particularly stock market prices,4
and of the downward revision of households’ residential asset values. The slowing path of
house prices initiated in 2005 became more firmly established, the growth rate standing at
5.8% in 2007, 0.7% in 2008 and -8.3% in mid-2009. Additionally, the housing stock in-
creased by more than 2.3 million units between end-2005 and end-2008 (representing an
increase of 9.7% with respect to the number of houses in 2005), as a result of the comple-
tion of projects started in the previous years of expansion.
Between end-2005 and end-2008 the population resident in Spain grew by around 4.6%,
an increase explained basically by a rise of 36.3% in the foreign population.5 However, this
contribution ceased in 2009 with the reduction in migrant inflows: the year-on-year in-
crease in the foreign population in 2009 was 1.1%, compared with an annual average
growth rate of 11% in the period 2005-2008. The number of foreign residents in Spain in-
creased from 4.1 million at 1 January 2006 to 5.6 million at 1 January 2009. As a result of
Socio-economic
background
2 To adjust assets and debts to March 2009 euro, the EFF2005 data were multiplied by 1.0738 and the EFF2002
data by 1.1791. To adjust household income for the calendar year prior to the Survey to March 2009 euro, the
factors applied were 1.2262 for 2002, 1.1135 for 2005 and 1.0040 for 2008.
3 In this respect, it should be noted that, in any event, the household annual income stated in the EFF2008 refers
to 2007.
4 The Madrid Stock Exchange General Index fell by 29% in the period from 2005 to 2009 Q1.
5 Population data are drawn from the Municipal Census (Padrón de Habitantes).
BANCO DE ESPAÑA 94 ECONOMIC BULLETIN, JULY 2011 SURVEY OF HOUSEHOLD FINANCES (EFF) 2008: METHODS, RESULTS AND CHANGES SINCE 2005
this increase, the share of foreigners in the total population rose from 9.3% at the begin-
ning of 2006 to 12.1% and the end of 2008.
In the period 2005-2008 some of the demographic factors which drove the creation of new
households in the expansionary phase continued to persist, such as the reduction in the
average size of households,6 marital separations7 and, albeit to a lesser degree, migrant
inflows. In fact, the rate of creation of new households (around 450,000 per year) was
considerably higher than the population growth rate, although lower than between 2002
and 2005. According to the Encuesta de Condiciones de Vida (Survey of Income and Liv-
ing Conditions ), the number of households increased by 9.5% in the period 2005-2008.8
In this period, apart from increasing in number, households also changed in composition.
Specifically, the relative increase in the number of one- or two-member households con-
tinued (from 44.4% to 47.8% of households), but the weight of three-member households
also increased (from 23.9% to 25.3%). The relative importance of younger households
declined (from 15.3% to 13.3%), the relative weight of these households standing below
that in 2002 (14%) and the weight of older households increased. Regarding these chang-
es, the EFF shows that, between 2005 and 2009 Q1 there was an increase in the percent-
age of households in which offspring above age 30 lived (from 8.5% to 9.7% for total
households), particularly among households headed by a person above age 64 (from
18.9% to 20.9%). Finally, the proportion of households made up of foreigners continued to
increase (from 5.7% to 6.6%), although more slowly than between 2002 and 2005.9
According to the EFF2008, the average income of Spanish households as at end-2007 is
€33,600 while their median income is €26,000 (see Table 1.A).11 The patterns in the income
distribution are as one would expect. By age group, average and median income vary ac-
cording to the life cycle, increasing with age, peaking for households within the 45 to
54-year-old segment, and declining thereafter for the older groups. Income also increases
with level of education, being substantially higher in the case of households whose heads
have a university education. As regards labour market status, households whose heads
are self-employed have the highest incomes.
Compared with the 2005 figures, household real median income increased by 5.3%, while
average income remained practically unchanged.12, 13 This behaviour for total households
is the result of increases in the income per household –both the median and the average–
for households in the bottom six deciles of the income distribution and of decreases for
the top 20% of households by income. There are also decreases in the median and the
average for households in the highest decile of the wealth distribution. By age group, the
highest increases are in households whose head is above age 64.
Household income and
wealth10
INCOME
6 According to the EFF, the average number of members per household was 2.68 in 2009 Q1, compared with 2.79
in 2005 and 2.94 in 2002.
7 During the period 2005-2008 an average of 134,000 separation or divorce rulings were registered each year.
8 According to the EFF, the number of households increased by 9.3% in the period 2005-2009 Q1 and by 11.4%
in the period 2002-2005.
9 These figures relate to the EFF2005 and the EFF2008. According to this same source, the percentage of house-
holds headed by a foreigner in 2002 was 3.8%.
10 The measure of household income used in this report is the total gross income of the household (including the in-
come from employment and other income of all its members), i.e. before taxes and social-security contributions, for
the whole of the calendar year prior to the Survey, which for the EFF2008 is 2007 and for the EFF2005 is 2004.
11 That is to say, 50% of households have an income of more than €26,000 and 50% less.
12 The difference in average income comes within the Survey’s error margin, which is defined as twice the stand-
ard error.
13 The change in average income between the EFF2008 and the EFF2005 is consistent with that deriving from the
comparison of National Accounts data for these years.

BANCO DE ESPAÑA 95 ECONOMIC BULLETIN, JULY 2011 SURVEY OF HOUSEHOLD FINANCES (EFF) 2008: METHODS, RESULTS AND CHANGES SINCE 2005
EFF2002 EFF2005 EFF2008
Household characteristics % of households Median Mean % of households Median Mean % of households Median Mean
ALL HOUSEHOLDS 100.0 27.1 35.9 100.0 24.7 33.9 100.0 26.0 33.6
(0.5) (a) (0.6) (0.5) (0.8) (0.6) (0.9)
INCOME PERCENTILE
Less than 20 20.0 9.3 9.1 20.0 7.4 7.0 20.0 8.0 8.1
Between 20 and 40 20.0 18.0 18.1 20.0 15.6 15.7 20.0 16.7 16.8
Between 40 and 60 20.0 27.1 27.3 20.0 24.6 24.6 20.0 25.9 25.8
Between 60 and 80 20.0 39.9 40.5 20.0 36.5 37.1 20.0 36.7 37.1
Between 80 and 90 10.0 58.7 59.3 10.0 54.8 55.1 10.0 52.1 52.8
Between 90 and 100 10.0 91.4 109.9 10.0 90.7 114.4 10.0 80.8 106.7
AGE OF HOUSEHOLD HEAD (b)
Under 35 14.0 29.0 33.7 15.3 24.7 30.6 13.3 26.6 31.2
35-44 22.1 29.9 37.4 21.5 28.6 38.4 22.1 29.9 35.6
45-54 19.7 35.4 47.0 20.1 33.2 42.7 20.5 31.3 42.4
55-64 16.5 31.6 43.0 16.2 30.1 42.4 16.4 31.8 42.4
65-74 17.1 20.3 27.5 16.5 16.9 23.6 15.0 18.8 24.9
Over 74 10.5 12.8 17.9 10.4 10.9 15.1 12.7 12.0 16.9
LABOUR MARKET SITUATION OF HOUSEHOLD HEAD
Employee 45.7 33.2 42.3 47.4 30.7 39.7 43.9 31.7 39.5
Self-employed 11.4 38.1 50.5 10.6 36.7 53.2 10.9 36.6 53.1
Retired 25.4 20.6 28.3 25.5 16.9 23.6 24.2 17.9 25.7
Other inactive or unemployed 17.5 15.2 20.8 16.5 12.8 20.8 20.9 14.8 20.1
LEVEL OF EDUCATION OF HOUSEHOLD HEAD
Below secondary education 58.8 21.5 27.5 57.6 19.1 24.0 58.4 19.6 24.2
Secondary education 26.0 31.7 39.7 25.2 30.2 37.7 25.4 30.6 37.6
University education 15.2 47.3 62.0 17.2 46.4 61.2 16.2 45.3 60.7
STATUS OF MAIN RESIDENCE
Ownership 81.9 28.8 38.0 81.3 26.2 36.4 82.7 27.0 35.2
Other 18.1 21.8 26.7 18.7 18.3 23.0 17.3 21.1 25.8
NUMBER OF HOUSEHOLD MEMBERS WORKING
None 28.8 13.4 16.9 29.1 12.0 16.6 32.4 13.1 17.0
One 38.4 27.1 34.3 32.5 22.2 28.6 30.6 26.0 31.5
Two 26.9 41.9 51.9 30.8 37.1 49.8 31.1 37.2 46.6
Three or more 5.9 54.5 66.7 7.6 47.9 58.0 5.9 46.7 66.0
NUMBER OF HOUSEHOLD MEMBERS
One 15.2 11.6 15.8 16.6 10.6 14.4 18.3 10.4 15.6
Two 25.7 21.3 27.5 27.8 20.3 27.3 29.5 22.4 30.1
Three 24.3 30.8 38.6 23.9 30.5 38.8 25.3 30.1 36.3
Four 24.3 36.3 47.2 24.9 33.7 45.4 21.3 35.2 47.8
Five or more 10.6 42.2 53.7 6.8 39.6 48.7 5.4 39.0 44.5
NET WEALTH PERCENTILE
Less than 25 25.0 19.9 23.3 25.0 16.4 20.2 25.0 19.5 23.0
Between 25 and 50 25.0 22.9 28.0 25.0 21.0 25.2 25.0 21.2 24.4
Between 50 and 75 25.0 29.2 34.8 25.0 26.1 32.5 25.0 26.4 31.5
Between 75 and 90 15.0 36.9 45.3 15.0 36.1 42.7 15.0 36.2 43.6
Between 90 and 100 10.0 59.5 76.1 10.0 55.7 80.0 10.0 48.7 72.9
HOUSEHOLD INCOME Distribution by household characteristics TABLE 1.A
% and thousands of 2009 Q1 euro
SOURCE: Banco de España.
a Bootstrap standard errors in brackets.b This report designates a household head as a means of organising the data consistently. The reference person designated by the household for the purposes of
replying to the Survey is de ned as the household head if the reference person is a man, or the partner if the reference person is a woman and her partner lives in the household.

BANCO DE ESPAÑA 96 ECONOMIC BULLETIN, JULY 2011 SURVEY OF HOUSEHOLD FINANCES (EFF) 2008: METHODS, RESULTS AND CHANGES SINCE 2005
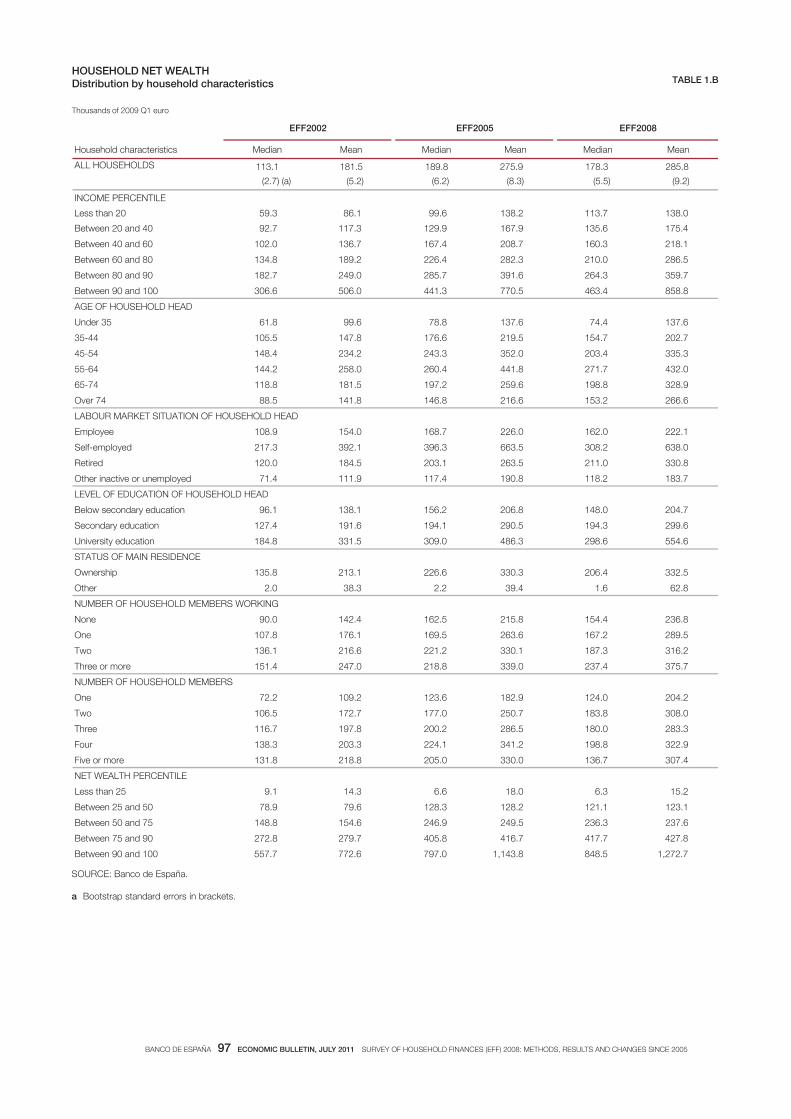
The median net wealth of households is €178,300 (see Table 1.B), while the average is
€285,800. By age group, net wealth conforms to the expected life-cycle profile, peaking
for households whose head is aged between 55 and 64, which is slightly later than the age
at which income peaks. Average and median wealth both increase with education and are
higher for households whose head is self-employed. Net wealth also increases with in-
come, reflecting the fact that high-income households obtain more income from their as-
set portfolio and have greater saving possibilities.
Between 2005 and 2009 Q1 household net wealth increased on average (3.6%), while the
median of the distribution decreased by 6.1%. The sharpest decreases in median wealth
were among the self-employed, whose average wealth also decreased. However, between
2002 and 2005 the largest increases in net wealth were, as regards labour market status,
among the self-employed. By level of net wealth, there were falls in the average and in the
median for households in the bottom 75% of the wealth distribution, while those belonging
to the top quartile saw increases in both the average and the median.
98.3% of households possess some type of real or financial asset (see the last column of
Table 3). The median value of these households’ assets is €206,800. With respect to 2005,
the percentage of households possessing some type of asset decreased slightly and the
median value of their assets decreased by 5.7%.
Real assets account for 89.1% of the total value of household assets (see Table 2). This
proportion is similar at different income levels and is only lower for the top decile. However,
even at these relatively high income levels, real assets still represent a large proportion of
the value of household assets (84.6%). By level of wealth, real assets are relatively less
important at the two ends of the distribution, although they exceed 86% in both cases.
Housing is the most important asset held by households, representing 61.4% of the total
value of households’ real assets and 54.8% of the total value of all their assets. The two
next most important assets are other real-estate properties, which represent 27.8% of real
assets and 24.8% of all assets, and businesses related to activities engaged in by self-
employed household members, which account for 10.3% of real assets and 9.2% of total
assets.15, 16 The relative weight of housing declines with income, in favour of other real-
estate property and businesses. For the self-employed, the value of their businesses rep-
resents 30.6% of the total value of their real assets.
Between 2005 and 2009 Q1, the value of real assets as a proportion of the value of total as-
sets remained practically unchanged, edging up from 89% to 89.1% for total households.
However, the different real asset types varied appreciably. The main residence lost weight
(-4.1% with respect to total assets), and, by contrast, other real-estate properties gained
weight (3.5%). In total, real estate assets constitute 79.6% of the total value of household
assets, against 80.1% in 2005. By contrast, the weight of businesses related to self-employ-
ment increased from 8.4% of total assets in 2005 to 9.2% in 2009 Q1. By household group,
there was an increase in the weight of other real-estate properties and of businesses related
to self-employment for households headed by a person above age 64.
NET WEALTH14
Assets
REAL ASSETS
14 Net wealth is defined as the total value of assets (real and financial) less the amount of debts. The value of cars
and other vehicles is not included.
15 “Other real-estate properties” includes dwellings, building plots and rural land, garages (except when they form
part of the main residence), industrial buildings, shops, commercial premises, offices and hotels.
16 The value of businesses is sometimes considered a real asset (if related to the work of their owners) and sometimes
a financial asset through the ownership of unlisted shares or other equity (if it is a means of investing savings).
BANCO DE ESPAÑA 97 ECONOMIC BULLETIN, JULY 2011 SURVEY OF HOUSEHOLD FINANCES (EFF) 2008: METHODS, RESULTS AND CHANGES SINCE 2005
EFF2002 EFF2005 EFF2008
Household characteristics Median Mean Median Mean Median Mean
ALL HOUSEHOLDS 113.1 181.5 189.8 275.9 178.3 285.8
(2.7) (a) (5.2) (6.2) (8.3) (5.5) (9.2)
INCOME PERCENTILE
Less than 20 59.3 86.1 99.6 138.2 113.7 138.0
Between 20 and 40 92.7 117.3 129.9 167.9 135.6 175.4
Between 40 and 60 102.0 136.7 167.4 208.7 160.3 218.1
Between 60 and 80 134.8 189.2 226.4 282.3 210.0 286.5
Between 80 and 90 182.7 249.0 285.7 391.6 264.3 359.7
Between 90 and 100 306.6 506.0 441.3 770.5 463.4 858.8
AGE OF HOUSEHOLD HEAD
Under 35 61.8 99.6 78.8 137.6 74.4 137.6
35-44 105.5 147.8 176.6 219.5 154.7 202.7
45-54 148.4 234.2 243.3 352.0 203.4 335.3
55-64 144.2 258.0 260.4 441.8 271.7 432.0
65-74 118.8 181.5 197.2 259.6 198.8 328.9
Over 74 88.5 141.8 146.8 216.6 153.2 266.6
LABOUR MARKET SITUATION OF HOUSEHOLD HEAD
Employee 108.9 154.0 168.7 226.0 162.0 222.1
Self-employed 217.3 392.1 396.3 663.5 308.2 638.0
Retired 120.0 184.5 203.1 263.5 211.0 330.8
Other inactive or unemployed 71.4 111.9 117.4 190.8 118.2 183.7
LEVEL OF EDUCATION OF HOUSEHOLD HEAD
Below secondary education 96.1 138.1 156.2 206.8 148.0 204.7
Secondary education 127.4 191.6 194.1 290.5 194.3 299.6
University education 184.8 331.5 309.0 486.3 298.6 554.6
STATUS OF MAIN RESIDENCE
Ownership 135.8 213.1 226.6 330.3 206.4 332.5
Other 2.0 38.3 2.2 39.4 1.6 62.8
NUMBER OF HOUSEHOLD MEMBERS WORKING
None 90.0 142.4 162.5 215.8 154.4 236.8
One 107.8 176.1 169.5 263.6 167.2 289.5
Two 136.1 216.6 221.2 330.1 187.3 316.2
Three or more 151.4 247.0 218.8 339.0 237.4 375.7
NUMBER OF HOUSEHOLD MEMBERS
One 72.2 109.2 123.6 182.9 124.0 204.2
Two 106.5 172.7 177.0 250.7 183.8 308.0
Three 116.7 197.8 200.2 286.5 180.0 283.3
Four 138.3 203.3 224.1 341.2 198.8 322.9
Five or more 131.8 218.8 205.0 330.0 136.7 307.4
NET WEALTH PERCENTILE
Less than 25 9.1 14.3 6.6 18.0 6.3 15.2
Between 25 and 50 78.9 79.6 128.3 128.2 121.1 123.1
Between 50 and 75 148.8 154.6 246.9 249.5 236.3 237.6
Between 75 and 90 272.8 279.7 405.8 416.7 417.7 427.8
Between 90 and 100 557.7 772.6 797.0 1,143.8 848.5 1,272.7
HOUSEHOLD NET WEALTH Distribution by household characteristics TABLE 1.B
Thousands of 2009 Q1 euro
SOURCE: Banco de España.
a Bootstrap standard errors in brackets.

BANCO DE ESPAÑA 98 ECONOMIC BULLETIN, JULY 2011 SURVEY OF HOUSEHOLD FINANCES (EFF) 2008: METHODS, RESULTS AND CHANGES SINCE 2005
In 2009 Q1, 88.2% of households have some type of real asset (see Table 3) and the me-
dian value of the real assets of such households was €210,400.
Compared with 2005, the percentage of households with some type of real asset increased
slightly for total households, although it rose more sharply for lower-income households
and those headed by a person below age 35 or above age 74. For those households pos-
sessing some type of real asset, the median value of such assets decreased by 6.9%. The
sharpest decrease was for the self-employed (-17.8%).
The percentage of households who own their main residence (82.7% in the case of all
households) increases with income, to peak in the case of households whose head is aged
between 55 and 64. The median value of the main residence of households who own it is
€180,300. The latter increases with income and is highest for households whose head is
aged between 55 and 64 (€203,300).
Between 2005 and 2009 Q1 the percentage of households who own their main residence in-
creased for total households from 81.3% to 82.7%. This figure reflects basically an increase in
the percentage of households owning their main residence among the bottom two deciles of the
Main residence
Household characteristicsMain
residence
Other real
estate
properties
Businesses
related to self-
employment
Jewellery,
works of art,
antiques
Total
Memorandum
item: real assets
as % of total
assets
ALL HOUSEHOLDS 66.2 23.8 9.4 0.6 100.0 89.0
INCOME PERCENTILE
Less than 20 79.4 18.7 1.5 0.4 100.0 91.8
Between 20 and 40 79.2 16.4 4.1 0.3 100.0 94.4
Between 40 and 60 75.7 19.1 4.9 0.4 100.0 91.9
Between 60 and 80 69.5 23.6 6.5 0.4 100.0 90.7
Between 80 and 90 61.1 25.4 13.0 0.5 100.0 88.5
Between 90 and 100 48.8 31.8 18.3 1.1 100.0 83.0
AGE OF HOUSEHOLD HEAD
Under 35 78.8 15.4 5.5 0.4 100.0 90.7
35-44 73.5 19.1 7.0 0.4 100.0 91.6
45-54 60.5 23.8 15.2 0.5 100.0 90.5
55-64 55.4 30.2 13.6 0.9 100.0 84.6
65-74 71.9 25.3 2.2 0.6 100.0 89.6
Over 74 73.7 24.3 1.4 0.6 100.0 88.7
LABOUR MARKET SITUATION OF HOUSEHOLD HEAD
Employee 78.3 19.6 1.7 0.5 100.0 89.9
Self-employed 38.9 28.4 32.1 0.7 100.0 89.0
Retired 72.1 26.2 1.2 0.5 100.0 87.5
Other inactive or unemployed 70.8 24.7 3.6 0.8 100.0 88.9
NET WEALTH PERCENTILE
Less than 25 86.0 10.6 2.3 1.2 100.0 87.0
Between 25 and 50 88.6 9.6 1.4 0.4 100.0 93.5
Between 50 and 75 86.7 11.0 1.8 0.4 100.0 92.7
Between 75 and 90 69.6 24.4 5.6 0.3 100.0 90.0
Between 90 and 100 41.4 37.8 19.9 0.9 100.0 85.0
SOURCE: Banco de España.
DISTRIBUTION OF THE VALUE OF HOUSEHOLDS’ REAL ASSETS By type of asset and household characteristics
TABLE 2
%
EFF2008

BANCO DE ESPAÑA 99 ECONOMIC BULLETIN, JULY 2011 SURVEY OF HOUSEHOLD FINANCES (EFF) 2008: METHODS, RESULTS AND CHANGES SINCE 2005
income distribution (from 70.1% to 78.1%). For households owning their main residence, its
median value decreased by 6.9%. These losses in median value took place at all income levels.
36.1% of households own real-estate assets other than their main residence. In particular,
23.3% own a residence other than their main one, followed by 9.8% who own building
plots and rural land. These proportions increase with income, but even in the lower part of
the income distribution a considerable percentage of households possess real-estate as-
sets other than their main residence (20.1%). By age, the highest percentage of house-
holds owning other real-estate properties is seen among households whose head is aged
between 55 and 64. The median value of these properties is €120,200, which increases
with income and wealth. By age, the top median value occurs in the 55-64 age group.
Compared with 2005, the percentage of households owning other real-estate properties
increased in general and, by income level, for all households except those lying in the two
bottom deciles of the income distribution. The median value of these properties also in-
creased for total households. The increase in median value for total households owning
other real-estate properties was 7.1%. Notably, there was an increase both in the percent-
age of households owning other real-estate properties and in the median thereof for
households headed by a person between age 65 and 74.
Other real-estate properties
EFF2008
Household characteristics
ALL HOUSEHOLDS 61.4 27.8 10.3 0.5 100.0 89.1
INCOME PERCENTILE
Less than 20 84.3 14.5 1.0 0.2 100.0 92.3
Between 20 and 40 72.4 22.2 5.1 0.3 100.0 93.3
Between 40 and 60 69.5 22.5 7.7 0.3 100.0 92.8
Between 60 and 80 62.7 29.3 7.7 0.4 100.0 89.8
Between 80 and 90 63.4 26.6 9.4 0.6 100.0 87.8
Between 90 and 100 42.3 37.3 19.5 0.9 100.0 84.6
AGE OF HOUSEHOLD HEAD
Under 35 72.3 17.6 9.9 0.2 100.0 94.3
35-44 69.2 20.5 9.9 0.4 100.0 90.0
45-54 56.9 30.2 12.5 0.5 100.0 88.4
55-64 55.6 30.9 12.7 0.8 100.0 86.5
65-74 58.6 34.2 6.6 0.6 100.0 89.7
Over 74 66.2 26.8 6.6 0.4 100.0 90.5
LABOUR MARKET SITUATION OF HOUSEHOLD HEAD
Employee 75.2 21.2 3.1 0.5 100.0 89.3
Self-employed 34.8 34.0 30.6 0.6 100.0 88.1
Retired 61.7 32.6 5.1 0.6 100.0 88.3
Other inactive or unemployed 70.3 25.6 3.7 0.3 100.0 92.1
NET WEALTH PERCENTILE
Less than 25 83.3 13.8 2.4 0.5 100.0 90.3
Between 25 and 50 88.8 9.4 1.4 0.4 100.0 93.8
Between 50 and 75 82.1 15.0 2.6 0.3 100.0 91.7
Between 75 and 90 65.8 29.1 4.7 0.4 100.0 89.7
Between 90 and 100 37.4 41.0 20.9 0.7 100.0 86.1
SOURCE: Banco de España.
DISTRIBUTION OF THE VALUE OF HOUSEHOLDS’ REAL ASSETS (cont.) By type of asset and household characteristics
TABLE 2 (cont.)
%
Main
residence
Other real
estate
properties
Businesses
related to self-
employment
Jewellery,
works of art,
antiques
Total
Memorandum
item: real assets
as % of total
assets

BANCO DE ESPAÑA 100 ECONOMIC BULLETIN, JULY 2011 SURVEY OF HOUSEHOLD FINANCES (EFF) 2008: METHODS, RESULTS AND CHANGES SINCE 2005
EFF2005
Main
residence
Other real
estate
properties
Businesses
related to self-
employment
Jewellery, works
of arts,
antiques
Some type of real
asset
Some type of
asset
ALL HOUSEHOLDS 81.3 34.5 11.1 19.3 87.4 99.0
INCOME PERCENTILE
Less than 20 70.6 22.3 2.4 13.7 76.8 97.9
Between 20 and 40 78.5 26.7 7.6 16.3 85.0 98.6
Between 40 and 60 80.8 31.3 9.3 17.6 86.9 98.9
Between 60 and 80 85.7 41.0 14.9 18.9 91.5 99.8
Between 80 and 90 88.4 42.6 16.7 25.5 95.3 100.0
Between 90 and 100 93.4 59.2 25.7 34.8 97.9 100.0
AGE OF HOUSEHOLD HEAD
Under 35 62.0 17.0 9.2 17.2 72.0 98.1
35-44 79.4 27.5 11.7 18.0 85.7 98.9
45-54 84.7 42.3 20.1 22.9 91.4 99.0
55-64 89.2 49.5 14.0 21.6 94.1 99.7
65-74 88.4 39.0 4.6 20.7 92.2 99.4
Over 74 83.8 28.6 1.3 12.6 87.4 99.2
LABOUR MARKET SITUATION OF HOUSEHOLD HEAD
Employee 80.0 30.2 3.0 19.6 85.7 99.1
Self-employed 85.8 53.4 76.6 25.0 97.1 100.0
Retired 87.9 38.9 3.6 18.9 91.4 99.4
Other inactive or unemployed 72.0 27.6 4.1 15.7 79.6 97.7
NET WEALTH PERCENTILE
Less than 25 35.2 12.0 3.3 13.0 50.0 96.2
Between 25 and 50 94.5 25.9 4.7 18.8 99.6 100.0
Between 50 and 75 97.5 30.7 9.1 18.0 99.8 100.0
Between 75 and 90 98.2 59.0 19.9 20.4 99.9 100.0
Between 90 and 100 97.4 84.5 38.5 37.9 100.0 100.0
ALL HOUSEHOLDS 193.6 112.2 65.8 2.8 225.9 219.3
INCOME PERCENTILE
Less than 20 129.1 62.7 34.8 1.3 130.8 107.2
Between 20 and 40 161.3 64.5 56.1 1.5 179.7 161.4
Between 40 and 60 193.6 76.8 59.2 1.4 215.8 209.1
Between 60 and 80 225.9 116.2 48.0 3.2 258.1 263.0
Between 80 and 90 249.5 178.1 88.5 3.2 306.7 331.8
Between 90 and 100 305.9 229.3 129.1 6.8 431.4 488.4
AGE OF HOUSEHOLD HEAD
Under 35 193.6 73.1 48.9 1.8 193.6 156.9
35-44 204.5 114.2 46.2 1.9 234.4 227.6
45-54 225.9 115.7 124.2 3.2 262.1 270.5
55-64 195.2 158.8 52.3 3.3 261.8 271.4
65-74 169.1 80.9 40.0 2.6 193.7 201.7
Over 74 134.6 96.8 12.9 2.0 161.3 148.5
LABOUR MARKET SITUATION OF HOUSEHOLD HEAD
Employee 213.0 95.7 32.4 3.1 226.6 220.5
Self-employed 225.9 193.6 89.7 3.4 401.8 432.9
Retired 182.5 96.8 21.4 2.1 207.5 210.9
Other inactive or unemployed 146.8 78.7 46.6 2.4 161.3 130.3
NET WEALTH PERCENTILE
Less than 25 64.5 19.1 13.3 1.4 51.6 13.7
Between 25 and 50 129.1 44.5 34.7 1.3 141.3 155.0
Between 50 and 75 225.9 67.1 26.5 2.9 258.0 264.2
Between 75 and 90 290.4 157.0 101.5 3.2 387.2 432.9
Between 90 and 100 387.2 322.7 206.1 8.0 735.8 835.4
Percentage of households owning asset
Median of the asset value for households owning such asset
SOURCE: Banco de España
HOLDINGS OF REAL ASSETS BY HOUSEHOLDS By type of asset and household characteristics
TABLE 3
% and thousands of 2009 Q1 euro

BANCO DE ESPAÑA 101 ECONOMIC BULLETIN, JULY 2011 SURVEY OF HOUSEHOLD FINANCES (EFF) 2008: METHODS, RESULTS AND CHANGES SINCE 2005
EFF2008
Main
residence
Other real
estate
properties
Businesses
related to self-
employment
Jewellery, works
of arts,
antiques
Some type of real
asset
Some type of
asset
ALL HOUSEHOLDS 82.7 36.1 12.0 17.2 88.2 98.3
INCOME PERCENTILE
Less than 20 78.1 20.1 2.2 10.2 81.9 96.1
Between 20 and 40 78.7 29.7 6.9 13.2 83.1 98.9
Between 40 and 60 84.1 33.0 12.4 14.7 89.2 98.7
Between 60 and 80 83.1 42.2 15.7 19.3 91.7 98.4
Between 80 and 90 87.7 49.1 19.5 25.7 93.8 98.3
Between 90 and 100 91.3 61.8 25.7 31.9 96.1 100.0
AGE OF HOUSEHOLD HEAD
Under 35 65.8 18.8 11.1 10.8 73.2 96.6
35-44 78.1 29.7 15.8 15.7 85.8 98.2
45-54 86.0 41.1 15.7 19.5 90.7 98.7
55-64 89.3 51.4 16.0 23.5 94.7 98.7
65-74 88.5 45.1 6.4 19.5 92.0 98.2
Over 74 87.8 27.1 1.7 12.4 90.9 99.1
LABOUR MARKET SITUATION OF HOUSEHOLD HEAD
Employee 81.5 32.0 4.8 19.0 87.4 98.4
Self-employed 83.9 56.8 77.2 19.8 95.7 99.3
Retired 90.7 43.2 4.8 16.9 93.2 99.4
Other inactive or unemployed 75.3 25.9 1.4 12.6 80.1 96.2
NET WEALTH PERCENTILE
Less than 25 41.9 9.4 3.8 8.4 53.1 93.1
Between 25 and 50 94.9 24.3 5.5 16.8 99.6 100.0
Between 50 and 75 96.8 37.6 10.1 16.1 100.0 100.0
Between 75 and 90 97.1 65.9 20.7 23.1 99.9 100.0
Between 90 and 100 96.9 83.9 40.6 34.4 100.0 100.0
ALL HOUSEHOLDS 180.3 120.2 71.9 3.0 210.4 206.8
INCOME PERCENTILE
Less than 20 120.2 50.4 41.2 1.1 125.6 120.8
Between 20 and 40 150.3 90.1 38.6 2.0 176.6 157.4
Between 40 and 60 180.3 99.8 81.7 3.0 197.1 201.6
Between 60 and 80 187.1 130.0 52.9 3.0 238.0 246.1
Between 80 and 90 240.4 137.0 76.2 3.0 300.5 335.4
Between 90 and 100 300.4 262.2 118.9 8.8 471.9 517.3
AGE OF HOUSEHOLD HEAD
Under 35 178.2 102.2 61.4 1.3 180.3 152.3
35-44 180.3 117.2 34.6 3.0 209.5 205.1
45-54 180.3 120.2 97.2 3.0 226.9 235.3
55-64 204.3 164.6 112.6 3.0 271.6 289.7
65-74 180.1 120.2 84.1 3.0 199.5 207.0
Over 74 150.3 104.8 197.6 2.3 152.7 156.1
LABOUR MARKET SITUATION OF HOUSEHOLD HEAD
Employee 180.3 109.4 41.7 3.0 210.4 210.7
Self-employed 199.7 159.4 76.3 3.1 330.5 353.5
Retired 180.3 120.2 115.0 3.1 210.4 216.4
Other inactive or unemployed 150.2 96.1 90.2 1.9 157.1 143.8
NET WEALTH PERCENTILE
Less than 25 71.7 22.4 18.3 2.0 60.1 27.1
Between 25 and 50 120.2 36.1 24.3 1.2 133.4 145.6
Between 50 and 75 200.9 90.1 39.4 2.8 240.4 251.9
Between 75 and 90 270.5 170.8 72.7 3.5 402.4 439.9
Between 90 and 100 395.1 366.3 267.5 12.0 796.0 897.4
Percentage of households owning asset
Median of the asset value for households owning such asset
SOURCE: Banco de España
HOLDINGS OF REAL ASSETS BY HOUSEHOLDS (cont.) By type of asset and household characteristics
TABLE 3 (cont.)
% and thousands of 2009 Q1 euro

BANCO DE ESPAÑA 102 ECONOMIC BULLETIN, JULY 2011 SURVEY OF HOUSEHOLD FINANCES (EFF) 2008: METHODS, RESULTS AND CHANGES SINCE 2005
12% of households own assets in businesses related to the activities of self-employed
members of the household. This figure increases with income and wealth and is higher for
the group of households headed by a person between age 55 and 64. The median value
of these businesses is €71,900 and increases with increasing income and wealth.18
The proportion of households with these businesses is somewhat higher than in 2005. By
age, the only household groups for which this proportion decreased are those headed by
a person between age 45 and 54. The increase in the median value in the period 2005-
2009 Q1 was 9.3% overall. The largest increase in this median value was in the group of
households headed by a person above age 54. However, the self-employed saw a de-
crease of 14.9% in the median value of their businesses related to self-employment.
For households as a whole, bank accounts make up nearly 49% of the value of their financial
assets, followed, in order of importance, by pension plans (18.2%), listed shares (9.3%), un-
listed shares and other equity (8%), investment funds (7.1%) and fixed-income securities (1.8%)
(see Table 4). Included in the “other financial assets” category are outstanding loans to house-
holds and portfolios under management,19 which represent 6.1% and 0.6%, respectively, of the
total value of households’ financial assets. By income and wealth level, the composition of the
portfolio tends to be similar, except in the case of households belonging to the highest decile of
these distributions, which have a larger percentage of their assets in unlisted shares.
Compared with 2005, the only financial assets which have gained relative weight in the
financial asset portfolio of total households are bank accounts (particularly those that
cannot be used to make payments) and outstanding loans to households. These chang-
es in the relative weights of financial assets are observed for nearly all types of house-
holds, although more markedly for the households in the upper deciles of the income
and wealth distributions. Moreover, these groups of households show the most notice-
able decrease in the weight of their financial assets with respect to the total value of
assets held by them.
In 2009 Q1 93.6% of households hold some type of financial asset (see Table 5), although
this figure decreases considerably if bank accounts are excluded. This percentage in-
creases slightly with increasing level of income. The median value of these financial assets
is €7,100.
Compared with 2005, the percentage of households with some type of financial asset is
lower and the reduction in this percentage is larger in the lower half of the income and
wealth distributions. For households with some type of financial asset, the median value
of these assets has increased by 9.3%. By household group, the sharpest increase has
occurred for households whose head is aged between 55 and 64.
The percentage of households that have some type of bank account that can be used to
make payments is 90.5%. This percentage is above 83% for all types of household. The
median balance on this type of account is €3,000, and it rises with income and wealth and,
by labour market status, for households whose head is self-employed.
Businesses related to self-
employment17
FINANCIAL ASSETS
Bank accounts
17 In the EFF2008 the ownership of unlisted businesses in which one or more household members worked is de-
termined separately from self-employment status. This practice may mean that more businesses related to
self-employment are recognised than in previous editions of the Survey.
18 The value of the businesses includes the value of their land and buildings, provided these have not been in-
cluded by any household in the real estate owned by it.
19 The EFF2008 includes new questions designed to obtain information about the asset portfolios under manage-
ment held by households and not included in the categories of specific assets.

BANCO DE ESPAÑA 103 ECONOMIC BULLETIN, JULY 2011 SURVEY OF HOUSEHOLD FINANCES (EFF) 2008: METHODS, RESULTS AND CHANGES SINCE 2005
The proportion of households with bank accounts that cannot be used to make payments,
including cuentas vivienda (savings accounts in which the money deposited must be used to
buy a house), is 24.1%. This percentage rises with income and wealth. The median balance
in this case is €15,000. For the upper deciles of the income and net wealth distributions, the
median investment in this type of asset is higher than in other financial assets.
Between 2005 and 2009 Q1 the percentage of households with accounts for payments de-
creased by 2 percentage points, while the fraction of households with accounts that cannot be
used to make payments increased: from 18.5% in 2005 to 24.1% at the end of 2009 Q1. In this
respect, there has also been a decline in the median balance of accounts that can be used to
make payments, but an increase of 16.3% in the median balance of accounts that cannot be used
to make payments. By type of household, the increase in the proportion of households that have
accounts that cannot be used to make payments increased especially among the households in
the upper deciles of the income and wealth distributions. These households also saw an notice-
able increase in their median balance of this type of account (by 57.7% and 45%, respectively).
The percentage of households directly owning listed shares is 10.4%. This figure increases with
income and net wealth, and the increase is greater for the upper income and wealth groups. By
level of income, 3.5% of households in the bottom two deciles of the distribution hold this type
of asset, and the proportion rises to 34.9% for the top decile. Households whose heads are in
the 55-64 age bracket are those most inclined to hold listed shares (14.9%).
For households investing in listed shares, the median invested value is €6,000. Median
values do not vary significantly by income and wealth except for the group of households
in the upper decile of the income and wealth distributions. By age, the median value is
higher for households above age 54.
The profile of households with investment funds (5.6% for households as a whole) is similar
to that of households that invest in listed shares, but the proportions of households holding
such funds are smaller for all types of household. Conversely, the median investment in
these funds (€14,100) is higher than in the case of listed shares for all groups of households.
The variation by income level in the median holding of these assets differs from that of the
median holding of listed shares, since the median values are relatively higher in the lower
20% of the income distribution in the case of investment funds, while they are relatively
higher in the upper 20% of the income distribution in the case of shares.
Since 2005, the proportion of households that invest in these two types of assets has de-
creased, although the decrease has been greater for investment funds. Also, for house-
holds as a whole, the median investment has decreased clearly for both investment funds
(-26.9%) and listed shares (-13%). The groups that have most clearly decreased their par-
ticipation have been households in the upper deciles of the income and wealth distribu-
tions, those whose head is aged between 45 and 64 and the self-employed. These house-
hold groups also reduced appreciably their median investment in both types of asset.
The percentage of households holding unlisted shares or other corporate participating
interests is 1.3%. This percentage is higher in the top decile of income (6.1%) and net
wealth (6.6%), and is concentrated among the self-employed. The median value invested
is €12,000 for those households holding this type of asset.
Listed shares and investment
funds20
Unlisted shares and other equity
20 Investment funds include money market funds, capital market funds, real-estate investment funds and other
undertakings for collective investment in transferable securities.

BANCO DE ESPAÑA 104 ECONOMIC BULLETIN, JULY 2011 SURVEY OF HOUSEHOLD FINANCES (EFF) 2008: METHODS, RESULTS AND CHANGES SINCE 2005
Overall, the percentage of households that invest in unlisted shares or other corporate
participating interests is slightly lower than in 2005. This decrease is observed for all types
of households and is sharper for those in the upper part of the income distribution and
those whose head is self-employed. The median investment has also decreased for
households as a whole (by 33%) and this fall is sharper for those in the upper part of the
income distribution and those whose head is self-employed.
The percentage of households investing in fixed-income securities is 1.4%. This figure
increases with income and net wealth, without exceeding 4% in any case. By labour market
Fixed-income securities
EFF2005
Household characteristicsAccounts and deposits
usable for payments
Accounts not usable
for
payments and
house-purchase
savings accounts
Listed shares Investment funds Fixed-income
securities
ALL HOUSEHOLDS 26.6 14.7 11.1 13.2 1.7
INCOME PERCENTILE
Less than 40 40.6 20.0 5.8 12.8 1.9
Between 40 and 60 35.1 22.3 7.4 7.8 2.9
Between 60 and 80 36.8 21.1 6.6 8.9 1.9
Between 80 and 90 25.2 14.5 9.9 9.2 2.0
Between 90 and 100 16.4 8.5 15.9 18.1 1.1
NET WEALTH PERCENTILE
Less than 50 53.6 16.1 2.8 5.3 0.8
Between 50 and 75 36.9 21.8 4.3 9.4 1.4
Between 75 and 90 27.9 19.2 7.9 11.3 1.9
Between 90 and 100 17.5 10.8 15.9 16.7 1.9
DISTRIBUTION OF THE VALUE OF HOUSEHOLDS’ FINANCIAL ASSETS By type of asset and household characteristics
SOURCE: Banco de España.
%
EFF2008
Household characteristicsAccounts and deposits
usable for payments Listed shares Investment funds
Fixed-income
securities
ALL HOUSEHOLDS 22.9 25.9 9.3 7.1 1.8
INCOME PERCENTILE
Less than 40 31.4 29.2 6.9 10.3 4.2
Between 40 and 60 32.4 29.8 6.5 6.8 1.6
Between 60 and 80 26.0 27.4 8.1 5.8 1.3
Between 80 and 90 21.0 26.1 8.3 4.9 1.0
Between 90 and 100 17.1 23.2 11.7 7.5 1.6
NET WEALTH PERCENTILE
Less than 50 43.8 28.2 3.1 4.3 0.8
Between 50 and 75 35.7 28.5 3.0 3.6 3.0
Between 75 and 90 24.0 28.0 8.4 7.4 1.9
Between 90 and 100 14.7 23.9 12.7 8.6 1.6
DISTRIBUTION OF THE VALUE OF HOUSEHOLDS’ FINANCIAL ASSETS (cont.) By type of asset and household characteristics
SOURCE: Banco de España.
%
Accounts not usable
for
payments and
house-purchase
savings accounts

BANCO DE ESPAÑA 105 ECONOMIC BULLETIN, JULY 2011 SURVEY OF HOUSEHOLD FINANCES (EFF) 2008: METHODS, RESULTS AND CHANGES SINCE 2005
status, the possession of this asset is highest among the self-employed and, by age,
among those above age 55. The median holding of fixed-income securities is €19,100,
without any clear variation according to level of income or wealth.
Compared with 2005, households are somewhat less inclined to hold fixed-income securi-
ties directly, but the median investment in this asset has decreased significantly for house-
holds as a whole (-25.8%), although the change has been heterogeneous. However, there
has been an increase both in participation and in the median value invested in this type of
asset for households whose head is in the 45-55 age bracket.
EFF2005
Pension schemes and
unit-linked or mixed life
insurance
Unlisted shares and
other equity
Other nancial
assets Total
Memorandum
item: nancial
assets as a % of
total assets
Household characteristics
20.0 9.2 3.5 100.0 11.0 ALL HOUSEHOLDS
INCOME PERCENTILE
14.6 2.3 2.1 100.0 6.7 Less than 40
16.7 3.2 4.6 100.0 8.1 Between 40 and 60
19.0 2.6 3.1 100.0 9.3 Between 60 and 80
32.5 3.4 3.3 100.0 11.5 Between 80 and 90
18.5 17.7 3.9 100.0 17.0 Between 90 and 100
NET WEALTH PERCENTILE
14.7 0.9 5.8 100.0 7.7 Less than 50
22.0 2.1 2.2 100.0 7.3 Between 50 and 75
25.5 3.5 2.9 100.0 10.0 Between 75 and 90
18.5 15.1 3.7 100.0 15.0 Between 90 and 100
TABLE 4
EFF2008
Pension schemes and
unit-linked or mixed life
insurance
Unlisted shares and
other equity
Other nancial
assets Total
Memorandum
item: nancial
assets as a % of
total assets
Household characteristics
18.2 8.0 6.7 100.0 10.9 ALL HOUSEHOLDS
INCOME PERCENTILE
11.1 1.4 5.6 100.0 7.1 Less than 40
17.1 1.0 4.7 100.0 7.2 Between 40 and 60
19.4 6.3 5.7 100.0 10.2 Between 60 and 80
21.8 3.4 13.4 100.0 12.2 Between 80 and 90
19.1 14.2 5.7 100.0 15.4 Between 90 and 100
NET WEALTH PERCENTILE
14.6 0.0 5.1 100.0 7.0 Less than 50
18.1 1.2 6.9 100.0 8.3 Between 50 and 75
23.8 1.3 5.2 100.0 10.3 Between 75 and 90
16.8 14.1 7.6 100.0 13.9 Between 90 and 100
TABLE 4 (cont.)

BANCO DE ESPAÑA 106 ECONOMIC BULLETIN, JULY 2011 SURVEY OF HOUSEHOLD FINANCES (EFF) 2008: METHODS, RESULTS AND CHANGES SINCE 2005
EFF2005
Household characteristicsAccounts and deposits
usable for payments
Accounts not usable for
payments and house-purchase
savings
Listed shares Investment funds Fixed-income
securities
Percentage of households owning asset
ALL HOUSEHOLDS 92.5 18.5 11.4 8.7 1.5
INCOME PERCENTILE
Less than 20 86.8 12.2 4.4 4.0 0.4
Between 20 and 40 90.4 13.7 4.6 3.7 0.8
Between 40 and 60 92.7 16.4 7.0 5.4 1.2
Between 60 and 80 95.5 21.1 11.3 10.3 1.8
Between 80 and 90 95.9 27.8 23.8 13.1 2.9
Between 90 and 100 98.0 29.9 35.6 27.3 3.3
AGE OF HOUSEHOLD HEAD
Under 35 92.3 13.2 6.5 5.0 1.2
35-44 93.4 17.4 9.6 9.3 1.3
45-54 93.5 19.4 14.5 10.7 1.1
55-64 94.2 21.3 18.5 11.1 2.3
65-74 91.0 20.0 10.3 7.5 1.6
Over 74 88.4 19.8 7.1 7.5 1.6
LABOUR MARKET SITUATION OF HOUSEHOLD HEAD
Employee 94.0 16.9 12.2 10.0 0.6
Self-employed 94.3 23.4 16.6 10.0 3.1
Retired 90.5 22.5 11.1 7.9 2.0
Other inactive or unemployed 89.9 13.7 6.4 5.7 2.0
NET WEALTH PERCENTILE
Less than 25 89.5 9.8 2.1 2.5 0.1
Between 25 and 50 91.6 12.6 5.0 4.0 1.1
Between 50 and 75 93.1 21.0 10.2 8.5 1.1
Between 75 and 90 95.2 28.9 17.9 13.9 2.1
Between 90 and 100 96.0 32.8 44.0 29.0 5.8
Median of the asset value for households owning such asset
ALL HOUSEHOLDS 3.2 12.9 6.9 19.3 25.8
INCOME PERCENTILE
Less than 20 1.4 11.0 6.4 17.7 (a)
Between 20 and 40 2.1 9.0 6.5 12.3 31.0
Between 40 and 60 3.1 11.9 6.4 16.5 31.4
Between 60 and 80 3.9 14.0 5.9 14.8 6.5
Between 80 and 90 6.0 16.8 6.0 18.8 34.0
Between 90 and 100 8.3 19.0 16.7 31.8 27.2
AGE OF HOUSEHOLD HEAD
Under 35 2.2 7.1 6.4 9.9 (a)
35-44 3.2 9.9 4.6 12.6 19.3
45-54 3.4 12.9 6.6 17.8 6.5
55-64 3.3 19.1 12.9 28.1 32.2
65-74 3.2 15.6 7.2 23.7 37.6
Over 74 2.5 18.4 9.0 24.7 32.3
LABOUR MARKET SITUATION OF HOUSEHOLD HEAD
Employee 3.2 10.7 6.4 15.7 25.8
Self-employed 5.4 13.2 10.5 25.8 19.4
Retired 3.2 15.8 7.6 22.7 34.7
Other inactive or unemployed 2.0 14.7 6.4 21.6 14.2
NET WEALTH PERCENTILE
Less than 25 1.3 3.5 1.3 6.5 (a)
Between 25 and 50 2.6 6.5 4.5 7.5 2.8
Between 50 and 75 3.3 12.9 4.2 13.1 28.3
Between 75 and 90 6.4 19.2 7.2 19.3 28.1
Between 90 and 100 11.4 27.5 15.7 43.0 32.2
HOLDINGS OF FINANCIAL ASSETS BY HOUSEHOLDS By type of asset and household characteristics
% and thousands 2009 Q1 euro
SOURCE: Banco de España.
a Fewer than eleven observations.

BANCO DE ESPAÑA 107 ECONOMIC BULLETIN, JULY 2011 SURVEY OF HOUSEHOLD FINANCES (EFF) 2008: METHODS, RESULTS AND CHANGES SINCE 2005
EFF2005
Pension schemes and
unit-linked or mixed life
insurance
Unlisted shares and
other equity
Othe
assets asset Household characteristics
29.3 2.2 4.3 96.6 ALL HOUSEHOLDS
INCOME PERCENTILE
9.5 0.3 2.8 93.2 Less than 20
12.4 0.6 3.3 95.3 Between 20 and 40
27.1 1.4 3.9 97.2 Between 40 and 60
38.6 1.8 5.3 97.8 Between 60 and 80
50.2 4.1 4.6 99.4 Between 80 and 90
67.2 9.2 7.6 99.9 Between 90 and 100
AGE OF HOUSEHOLD HEAD
22.4 2.2 4.3 95.7 Under 35
37.8 2.8 5.5 97.3 35-44
44.6 2.8 6.0 96.4 45-54
43.5 2.2 4.6 97.6 55-64
9.1 1.4 1.9 97.2 65-74
2.4 0.7 1.5 94.9 Over 74
LABOUR MARKET SITUATION OF HOUSEHOLD HEAD
39.1 1.5 3.7 97.0 Employee
55.1 10.4 13.8 98.4 Self-employed
11.6 1.1 2.2 96.7 Retired
12.0 0.7 3.1 94.4 Other inactive or unemployed
NET WEALTH PERCENTILE
12.9 0.2 4.2 93.2 Less than 25
21.9 1.2 3.1 96.8 Between 25 and 50
31.6 1.7 4.1 97.6 Between 50 and 75
42.3 3.8 4.2 98.5 Between 75 and 90
63.8 8.2 8.1 99.9 Between 90 and 100
6.9 17.9 6.4 6.5 ALL HOUSEHOLDS
INCOME PERCENTILE
4.4 (a) 4.3 2.3 Less than 20
4.3 3.2 3.1 3.2 Between 20 and 40
4.4 7.8 4.2 5.5 Between 40 and 60
6.4 20.0 5.9 9.3 Between 60 and 80
9.2 8.1 14.9 21.2 Between 80 and 90
16.6 49.8 20.1 50.4 Between 90 and 100
AGE OF HOUSEHOLD HEAD
3.2 8.6 5.3 3.2 Under 35
5.0 19.9 3.2 6.4 35-44
7.5 22.6 8.9 10.2 45-54
18.5 60.2 19.3 13.4 55-64
10.8 4.5 6.5 5.4 65-74
12.9 38.7 3.1 5.2 Over 74
LABOUR MARKET SITUATION OF HOUSEHOLD HEAD
6.4 8.8 3.9 6.6 Employee
10.0 40.8 11.5 19.3 Self-employed
12.9 4.5 6.4 6.5 Retired
6.4 23.5 3.6 2.8 Other inactive or unemployed
NET WEALTH PERCENTILE
2.0 (a) 2.4 2.0 Less than 25
3.7 8.6 5.3 4.3 Between 25 and 50
6.2 12.1 4.3 8.2 Between 50 and 75
12.8 16.6 14.8 24.1 Between 75 and 90
22.6 60.1 19.3 72.1 Between 90 and 100
Percentage of households owning asset
Median of the asset value for households owning such asset
TABLE 5

BANCO DE ESPAÑA 108 ECONOMIC BULLETIN, JULY 2011 SURVEY OF HOUSEHOLD FINANCES (EFF) 2008: METHODS, RESULTS AND CHANGES SINCE 2005
EFF2008
Household characteristicsAccounts and deposits
usable for payments
Accounts not usable for
payments and house-purchase
savings accounts
Listed shares Investment funds Fixed-income
securities
Percentage of households owning asset
ALL HOUSEHOLDS 90.5 24.1 10.4 5.6 1.4
INCOME PERCENTILE
Less than 20 83.2 15.3 3.5 2.1 1.5
Between 20 and 40 88.7 19.5 5.7 3.0 1.2
Between 40 and 60 90.8 20.9 6.3 3.4 0.6
Between 60 and 80 92.3 27.8 10.6 5.8 1.2
Between 80 and 90 96.8 32.8 16.4 8.6 1.7
Between 90 and 100 98.2 41.0 34.9 18.4 3.3
AGE OF HOUSEHOLD HEAD
Under 35 87.9 14.6 5.6 2.7 0.9
35-44 91.1 24.5 8.4 5.0 0.8
45-54 90.8 23.8 12.2 7.1 1.7
55-64 93.4 24.2 14.9 7.9 2.0
65-74 88.6 29.4 12.5 6.6 1.5
Over 74 90.3 27.4 7.5 2.7 1.6
LABOUR MARKET SITUATION OF HOUSEHOLD HEAD
Employee 92.6 24.6 11.7 6.5 1.5
Self-employed 93.9 23.4 12.1 5.4 1.7
Retired 90.2 29.0 12.3 6.4 1.5
Other inactive or unemployed 84.7 17.7 4.4 2.6 0.9
NET WEALTH PERCENTILE
Less than 25 81.6 11.6 1.9 0.6 0.0
Between 25 and 50 88.4 18.1 4.0 2.4 0.9
Between 50 and 75 94.2 27.9 9.6 5.8 1.6
Between 75 and 90 97.4 36.4 19.1 10.5 2.6
Between 90 and 100 98.3 42.6 36.1 17.7 3.7
Median of the asset value for households owning such asset
ALL HOUSEHOLDS 3.0 15.0 6.0 14.1 19.1
INCOME PERCENTILE
Less than 20 1.2 9.4 6.3 30.0 15.3
Between 20 and 40 1.9 10.0 6.4 4.4 55.0
Between 40 and 60 2.4 12.0 5.8 18.9 30.1
Between 60 and 80 3.9 16.4 3.6 16.0 13.6
Between 80 and 90 5.4 18.4 8.5 12.0 12.0
Between 90 and 100 8.3 30.0 8.0 15.8 30.0
AGE OF HOUSEHOLD HEAD
Under 35 2.2 10.0 1.7 12.0 (a)
35-44 2.5 10.0 4.0 6.0 12.0
45-54 3.0 15.0 3.0 15.0 40.0
55-64 3.4 25.5 13.2 15.0 14.8
65-74 3.0 18.8 12.0 23.2 55.0
Over 74 2.2 15.4 15.9 19.8 36.1
LABOUR MARKET SITUATION OF HOUSEHOLD HEAD
Employee 3.0 12.0 4.0 12.0 12.0
Self-employed 5.0 24.0 6.0 15.0 60.1
Retired 3.0 23.4 13.1 19.6 55.0
Other inactive or unemployed 1.5 11.6 6.0 23.2 47.8
NET WEALTH PERCENTILE
Less than 25 1.0 4.8 6.0 10.0
Between 25 and 50 2.0 8.0 3.0 19.0
Between 50 and 75 3.0 14.3 3.1 9.1 47.6
Between 75 and 90 5.8 21.3 6.6 12.6 12.3
Between 90 and 100 9.8 39.8 15.0 24.0 40.0
HOLDINGS OF FINANCIAL ASSETS BY HOUSEHOLDS (cont.)By type of asset and household characteristics
% and thousands of 2009 Q1 euro
SOURCE: Banco de España.
a Fewer than eleven observations.
(a)
(a)

BANCO DE ESPAÑA 109 ECONOMIC BULLETIN, JULY 2011 SURVEY OF HOUSEHOLD FINANCES (EFF) 2008: METHODS, RESULTS AND CHANGES SINCE 2005
EFF2008
Pension schemes and
unit-linked or mixed life
insurance
Unlisted shares and
other equity
Othe cial
assets asset Household characteristics
Percentage of households owning asset
25.7 1.3 6.8 93.6 ALL HOUSEHOLDS
INCOME PERCENTILE
7.4 0.2 3.3 87.3 Less than 20
14.2 0.5 5.1 93.4 Between 20 and 40
25.2 0.6 7.8 93.5 Between 40 and 60
31.1 1.1 5.9 95.2 Between 60 and 80
46.1 2.5 11.0 97.8 Between 80 and 90
54.2 6.1 12.8 99.3 Between 90 and 100
AGE OF HOUSEHOLD HEAD
16.7 0.3 8.6 89.4 Under 35
31.9 2.0 10.4 93.8 35-44
39.2 2.1 7.5 93.7 45-54
41.8 1.3 6.7 96.5 55-64
8.5 1.2 3.6 92.6 65-74
1.7 0.2 1.3 94.6 Over 74
LABOUR MARKET SITUATION OF HOUSEHOLD HEAD
35.5 1.3 6.3 95.0 Employee
44.0 4.4 19.4 96.3 Self-employed
11.5 0.7 3.0 94.4 Retired
11.9 0.5 5.6 88.1 Other inactive or unemployed
NET WEALTH PERCENTILE
10.4 0.0 5.9 86.2 Less than 25
19.0 0.1 5.3 92.0 Between 25 and 50
27.4 1.6 6.7 97.1 Between 50 and 75
40.5 1.5 7.1 98.7 Between 75 and 90
53.7 6.6 12.3 99.5 Between 90 and 100
Median of the asset value for households owning such asset
7.8 12.0 6.4 7.1 ALL HOUSEHOLDS
INCOME PERCENTILE
7.3 (a) 4.9 2.0 Less than 20
4.9 (a) 4.0 3.6 Between 20 and 40
4.8 9.3 6.0 6.1 Between 40 and 60
7.1 11.4 6.3 11.3 Between 60 and 80
8.9 12.4 8.7 19.5 Between 80 and 90
20.0 12.0 19.6 42.7 Between 90 and 100
AGE OF HOUSEHOLD HEAD
4.2 (a) 2.0 4.2 Under 35
4.1 12.0 7.6 6.1 35-44
10.2 12.0 12.0 9.9 45-54
16.5 12.0 13.3 13.1 55-64
10.0 11.1 5.8 8.4 65-74
8.8 30.8 15.7 4.9 Over 74
LABOUR MARKET SITUATION OF HOUSEHOLD HEAD
6.8 12.0 6.0 8.0 Employee
9.9 13.6 13.7 14.7 Self-employed
15.0 10.4 13.5 8.5 Retired
7.6 6.0 3.0 2.4 Other inactive or unemployed
NET WEALTH PERCENTILE
3.0 (a) 2.0 1.5 Less than 25
4.5 (a) 3.8 4.1 Between 25 and 50
6.0 7.8 8.1 9.3 Between 50 and 75
13.3 12.0 14.6 24.6 Between 75 and 90
20.5 33.1 27.5 65.3 Between 90 and 100
TABLE 5 (cont.)

BANCO DE ESPAÑA 110 ECONOMIC BULLETIN, JULY 2011 SURVEY OF HOUSEHOLD FINANCES (EFF) 2008: METHODS, RESULTS AND CHANGES SINCE 2005
25.7% of households have a pension scheme (or unit-linked or mixed life insurance prod-
uct). This percentage rises with income and wealth. By age group, possession is highest
for households whose head is aged between 45 and 54 years, and, by labour market sta-
tus, for the self-employed. The median value of pension schemes is €7,800 for those
households owning a scheme. This value rises with income and wealth, and is highest for
households in the 55-64 age bracket.
Thus, the proportion of households with some type of pension scheme, which was 29.3%
in 2005, decreased considerably. The decline in this percentage is greatest in the upper
half of the income distribution and in the top decile of the wealth distribution and, by la-
bour market status, for the self-employed. By age, households below age 54 homogene-
ously reduced their participation, while this decrease is smaller for households nearer to
retirement. The median amount invested in pension schemes for households holding as-
sets of this type increased. The increase in the median value invested is greater in the
bottom part of the income and wealth distributions.
Included in this category are outstanding loans to households and portfolios under man-
agement. The percentage of households holding these assets is 6.8%.22 The holding of
these assets is more frequent in the high income and wealth brackets and, by labour mar-
ket status, for the self-employed. The median amount (€6,400) follows a similar pattern.
Between 2005 and 2009 Q1 the percentage of households with loans in their favour in-
creased from 4.3% to 6.3%. This increase is particularly appreciable for the self-employed
(from 13.8% to 18.8%).
Household debt accounts for 10.3% of the total value of their assets (see Table 6). The
amount outstanding in relation to the purchase of the main residence represents 59.6% of
Pension schemes and life
insurance21
Other financial assets
Debts
EFF2005
Household characteristicsPurchase of main
residence Purchase of other
real estate properties
Other outstanding debts(secured loans, personal
loans, credit cardsand other debts)
Total Memorandum item:
debtas a % of total assets
ALL HOUSEHOLDS 56.9 23.7 19.5 100.0 9.3
INCOME PERCENTILE
Less than 40 66.8 15.2 18.0 100.0 6.3
Between 40 and 60 67.5 10.9 21.6 100.0 11.3
Between 60 and 80 57.2 23.8 19.0 100.0 11.7
Between 80 and 90 55.5 25.1 19.4 100.0 11.3
Between 90 and 100 42.5 38.4 19.2 100.0 7.7
NET WEALTH PERCENTILE
Less than 50 71.3 8.5 20.2 100.0 26.2
Between 50 and 75 61.5 20.1 18.4 100.0 8.8
Between 75 and 90 41.0 40.6 18.4 100.0 6.2
Between 90 and 100 28.7 51.6 19.7 100.0 4.4
DISTRIBUTION OF THE VALUE OF HOUSEHOLD DEBT By purpose of debt and household characteristics
TABLE 6
SOURCE: Banco de España.
%
21 Pension schemes do not include entitlements to Social Security pensions. The life-insurance instruments con-
sidered are unit-linked or mixed products, but not those covering the risk of death.
22 To break down this figure, 6.3% of households have debts in their favour and 0.6% hold managed portfolios.

BANCO DE ESPAÑA 111 ECONOMIC BULLETIN, JULY 2011 SURVEY OF HOUSEHOLD FINANCES (EFF) 2008: METHODS, RESULTS AND CHANGES SINCE 2005
household debt, while outstanding debt in relation to the purchase of other real-estate
properties represents 24.6% thereof.
The increase in debt has been greater than the increase in assets and the percentage of
the value of assets that this debt represents has therefore increased. This increase is seen
at all levels of income and up to the ninetieth percentile of the wealth distribution. Out-
standing debt for the purchase of the main residence and for the purchase of other real-
estate properties increases as a proportion of total household debt, while the relative im-
portance of other outstanding debts declines.
In 2009 Q1, 50.1% of households have some type of debt and the median outstanding
amount is €36,000 (see Table 7). The groups least likely to have debts are households in the
bottom segment of the income distribution (16.5%), those aged over 64 and the retired.
Conversely, the percentage of indebted households in the 35-44 age bracket reaches
72.3%. The highest volumes of outstanding debt in terms of the median amount are among
the youngest group (€61,800), the self-employed and households with two members work-
ing. Moreover, these amounts increase with income, but not so clearly with wealth.
With respect to 2005, the percentage of indebted households remained practically unchanged
(from 49.5% to 50.1%). The largest increases in the percentage of indebted households are
among the youngest and the oldest households, those with no members working and those
lying in the central part of the income distribution. Between 2005 and 2009 Q1 the median
volume of outstanding debt increased by 7%. By income level, this value increases appreci-
ably for the bottom 60% of the income distribution and decreases for the other 40%. Also
substantial is the increase in the median debt of households in which no member works.
26.3% of households have outstanding debt in connection with the purchase of their main
residence (31.8% of households that own their main residence). This percentage rises in
the central parts of the income and net wealth distributions. Households most likely to
DEBTS RELATING TO PURCHASE
OF MAIN RESIDENCE
EFF2008
Household characteristicsPurchase of main
residence Purchase of other
real estate properties
Other outstanding debts(secured loans, personalloans, credit cards and
other debts)
Total Memorandum item:
debtas a % of total assets
ALL HOUSEHOLDS 59.6 24.6 15.9 100.0 10.3
INCOME PERCENTILE
Less than 40 73.4 11.1 15.5 100.0 6.6
Between 40 and 60 70.9 14.0 15.1 100.0 14.6
Between 60 and 80 63.9 18.5 17.6 100.0 11.9
Between 80 and 90 50.6 33.3 16.1 100.0 13.3
Between 90 and 100 42.2 42.8 15.0 100.0 8.0
NET WEALTH PERCENTILE
Less than 50 68.5 15.8 15.7 100.0 32.5
Between 50 and 75 63.9 23.7 12.4 100.0 9.9
Between 75 and 90 44.6 36.7 18.6 100.0 6.3
Between 90 and 100 37.7 43.6 18.7 100.0 3.9
DISTRIBUTION OF THE VALUE OF HOUSEHOLD DEBT (cont.) By purpose of debt and household characteristics
TABLE 6 (cont.)
%
SOURCE: Banco de España.

BANCO DE ESPAÑA 112 ECONOMIC BULLETIN, JULY 2011 SURVEY OF HOUSEHOLD FINANCES (EFF) 2008: METHODS, RESULTS AND CHANGES SINCE 2005
EFF2005
Purchase of main residence Other debt outstanding
Total With mortgage
guarantee
With collateral
(incl. mortgages)
Personal
loans
Credit card
debt Other debts
Percentage of households with debts outstanding
ALL HOUSEHOLDS 26.1 25.3 7.8 3.6 24.6 2.0 2.9 49.5
INCOME PERCENTILE
Less than 20 6.8 6.2 0.9 1.0 10.0 1.5 1.7 18.7
Between 20 and 40 21.3 20.6 4.3 2.7 22.4 2.0 2.0 42.3
Between 40 and 60 32.0 30.8 5.5 5.0 28.0 2.5 4.2 57.5
Between 60 and 80 35.3 34.5 12.1 4.3 32.1 2.6 2.6 63.0
Between 80 and 90 36.8 36.3 12.9 4.3 30.8 1.1 3.6 66.5
Between 90 and 100 32.7 31.9 19.5 5.3 30.1 1.5 4.7 65.4
AGE OF HOUSEHOLD HEAD
Under 35 46.6 46.1 5.4 1.6 31.2 2.0 3.2 65.2
35-44 48.0 46.8 11.4 3.2 31.5 2.8 3.5 70.4
45-54 26.5 25.9 12.5 7.3 33.3 3.1 4.5 63.1
55-64 15.1 14.1 9.6 4.0 26.0 2.1 3.4 48.5
65-74 3.7 3.2 2.5 3.0 11.3 0.5 1.4 19.8
Over 74 1.9 1.3 0.5 0.3 2.9 0.2 0.0 5.6
LABOUR MARKET SITUATION OF HOUSEHOLD HEAD
Employee 41.2 40.0 8.7 3.3 33.7 3.2 3.4 67.5
Self-employed 31.6 31.1 19.5 9.6 27.9 1.1 7.0 66.6
Retired 4.9 4.4 3.2 2.5 10.9 0.4 1.4 19.9
Other inactive or unemployed 11.8 11.5 5.0 2.4 17.5 1.3 1.4 32.6
NUMBER OF HOUSEHOLD MEMBERS WORKING
None 4.8 4.4 1.6 1.1 8.0 0.7 1.1 15.2
One 30.5 29.8 7.5 4.1 26.4 2.1 3.3 56.1
Two 42.4 41.0 11.4 4.0 33.4 2.7 4.1 70.2
Three or more 22.4 22.4 18.3 8.9 44.7 3.4 3.7 69.2
NET WEALTH PERCENTILE
Less than 25 15.2 14.8 1.7 4.0 30.2 2.2 3.8 43.9
Between 25 and 50 38.6 37.2 5.9 2.7 28.9 2.6 1.6 56.8
Between 50 and 75 29.7 29.1 6.2 3.3 20.8 2.3 2.7 49.3
Between 75 and 90 22.3 21.5 14.0 3.3 20.1 0.8 2.8 48.0
Between 90 and 100 18.4 17.9 22.5 6.0 16.0 0.9 4.7 48.2
Median of the debt value for households having such debt
ALL HOUSEHOLDS 44.9 45.2 64.9 39.1 6.9 0.5 5.1 33.6
INCOME PERCENTILE
Less than 20 35.5 38.5 (a) 14.2 3.9 0.3 1.6 6.5
Between 20 and 40 33.8 35.7 47.5 25.5 4.0 0.6 3.8 18.7
Between 40 and 60 38.5 38.7 50.9 38.1 7.5 1.1 4.0 27.5
Between 60 and 80 44.7 46.4 58.1 61.3 7.2 0.3 7.3 43.6
Between 80 and 90 55.1 55.9 69.7 31.4 12.6 (a) 6.1 53.1
Between 90 and 100 63.6 64.5 88.2 36.4 12.3 1.2 18.2 64.4
AGE OF HOUSEHOLD HEAD
Under 35 68.2 69.0 81.0 (a) 8.1 0.5 1.5 64.5
35-44 39.7 42.3 54.7 43.0 6.8 0.5 5.0 41.0
45-54 38.4 38.7 77.5 33.4 6.6 0.7 6.4 28.5
55-64 22.6 22.9 71.6 36.8 7.6 0.4 7.1 19.4
65-74 12.9 14.8 32.4 45.2 6.5 (a) 1.7 11.9
Over 74 19.4 25.2 73.0 (a) 4.2 (a) (a) 6.5
LABOUR MARKET SITUATION OF HOUSEHOLD HEAD
Employee 45.2 45.5 58.1 39.1 6.5 0.5 3.9 38.7
Self-employed 51.6 51.6 94.6 41.9 13.1 0.5 13.7 55.6
Retired 19.3 20.2 41.9 37.6 7.6 (a) 5.9 13.2
Other inactive or unemployed 38.2 39.3 75.2 21.4 5.3 0.5 2.0 15.0
NUMBER OF HOUSEHOLD MEMBERS WORKING
None 25.8 25.8 52.2 37.6 4.3 0.5 1.6 9.3
One 38.9 39.1 72.3 36.1 5.4 0.5 3.2 26.8
Two 51.7 53.9 58.1 38.7 10.3 0.5 10.7 45.5
Three or more 38.7 38.7 85.4 41.9 9.0 1.7 3.1 36.6
NET WEALTH PERCENTILE
Less than 25 62.8 64.5 60.3 38.7 5.4 0.5 3.7 13.8
Between 25 and 50 45.8 46.6 39.5 41.0 6.5 0.6 5.3 41.3
Between 50 and 75 34.7 35.5 58.1 40.5 9.5 0.5 4.5 31.4
Between 75 and 90 38.7 38.7 56.3 43.2 11.9 (a) 7.0 34.9
Between 90 and 100 45.9 45.9 85.1 32.4 9.2 0.4 6.3 63.4
Purchases of other
real estate properties
Some type of
debt
HOUSEHOLD DEBT By purpose, type of debt and household characteristics
TABLE 7
% and thousands of 2009 Q1 euro
SOURCE: Banco de España.
a Fewer than eleven observations.

BANCO DE ESPAÑA 113 ECONOMIC BULLETIN, JULY 2011 SURVEY OF HOUSEHOLD FINANCES (EFF) 2008: METHODS, RESULTS AND CHANGES SINCE 2005
EFF2008
Purchase of main residence Other debt outstanding
Total With mortgage
guarantee
With collateral
(incl. mortgages)
Personal
loans
Credit card
debt Other debts
Percentage of households with debts outstanding
ALL HOUSEHOLDS 26.3 25.9 7.9 3.1 23.1 7.3 2.6 50.1
INCOME PERCENTILE
Less than 20 7.0 7.0 0.7 0.2 9.0 2.6 1.2 16.5
Between 20 and 40 20.6 20.1 3.4 1.9 21.9 4.3 2.1 42.3
Between 40 and 60 38.4 38.2 6.6 4.3 29.6 10.5 2.9 63.6
Between 60 and 80 33.5 33.2 9.2 4.1 29.3 11.3 3.6 61.2
Between 80 and 90 33.3 32.0 15.5 3.8 29.8 10.4 3.3 68.5
Between 90 and 100 30.1 29.3 23.3 5.7 21.6 5.4 3.5 64.7
AGE OF HOUSEHOLD HEAD
Under 35 45.6 45.1 9.0 2.7 31.1 12.8 2.2 68.6
35-44 51.4 50.9 9.0 2.8 28.9 10.9 3.2 72.3
45-54 27.9 27.1 10.9 5.1 30.2 9.1 3.4 60.0
55-64 13.3 13.3 10.1 3.8 22.1 6.1 3.5 48.5
65-74 4.6 4.2 4.8 2.4 13.5 1.8 1.8 22.9
Over 74 1.9 1.8 0.8 0.4 5.9 0.8 0.7 9.9
LABOUR MARKET SITUATION OF HOUSEHOLD HEAD
Employee 41.8 41.3 9.9 3.1 30.0 12.7 3.0 68.4
Self-employed 31.3 30.9 17.9 6.2 25.2 4.7 6.4 64.0
Retired 5.1 4.8 4.0 2.6 12.2 1.9 1.0 22.2
Other inactive or unemployed 15.8 15.3 3.0 2.0 20.4 3.9 1.8 36.7
NUMBER OF HOUSEHOLD MEMBERS WORKING
None 8.0 7.5 2.6 1.5 10.3 2.1 1.2 21.3
One 28.9 28.5 7.7 2.1 26.9 8.5 3.0 56.6
Two 44.5 44.2 11.7 4.4 30.2 11.4 3.3 69.9
Three or more 16.9 16.7 18.0 9.5 36.9 9.1 5.4 69.7
NET WEALTH PERCENTILE
Less than 25 21.8 21.8 3.5 3.7 31.4 10.9 2.3 50.1
Between 25 and 50 36.4 36.0 4.8 2.9 24.9 7.8 2.9 53.5
Between 50 and 75 28.3 27.9 6.9 1.7 19.0 5.2 1.7 47.5
Between 75 and 90 18.3 17.1 13.6 3.7 20.3 6.8 4.3 51.3
Between 90 and 100 19.3 18.9 20.6 4.5 12.6 3.4 2.8 46.3
Median of the debt value for households having such debt
ALL HOUSEHOLDS 53.9 54.0 63.0 40.1 8.0 0.8 6.1 36.0
INCOME PERCENTILE
Less than 20 40.8 42.0 (a) (a) 6.0 0.6 1.0 10.3
Between 20 and 40 55.6 57.1 28.9 7.6 5.5 1.0 1.5 22.4
Between 40 and 60 50.3 50.1 70.0 36.1 7.3 0.8 3.3 37.2
Between 60 and 80 52.0 51.4 57.0 58.9 7.8 0.8 8.5 37.0
Between 80 and 90 60.6 64.7 103.7 60.0 9.5 0.5 12.7 44.7
Between 90 and 100 61.2 62.4 76.4 66.9 11.8 1.5 12.0 58.9
AGE OF HOUSEHOLD HEAD
Under 35 79.4 80.3 70.0 (a) 8.0 1.0 (a) 61.8
35-44 49.0 49.4 68.0 23.0 5.5 0.7 8.0 47.1
45-54 45.0 46.9 60.2 67.1 9.1 0.8 3.7 30.1
55-64 36.1 36.1 46.0 40.0 8.1 0.7 11.8 18.9
65-74 30.1 38.0 86.9 44.4 6.0 0.8 1.5 14.0
Over 74 30.0 26.4 60.0 (a) 4.3 (a) (a) 4.3
LABOUR MARKET SITUATION OF HOUSEHOLD HEAD
Employee 57.0 57.0 59.3 36.1 7.6 0.8 6.5 40.6
Self-employed 49.7 49.8 90.1 55.0 13.0 1.0 18.9 49.7
Retired 30.1 31.3 59.0 40.0 4.7 0.9 0.7 12.0
Other inactive or unemployed 57.3 58.3 60.3 22.4 6.7 0.8 1.5 20.0
NUMBER OF HOUSEHOLD MEMBERS WORKING
None 46.2 56.5 54.1 22.4 6.0 0.6 1.5 14.6
One 48.9 49.2 44.4 46.2 5.9 1.0 3.4 28.1
Two 57.0 57.0 80.0 36.1 8.0 0.8 8.0 51.1
Three or more 42.1 52.0 65.0 67.1 11.9 0.3 (a) 25.0
NET WEALTH PERCENTILE
Less than 25 89.0 88.8 105.7 62.9 6.9 0.9 3.1 25.8
Between 25 and 50 51.1 51.1 41.7 36.1 7.8 0.8 2.4 41.0
Between 50 and 75 42.1 41.6 49.6 46.1 6.4 0.5 2.5 31.3
Between 75 and 90 40.4 41.1 60.1 41.7 9.0 0.6 7.6 29.2
Between 90 and 100 47.0 48.2 90.0 83.2 12.0 2.0 21.0 61.8
Purchases of other
real estate properties
Some type of
debt
HOUSEHOLD DEBT (cont.) By purpose, type of debt and household characteristics
TABLE 7 (cont.)
% and thousands of 2009 Q1 euro
SOURCE: Banco de España.
a Fewer than eleven observations.

BANCO DE ESPAÑA 114 ECONOMIC BULLETIN, JULY 2011 SURVEY OF HOUSEHOLD FINANCES (EFF) 2008: METHODS, RESULTS AND CHANGES SINCE 2005
have this type of debt are, by age group, those in the 35-44 age bracket (51.4%); by labour
market status, dependent employees (41.8%); and, by number of members working, those
with two such members (44.5%). The median amount of debt outstanding in relation to the
purchase of the main residence is €53,900 for all households with this type of debt. The
median volume of outstanding debt increases with income, decreases with wealth, and is
greater for households whose head is under 35 and when two household members are
working. Debt outstanding in connection with the purchase of the main residence is almost
entirely mortgage debt.
With respect to 2005, the percentage of all households that have outstanding debt in con-
nection with the purchase of their main residence remained practically unchanged. This
proportion rises most in the central part of the income distribution and in households in the
age 35-44 bracket. The median value of debt in connection with the purchase of the main
residence rises by 20% for households as a whole. This debt increases in all groups of
households except those belonging to the top decile of the income distribution and the
self-employed.
7.9% of households have debts outstanding in relation to the purchase of real-estate
properties other than a main residence. This proportion rises with income and wealth and,
by age, is lower for the under-45s and the over-64s. By labour market status, 17.9% of
households whose head is self-employed have outstanding debt of this type. The median
value of debt outstanding in relation to the purchase of real-estate properties other than
the main residence is €63,000, without any clear pattern existing by age group, income or
wealth.
Since 2005, the percentage of households with debts in relation to the purchase of real-
estate properties other than the main residence remained basically unchanged for total
households. However, this proportion rises for households in the top quintile of the income
distribution and, by age, for households whose head is in the 65-74 age bracket. The me-
dian outstanding value of this type of debt decreased slightly (-3%) as regards the total for
households with this type of debt. However, the median amount of this type of debt in-
creased significantly for some groups, particularly households whose head is in the 65-74
age bracket.
The EFF also collects information on other debts, in addition to those for the purchase of
a main residence or other real-estate properties. The main reasons for incurring other
debts are to carry out home improvements, to invest in non-real-estate assets, to finance
business activity and to purchase vehicles and other durable goods. The main types of
debt incurred for these purposes are secured loans (including mortgage loans other than
those for the purchase of the main residence or other real-estate properties), personal
loans, credit card debt and other types.23
Of these debts, the type most prevalent among households is the personal loan, incurred
by 23.1% of households. The groups of households that least use this type of loan are
those with lower income, the over-64s and the retired or inactive. The median outstanding
amount of these personal loans is €8,000. Less frequent are outstanding secured loans for
purposes other than for the purchase of real estate (3.1% of households), but the median
outstanding amount of this type of debt is €40,100. 7.3% of households use credit cards
DEBT RELATING TO THE
PURCHASE OF REAL-ESTATE
PROPERTIES
OTHER DEBTS
23 Specifically, credit lines, deferred payment, advances, loans from relatives or friends, debit balances in current
accounts, leasing or renting and other unspecified items.

BANCO DE ESPAÑA 115 ECONOMIC BULLETIN, JULY 2011 SURVEY OF HOUSEHOLD FINANCES (EFF) 2008: METHODS, RESULTS AND CHANGES SINCE 2005
to obtain credit. This type of credit is most common amongst households below age 35,
employees and those lying in the bottom quartile of the wealth distribution. The median
balance of this type of debt is low, being €800 for those households that use credit cards
to obtain credit.
Since 2005, the percentage of households with personal loans decreased slightly for total
households, but increased for those above age 64, the retired and other inactive or unem-
ployed households. The median amount obtained through personal loans increased by
15.2%. The median amount of credit card debt increased significantly (49%) and the frac-
tion of households with this type of debt increased. The incurrence of secured debt for
purposes other than the purchase of real-estate properties remained at levels similar to
those of 2005 for total households, both in terms of the percentage of households having
this type of debt and as the median balance of this debt.
The EFF enables measures of the financial burden to be constructed for different types of
household with debts outstanding. Table 8 shows three measures. The first is the ratio of
debt payments (including repayment of principal and interest) to gross household income.
One limitation of this measure is that it only reflects the significance of financial commit-
ments in the short term. For this reason, figures for the ratio of total debt to gross house-
hold income and to total assets are also given. In all cases the median of these individual
ratios is provided for each group of households, as is the percentage of households for
which these financial burden measures exceed a certain threshold.
The median indebted household assigns 19% of its gross income to the payment of its
debts (see the first column of Table 8). This figure is greater for the lower income levels
(39.2%) and diminishes as income rises. By age group, the youngest households assign a
higher percentage of their income to debt payment (25.6%) than those of intermediate
age; by labour market status, the financial burden is higher among the unemployed and
other inactive households excluding the retired (23.5%). Meanwhile, the median stock of
outstanding debts accounts for 104.7% of annual household income (see the third column
of the same table). This proportion is greater in the central part of the income distribution
(148%), for the youngest (217.4%) and for the self-employed (122.9%).
The proportion of households setting aside more than 40% of their gross income to debt
payment is 16.6% of indebted households (see the second column of Table 8) or 8.3% of
all households. In the bottom two deciles of the income distribution, this threshold is ex-
ceeded by 46.7% of indebted households, which make up 7.7% of all households in these
income brackets. By age, these percentages are higher for the youngest group (24.4%).
The debt of 23.1% of indebted households is more than three times their annual gross
income (see the fourth column of the same table). This figure is once again higher for
lower-income households (34.1%) and in this case the same age-based differences are
also observed. Specifically, for 38.1% of households whose head is under the age of 35
that have debts (or for 26.2% of all households whose head is under the age of 35), the
total amount of such debts is more than three times their annual gross income.
The last two columns of the table give the data on debt in relation to gross wealth. For the
median indebted household, debt accounts for 19.4% of the total value of its assets (real as-
sets plus financial assets). Further, 14.8% of indebted households have debts which exceed
75% of their assets. In this case also, the proportion of households exceeding this threshold is
higher for certain household groups. In particular, 31.8% of indebted households below age 35
(21.8% of total households below age 35) have debts which exceed 75% of their assets.
DEBT BURDEN

BANCO DE ESPAÑA 116 ECONOMIC BULLETIN, JULY 2011 SURVEY OF HOUSEHOLD FINANCES (EFF) 2008: METHODS, RESULTS AND CHANGES SINCE 2005
ALL HOUSEHOLDS WITH DEBT 17.2 11.8 100.0 19.4 17.2 11.1
INCOME PERCENTILE
Less than 20 37.7 48.5 137.0 42.5 21.0 26.4
Between 20 and 40 24.6 22.0 109.4 28.3 20.9 14.8
Between 40 and 60 20.6 9.7 113.4 23.4 19.1 12.4
Between 60 and 80 15.6 5.7 114.3 15.0 18.0 9.5
Between 80 and 90 11.8 3.7 93.1 11.3 15.3 8.6
Between 90 and 100 8.1 1.6 59.9 4.6 11.1 1.2
AGE OF HOUSEHOLD HEAD
Under 35 21.7 15.2 192.6 36.5 40.3 21.4
35-44 18.5 11.0 114.4 18.5 19.5 10.3
45-54 15.3 11.5 81.2 14.4 13.1 8.9
55-64 13.6 9.7 53.2 12.0 7.2 4.9
65-74 12.5 12.2 46.0 12.0 7.4 8.5
Over 74 11.6 5.0 32.8 1.6 4.2 2.1
LABOUR MARKET SITUATION OF HOUSEHOLD HEAD
Employee 17.0 8.9 104.4 18.9 20.4 12.0
Self-employed 20.6 20.1 123.9 23.1 11.5 4.4
Retired 13.2 11.0 51.9 12.5 7.6 8.0
Other inactive or unemployed 18.2 18.7 81.9 24.2 15.6 17.6
STATUS OF MAIN RESIDENCE
Ownership 18.0 11.9 113.8 21.5 14.5 4.2
Other 14.0 10.8 31.6 7.6 78.5 50.8
NUMBER OF HOUSEHOLD MEMBERS WORKING
None 17.6 21.3 57.1 21.2 8.2 15.0
One 19.6 14.6 104.3 25.5 18.4 13.0
Two 16.3 8.1 113.4 15.7 18.6 9.9
Three or more 12.1 9.0 54.9 12.1 12.3 6.4
NET WEALTH PERCENTILE
Less than 25 17.7 16.0 65.5 24.7 75.2 50.2
Between 25 and 50 20.5 12.9 144.1 24.5 24.3 0.0
Between 50 and 75 16.3 8.4 93.8 13.1 10.9 0.0
Between 75 and 90 14.4 8.1 82.5 14.2 7.6 0.0
Between 90 and 100 14.0 13.1 91.0 16.2 6.1 0.0
SOURCE: Banco de España.
MEASURES OF DEBT BURDEN OF HOUSEHOLDS WITH DEBT OUTSTANDING By household characteristics
TABLE 8
% (calculated on the basis of 2009 Q1 euro) EFF2005
Ratio of debt payments to
household income
Ratio of debt to household
income
Ratio of debt to grosshousehold wealth
Household characteristics Median (%) Median (%)
Percentage ofhouseholds
whereratio exceeds 3
Median (%)
Percentage ofhouseholdswhere ratio
exceeds 75%
Percentage ofhouseholdswhere ratio
exceeds 40%

BANCO DE ESPAÑA 117 ECONOMIC BULLETIN, JULY 2011 SURVEY OF HOUSEHOLD FINANCES (EFF) 2008: METHODS, RESULTS AND CHANGES SINCE 2005
EFF2008
Ratio of debt payments to
household income
Ratio of debt to household
income
Ratio of debt to grosshousehold wealth
Household characteristics Median (%) Median (%)
Percentage ofhouseholds
whereratio exceeds 3
Median (%)
Percentage ofhouseholdswhere ratio
exceeds 75%
Percentage ofhouseholdswhere ratio
exceeds 40%
ALL HOUSEHOLDS WITH DEBT 19.0 16.6 104.7 23.1 19.4 14.8
INCOME PERCENTILE
Less than 20 39.2 46.7 147.7 34.1 25.5 25.2
Between 20 and 40 26.4 27.5 137.0 29.7 24.8 21.8
Between 40 and 60 24.0 16.4 148.0 28.1 24.6 14.5
Between 60 and 80 17.0 11.9 95.8 21.9 19.4 17.0
Between 80 and 90 14.4 9.8 84.6 16.3 15.9 6.1
Between 90 and 100 10.0 3.3 62.0 8.3 12.5 6.2
AGE OF HOUSEHOLD HEAD
Under 35 25.6 24.4 217.4 38.1 52.0 31.8
35-44 21.5 17.1 142.7 26.8 24.6 15.6
45-54 17.9 16.0 89.9 20.0 13.8 8.3
55-64 12.1 9.5 41.0 9.0 6.8 5.3
65-74 15.9 14.2 55.3 14.9 8.1 13.6
Over 74 12.5 8.5 18.5 7.7 6.2 7.4
LABOUR MARKET SITUATION OF HOUSEHOLD HEAD
Employee 18.9 14.6 121.3 23.3 23.4 15.1
Self-employed 22.4 22.7 122.9 26.3 13.4 4.1
Retired 13.6 10.8 41.2 11.9 6.3 7.7
Other inactive or unemployed 23.5 22.8 100.9 27.1 27.7 28.3
STATUS OF MAIN RESIDENCE
Ownership 20.3 17.5 129.1 25.6 15.4 7.4
Other 13.8 11.1 31.2 7.7 171.3 59.9
NUMBER OF HOUSEHOLD MEMBERS WORKING
None 21.4 22.5 81.2 25.8 14.2 20.4
One 20.4 15.5 100.5 21.6 20.5 16.3
Two 19.0 16.5 137.4 24.9 21.7 11.7
Three or more 11.0 11.4 48.1 15.0 12.1 15.6
NET WEALTH PERCENTILE
Less than 25 23.8 25.0 139.4 31.8 87.5 58.8
Between 25 and 50 22.5 15.6 151.7 26.7 25.4 0.6
Between 50 and 75 16.8 11.1 87.0 15.3 11.4 0.0
Between 75 and 90 13.6 9.5 61.8 12.3 6.2 0.0
Between 90 and 100 17.7 22.3 98.6 26.4 5.4 0.0
SOURCE: Banco de España.
MEASURES OF DEBT BURDEN OF HOUSEHOLDS WITH DEBT OUTSTANDING (cont.) By household characteristics
TABLE 8 (cont.)
% (calculated on the basis of 2009 Q1 euro)
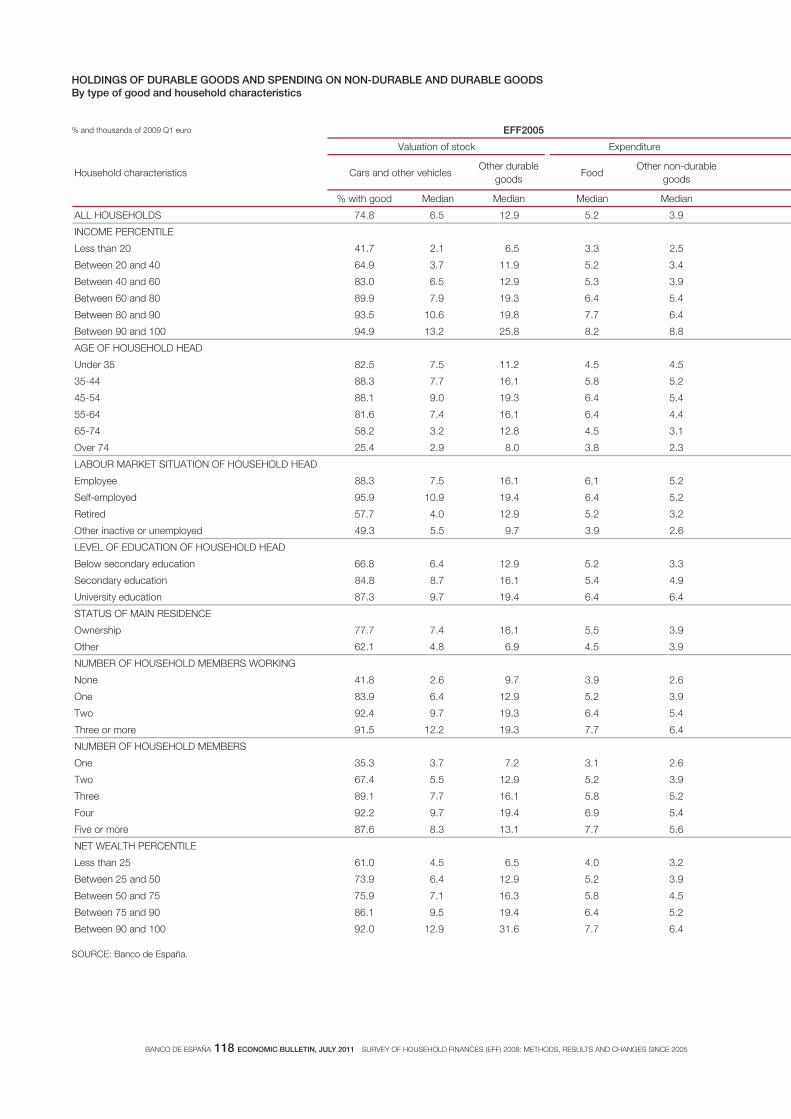
BANCO DE ESPAÑA 118 ECONOMIC BULLETIN, JULY 2011 SURVEY OF HOUSEHOLD FINANCES (EFF) 2008: METHODS, RESULTS AND CHANGES SINCE 2005
EFF2005
Valuation of stock Expenditure
Household characteristics Cars and other vehicles Other durable
goodsFood
Other non-durable
goods
% with good Median Median Median Median
ALL HOUSEHOLDS 74.8 6.5 12.9 5.2 3.9
INCOME PERCENTILE
Less than 20 41.7 2.1 6.5 3.3 2.5
Between 20 and 40 64.9 3.7 11.9 5.2 3.4
Between 40 and 60 83.0 6.5 12.9 5.3 3.9
Between 60 and 80 89.9 7.9 19.3 6.4 5.4
Between 80 and 90 93.5 10.6 19.8 7.7 6.4
Between 90 and 100 94.9 13.2 25.8 8.2 8.8
AGE OF HOUSEHOLD HEAD
Under 35 82.5 7.5 11.2 4.5 4.5
35-44 88.3 7.7 16.1 5.8 5.2
45-54 88.1 9.0 19.3 6.4 5.4
55-64 81.6 7.4 16.1 6.4 4.4
65-74 58.2 3.2 12.8 4.5 3.1
Over 74 25.4 2.9 8.0 3.8 2.3
LABOUR MARKET SITUATION OF HOUSEHOLD HEAD
Employee 88.3 7.5 16.1 6.1 5.2
Self-employed 95.9 10.9 19.4 6.4 5.2
Retired 57.7 4.0 12.9 5.2 3.2
Other inactive or unemployed 49.3 5.5 9.7 3.9 2.6
LEVEL OF EDUCATION OF HOUSEHOLD HEAD
Below secondary education 66.8 6.4 12.9 5.2 3.3
Secondary education 84.8 8.7 16.1 5.4 4.9
University education 87.3 9.7 19.4 6.4 6.4
STATUS OF MAIN RESIDENCE
Ownership 77.7 7.4 16.1 5.5 3.9
Other 62.1 4.8 6.9 4.5 3.9
NUMBER OF HOUSEHOLD MEMBERS WORKING
None 41.8 2.6 9.7 3.9 2.6
One 83.9 6.4 12.9 5.2 3.9
Two 92.4 9.7 19.3 6.4 5.4
Three or more 91.5 12.2 19.3 7.7 6.4
NUMBER OF HOUSEHOLD MEMBERS
One 35.3 3.7 7.2 3.1 2.6
Two 67.4 5.5 12.9 5.2 3.9
Three 89.1 7.7 16.1 5.8 5.2
Four 92.2 9.7 19.4 6.9 5.4
Five or more 87.6 8.3 13.1 7.7 5.6
NET WEALTH PERCENTILE
Less than 25 61.0 4.5 6.5 4.0 3.2
Between 25 and 50 73.9 6.4 12.9 5.2 3.9
Between 50 and 75 75.9 7.1 16.3 5.8 4.5
Between 75 and 90 86.1 9.5 19.4 6.4 5.2
Between 90 and 100 92.0 12.9 31.6 7.7 6.4
SOURCE: Banco de España.
HOLDINGS OF DURABLE GOODS AND SPENDING ON NON-DURABLE AND DURABLE GOODS By type of good and household characteristics
% and thousands of 2009 Q1 euro

BANCO DE ESPAÑA 119 ECONOMIC BULLETIN, JULY 2011 SURVEY OF HOUSEHOLD FINANCES (EFF) 2008: METHODS, RESULTS AND CHANGES SINCE 2005
Household characteristics
% incurring expense Median % incurring expense Median
15.6 14.0 49.3 1.1 ALL HOUSEHOLDS
INCOME PERCENTILE
4.8 6.9 33.5 0.5 Less than 20
12.0 11.6 43.9 0.7 Between 20 and 40
17.9 13.6 51.7 1.0 Between 40 and 60
19.3 15.9 55.7 1.3 Between 60 and 80
22.9 16.2 58.7 1.8 Between 80 and 90
24.5 18.9 64.2 1.5 Between 90 and 100
AGE OF HOUSEHOLD HEAD
20.1 15.0 55.9 1.2 Under 35
18.6 12.9 63.0 1.1 35-44
19.6 14.0 57.4 1.3 45-54
19.4 16.1 45.2 1.3 55-64
7.4 16.1 37.2 0.6 65-74
1.8 12.9 20.9 0.5 Over 74
LABOUR MARKET SITUATION OF HOUSEHOLD HEAD
20.2 14.0 59.1 1.3 Employee
25.1 14.0 60.1 1.4 Self-employed
7.6 12.9 34.4 0.6 Retired
8.7 15.0 37.3 0.7 Other inactive or unemployed
LEVEL OF EDUCATION OF HOUSEHOLD HEAD
14.0 12.9 42.4 1.0 Below secondary education
16.8 16.4 56.9 1.2 Secondary education
19.3 15.0 61.5 1.1 University education
STATUS OF MAIN RESIDENCE
16.3 15.0 49.7 1.1 Ownership
12.4 9.7 47.5 0.6 Other
NUMBER OF HOUSEHOLD MEMBERS WORKING
3.3 11.6 32.0 0.5 None
16.1 14.0 52.9 1.1 One
22.7 16.1 60.1 1.3 Two
31.5 15.0 56.5 1.1 Three or more
NUMBER OF HOUSEHOLD MEMBERS
3.7 12.9 35.5 0.5 One
10.1 14.5 41.4 1.0 Two
19.7 16.1 52.6 1.3 Three
23.4 13.4 61.5 1.3 Four
23.7 9.7 58.9 1.1 Five or more
NET WEALTH PERCENTILE
13.0 11.0 45.9 0.7 Less than 25
16.3 15.9 46.4 1.1 Between 25 and 50
14.9 14.1 48.6 1.0 Between 50 and 75
17.3 12.9 57.2 1.1 Between 75 and 90
19.2 19.3 55.0 2.0 Between 90 and 100
EFF2005
Cars and other vehicles
Expenditure
Other durable
goods
TABLE 9

BANCO DE ESPAÑA 120 ECONOMIC BULLETIN, JULY 2011 SURVEY OF HOUSEHOLD FINANCES (EFF) 2008: METHODS, RESULTS AND CHANGES SINCE 2005
EFF2008
Valuation of stock Expenditure
Household characteristics
% and thousands of 2099 Q1 euro
Cars and other vehicles Other durable
goodsFood
Other non-durable
goods
% with good Median Median Median Median
ALL HOUSEHOLDS 77.3 6.5 13.6 6.0 4.2
INCOME PERCENTILE
Less than 20 38.3 2.5 7.0 3.6 2.4
Between 20 and 40 72.4 5.1 12.0 5.1 3.6
Between 40 and 60 88.0 6.0 14.6 6.0 4.7
Between 60 and 80 92.7 8.1 17.4 6.2 5.3
Between 80 and 90 94.7 11.3 19.0 7.2 7.2
Between 90 and 100 95.4 15.0 24.0 8.6 9.7
AGE OF HOUSEHOLD HEAD
Under 35 90.0 7.4 12.0 4.8 4.4
35-44 87.6 8.0 15.0 6.0 4.8
45-54 90.3 9.0 18.0 7.2 5.7
55-64 84.1 6.9 18.0 6.2 4.8
65-74 64.8 3.0 12.0 5.2 3.6
Over 74 31.1 3.2 8.0 3.9 2.4
LABOUR MARKET SITUATION OF HOUSEHOLD HEAD
Employee 90.9 8.0 18.0 6.0 5.1
Self-employed 94.8 10.0 18.0 7.2 6.0
Retired 63.7 4.0 12.0 5.2 3.6
Other inactive or unemployed 55.7 6.0 9.9 4.2 2.4
LEVEL OF EDUCATION OF HOUSEHOLD HEAD
Below secondary education 69.2 6.0 12.0 5.2 3.6
Secondary education 88.1 8.0 18.0 6.0 4.8
University education 89.3 9.0 18.3 7.2 7.3
STATUS OF MAIN RESIDENCE
Ownership 79.5 7.4 15.0 6.0 4.8
Other 66.8 5.0 7.1 4.8 3.6
NUMBER OF HOUSEHOLD MEMBERS WORKING
None 49.6 3.6 10.0 4.4 2.4
One 85.5 6.0 14.4 6.0 4.6
Two 95.5 9.0 18.0 7.2 6.0
Three or more 91.4 18.0 18.0 8.1 6.5
NUMBER OF HOUSEHOLD MEMBERS
One 36.2 4.0 8.4 3.0 2.4
Two 76.7 5.0 12.0 5.2 3.6
Three 91.1 7.0 18.0 6.0 4.8
Four 94.1 12.0 18.0 7.2 6.0
Five or more 89.8 12.0 12.0 8.4 4.8
NET WEALTH PERCENTILE
Less than 25 65.3 5.0 7.2 4.8 3.2
Between 25 and 50 74.6 6.0 12.0 4.8 3.6
Between 50 and 75 79.2 6.1 17.6 6.0 4.7
Between 75 and 90 88.5 9.7 18.0 7.2 6.1
Between 90 and 100 92.7 12.6 30.0 8.4 8.4
SOURCE: Banco de España.
HOLDINGS OF DURABLE GOODS AND SPENDING ON NON-DURABLE AND DURABLE GOODS (cont.) By type of good and household characteristics

BANCO DE ESPAÑA 121 ECONOMIC BULLETIN, JULY 2011 SURVEY OF HOUSEHOLD FINANCES (EFF) 2008: METHODS, RESULTS AND CHANGES SINCE 2005
EFF2008
Expenditure
Cars and other vehicles Other durable
goods Household characteristics
% incurring expense Median % incurring expense Median
11.5 13.0 40.9 1.0 ALL HOUSEHOLDS
INCOME PERCENTILE
2.9 6.0 24.3 0.6 Less than 20
9.4 10.6 35.3 0.8 Between 20 and 40
13.5 13.8 42.3 1.0 Between 40 and 60
12.5 9.9 50.3 1.0 Between 60 and 80
16.3 16.9 53.3 1.5 Between 80 and 90
21.5 17.3 51.4 2.0 Between 90 and 100
AGE OF HOUSEHOLD HEAD
17.3 10.5 45.9 1.5 Under 35
12.9 10.6 49.9 1.0 35-44
16.6 14.0 47.0 1.2 45-54
12.7 15.0 38.0 1.0 55-64
3.8 16.0 30.3 0.8 65-74
1.8 7.2 26.7 0.5 Over 74
LABOUR MARKET SITUATION OF HOUSEHOLD HEAD
15.5 14.0 49.8 1.0 Employee
16.2 13.0 42.2 1.5 Self-employed
4.9 16.6 33.0 0.7 Retired
8.1 7.1 30.9 1.0 Other inactive or unemployed
LEVEL OF EDUCATION OF HOUSEHOLD HEAD
9.7 10.9 33.7 0.8 Below secondary education
13.6 10.5 51.8 1.0 Secondary education
14.5 16.0 50.1 1.5 University education
STATUS OF MAIN RESIDENCE
11.8 14.0 41.5 1.0 Ownership
9.9 6.0 38.1 0.8 Other
NUMBER OF HOUSEHOLD MEMBERS WORKING
4.6 12.0 29.2 0.7 None
8.9 11.5 45.6 1.0 One
18.4 14.0 48.1 1.2 Two
25.7 13.0 43.0 1.0 Three or more
NUMBER OF HOUSEHOLD MEMBERS
2.8 10.0 30.2 0.6 One
7.4 11.6 39.3 1.0 Two
14.1 13.0 46.3 1.0 Three
17.7 11.5 45.1 1.3 Four
26.0 15.0 44.8 1.0 Five or more
NET WEALTH PERCENTILE
11.0 9.1 38.9 0.8 Less than 25
10.7 14.0 37.6 1.0 Between 25 and 50
11.6 11.4 39.7 1.0 Between 50 and 75
10.7 14.8 47.2 1.1 Between 75 and 90
15.2 18.7 48.1 2.0 Between 90 and 100
TABLE 9 (cont.)

BANCO DE ESPAÑA 122 ECONOMIC BULLETIN, JULY 2011 SURVEY OF HOUSEHOLD FINANCES (EFF) 2008: METHODS, RESULTS AND CHANGES SINCE 2005
With respect to 2005, the median indebted household assigns 1.8% more of its gross in-
come to debt payments. The increase is greatest for households below age 35 (3.9%). As
for the stock of debt, it now represents an extra 4.7% of annual income for the median
indebted household. By labour market status, the largest increase in both these ratios is in
households whose head is unemployed or inactive (excluding the retired).
In comparison with 2005, an additional 4.8% of indebted households assign more than
40% of their income to debt payments. The increase is greatest for the younger indebted
households (9.2%). Also, the percentage of indebted households whose debt is more than
three times their gross annual income has risen (3.6% extra). However, there is a decrease
in the percentage of households that exceed both thresholds among the households lying
in the bottom quintile of the income distribution.
Finally, since 2005 the median household has seen the ratio of its debt to assets increase
slightly. This increase is largest among the youngest households (11.7%) and among the
unemployed and other inactive households (excluding the retired) (12.2%). Also, the per-
centage of indebted households whose debt is more than 75% of their assets has in-
creased, especially among households belonging to these two groups. However, also in
this case the percentage of households exceeding this threshold decreases among the
households in the bottom quintile of the income distribution.
The definition of household wealth does not include the value of vehicles and other dura-
ble goods. Table 9 provides information, by household characteristics, on the percentage
of households that have cars or other vehicles and on the median value of these and of
other durable goods.24 The variations across the different types of household are as ex-
pected. In particular, the percentage of households with a vehicle, the median value there-
of and the median value of other durable goods increase with income and net wealth.
The EFF also includes information on expenditure, given the importance of its relationship to
the distribution of household income, wealth and debt. Table 9 offers information on the dis-
tribution of different expenditure items according to household characteristics. Spending on
food and other non-durable goods varies considerably with income and net wealth. Also
spending on vehicles and other durables for households that purchase these goods during
the year varies to some extent with income and wealth. In turn, the percentage of households
that incur such expenditure varies to a greater extent with income than with wealth.
With respect to 2005 there has been a increase in the median expenditure by households on
food and other non-durable goods. By type of household, median spending on non-durable
goods other than food decreased significantly for households in the bottom part of the in-
come distribution, those below age 45 and the unemployed and other inactive households
(excluding the retired). Further, spending on cars (and other vehicles), and on other durable
goods, decreased, owing to falls both in the percentage of households that incur this type of
expenditure and in the median expenditure by households that incur this type of expenditure.
The falls in the percentage of households acquiring a vehicle and in the percentage of house-
holds acquiring other durables are apparent at all levels of income and wealth.
The third wave of the EFF allows comparison of the financial position of households over
what is now a fairly lengthy period. This report limits itself to describing the situation re-
flected in the EFF2008 and the changes since the previous wave. However, the possibili-
Other information
Conclusion
24 Specifically, household furnishings, fittings and appliances are included in this category in the EFF.

BANCO DE ESPAÑA 123 ECONOMIC BULLETIN, JULY 2011 SURVEY OF HOUSEHOLD FINANCES (EFF) 2008: METHODS, RESULTS AND CHANGES SINCE 2005
ties of comparative analysis over time are wider. Moreover, the fact that the results of this
third edition can be compared with the information collected in other similar surveys which
all the euro area countries have begun to conduct will broaden the possibilities for analysis
of the financial position of households.
20.12.2010.
BOVER, O. (2011). The Spanish survey of household finances (EFF): description and methods of the 2008 wave,
Documentos Ocasionales No. 1103, Banco de España.
REFERENCES