Embed Size (px)
Citation preview
The BP Solar / FRV Consortium
13 September 2010
Economic Benefits from Solar Flagship Project

AECOMEconomic Benefits from Solar Flagship Project
H:\Proposals\2010\Planning and Advisory\NSW-B10-1865 BP Solar\Project\4. Reporting\Final\2010 09 13 Final Report.docx Revision B - 13 September 2010
Economic Benefits from Solar Flagship Project
Prepared for
The BP Solar / FRV Consortium
Prepared by AECOM Australia Pty Ltd Level 11, 44 Market Street, Sydney NSW 2000, PO Box Q410, QVB Post Office NSW 1230, Australia T +61 2 8295 3600 F +61 2 9262 5060 www.aecom.com ABN 20 093 846 925
13 September 2010
© AECOM Australia Pty Ltd 2010
The information contained in this document produced by AECOM Australia Pty Ltd is solely for the use of the Client identified on the cover sheet for the purpose for which it has been prepared and AECOM Australia Pty Ltd undertakes no duty to or accepts any responsibility to any third party who may rely upon this document.
All rights reserved. No section or element of this document may be removed from this document, reproduced, electronically stored or transmitted in any form without the written permission of AECOM Australia Pty Ltd.
This report was based on information provided by the BP Solar/ FRV Consortium.Going forward, this report will need to be updated to ensure it reflects the latest project information.
AECOMEconomic Benefits from Solar Flagship Project
H:\Proposals\2010\Planning and Advisory\NSW-B10-1865 BP Solar\Project\4. Reporting\Final\2010 09 13 Final Report.docx Revision B - 13 September 2010
Quality Information Document Economic Benefits from Solar Flagship Project
Ref NSW-B10-1865
Date 13 September 2010
Prepared by Katie Feeney, Jeremy Balding and Robin Goodhand
Reviewed by David Adams
Revision History
Revision Revision Date Details
Authorised
Name/Position Signature
A 06-Sep-2010 First Report for Discussion David Adams Technical Director - Economics
B 09-Sep-2010 Draft final report David Adams Technical Director - Economics
C 13-Sep-2010 Final report David Adams Technical Director - Economics

AECOMEconomic Benefits from Solar Flagship Project
H:\Proposals\2010\Planning and Advisory\NSW-B10-1865 BP Solar\Project\4. Reporting\Final\2010 09 13 Final Report.docx Revision B - 13 September 2010
Table of Contents Executive Summary i 1.0 Introduction 1
1.1 Background 1 1.2 Project description 1 1.3 Study objectives 1
2.0 Alignment with Government policies 2 2.1 Renewable Energy Target 2 2.1 Greenhouse Gas Emissions 3 2.2 Regional development (New South Wales State Plan) 4
3.0 Regional Impact and Industry Development 6 3.1 Overview 6 3.2 Existing economic environment in Moree Overview 7 3.3 Capital expenditure 14 3.4 Employment 16 3.5 Total Direct Benefits 26 3.6 Indirect Impacts 28 3.7 Benefits maximisation 28 3.8 Solar Industry development 37
4.0 Research Benefits 40 4.1 Introduction 40 4.2 Electricity market benefits 41 4.3 Network benefits 45 4.4 Export opportunities 48 4.5 Solar research benefits 49
5.0 References 54
AECOMEconomic Benefits from Solar Flagship Project
H:\Proposals\2010\Planning and Advisory\NSW-B10-1865 BP Solar\Project\4. Reporting\Final\2010 09 13 Final Report.docx Revision B - 13 September 2010 i
Executive Summary
The Commonwealth Government announced in its May 2009 Budget the establishment of the $4.5 billion Clean Energy Initiative (CEI). CEI includes the Solar Flagships Program, which provides up to $1.5 billion in funding for construction of a total capacity of 1,000 MW, including up to four solar power stations. The NSW Government wants at least one of these power stations to be built in NSW and has pledged $120 million to help NSW solar projects bidding for a share of the Commonwealth’s $1.5 billion Solar Flagships Program.
The BP Solar/FVR Consortium is proposing to build a 150MW PV plant in Moree, NSW, if supported under the Solar Flagship program. The plant is expected to generate 404GWh each year; contributing 1.8% of 2016 Renewable Energy target and reducing greenhouse gas emissions by around 400,000 t CO2-e each year. This project will also make a significant contribution to a number of the priorities set out in the 2010 New South Wales State Plan, Investing in a Better Future, including developing clean energy and tackling climate change; investment to support business and employment; developing green skills and strengthening Aboriginal communities.
BP Solar has commissioned AECOM to undertake this study to assess the economic impacts of their proposed solar flagship project. AECOM has identified a number of economic benefits from this project as set out in Table 1. In summary:
Strong regional development opportunities
Development of a strong supply chain to support the PV market and ensure maximum benefit to the NSW economy from growth in the solar market
A number of benefits from the proposed research including better integration into the NEM, new commercialisation and export opportunities in areas such as energy storage and smart grids and attraction of international researchers.
Table 2 below shows how these benefits map against the NSW evaluation criteria.
AECOMEconomic Benefits from Solar Flagship Project
H:\Proposals\2010\Planning and Advisory\NSW-B10-1865 BP Solar\Project\4. Reporting\Final\2010 09 13 Final Report.docx Revision B - 13 September 2010 i
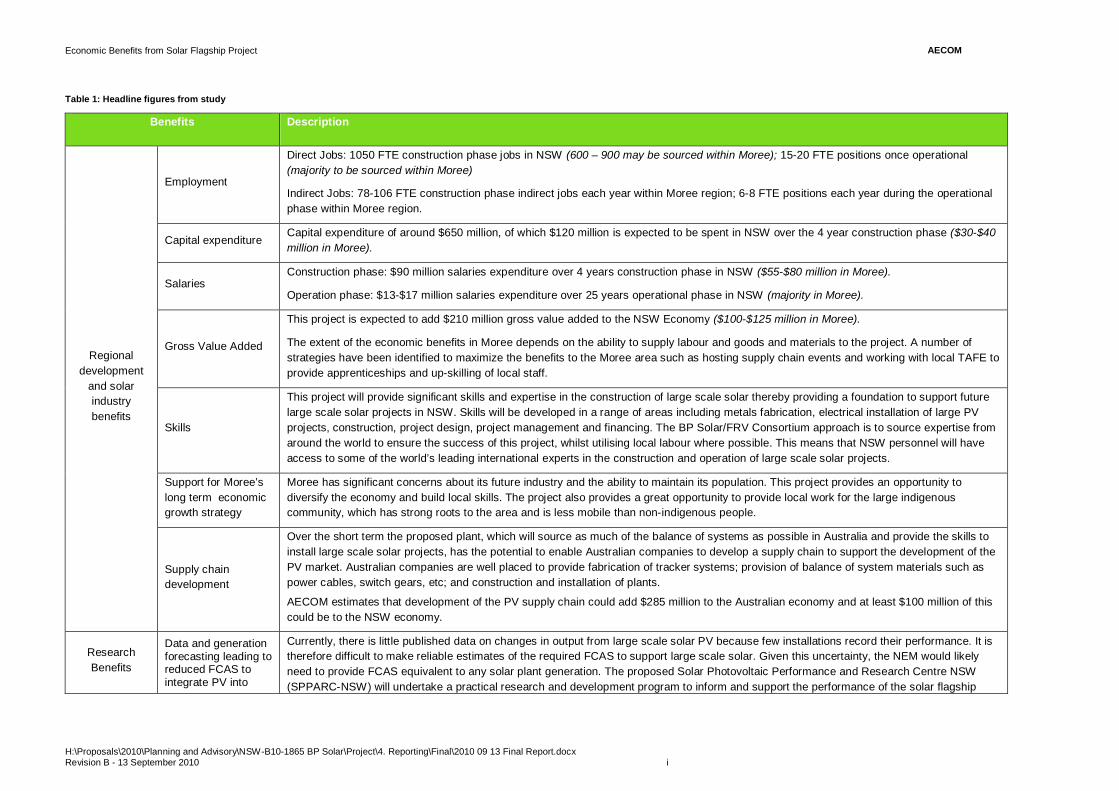
Table 1: Headline figures from study
Benefits Description
Regional development
and solar industry benefits
Employment
Direct Jobs: 1050 FTE construction phase jobs in NSW (600 – 900 may be sourced within Moree); 15-20 FTE positions once operational (majority to be sourced within Moree)
Indirect Jobs: 78-106 FTE construction phase indirect jobs each year within Moree region; 6-8 FTE positions each year during the operational phase within Moree region.
Capital expenditure Capital expenditure of around $650 million, of which $120 million is expected to be spent in NSW over the 4 year construction phase ($30-$40 million in Moree).
Salaries Construction phase: $90 million salaries expenditure over 4 years construction phase in NSW ($55-$80 million in Moree).
Operation phase: $13-$17 million salaries expenditure over 25 years operational phase in NSW (majority in Moree).
Gross Value Added
This project is expected to add $210 million gross value added to the NSW Economy ($100-$125 million in Moree).
The extent of the economic benefits in Moree depends on the ability to supply labour and goods and materials to the project. A number of strategies have been identified to maximize the benefits to the Moree area such as hosting supply chain events and working with local TAFE to provide apprenticeships and up-skilling of local staff.
Skills
This project will provide significant skills and expertise in the construction of large scale solar thereby providing a foundation to support future large scale solar projects in NSW. Skills will be developed in a range of areas including metals fabrication, electrical installation of large PV projects, construction, project design, project management and financing. The BP Solar/FRV Consortium approach is to source expertise from around the world to ensure the success of this project, whilst utilising local labour where possible. This means that NSW personnel will have access to some of the world’s leading international experts in the construction and operation of large scale solar projects.
Support for Moree’s long term economic growth strategy
Moree has significant concerns about its future industry and the ability to maintain its population. This project provides an opportunity to diversify the economy and build local skills. The project also provides a great opportunity to provide local work for the large indigenous community, which has strong roots to the area and is less mobile than non-indigenous people.
Supply chain development
Over the short term the proposed plant, which will source as much of the balance of systems as possible in Australia and provide the skills to install large scale solar projects, has the potential to enable Australian companies to develop a supply chain to support the development of the PV market. Australian companies are well placed to provide fabrication of tracker systems; provision of balance of system materials such as power cables, switch gears, etc; and construction and installation of plants.
AECOM estimates that development of the PV supply chain could add $285 million to the Australian economy and at least $100 million of this could be to the NSW economy.
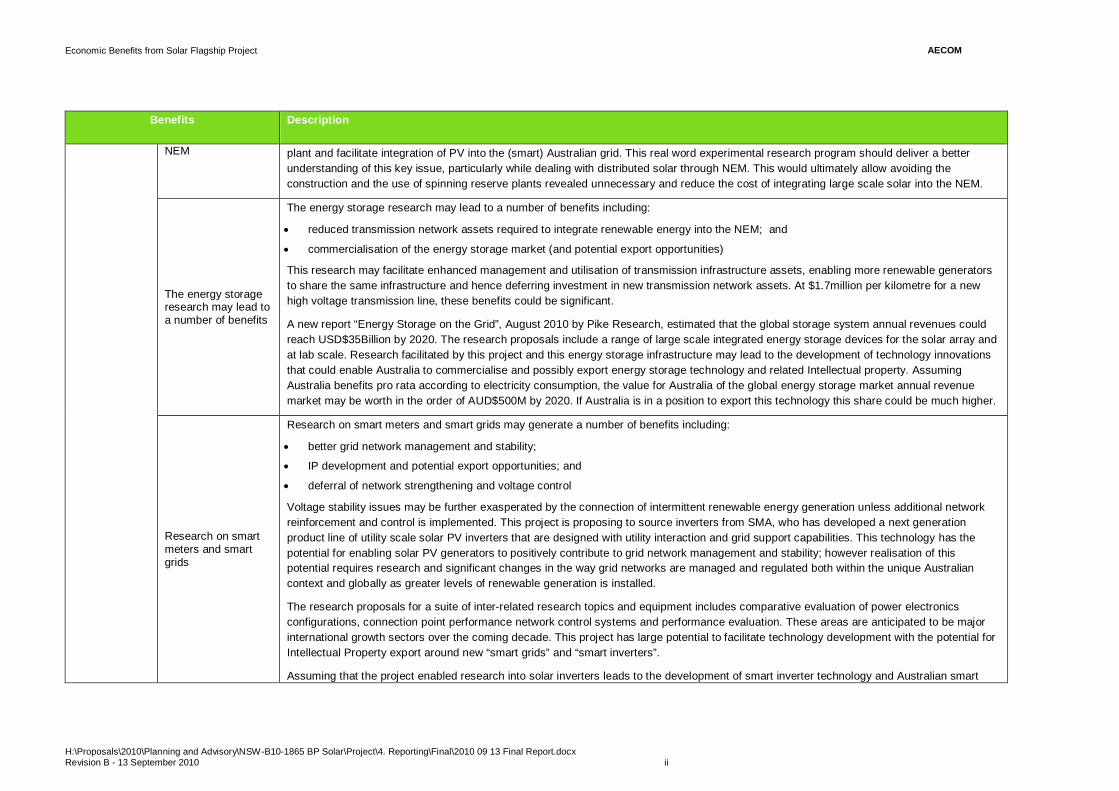
Research Benefits
Data and generation forecasting leading to reduced FCAS to integrate PV into
Currently, there is little published data on changes in output from large scale solar PV because few installations record their performance. It is therefore difficult to make reliable estimates of the required FCAS to support large scale solar. Given this uncertainty, the NEM would likely need to provide FCAS equivalent to any solar plant generation. The proposed Solar Photovoltaic Performance and Research Centre NSW (SPPARC-NSW) will undertake a practical research and development program to inform and support the performance of the solar flagship
AECOMEconomic Benefits from Solar Flagship Project
H:\Proposals\2010\Planning and Advisory\NSW-B10-1865 BP Solar\Project\4. Reporting\Final\2010 09 13 Final Report.docx Revision B - 13 September 2010 ii
Benefits Description
NEM plant and facilitate integration of PV into the (smart) Australian grid. This real word experimental research program should deliver a better understanding of this key issue, particularly while dealing with distributed solar through NEM. This would ultimately allow avoiding the construction and the use of spinning reserve plants revealed unnecessary and reduce the cost of integrating large scale solar into the NEM.
The energy storage research may lead to a number of benefits
The energy storage research may lead to a number of benefits including:
reduced transmission network assets required to integrate renewable energy into the NEM; and
commercialisation of the energy storage market (and potential export opportunities)
This research may facilitate enhanced management and utilisation of transmission infrastructure assets, enabling more renewable generators to share the same infrastructure and hence deferring investment in new transmission network assets. At $1.7million per kilometre for a new high voltage transmission line, these benefits could be significant.
A new report “Energy Storage on the Grid”, August 2010 by Pike Research, estimated that the global storage system annual revenues could reach USD$35Billion by 2020. The research proposals include a range of large scale integrated energy storage devices for the solar array and at lab scale. Research facilitated by this project and this energy storage infrastructure may lead to the development of technology innovations that could enable Australia to commercialise and possibly export energy storage technology and related Intellectual property. Assuming Australia benefits pro rata according to electricity consumption, the value for Australia of the global energy storage market annual revenue market may be worth in the order of AUD$500M by 2020. If Australia is in a position to export this technology this share could be much higher.
Research on smart meters and smart grids
Research on smart meters and smart grids may generate a number of benefits including:
better grid network management and stability;
IP development and potential export opportunities; and
deferral of network strengthening and voltage control
Voltage stability issues may be further exasperated by the connection of intermittent renewable energy generation unless additional network reinforcement and control is implemented. This project is proposing to source inverters from SMA, who has developed a next generation product line of utility scale solar PV inverters that are designed with utility interaction and grid support capabilities. This technology has the potential for enabling solar PV generators to positively contribute to grid network management and stability; however realisation of this potential requires research and significant changes in the way grid networks are managed and regulated both within the unique Australian context and globally as greater levels of renewable generation is installed.
The research proposals for a suite of inter-related research topics and equipment includes comparative evaluation of power electronics configurations, connection point performance network control systems and performance evaluation. These areas are anticipated to be major international growth sectors over the coming decade. This project has large potential to facilitate technology development with the potential for Intellectual Property export around new “smart grids” and “smart inverters”.
Assuming that the project enabled research into solar inverters leads to the development of smart inverter technology and Australian smart
AECOMEconomic Benefits from Solar Flagship Project
H:\Proposals\2010\Planning and Advisory\NSW-B10-1865 BP Solar\Project\4. Reporting\Final\2010 09 13 Final Report.docx Revision B - 13 September 2010 iii
Benefits Description
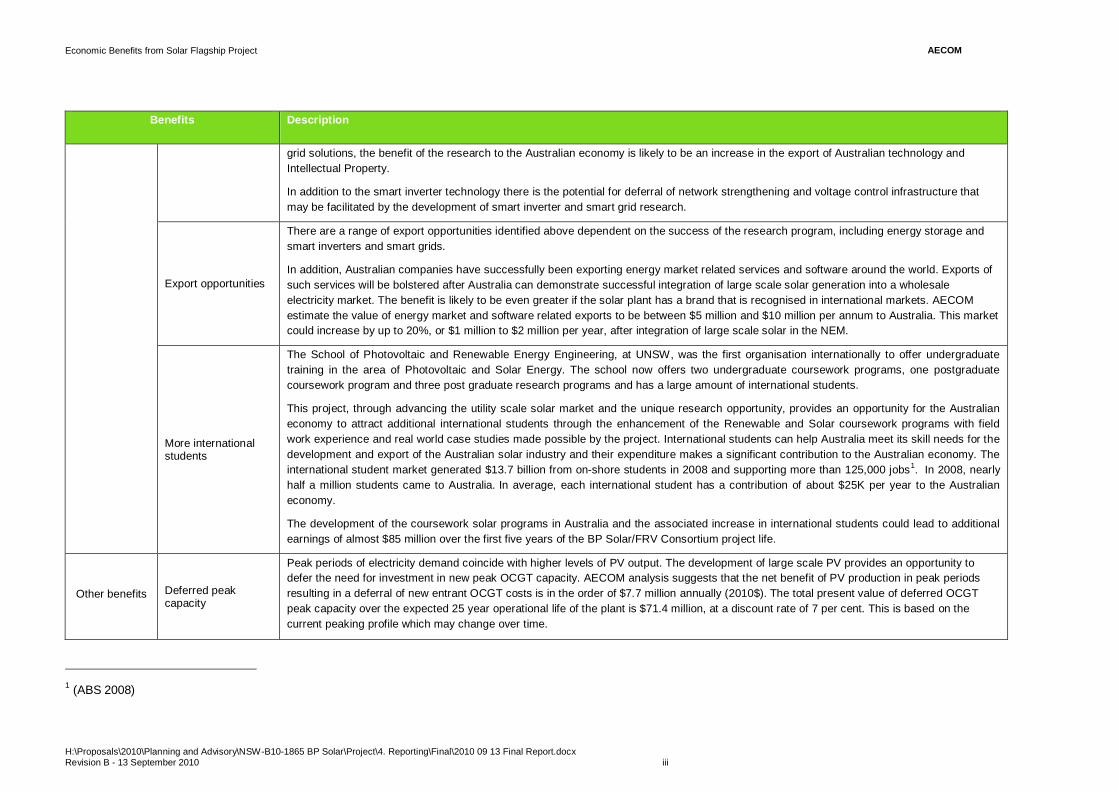
grid solutions, the benefit of the research to the Australian economy is likely to be an increase in the export of Australian technology and Intellectual Property.
In addition to the smart inverter technology there is the potential for deferral of network strengthening and voltage control infrastructure that may be facilitated by the development of smart inverter and smart grid research.
Export opportunities
There are a range of export opportunities identified above dependent on the success of the research program, including energy storage and smart inverters and smart grids.
In addition, Australian companies have successfully been exporting energy market related services and software around the world. Exports of such services will be bolstered after Australia can demonstrate successful integration of large scale solar generation into a wholesale electricity market. The benefit is likely to be even greater if the solar plant has a brand that is recognised in international markets. AECOM estimate the value of energy market and software related exports to be between $5 million and $10 million per annum to Australia. This market could increase by up to 20%, or $1 million to $2 million per year, after integration of large scale solar in the NEM.
More international students
The School of Photovoltaic and Renewable Energy Engineering, at UNSW, was the first organisation internationally to offer undergraduate training in the area of Photovoltaic and Solar Energy. The school now offers two undergraduate coursework programs, one postgraduate coursework program and three post graduate research programs and has a large amount of international students.
This project, through advancing the utility scale solar market and the unique research opportunity, provides an opportunity for the Australian economy to attract additional international students through the enhancement of the Renewable and Solar coursework programs with field work experience and real world case studies made possible by the project. International students can help Australia meet its skill needs for the development and export of the Australian solar industry and their expenditure makes a significant contribution to the Australian economy. The international student market generated $13.7 billion from on-shore students in 2008 and supporting more than 125,000 jobs1. In 2008, nearly half a million students came to Australia. In average, each international student has a contribution of about $25K per year to the Australian economy.
The development of the coursework solar programs in Australia and the associated increase in international students could lead to additional earnings of almost $85 million over the first five years of the BP Solar/FRV Consortium project life.
Other benefits Deferred peak capacity
Peak periods of electricity demand coincide with higher levels of PV output. The development of large scale PV provides an opportunity to defer the need for investment in new peak OCGT capacity. AECOM analysis suggests that the net benefit of PV production in peak periods resulting in a deferral of new entrant OCGT costs is in the order of $7.7 million annually (2010$). The total present value of deferred OCGT peak capacity over the expected 25 year operational life of the plant is $71.4 million, at a discount rate of 7 per cent. This is based on the current peaking profile which may change over time.
1 (ABS 2008)
AECOMEconomic Benefits from Solar Flagship Project
H:\Proposals\2010\Planning and Advisory\NSW-B10-1865 BP Solar\Project\4. Reporting\Final\2010 09 13 Final Report.docx Revision B - 13 September 2010 i
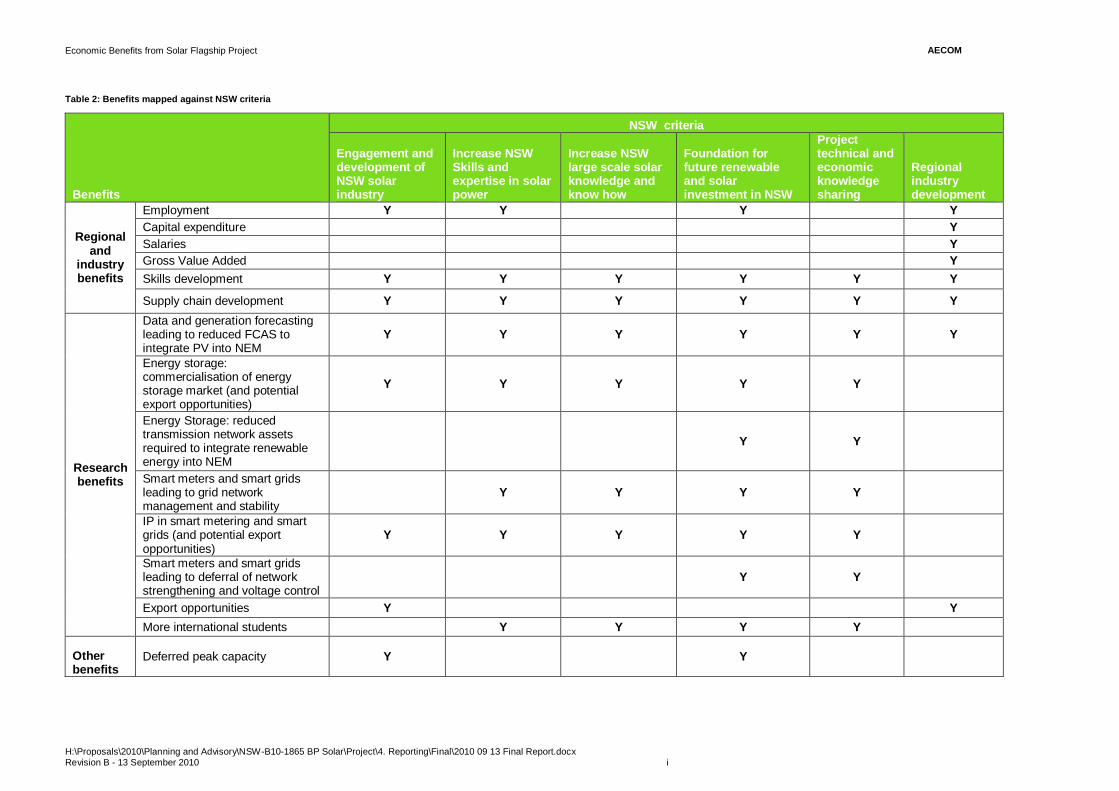
Table 2: Benefits mapped against NSW criteria
Benefits
NSW criteria
Engagement and development of NSW solar industry
Increase NSW Skills and expertise in solar power
Increase NSW large scale solar knowledge and know how
Foundation for future renewable and solar investment in NSW
Project technical and economic knowledge sharing
Regional industry development
Regional and
industry benefits
Employment Y Y Y Y Capital expenditure Y Salaries Y Gross Value Added Y Skills development Y Y Y Y Y Y
Supply chain development Y Y Y Y Y Y
Research benefits
Data and generation forecasting leading to reduced FCAS to integrate PV into NEM
Y Y Y Y Y Y
Energy storage: commercialisation of energy storage market (and potential export opportunities)
Y Y Y Y Y
Energy Storage: reduced transmission network assets required to integrate renewable energy into NEM
Y Y
Smart meters and smart grids leading to grid network management and stability Y Y Y Y
IP in smart metering and smart grids (and potential export opportunities)
Y Y Y Y Y
Smart meters and smart grids leading to deferral of network strengthening and voltage control Y Y
Export opportunities Y Y More international students Y Y Y Y
Deferred peak capacity Y Y Other benefits
AECOMEconomic Benefits from Solar Flagship Project
H:\Proposals\2010\Planning and Advisory\NSW-B10-1865 BP Solar\Project\4. Reporting\Final\2010 09 13 Final Report.docx Revision B - 13 September 2010 1
1.0 Introduction
1.1 Background The Commonwealth Government announced in its May 2009 Budget the establishment of the $4.5 billion Clean Energy Initiative (CEI). CEI includes the Solar Flagships Program, which provides up to $1.5 billion in funding for construction of a total capacity of 1,000 MW, including up to four solar power stations.
The primary objective of the Solar Flagships program is to provide the foundation for large-scale, grid connected, solar power to play a significant role in Australia’s electricity supply and to operate within a competitive electricity market, with the aim of up to 1,000 megawatts (MW) of solar power generation capacity. Other objectives of the Solar Flagships program are to: develop a solar industry in Australia, encourage regional development, provide research infrastructure, develop Australian intellectual property (IP) in solar power generation and develop and share technical and economic knowledge from the Solar Flagships program.
1.2 Project description Under the Solar Flagship program, the BP Solar/FRV Consortium is proposing to build a 150MWac (180MWdc installed) PV plant that will produce approximately 404 GWh of electricity per annum. The plant will be located in the state of New South Wales, specifically in the vicinity of the regional centre of Moree (on approximately 900 hectares on private land near town). Moree has one of the highest solar irradiance profiles in NSW. Moree has good access to labour for the construction and operation of the solar station. The land is well suited for this project being flat, with good soil conditions, free from flooding, and is cleared of vegetation. The Project design is based on BP Solar’s proven and reliable crystalline Solar PV modules backed by an industry leading 25-year warranty and comprehensive performance guarantees. The project will utilise well proven, reliable SMA central inverters and monitoring equipment. These are chosen for highest efficiency, 10 year warranty for installation and lowest mean time for repair/replacement. BP Solar’s proposed mounting solution is a single axis optimum tilt tracker, designed and developed by German company Solea. High quality, Australian sourced transformers and high voltage (HV) switchgear will be sourced for the HV transformer and switchyard; design and installation will be conducted by project consultant, Vemtec in collaboration with Silcar and BP Solar.
CSIRO is the EIF research partner for the project, leading the formation of the Solar Photovoltaic Performance and Analysis Research Centre (SPPARC), utilising EIF infrastructure to undertake a practical research and development program to inform and support the performance of the solar flagship plant and facilitating integration into the grid.
The proposed construction will commence in January 2012, with first connection in December 2012. A phased scale up of capacity will then be undertaken to enable research and operational learning’s to be incorporated, with ramp up from an initial 30MW to 45MW by Dec 2015.
1.3 Study objectives The BP Solar/FRV Consortium has commissioned AECOM to undertake a study to assess the economic benefits of their proposed solar flagship project. A project of this size and nature has the potential to create economic benefits at the local community, regional, state and national level. The BP Solar/FRV Consortium is seeking to ensure this project leaves a sustainable and positive legacy for the local community. As such, AECOM has been asked to identify opportunities that can maximise the economic benefits for the Moree area. The rest of this report sets out the economic and policy context in which the BP Solar/FRV Consortium project is being implemented and the contribution which may be made to the economic performance of the region around Moree, New South Wales and the wider Australian economy.
AECOMEconomic Benefits from Solar Flagship Project
H:\Proposals\2010\Planning and Advisory\NSW-B10-1865 BP Solar\Project\4. Reporting\Final\2010 09 13 Final Report.docx Revision B - 13 September 2010 2
2.0 Alignment with Government policies This project will make a significant contribution to both State and Federal policies on renewable energy generation and greenhouse gas emission reductions.
It is expected that the proposed 150 MW plant, which is expected to be fully operational by 2016, will provide approximately 404GWh per year, contributing 1.8 per cent to the 2016 Large scale Renewable Energy Target. By 2020, the proposed plant would represent 1 per cent of the 2020 Large scale Renewable Energy Target, corresponding to about 0.9 per cent of the total 20 per cent Renewable Energy Target of 2020.
Reductions in greenhouse gas emissions will be achieved by this project, as it displaces generation from other energy sources such as coal. Approximately 404,000 tCO2-e will be abated by this project each year, reflecting the emissions intensity of New South Wales generation that is dominated by coal-fired power plants. These emission reductions can lead to economic benefits as high as $278 million, depending on the implementation of the Carbon Pollution Reduction Scheme.
This project can also contribute to the achievement of a number of priorities as set out in the 2010 New South Wales State Plan, Investing in a Better Future, including developing clean energy and tackling climate change; investment to support business and employment; developing green skills and strengthening Aboriginal communities. In addition, it can make a direct contribution to the New England North West Local Action Plan to attract and retain workers and to boost local skills development to support existing and growing industries.
2.1 Renewable Energy Target The Renewable Energy Target (RET) is an important element of the Federal Government’s initiatives to encourage additional generation of electricity from renewable energy sources. It sets a goal of 20 per cent share of renewables in Australia’s electricity supply in 2020, corresponding to an additional 45,850GWh per year by 2020 to be maintained at 45,000GWh.
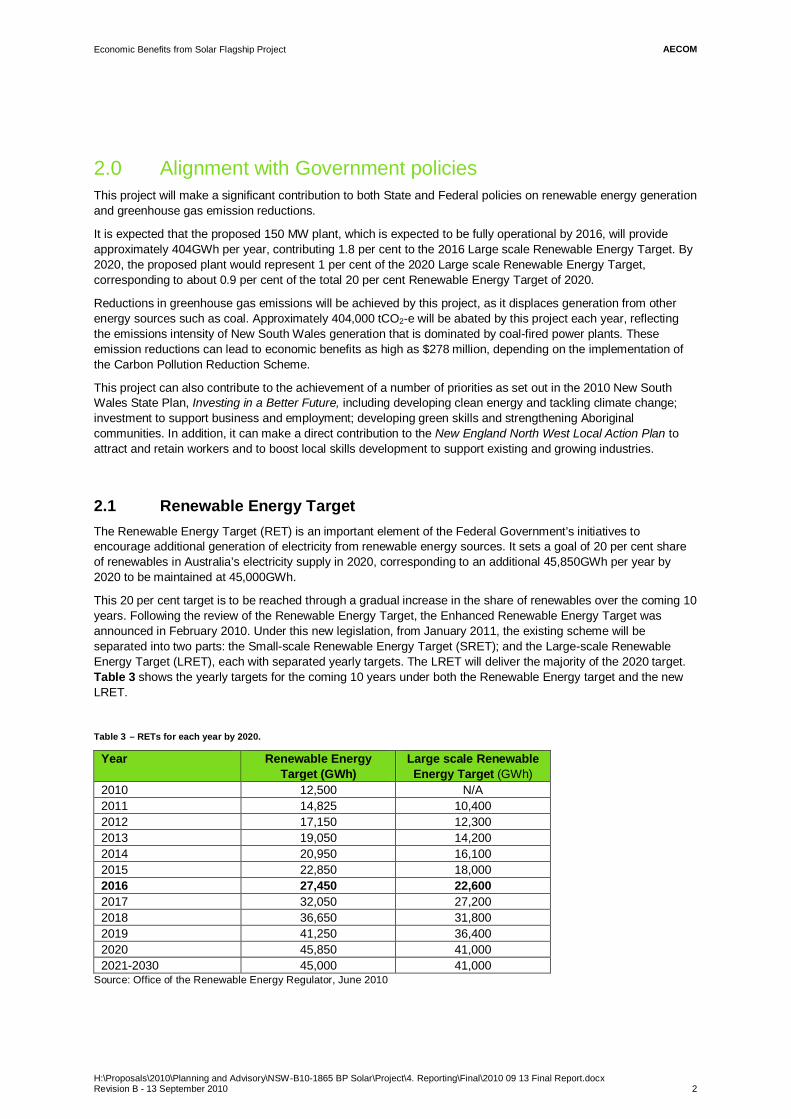
This 20 per cent target is to be reached through a gradual increase in the share of renewables over the coming 10 years. Following the review of the Renewable Energy Target, the Enhanced Renewable Energy Target was announced in February 2010. Under this new legislation, from January 2011, the existing scheme will be separated into two parts: the Small-scale Renewable Energy Target (SRET); and the Large-scale Renewable Energy Target (LRET), each with separated yearly targets. The LRET will deliver the majority of the 2020 target. Table 3 shows the yearly targets for the coming 10 years under both the Renewable Energy target and the new LRET.
Table 3 – RETs for each year by 2020.
Year Renewable Energy Target (GWh)
Large scale Renewable Energy Target (GWh)
2010 12,500 N/A 2011 14,825 10,400 2012 17,150 12,300 2013 19,050 14,200 2014 20,950 16,100 2015 22,850 18,000 2016 27,450 22,600 2017 32,050 27,200 2018 36,650 31,800 2019 41,250 36,400 2020 45,850 41,000 2021-2030 45,000 41,000
Source: Office of the Renewable Energy Regulator, June 2010

AECOMEconomic Benefits from Solar Flagship Project
H:\Proposals\2010\Planning and Advisory\NSW-B10-1865 BP Solar\Project\4. Reporting\Final\2010 09 13 Final Report.docx Revision B - 13 September 2010 3
This project, with a capacity of 150MW, would provide approximately 404GWh per annum. The project is proposed to be in operation in early 2016, when the Renewable Energy Target reaches 27,450GWh. The yearly production of the project would therefore correspond to approximately 1.8 per cent of the LRET and 1.5 per cent of the total 2016 RET. In 2020, the project would represent 1 per cent of the 2020 LRET and 0.9 per cent of the total 20 per cent RET.
2.1 Greenhouse Gas Emissions The Federal Government has committed to reduce Australia’s greenhouse gas (GHG) emissions by 25 per cent below 2000 levels by 2020 if the world agrees on a deal to stabilise or lower the global emission at 450ppm CO2-e and, alternatively, by between 5 per cent and 15 per cent below 2000 levels if the world can’t reach such an agreement. In the longer term, Australia has committed to reduce its emissions by 60 per cent below 2000 levels by 2050.
Carbon Pollution Reduction Scheme
The Carbon Pollution Reduction Scheme (CPRS) would be the main driver in reducing greenhouse gas emissions. The CPRS was introduced to Parliament for the third time in February 2010. It aimed to put a price on carbon using a “cap and trade” emissions trading mechanism that mandates certain greenhouse gas emitters to reduce their emissions, or alternatively to purchase permits each equivalent to one tonne of CO2-e emissions.
Entities that provide an additional reduction of the Australian GHG emissions (by the implementation of green projects) will be granted one permit per tonne of CO2-e reduced via the project and will be able to sell these permits to other entities, whose annual emissions exceed their mandatory emission target.
New South Wales Greenhouse Gas Reduction Scheme (GGAS)
In 2003, the New South Wales Government implemented a separate scheme to reduce greenhouse gas emissions associated with electricity production - the Greenhouse Gas Reduction Scheme (GGAS). As with the proposed CPRS , this scheme based in a “cap and trade” system that requires certain New South Wales electricity retailers to limit their emissions or, alternatively, to purchase permits from other entities that have abated greenhouse gas emissions (by implementing a renewable energy plant that would replace electricity previously produced by coal for example).
Under this scheme, electricity production from additional renewable energy projects can also claim credit for the surrender of Renewable Energy Certificates (RECs). Broadly, for each REC submitted (corresponding to 1MWh of additional electricity produced by a renewable energy source) the equivalent emission reduction to the New South Wales total emission is approximately 1 tCO2-e.
The Greenhouse Gas Reduction Scheme sets a New South Wales greenhouse gas target in tonnes of CO2-e per capita. The initial level was set at the commencement of GGAS in 2003 at 8.65 tonnes. The benchmark progressively dropped to 7.27 tCO2-e per capita in 2007 and continues at this level until 2012.
Contribution of this project
Over the 25 years of its service life, assuming a New South Wales emission factor of approximately 0.9 tCO2-e per MWh2 the solar plant would abate approximately 9.1 million tCO2-e, which corresponds to an annual abatement of 364,000 tCO2-e. This is equivalent to a contribution of 0.7 per cent of the target New South Wales greenhouse gas reductions under GGAS3.
2 Department of Climate Change and Energy Efficiency (2010), National Greenhouse Account (NGA) Factors. Scope 2 emissions only. 3 Assumes 2009 NSW population of 7,191,500 and GGAS target of 7.27 tCO2-e per capita.
AECOMEconomic Benefits from Solar Flagship Project
H:\Proposals\2010\Planning and Advisory\NSW-B10-1865 BP Solar\Project\4. Reporting\Final\2010 09 13 Final Report.docx Revision B - 13 September 2010 4
Economic Benefits
The potential emission savings achieved through the development of this project yield economic benefits. The economic benefits of GHG reductions will be the difference between the CPRS permit price and the recommended social cost of carbon. As such, the economic benefit is dependent on when a CPRS is introduced and the targets set.
The CPRS will be a market price reflecting the value of traded carbon emissions rights given the constraints on supply imposed by the scheme. This, in practice, is often less than the social cost of carbon which seeks to encapsulate the full global cost today of an additional unit of CO2-e emitted now, calculated by summing the full global cost of the damage it imposes over the whole of its time in the atmosphere.
There is a large amount of literature available on the issue of external costs of GHG emissions. International research on the social cost of carbon suggests a figure of around $50 per tonne CO2-e. Recent research for the European Commission recommends a central value of €25 per tonne CO2-e (around A$50 per tonne CO2-e) in 2010 rising to €40 per tonne CO2-e (around A$80 per tonne CO2-e) by 20204.The UK Government recently adopted a value of £25.5 per tonne CO2-e (2007 prices) that increases by 2 per cent per year (around A$65 in 2009). This has been made mandatory for all economic appraisals by the UK Government and was endorsed by the OECD.
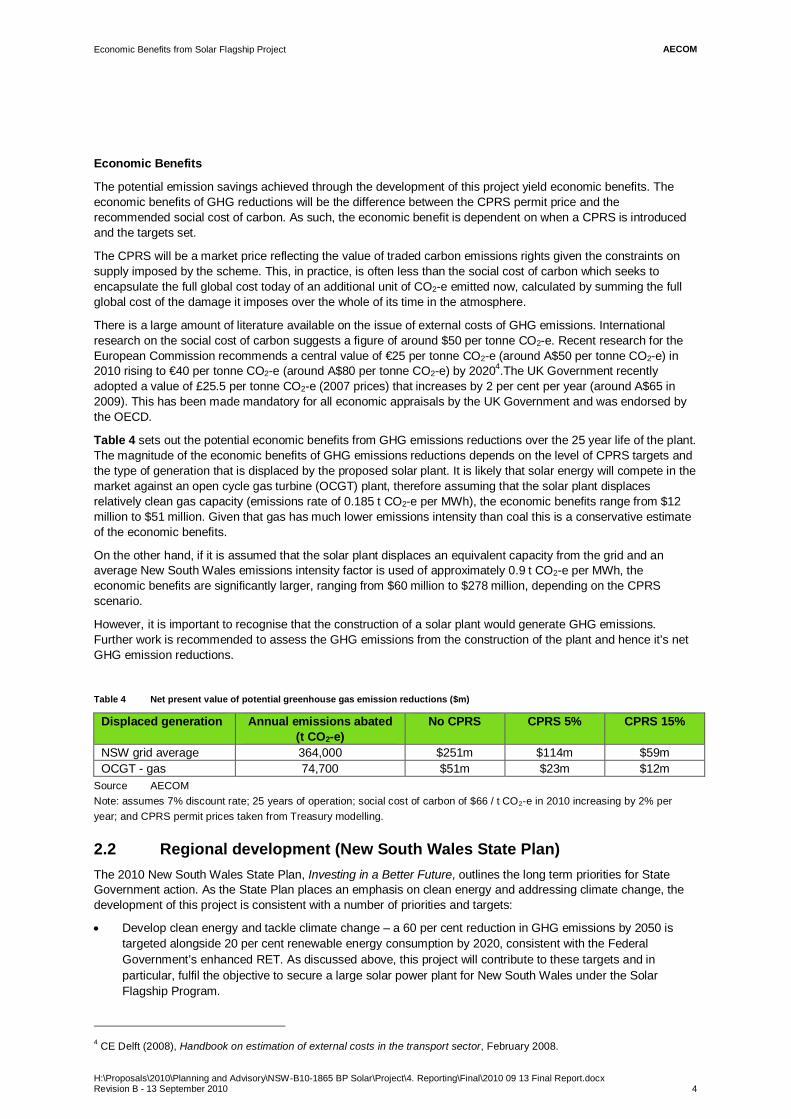
Table 4 sets out the potential economic benefits from GHG emissions reductions over the 25 year life of the plant. The magnitude of the economic benefits of GHG emissions reductions depends on the level of CPRS targets and the type of generation that is displaced by the proposed solar plant. It is likely that solar energy will compete in the market against an open cycle gas turbine (OCGT) plant, therefore assuming that the solar plant displaces relatively clean gas capacity (emissions rate of 0.185 t CO2-e per MWh), the economic benefits range from $12 million to $51 million. Given that gas has much lower emissions intensity than coal this is a conservative estimate of the economic benefits.
On the other hand, if it is assumed that the solar plant displaces an equivalent capacity from the grid and an average New South Wales emissions intensity factor is used of approximately 0.9 t CO2-e per MWh, the economic benefits are significantly larger, ranging from $60 million to $278 million, depending on the CPRS scenario.
However, it is important to recognise that the construction of a solar plant would generate GHG emissions. Further work is recommended to assess the GHG emissions from the construction of the plant and hence it’s net GHG emission reductions.
Table 4 Net present value of potential greenhouse gas emission reductions ($m)
Displaced generation Annual emissions abated (t CO2-e)
No CPRS CPRS 5% CPRS 15%
NSW grid average 364,000 $251m $114m $59m OCGT - gas 74,700 $51m $23m $12m
Source AECOM Note: assumes 7% discount rate; 25 years of operation; social cost of carbon of $66 / t CO2-e in 2010 increasing by 2% per year; and CPRS permit prices taken from Treasury modelling.
2.2 Regional development (New South Wales State Plan) The 2010 New South Wales State Plan, Investing in a Better Future, outlines the long term priorities for State Government action. As the State Plan places an emphasis on clean energy and addressing climate change, the development of this project is consistent with a number of priorities and targets:
Develop clean energy and tackle climate change – a 60 per cent reduction in GHG emissions by 2050 is targeted alongside 20 per cent renewable energy consumption by 2020, consistent with the Federal Government’s enhanced RET. As discussed above, this project will contribute to these targets and in particular, fulfil the objective to secure a large solar power plant for New South Wales under the Solar Flagship Program.
4 CE Delft (2008), Handbook on estimation of external costs in the transport sector, February 2008.

AECOMEconomic Benefits from Solar Flagship Project
H:\Proposals\2010\Planning and Advisory\NSW-B10-1865 BP Solar\Project\4. Reporting\Final\2010 09 13 Final Report.docx Revision B - 13 September 2010 5
Investment to support business and employment – the Government’s second largest investment category is in energy and water to ensure safe and reliable supply to businesses and households. The operation of the project will supply reliable electricity and also provide an ongoing source of employment in the Moree region beyond the construction phase.
Develop green skills and increase access to knowledge and skills in partnership with universities – increased training in green skills is desired to grow high quality low carbon jobs. For example, by 2016 a doubling of university graduates in energy engineering is targeted. The project will generate local employment and thus encourage participation in energy related training programs to improve the knowledge and skills of the local workforce. In addition, the Education Investment Fund (EIF) component in this project will allow researchers direct access to the largest solar PV plant and is likely to attract researchers from around the world. As discussed in Section 3.7, AECOM has suggested the BP Solar/FRV Consortium explore opportunities to work with universities to offer “field laboratory” courses that complement the strong research opportunities currently offered in NSW.
Strengthen Aboriginal communities – improved social, health and education outcomes are targeted for the Aboriginal communities. This includes creating better training and employment opportunities for Aboriginal people. As the Moree region has a significant Aboriginal population, the development of this project represents a substantial opportunity to strengthen the local Aboriginal community through employment and training. Section 3.7 sets out some strategies to maximise employment opportunities for the indigenous community in Moree.
In addition to the State Plan, the New South Wales Government also published a series of local action plans for the various regions of the state. The New England North West Local Action Plan sets out the key priorities for the region encompassing Moree and other nearby localities such as Narrabri, Inverell, and Gunnedah. It recognises the need to attract and retain frontline workers and to boost local skills development to support existing and growing industries.
AECOMEconomic Benefits from Solar Flagship Project
H:\Proposals\2010\Planning and Advisory\NSW-B10-1865 BP Solar\Project\4. Reporting\Final\2010 09 13 Final Report.docx Revision B - 13 September 2010 6
3.0 Regional Impact and Industry Development
3.1 Overview 3.1.1 Regional impact
This section of the report explores the economic impact of the proposed PV plant in Moree and NSW in terms of gross output, employment and value added. It also identifies opportunities for enhancing these impacts in the local area. Key highlights of the assessment include:
This project fits with the Moree strategy to diversify its economy and reduce its dependence on agriculture and water based industries. Going forward, Moree has real concerns about its future industry and the ability to maintain its population. This project provides an opportunity to diversify the economy and build local skills. The project also provides a great opportunity to provide local work for the large indigenous community, which has strong roots to the area and is less mobile than non-indigenous people.
This project will provide significant economic impacts for the Moree region including: - Direct Jobs: 1050 FTE construction phase jobs (600 – 900 may be sourced within Moree); 15-20 FTE
positions once operational (majority to be sourced within Moree) - Indirect Jobs: 78-106 FTE construction phase indirect jobs each year within Moree region; 6-8 FTE
positions each year during the operational phase within Moree region. - Gross output of $120 million over 4 years construction phase in NSW ($30-$40 million in Moree) - Salaries: $90 million salaries expenditure over 4 years construction phase in NSW ($55-$80 million in
Moree); $13-$17 million salaries expenditure over 25 years operational phase in NSW (majority in Moree)
- Gross Value Added: $210 million gross value added to the NSW Economy ($100-$125 million in Moree)
The extent of the economic benefits in Moree depends on the ability to supply labour and goods and materials to the project. A number of strategies have been identified to maximize the benefits to the Moree area such as hosting supply chain events and working with local TAFE to provide apprenticeships and up-skilling of local staff.
3.1.2 Solar Industry Development
The solar industry is still a relatively new market and, despite good solar resource, Australia has lagged behind in industry development. According to the IEA5, countries with high solar resource and expensive electricity will be the first to reach commercial feasibility for solar projects. Whilst Australia has one of the highest solar resources in the world, it has lagged other countries in the solar industry because of the cheap supply of electricity from fossil fuel. Establishing a solar plant of this size will promote the development of the Australian solar industry and better position Australia to become a global leader in solar technologies.
Over the short term the proposed plant, which will source as much of the balance of systems as possible in Australia, has the potential to enable Australian companies to develop a supply chain to support the development of the PV market. Currently, Australian companies are well placed to provide fabrication of tracker systems; provision of balance of system materials such as power cables, switch gears, etc; and construction and installation of plants. As discussed above, the Federal Government has set a Renewable Energy Target (RET) of 20% of electricity supply from renewable sources by 2020, equating to an additional 45,000GWh nationally. The economic benefits from reaching this target will increase as the proportion of Australian supplied goods and services increases. This project, by allowing the development of a supply chain for the PV market, will ensure a higher proportion of goods and services are sourced from Australia. For example, if 4 per cent of the MRET target of 45,000 GWh were to be provided by PV this would require around 5,000 MW of solar PV. Given the current capacity of the Australian solar industry, perhaps 24% of this would be likely to be sourced in Australia, resulting in around $465million1 value added to the Australian economy.
5 Technology Roadmap: Solar photovoltaic energy, IEA
AECOMEconomic Benefits from Solar Flagship Project
H:\Proposals\2010\Planning and Advisory\NSW-B10-1865 BP Solar\Project\4. Reporting\Final\2010 09 13 Final Report.docx Revision B - 13 September 2010 7
If Australian industry is able to develop a strong PV supply chain capability, providing trackers and mounting frames as well as the electrical balance of system equipment, the value-added to the Australian economy could be around $750million1, an increase of $285 million. Currently, NSW generation is 35% of total Australian generation. Assuming 35% of the PV generation is in NSW, and the supply chain is sourced in NSW, the additional value-added to the NSW economy could be around $100 million. This is likely to be conservative as it ignores the provision of goods and services outside of NSW which would likely occur if the expertise was developed in NSW.
Over the longer term, through demonstrating the viability of utility scale solar projects in Australia, this project is likely to act as a catalyst for other projects. As the demand for PV modules grows the viability of a manufacturing operation located in Australia increases. After there are local manufacturers in place, inverter companies often follow and set up local offices or suppliers. In this case, the majority of the $2.7 billion1 cost of installing 5,000MW of PV would be sourced in Australia with $1.2 billion1 of value added to the Australian economy.
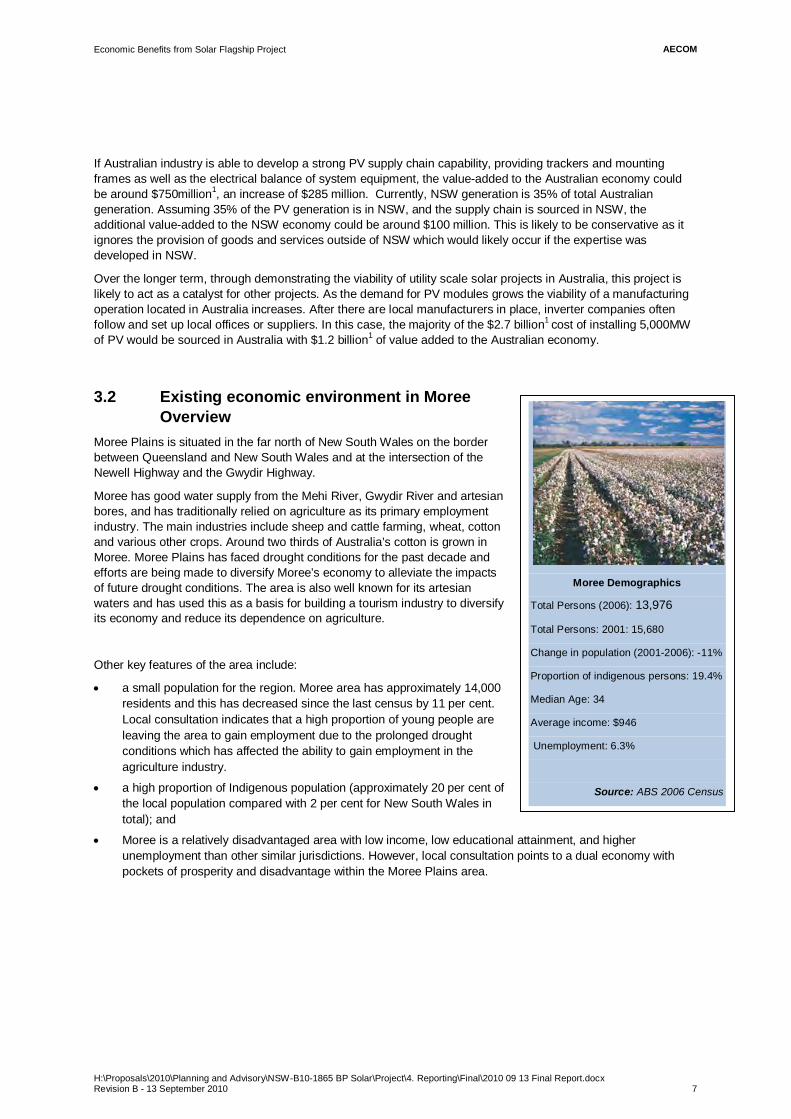
3.2 Existing economic environment in Moree Overview
Moree Plains is situated in the far north of New South Wales on the border between Queensland and New South Wales and at the intersection of the Newell Highway and the Gwydir Highway.
Moree has good water supply from the Mehi River, Gwydir River and artesian bores, and has traditionally relied on agriculture as its primary employment industry. The main industries include sheep and cattle farming, wheat, cotton and various other crops. Around two thirds of Australia’s cotton is grown in Moree. Moree Plains has faced drought conditions for the past decade and efforts are being made to diversify Moree’s economy to alleviate the impacts of future drought conditions. The area is also well known for its artesian waters and has used this as a basis for building a tourism industry to diversify its economy and reduce its dependence on agriculture.
Other key features of the area include:
a small population for the region. Moree area has approximately 14,000 residents and this has decreased since the last census by 11 per cent. Local consultation indicates that a high proportion of young people are leaving the area to gain employment due to the prolonged drought conditions which has affected the ability to gain employment in the agriculture industry.
a high proportion of Indigenous population (approximately 20 per cent of the local population compared with 2 per cent for New South Wales in total); and
Moree is a relatively disadvantaged area with low income, low educational attainment, and higher unemployment than other similar jurisdictions. However, local consultation points to a dual economy with pockets of prosperity and disadvantage within the Moree Plains area.
Moree Demographics
Total Persons (2006): 13,976
Total Persons: 2001: 15,680
Change in population (2001-2006): -11%
Proportion of indigenous persons: 19.4%
Median Age: 34
Average income: $946
Unemployment: 6.3%
Source: ABS 2006 Census

AECOMEconomic Benefits from Solar Flagship Project
H:\Proposals\2010\Planning and Advisory\NSW-B10-1865 BP Solar\Project\4. Reporting\Final\2010 09 13 Final Report.docx Revision B - 13 September 2010 8
3.2.1 Population characteristics
The population characteristics of Moree residents, which affect the local labour force and the economic environment, are shown in Table 5.
Table 5 Population Characteristics
Moree Plains LGA New South Wales 2006 Population 13,976 6,549,177 2001 Population 15,680 6,311,168 % change 2001 to 2006 -11% 4% % of Indigenous persons (comprises Aboriginal and Torres Strait Islander) 19.40% 2.10%
Median age (years) 34 37 Population aged 15 years and over 78.8% 80.2% Population aged 65 years and over 10.4% 13.8% Median weekly household income $946 $1036 2006 occupied dwellings 5,266 2,470,451 2001 occupied dwellings 5,673 2,343,677 % change 2001 to 2006 -407 (-7%) 126,744 (5%)
Source: ABS, 2006 Census QuickStats (Place of usual residence), released 25/10/2007 and 2001 Census Tables (Place of usual residence), released 4/8/2006
These characteristics indicate that:
There are approximately 14,000 persons resident in the Moree Plains Local Government Area (LGA). Between 2001 and 2006 the rate of population in Moree decreased by 11 per cent whilst the New South Wales average increased by 4 per cent. Discussions with the local community suggest the population decline was closer to 7 per cent than 11 per cent and is driven by young people leaving the area to gain employment because of the prolonged drought conditions and the impact on the agriculture industry. Importantly, the population of the area increases considerably during cotton chipping season and in summer due to tourists staying to take advantage of the Spa Baths.
Proportionally, the indigenous population of Moree Plains is significantly greater than for New South Wales as a whole, with indigenous persons making up almost 20 per cent of the local population compared to 2 per cent for New South Wales.
The median age of residents is 34 years which is just under the New South Wales median age of 37. Moree has a slightly lower proportion of the population aged 15-24 (11.5 per cent of the population compared to 13.3per cent for New South Wales) and over 65 (10.4 per cent compared to 13.8 per cent for New South Wales). Over the period 2001 to 2006 a significant proportion of the decreased population was due to peopled aged 20-45 moving away. This is due to a combination of young people moving to larger towns and metropolitan areas and the impact of the drought.
Weekly household income is lower than the New South Wales at an average of $946 per week compared to $1036 per week for New South Wales.
The Socio-Economic Index for Areas (SEIFA) is a suite of four summary measures that have been created from 2006 Census data to explore different aspects of socio-economic conditions by geographic areas. The four indices in SEIFA 2006 are:
Index of Relative Socio-economic Advantage and Disadvantage: is a continuum of advantage (high values) to disadvantage (low values), and is derived from Census variables related to both advantage and disadvantage.
Index of Relative Socio-economic Disadvantage: focuses primarily on disadvantage, and is derived from Census variables such as low income, low educational attainment, unemployment, and dwellings without motor vehicles.
AECOMEconomic Benefits from Solar Flagship Project
H:\Proposals\2010\Planning and Advisory\NSW-B10-1865 BP Solar\Project\4. Reporting\Final\2010 09 13 Final Report.docx Revision B - 13 September 2010 9
Index of Economic Resources: focuses on financial aspects of advantage and disadvantage, using Census variables relating to residents' incomes, housing expenditure and assets.
Index of Education and Occupation: includes census variables relating to the educational attainment, employment and vocational skills.
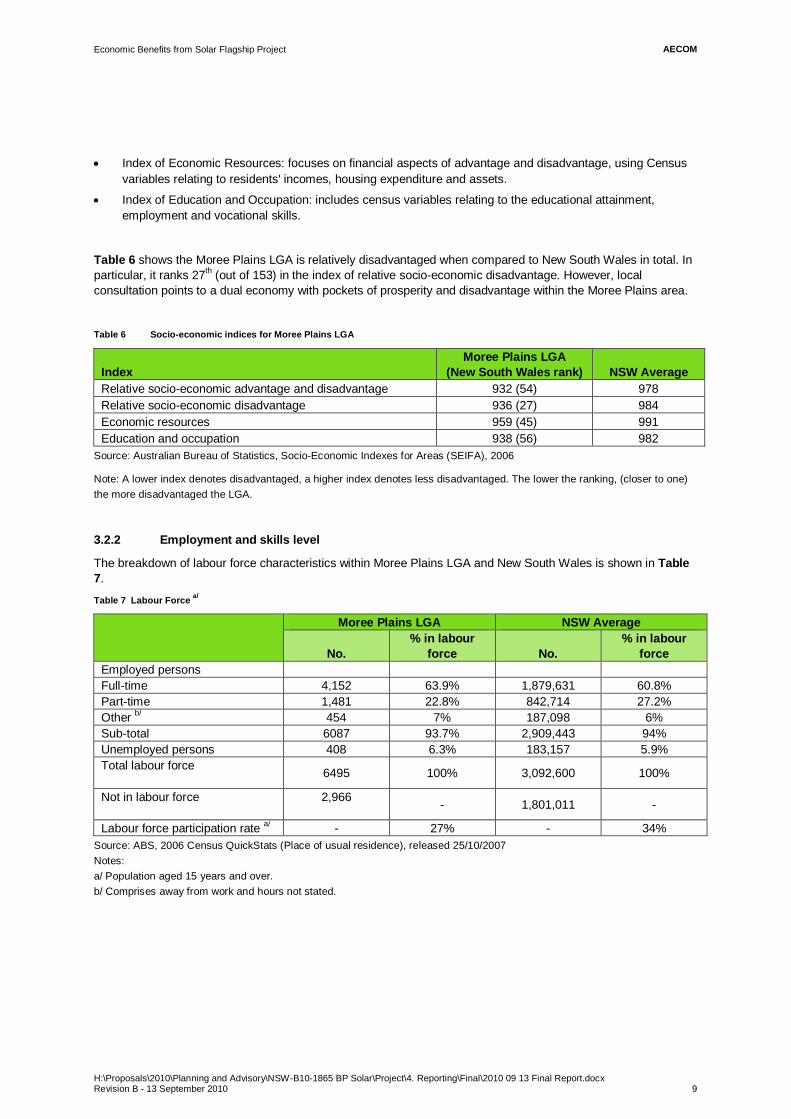
Table 6 shows the Moree Plains LGA is relatively disadvantaged when compared to New South Wales in total. In particular, it ranks 27th (out of 153) in the index of relative socio-economic disadvantage. However, local consultation points to a dual economy with pockets of prosperity and disadvantage within the Moree Plains area.
Table 6 Socio-economic indices for Moree Plains LGA
Index Moree Plains LGA
(New South Wales rank) NSW Average Relative socio-economic advantage and disadvantage 932 (54) 978 Relative socio-economic disadvantage 936 (27) 984 Economic resources 959 (45) 991 Education and occupation 938 (56) 982
Source: Australian Bureau of Statistics, Socio-Economic Indexes for Areas (SEIFA), 2006
Note: A lower index denotes disadvantaged, a higher index denotes less disadvantaged. The lower the ranking, (closer to one) the more disadvantaged the LGA.
3.2.2 Employment and skills level
The breakdown of labour force characteristics within Moree Plains LGA and New South Wales is shown in Table 7.
Table 7 Labour Force a/
Moree Plains LGA NSW Average
No. % in labour
force
No. % in labour
force Employed persons Full-time 4,152 63.9% 1,879,631 60.8% Part-time 1,481 22.8% 842,714 27.2% Other b/ 454 7% 187,098 6% Sub-total 6087 93.7% 2,909,443 94% Unemployed persons 408 6.3% 183,157 5.9% Total labour force 6495 100% 3,092,600 100%
Not in labour force 2,966 - 1,801,011 -
Labour force participation rate a/ - 27% - 34% Source: ABS, 2006 Census QuickStats (Place of usual residence), released 25/10/2007 Notes: a/ Population aged 15 years and over. b/ Comprises away from work and hours not stated.
AECOMEconomic Benefits from Solar Flagship Project
H:\Proposals\2010\Planning and Advisory\NSW-B10-1865 BP Solar\Project\4. Reporting\Final\2010 09 13 Final Report.docx Revision B - 13 September 2010 10
The main features of the table are:
Moree has a slightly higher proportion of persons employed full-time than the New South Wales average (64 per cent compared to 61 per cent), whilst the proportion employed part-time is lower than the state average (23 per cent compared to 27 per cent).
Compared to the state average (5.9 per cent), the unemployment rate is higher in Moree (6.3 per cent).
The labour force participation rate (the share of the population aged 15 years and over in the labour force) is substantially lower than for New South Wales as a whole – 27 per cent for Moree and 34 per cent for New South Wales.
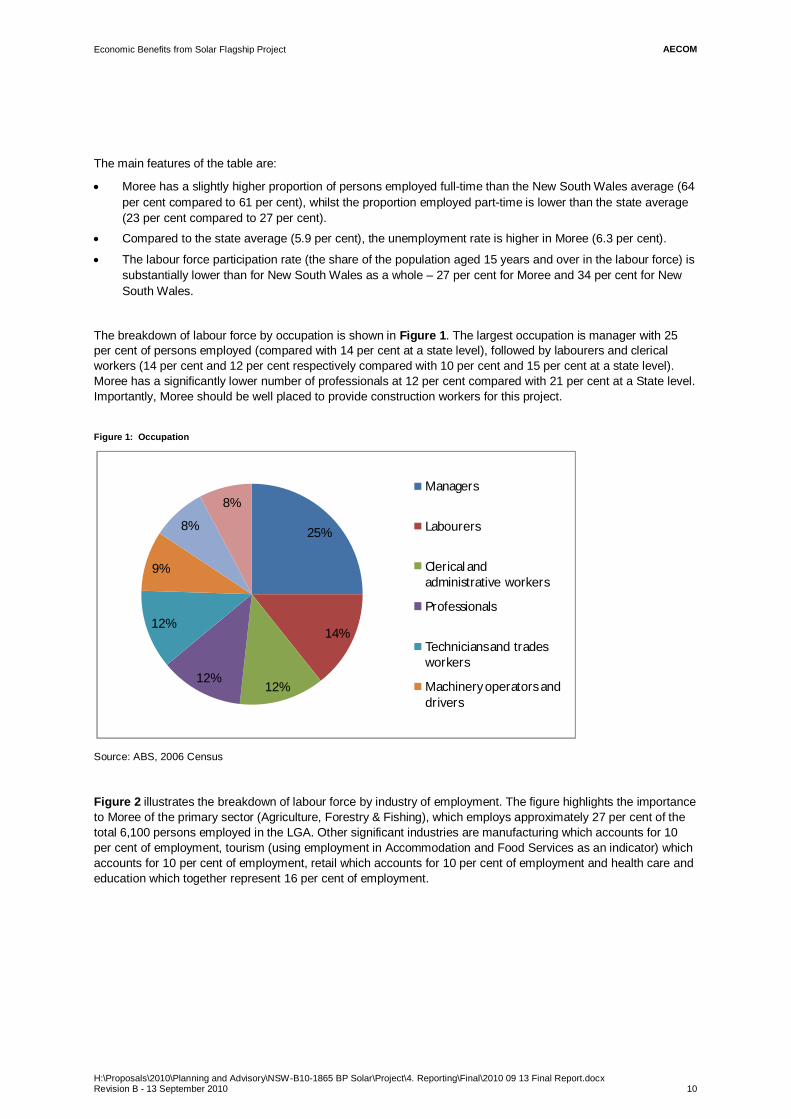
The breakdown of labour force by occupation is shown in Figure 1. The largest occupation is manager with 25 per cent of persons employed (compared with 14 per cent at a state level), followed by labourers and clerical workers (14 per cent and 12 per cent respectively compared with 10 per cent and 15 per cent at a state level). Moree has a significantly lower number of professionals at 12 per cent compared with 21 per cent at a State level. Importantly, Moree should be well placed to provide construction workers for this project.
Figure 1: Occupation
Source: ABS, 2006 Census
Figure 2 illustrates the breakdown of labour force by industry of employment. The figure highlights the importance to Moree of the primary sector (Agriculture, Forestry & Fishing), which employs approximately 27 per cent of the total 6,100 persons employed in the LGA. Other significant industries are manufacturing which accounts for 10 per cent of employment, tourism (using employment in Accommodation and Food Services as an indicator) which accounts for 10 per cent of employment, retail which accounts for 10 per cent of employment and health care and education which together represent 16 per cent of employment.
25%
14%
12%12%
12%
9%
8%
8%Managers
Labourers
Clerical and administrative workers
Professionals
Technicians and trades workers
Machinery operators and drivers

AECOMEconomic Benefits from Solar Flagship Project
H:\Proposals\2010\Planning and Advisory\NSW-B10-1865 BP Solar\Project\4. Reporting\Final\2010 09 13 Final Report.docx Revision B - 13 September 2010 11
Figure 2 Proportion of employment by industry
Source: ABS Census 2006
Education services and skills level
There are four primary schools and one secondary school (divided into two campuses- Albert St Campus and Carol Ave Campus) in the Moree region, in addition to the Barwon Learning Centre, a special needs school.
The New England Institute of TAFE operates a campus in Moree offering programs such as Aboriginal art and culture, cotton ginning, business services, information technology, engineering trades and carpentry and joinery. The Aboriginal art and culture programs have received national and international exposure, whilst the cotton ginning program is nationally recognised.
The University of New England (located in Armidale), in collaboration with the New England Institute of TAFE, also provides a regional access centre with IT equipment to facilitate distance learning.
Table 8 shows the number of non-school qualifications achieved by persons in Moree Plains. Approximately 35 per cent of respondents indicated they had achieved a certificate level of education. Only 15 per cent had bachelor level degrees and 1 per cent had postgraduate degrees.
Table 8 Non-school qualification (does not include secondary school)
Qualification Number Proportion Postgraduate Degree 62 1% Graduate Diploma and Graduate Certificate 78 2% Bachelor Degree 713 15% Advanced Diploma and Diploma 487 10% Certificate 1,702 35% Level of education inadequately described 124 3% Level of education not stated 1,653 34% Total 4,819 100%
Source: ABS Census 2006
27%
10%
8%
8%
6%
6%
5%
5%
4%
4%
4%
3% 10%
Agriculture, forestry & fishingRetail trade
Health care & social assistanceEducation & training
Construction
Public administration & safetyAccommodation & food servicesManufacturing
Other services
Transport, postal & warehousingProfessional, scientific & technical servicesWholesale trade
Remainder

AECOMEconomic Benefits from Solar Flagship Project
H:\Proposals\2010\Planning and Advisory\NSW-B10-1865 BP Solar\Project\4. Reporting\Final\2010 09 13 Final Report.docx Revision B - 13 September 2010 12
3.2.3 Industrial structure
The number of businesses in the LGA generally reflects distribution of employment described above. Table 9 shows that there are 963 businesses in agriculture, forestry and fishing industry. The next largest industries in terms of number of businesses are property and business services, construction and retail trade. There are 180 construction companies in Moree, with three of these employing over 100 people. This suggests Moree should have capacity to supply construction workers for this project.
Table 9 Number of businesses by employment size
Industry Number of employees
Total Non employing 1-4 5-19 20-49 50-99 100+
Agriculture forestry and fishing 570 225 132 18 15 3 963 Mining 0 0 Manufacturing 24 12 12 0 3 51 Electricity gas and water supply 0 0 Construction 102 42 30 3 3 180 Wholesale trade 36 18 15 0 3 72 Retail trade 63 36 45 15 3 162 Accommodation cafes and restaurants 6 15 18 6 6 51 Transport and storage 93 18 24 3 138 Communication services 9 9 18 Finance and insurance 54 9 0 63 Property and business services 198 54 24 9 285 Education 0 3 0 3 Health and community services 15 9 6 0 0 30 Cultural and recreational services 18 6 6 0 30 Personal and other services 21 15 3 0 39
Source: ABS Business Register (2007)
Agriculture
Agriculture is a key part of the Moree economy and is generally split into three highly developed agriculture industries:
sheep and cattle - grazing and feedlotting;
dryland cropping – grain, oilseeds, pulses, fodder crops and dryland cotton; and
Irrigated agriculture – cotton and horticulture.
The dependence on agriculture makes the economy vulnerable to a range of external shocks from variations in commodity markets and in weather conditions. The latter has been prominent over recent years with very severe and prolonged drought conditions occurring in the mid 1990s to 1996 and in the 2000s. A recent study by the CSIRO on the future weather in the Border Rivers-Gwydir Catchment forecasts droughts will become more frequent, heat stress on livestock is likely to increase, and irrigated agriculture will come under pressure in terms of water efficiency6. In addition, the Government’s water buy back scheme will put increasing pressure on the agriculture industry. As such, the town is diversifying its economy into other areas, including tourism.
6 Climate Change in the Border Rivers–Gwydir Catchment, prepared for the New South Wales Government by the CSIRO, 2007 http://www.environment.nsw.gov.au/resources/climatechange/BorderRiversGwydirDetailedFinal.pdf

AECOMEconomic Benefits from Solar Flagship Project
H:\Proposals\2010\Planning and Advisory\NSW-B10-1865 BP Solar\Project\4. Reporting\Final\2010 09 13 Final Report.docx Revision B - 13 September 2010 13
Tourism
Moree plays an important role in tourism and hosts a steady influx of visitors, drawn to the town for its reputation as a spa centre for the region, its location on the Newel and Gwydir Highways and its concentration of retail and commercial activities. Moree’s strategy is to diversify its economy and expand the tourism industry. Tourism in Moree is growing at a time when domestic travel has been contracting, leading Moree to rank as the third most visited Local Government Area (LGA) in the New England North West Region (up from 6th in 2001). The new town bypass will provide amenity benefits such as alleviation of heavy through traffic from the town centre and a reduction in noise. In recent years the Moree Plains Council announced a $14 million upgrading for the hot thermal baths subject to funding availability (Moree CBD and Town Entrances, Beautification Strategic Plan, 2010-2015). This development seeks to ensure that Moree becomes a more significant and recognised tourist destination in Australia.
Accommodation
Given the frequent tourists and large amounts of seasonal workers, the town is well equipped to deal with an influx of people into the area. According to the tourist information centre, there are 35 commercial accommodation properties in Moree Plains Shire. Of these 24 are located in Moree township, with the Moree properties providing accommodation units (rooms, apartments etc).
Moree has 19 motels, with these properties providing 534 rooms. This presently includes one four star motel property, seven 3.5 star standard properties (with these properties providing 287 rooms), six 3 star properties corresponding of 115 rooms (21.5% of rooms) and five budget properties of 2-2.5 star standard, with these properties providing 84 rooms (15.7% of rooms). Moree also has three caravan parks. At peak times, the Park has over 600 guests, many of whom are elderly.
As set out in Table 10, average occupancy varies between 40-55 per cent during the year, suggesting there is room to accommodate additional visitors in Moree.
Table 10: Average occupancy rates of hotels, motels and serviced apartments in Moree
Q1 2009
Q2 2009
Q3 2009
Q4 2009
Q1 2010
Average occupancy rate 42.4% 54.8% 54.7% 50.1% 42.0% Source: ABS Tourist Accommodation, March 2010
Manufacturing
Overall, manufacturing in Moree is well below the New South Wales average share of employment accounting for only 5 per cent of employment. However, within manufacturing, the metal industries and associated metal fabrication, agricultural machinery and repairs industries are significant in Moree. The Moree Plains Growth Management Strategy identified these activities as the strength of the Moree regional economy with some potential capacity to service the needs of agriculture in the region and elsewhere. This suggests Moree is well placed to provide required the labour for metals fabrication work.
Table 11: People employed within the metals and machinery
People employed within industry 2006
Fabricated metal products 17 Machinery and equipment manufacturing 42 Primary metal and metal product manufacturing 36
Source: 2006 Census Tables Cat. No. 2068.0
AECOMEconomic Benefits from Solar Flagship Project
H:\Proposals\2010\Planning and Advisory\NSW-B10-1865 BP Solar\Project\4. Reporting\Final\2010 09 13 Final Report.docx Revision B - 13 September 2010 14
The local economic development manager identified 16 metal fabrication companies in the Moree area. By virtue of operating within a prime agricultural area, these firms have established exceptional skills in both heavy and light industry. The seasonal and sometime volatile nature of the agricultural sector has also required these firms to expand and diversify their operations. Many of the firms have well established national clientele and a number of these firms specialise in 'in house' design and the production of custom machinery with required long life operations.
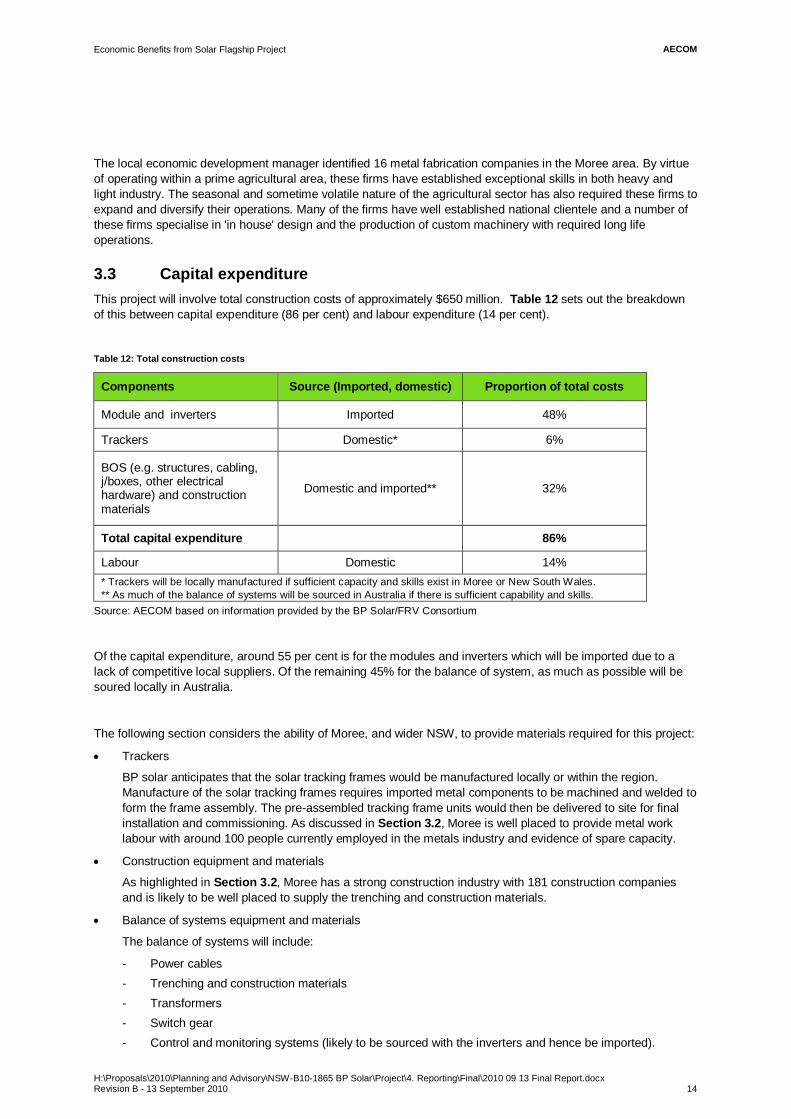
3.3 Capital expenditure This project will involve total construction costs of approximately $650 million. Table 12 sets out the breakdown of this between capital expenditure (86 per cent) and labour expenditure (14 per cent).
Table 12: Total construction costs
Components Source (Imported, domestic) Proportion of total costs
Module and inverters Imported 48%
Trackers Domestic* 6%
BOS (e.g. structures, cabling, j/boxes, other electrical hardware) and construction materials
Domestic and imported** 32%
Total capital expenditure 86%
Labour Domestic 14% * Trackers will be locally manufactured if sufficient capacity and skills exist in Moree or New South Wales. ** As much of the balance of systems will be sourced in Australia if there is sufficient capability and skills.
Source: AECOM based on information provided by the BP Solar/FRV Consortium
Of the capital expenditure, around 55 per cent is for the modules and inverters which will be imported due to a lack of competitive local suppliers. Of the remaining 45% for the balance of system, as much as possible will be soured locally in Australia.
The following section considers the ability of Moree, and wider NSW, to provide materials required for this project:
Trackers
BP solar anticipates that the solar tracking frames would be manufactured locally or within the region. Manufacture of the solar tracking frames requires imported metal components to be machined and welded to form the frame assembly. The pre-assembled tracking frame units would then be delivered to site for final installation and commissioning. As discussed in Section 3.2, Moree is well placed to provide metal work labour with around 100 people currently employed in the metals industry and evidence of spare capacity.
Construction equipment and materials
As highlighted in Section 3.2, Moree has a strong construction industry with 181 construction companies and is likely to be well placed to supply the trenching and construction materials.
Balance of systems equipment and materials
The balance of systems will include:
- Power cables - Trenching and construction materials - Transformers - Switch gear - Control and monitoring systems (likely to be sourced with the inverters and hence be imported).
AECOMEconomic Benefits from Solar Flagship Project
H:\Proposals\2010\Planning and Advisory\NSW-B10-1865 BP Solar\Project\4. Reporting\Final\2010 09 13 Final Report.docx Revision B - 13 September 2010 15
Currently, the Australian PV industry is relatively small. Australia’s only domestic manufacturer, BP Solar, closed its facility in western Sydney in March 2009. The facility has since been acquired by Silex Solar and production has commenced in early 2010. It should be noted that Origin Energy has established a pilot research and manufacturing plant in South Australia to produce small quantities of cells based on Sliver technology. Beyond cell and module manufacturing, there is a small number of companies manufacturing or retailing balance-of-plant components such as inverters, batteries and mounting frames. However, these firms specialise in small scale PV systems.
It appears that, whilst there are a few niche component manufacturers in Australia, the majority of components are likely to need to be imported. However, Australia has a strong capability and capacity for assembly of components into products. There are a number of established electrical component suppliers within Australia that can supply imported electrical components, transformers, switchgear, cables. For example ABB (based in NSW, VIC and WA), Siemens Ariva (based in VIC), Schneider (based in NSW). It is not apparent that any firms in Moree could supply the above equipment. Having said that, there is an electrical wholesaler called Hayman’s located in Moree that supplies most of the electrical equipment for other major construction projects. It is possible Hayman’s could undertake a joint venture with other companies to provide the electrical equipment for this project.
Overall, it is likely that Moree can provide trackers and construction equipment and materials but is unlikely to be able to provide much of the balance of system electrical equipment. Whilst this is currently not a big market for Australia, there is existing capacity, including in NSW, that could be utilised to provide much of the electrical equipment.
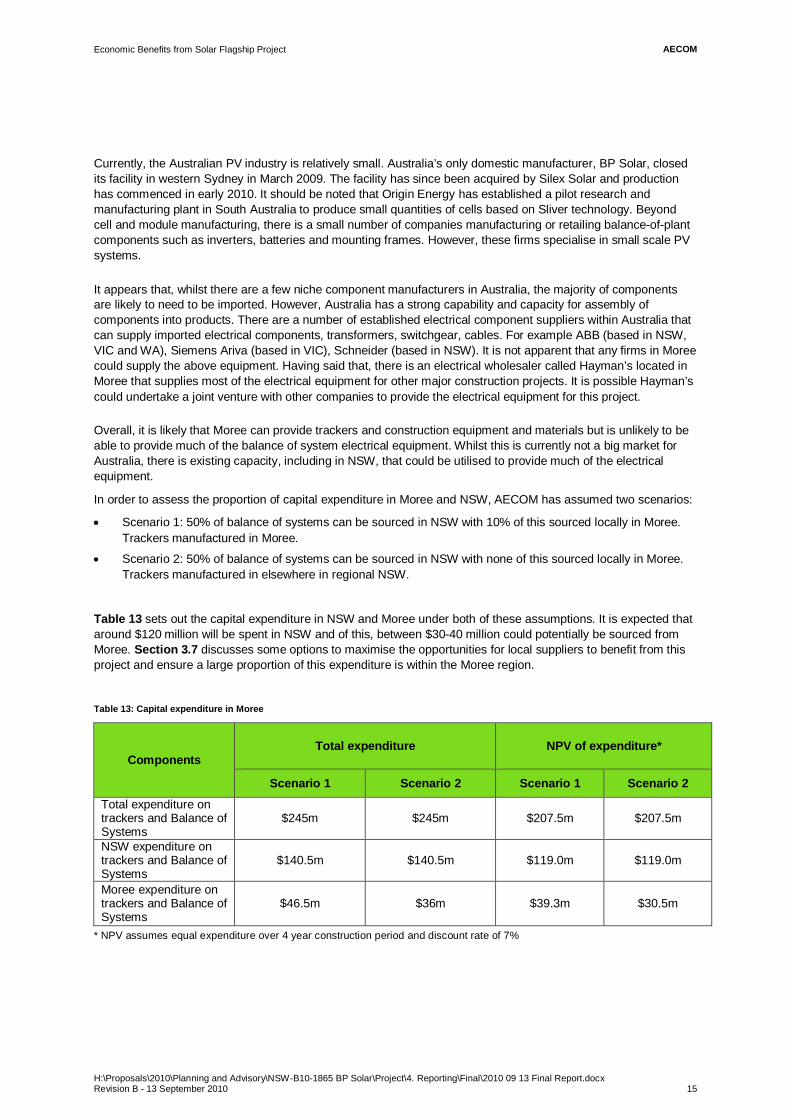
In order to assess the proportion of capital expenditure in Moree and NSW, AECOM has assumed two scenarios:
Scenario 1: 50% of balance of systems can be sourced in NSW with 10% of this sourced locally in Moree. Trackers manufactured in Moree.
Scenario 2: 50% of balance of systems can be sourced in NSW with none of this sourced locally in Moree. Trackers manufactured in elsewhere in regional NSW.
Table 13 sets out the capital expenditure in NSW and Moree under both of these assumptions. It is expected that around $120 million will be spent in NSW and of this, between $30-40 million could potentially be sourced from Moree. Section 3.7 discusses some options to maximise the opportunities for local suppliers to benefit from this project and ensure a large proportion of this expenditure is within the Moree region.
Table 13: Capital expenditure in Moree
Components Total expenditure NPV of expenditure*
Scenario 1 Scenario 2 Scenario 1 Scenario 2
Total expenditure on trackers and Balance of Systems
$245m $245m $207.5m $207.5m
NSW expenditure on trackers and Balance of Systems
$140.5m $140.5m $119.0m $119.0m
Moree expenditure on trackers and Balance of Systems
$46.5m $36m $39.3m $30.5m
* NPV assumes equal expenditure over 4 year construction period and discount rate of 7%

AECOMEconomic Benefits from Solar Flagship Project
H:\Proposals\2010\Planning and Advisory\NSW-B10-1865 BP Solar\Project\4. Reporting\Final\2010 09 13 Final Report.docx Revision B - 13 September 2010 16
3.4 Employment 3.4.1 Labour requirements during construction phase
This project will create significant employment opportunities within the Moree and wider regional NSW area.
There are a range of studies that estimate the number of jobs created in solar projects. A study by Greenpeace and the European Photovoltaic Industry Association (EPVA), estimates that 49 jobs are created per MW of solar PV installed7. Table 14 sets out the breakdown of jobs by category. This is consistent with work by Access Economics for the Clean Energy Council on the costs structure of Solar PV system implementation8. This showed that of the final cost of a PV system, 43 per cent was accounted for by product costs. The remaining 47 per cent (GST accounts for 10 per cent) comprised manufacturing, delivery and installation costs. Manufacturing accounted for around 20 per cent of these, consistent with the findings in the Greenpeace and EPVA report.
Table 14: Jobs created per MW installed
Area FTE jobs per MW installed Production 10 (20%) Installation 33 (67%) Wholesaling and indirect supply 2-3 (6%) Research 1-2 (4%) Total 49
Source: Greenpeace and the European Photovoltaic Industry Association, 2008
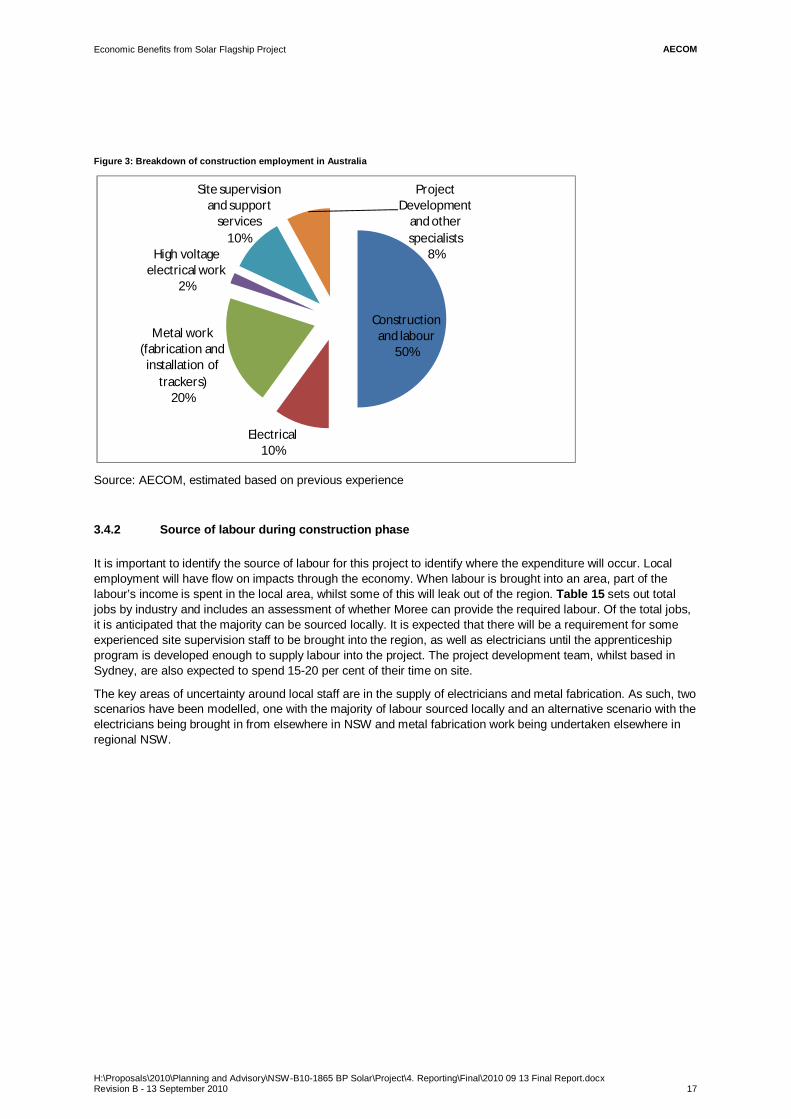
However, to date most solar projects have been relatively small and predominantly roof top installations. Research in the US, which focused on the commercial and utility PV market, found the wafer, cell and module production created around 11FTE/MW, the BOS components created around 3 FTE/MW, system integration around 3 FTE/MW, installation around 7FTE/MW and annual O&M around 0.5FTE/MW9. They also found that the total employment will decrease over time due to decreasing labour intensity from learning curve effects. However, the majority of this decreasing labour intensity occurs in the manufacturing of wafers, cells and modules. A recent report by Access Economics, which looks specifically at the Australian market, estimates 10 FTE/MW installed capacity for solar PV10. In order to present a conservative estimate, AECOM has assumed 10FTE/MW installed, giving a total of 1500 jobs. However, these 1500 jobs relates to the whole supply chain, including the manufacture of PV and inverters which will occur outside of Australia. AECOM estimates that of the 1500 jobs, 70 per cent will be based in Australia, with the breakdown between types of employment presented in Figure 3. This is consistent with the Navigant report which installation employment is 7FTE/MW.
7 Greenpeace and the European Photovoltaic Industry Association, ‘Solar Generation V – 2008: Solar electricity for over one billion people and two million jobs by 2020’, p 48 8 Access Economics Pty Ltd for the Clean Energy Council, The Economics of Feed-in Tariffs for solar PV in Australia, November 2008, p24 9 Navigant Consulting for the Solar Energy Research and Education foundation (SEREF), Economic Impacts of Extending Federal Solar Tax Credits, September 2008. 10 Access Economics for the Clean Energy Council, The net employment impacts of climate change policies, June 2009, p15
AECOMEconomic Benefits from Solar Flagship Project
H:\Proposals\2010\Planning and Advisory\NSW-B10-1865 BP Solar\Project\4. Reporting\Final\2010 09 13 Final Report.docx Revision B - 13 September 2010 17
Figure 3: Breakdown of construction employment in Australia
Source: AECOM, estimated based on previous experience
3.4.2 Source of labour during construction phase
It is important to identify the source of labour for this project to identify where the expenditure will occur. Local employment will have flow on impacts through the economy. When labour is brought into an area, part of the labour’s income is spent in the local area, whilst some of this will leak out of the region. Table 15 sets out total jobs by industry and includes an assessment of whether Moree can provide the required labour. Of the total jobs, it is anticipated that the majority can be sourced locally. It is expected that there will be a requirement for some experienced site supervision staff to be brought into the region, as well as electricians until the apprenticeship program is developed enough to supply labour into the project. The project development team, whilst based in Sydney, are also expected to spend 15-20 per cent of their time on site.
The key areas of uncertainty around local staff are in the supply of electricians and metal fabrication. As such, two scenarios have been modelled, one with the majority of labour sourced locally and an alternative scenario with the electricians being brought in from elsewhere in NSW and metal fabrication work being undertaken elsewhere in regional NSW.
Construction and labour
50%
Electrical10%
Metal work (fabrication and
installation of trackers)
20%
High voltage electrical work
2%
Site supervision and support
services10%
Project Development
and other specialists
8%

AECOMEconomic Benefits from Solar Flagship Project
H:\Proposals\2010\Planning and Advisory\NSW-B10-1865 BP Solar\Project\4. Reporting\Final\2010 09 13 Final Report.docx Revision B - 13 September 2010 18
Table 15: Types of jobs and source of labour
Area Description and Source Employment
Construction and labour
Construction labour is required for site preparation and equipment installation. Tasks include plant and machinery operation, ground clearing and preparation, erecting fences, digging trenches, laying conduits and cable ducts, constructing road junctions access tracks and equipment foundations. This will include a mix of unskilled manual labour and semi-skilled plant and machinery operators.
Lifting and basic assembly laying out PV modules onto frames has also been included as a labourer activity here. (Basic assembly defined here as the repetitive task of using nuts and bolts to affix solar panels to a frame). It is assumed that onsite training and supervision would be provided for staff involved in lifting and basic assembly of laying out PV modules on frames.
Capacity and capability of Moree to supply required labour
Analysis in Section 3.3, as well as discussions with the local economic development manager, suggest Moree is well placed to provide construction labour. Moree has 181 construction companies and currently employs 385 people within the construction industry with 37% technicians and trade workers, 21% machinery operators and drivers and 16% labourers.
Total: 525 Annual: 131
Electrical Solar panels automatically generate electricity under sunlight: hence electrical installation and interconnection requires special consideration of these hazards which potentially includes working with live circuits and equipment at voltages up to 1000V dc. Experienced domestic electricians would typically require additional training before undertaking solar PV installation. It is anticipated that some local training could be delivered in partnership with local TAFE to up-skill existing electricians.
Tasks would include installation of cables, switch gear, connectors, junction boxes and fuse boxes. Electrical testing of cables and circuits, grounding equipment. Interconnection of solar panels to form strings. Installation and commissioning of electrical supplies to tracking motors, instrumentation and data cables.
Capacity and capability of Moree to supply required labour
Analysis in Section 3.3 suggests there will not be enough electricians in Moree for this project and resource may need to be brought in from outside the region. There are currently 63 people registered as technician and trade workers, which includes electricians. There are around 17 local electrician companies each employing around 2 people, suggesting around 30 electricians in the local labour market. Many of these specialise in Industrial and Commercial work. Examples of significant works completed by these firms include: the wire and refit of Cargill Oil Seeds, a large industrial oil processing plant, the wire and refit of concrete batching plants and the wire and refit of coal and quarry operations within the Narrabri and Gunnedah coal basins.
There will be a high supply of electricians in the densely populated coastal areas of NSW which can provide this labour.
The phasing of this project, over a four year period, provides an opportunity to work with the local TAFE to provide apprenticeships for electricians. This allows the project to contribute to the long term development of a skilled labour force in Moree. However, students may not graduate before the start of construction, so the apprenticeship would need to be phased with students starting onsite from the 2nd year of their apprenticeship. As such, there is likely to be a ramp up period with electricians from the coast brought in at the beginning and phased out as the apprenticeships develop through their studies.
Total: 105
Annual: 26

AECOMEconomic Benefits from Solar Flagship Project
H:\Proposals\2010\Planning and Advisory\NSW-B10-1865 BP Solar\Project\4. Reporting\Final\2010 09 13 Final Report.docx Revision B - 13 September 2010 19
Area Description and Source Employment
Metal work (fabrication and installation of trackers)
BP solar anticipates that the solar tracking frames could be manufactured locally or within the region. Manufacture of the solar tracking frames requires imported metal components to be machined and welded to form the frame assembly.
The pre-assembled tracking frame units would then be delivered to site for final installation and commissioning.
Capacity and capability of Moree to supply required labour
Analysis in Section 3.3 as well as discussions with the local economic development manager suggests Moree is well placed to provide metal work labour. Whilst manufacturing as a whole is not a large proportion of the Moree economy, Moree has developed a regional centre of excellence in the metal industries and associated metal fabrication. There are currently around 100 people employed in the metals industry. The Moree Plains Shire Growth Management Strategy11 identifies spare capacity to service the needs of agriculture in the region and elsewhere. Anecdotal evidence suggests there are a number of people currently not in the labour force with these skills from previous agriculture work.
There is potential scope for developing TAFE training in metal work fabrication and welding skills to supplement the existing local skills base.
Total: 210 Annual: 53
High voltage electrical work
High voltage electrical specialists are required for installing and commissioning the AC collection circuits and equipment for integrating the AC electrical output of the inverters and making the connection to the grid.
The majority of the high voltage AC electrical work will be required in discrete stages, with some initial work preparing the grid connection and site at the start of the project and the majority of the remainder of the activity towards the end of installation phase of each section of PV with some additional work during commissioning.
High voltage electrical work would need to be undertaken by people within the utility transmission and distribution sector such as Transgrid or equivalently qualified personnel. Country Energy has a local presence in the region which could probably work on the 132kV line and Transgrid will have local representation that could undertake this work.
Capacity and capability of Moree to supply required labour
There are currently 2 local firms licensed to conduct high voltage work within the Shire and there are 2 firms that regularly service the region from outside the Shire (Local Council).
Total: 21 Annual: 5
Site supervision and support services
There are a wide range of ancillary support services also required for delivery of a larger project of this nature including but not limited to:
Site supervision for managing and coordinating construction crews and activities across the site.
Site security: solar panels, cables and equipment are high value items. The PV array sites cover large areas and are vulnerable to unauthorised access, theft and vandalism. Site security personnel will be required both during construction and operation.
Total: 105 Annual: 26
11 Moree Plains Shire Growth Management Strategy, Prepared for Moree Plains Shire Council and the Department of Planning by EDGE, September 2009
AECOMEconomic Benefits from Solar Flagship Project
H:\Proposals\2010\Planning and Advisory\NSW-B10-1865 BP Solar\Project\4. Reporting\Final\2010 09 13 Final Report.docx Revision B - 13 September 2010 20
Area Description and Source Employment
Catering and cleaning services are likely to be required for staff canteen and restroom facilities.
Mechanics may be required for servicing and maintaining construction vehicles and other plant machinery.
Capacity and capability of Moree to supply required labour
It is likely that the majority of site supervision and support services will be sourced locally. However, it is expected some expertise and experience from previous projects of similar scale will be brought in potentially from overseas. It has been assumed 25% (6.5 of the 26 annual jobs) will be sourced from outside Moree.
Project Development and other specialists
There are a wide range of specialist services required predominantly during the project development phase prior to construction including solar scientists, civil, electrical and mechanical engineers, environmental scientists, geologists, hydrologists, economists, consultants, construction contractors, quantity surveyors, planners, transport specialists...
Project management and other specialist project delivery services such as inspection, quality control, contract management, commissioning etc are required throughout the project.
Capacity and capability of Moree to supply required labour
A large proportion of the project development team will be based in Sydney. At various stages of the project there will be onsite work and on average it is expected that 15-20% of time will be spent in Moree.
Total: 84 Annual: 21
Summary Of the total jobs, it is anticipated that the majority can be sourced locally. It is expected that there will be a requirement for some experienced site supervision staff to be brought into the region, as well as electricians until the apprenticeship program is developed enough to supply labour into the project.
Total over the project life: 1050
Annual total employment: 262
Total expected to be sourced from Moree: 600-900 depending on whether electricians and metal fabrication staff sourced from Moree.
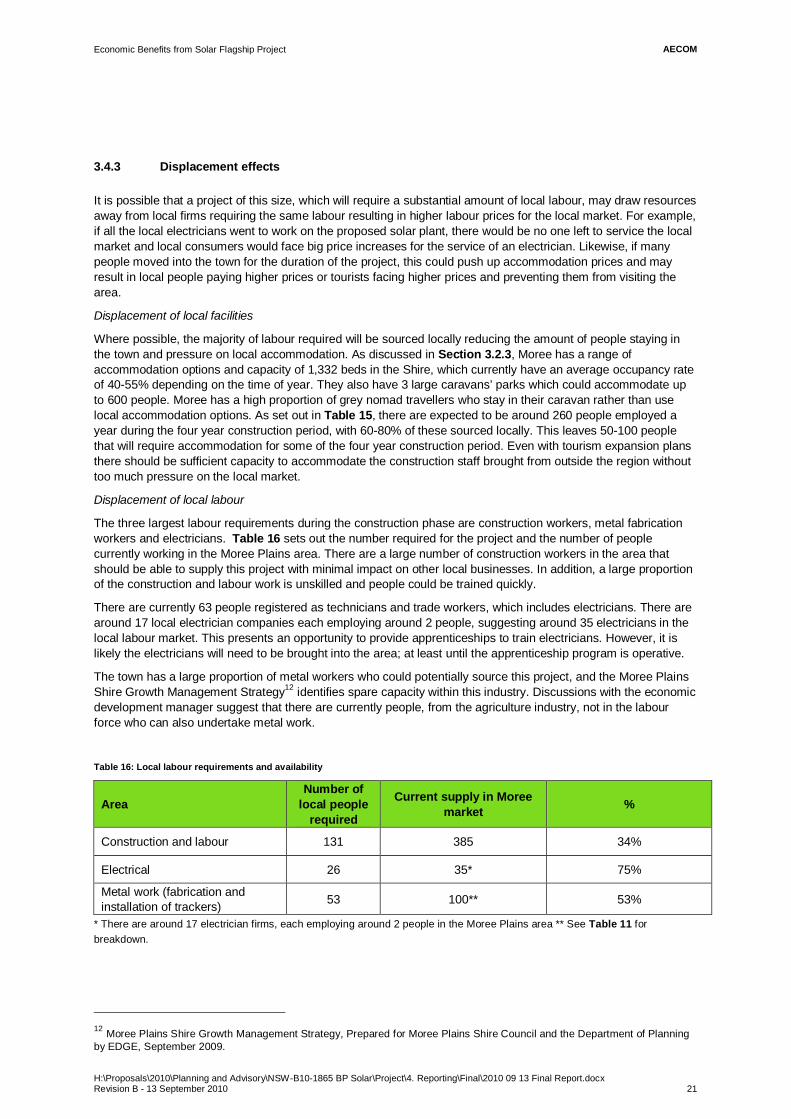
AECOMEconomic Benefits from Solar Flagship Project
H:\Proposals\2010\Planning and Advisory\NSW-B10-1865 BP Solar\Project\4. Reporting\Final\2010 09 13 Final Report.docx Revision B - 13 September 2010 21
3.4.3 Displacement effects
It is possible that a project of this size, which will require a substantial amount of local labour, may draw resources away from local firms requiring the same labour resulting in higher labour prices for the local market. For example, if all the local electricians went to work on the proposed solar plant, there would be no one left to service the local market and local consumers would face big price increases for the service of an electrician. Likewise, if many people moved into the town for the duration of the project, this could push up accommodation prices and may result in local people paying higher prices or tourists facing higher prices and preventing them from visiting the area.
Displacement of local facilities
Where possible, the majority of labour required will be sourced locally reducing the amount of people staying in the town and pressure on local accommodation. As discussed in Section 3.2.3, Moree has a range of accommodation options and capacity of 1,332 beds in the Shire, which currently have an average occupancy rate of 40-55% depending on the time of year. They also have 3 large caravans’ parks which could accommodate up to 600 people. Moree has a high proportion of grey nomad travellers who stay in their caravan rather than use local accommodation options. As set out in Table 15, there are expected to be around 260 people employed a year during the four year construction period, with 60-80% of these sourced locally. This leaves 50-100 people that will require accommodation for some of the four year construction period. Even with tourism expansion plans there should be sufficient capacity to accommodate the construction staff brought from outside the region without too much pressure on the local market.
Displacement of local labour
The three largest labour requirements during the construction phase are construction workers, metal fabrication workers and electricians. Table 16 sets out the number required for the project and the number of people currently working in the Moree Plains area. There are a large number of construction workers in the area that should be able to supply this project with minimal impact on other local businesses. In addition, a large proportion of the construction and labour work is unskilled and people could be trained quickly.
There are currently 63 people registered as technicians and trade workers, which includes electricians. There are around 17 local electrician companies each employing around 2 people, suggesting around 35 electricians in the local labour market. This presents an opportunity to provide apprenticeships to train electricians. However, it is likely the electricians will need to be brought into the area; at least until the apprenticeship program is operative.
The town has a large proportion of metal workers who could potentially source this project, and the Moree Plains Shire Growth Management Strategy12 identifies spare capacity within this industry. Discussions with the economic development manager suggest that there are currently people, from the agriculture industry, not in the labour force who can also undertake metal work.
Table 16: Local labour requirements and availability
Area Number of
local people required
Current supply in Moree market %
Construction and labour 131 385 34%
Electrical 26 35* 75%
Metal work (fabrication and installation of trackers) 53 100** 53%
* There are around 17 electrician firms, each employing around 2 people in the Moree Plains area ** See Table 11 for breakdown.
12 Moree Plains Shire Growth Management Strategy, Prepared for Moree Plains Shire Council and the Department of Planning by EDGE, September 2009.
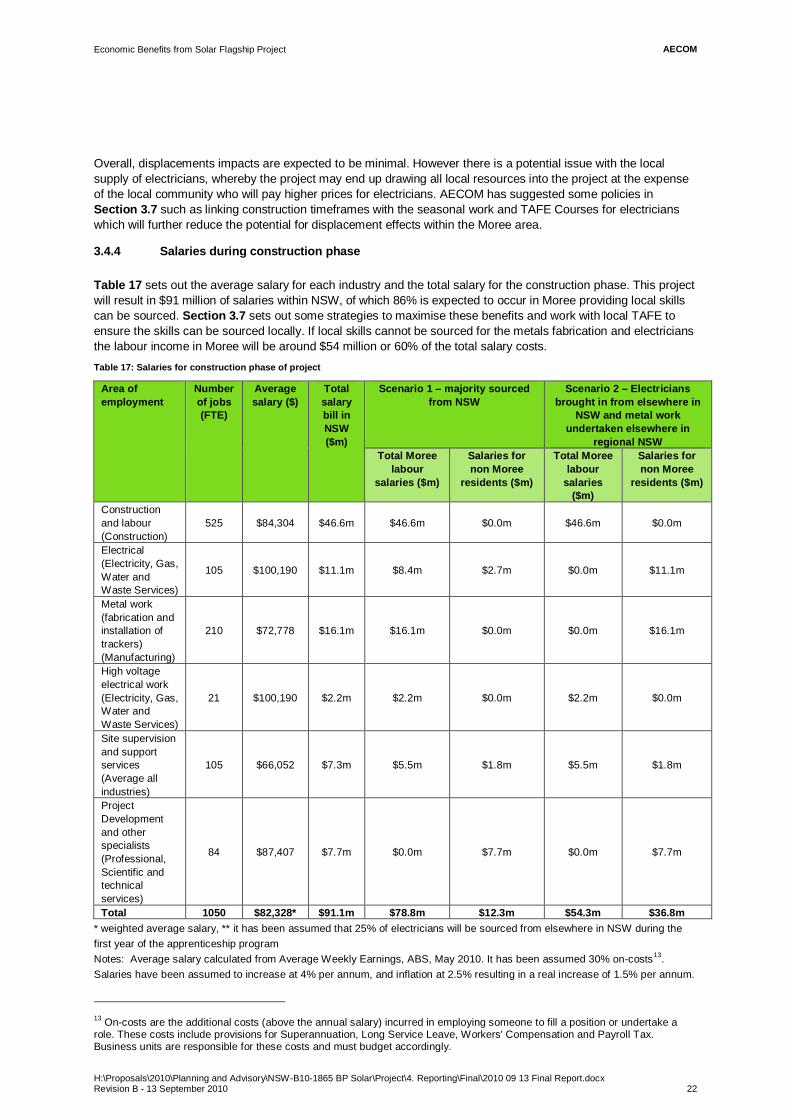
AECOMEconomic Benefits from Solar Flagship Project
H:\Proposals\2010\Planning and Advisory\NSW-B10-1865 BP Solar\Project\4. Reporting\Final\2010 09 13 Final Report.docx Revision B - 13 September 2010 22
Overall, displacements impacts are expected to be minimal. However there is a potential issue with the local supply of electricians, whereby the project may end up drawing all local resources into the project at the expense of the local community who will pay higher prices for electricians. AECOM has suggested some policies in Section 3.7 such as linking construction timeframes with the seasonal work and TAFE Courses for electricians which will further reduce the potential for displacement effects within the Moree area.
3.4.4 Salaries during construction phase
Table 17 sets out the average salary for each industry and the total salary for the construction phase. This project will result in $91 million of salaries within NSW, of which 86% is expected to occur in Moree providing local skills can be sourced. Section 3.7 sets out some strategies to maximise these benefits and work with local TAFE to ensure the skills can be sourced locally. If local skills cannot be sourced for the metals fabrication and electricians the labour income in Moree will be around $54 million or 60% of the total salary costs. Table 17: Salaries for construction phase of project
Area of employment
Number of jobs (FTE)
Average salary ($)
Total salary bill in NSW ($m)
Scenario 1 – majority sourced from NSW
Scenario 2 – Electricians brought in from elsewhere in
NSW and metal work undertaken elsewhere in
regional NSW Total Moree
labour salaries ($m)
Salaries for non Moree
residents ($m)
Total Moree labour
salaries ($m)
Salaries for non Moree
residents ($m)
Construction and labour (Construction)
525 $84,304 $46.6m $46.6m $0.0m $46.6m $0.0m
Electrical (Electricity, Gas, Water and Waste Services)
105 $100,190 $11.1m $8.4m $2.7m $0.0m $11.1m
Metal work (fabrication and installation of trackers) (Manufacturing)
210
$72,778
$16.1m $16.1m $0.0m $0.0m $16.1m
High voltage electrical work (Electricity, Gas, Water and Waste Services)
21 $100,190 $2.2m $2.2m $0.0m $2.2m $0.0m
Site supervision and support services (Average all industries)
105 $66,052 $7.3m $5.5m $1.8m $5.5m $1.8m
Project Development and other specialists (Professional, Scientific and technical services)
84 $87,407 $7.7m $0.0m $7.7m $0.0m $7.7m
Total 1050 $82,328* $91.1m $78.8m $12.3m $54.3m $36.8m * weighted average salary, ** it has been assumed that 25% of electricians will be sourced from elsewhere in NSW during the first year of the apprenticeship program Notes: Average salary calculated from Average Weekly Earnings, ABS, May 2010. It has been assumed 30% on-costs13. Salaries have been assumed to increase at 4% per annum, and inflation at 2.5% resulting in a real increase of 1.5% per annum.
13 On-costs are the additional costs (above the annual salary) incurred in employing someone to fill a position or undertake a role. These costs include provisions for Superannuation, Long Service Leave, Workers' Compensation and Payroll Tax. Business units are responsible for these costs and must budget accordingly.
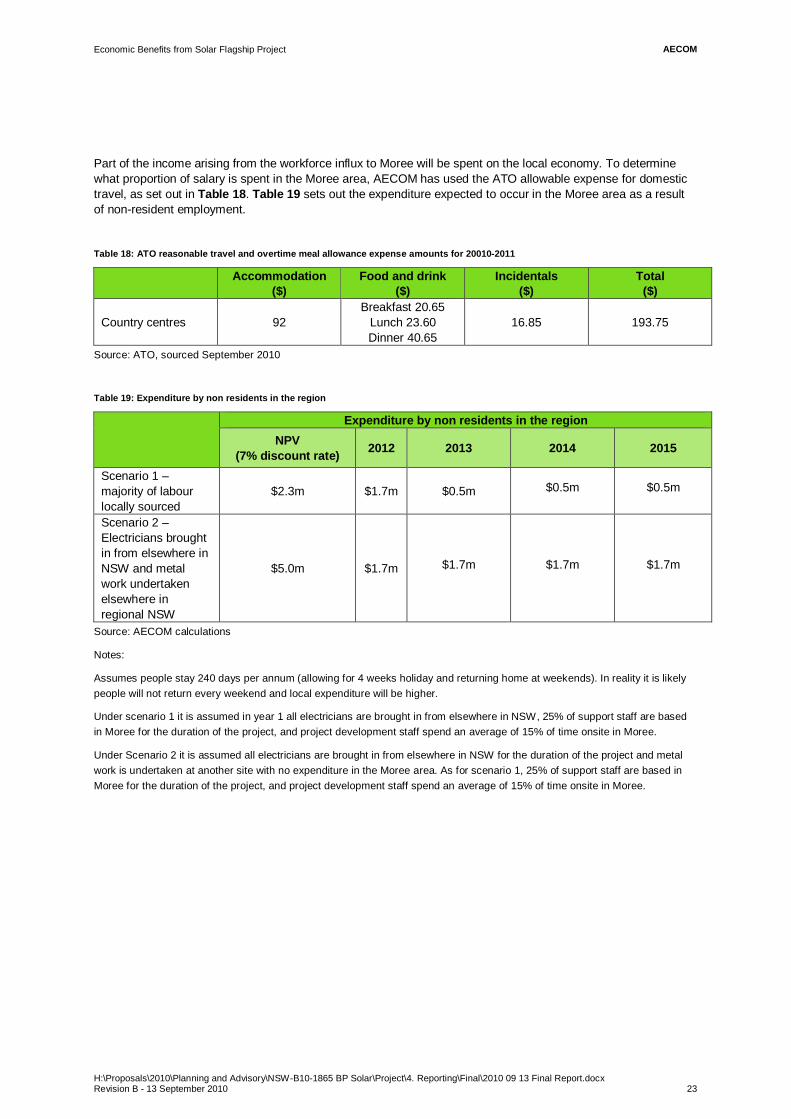
AECOMEconomic Benefits from Solar Flagship Project
H:\Proposals\2010\Planning and Advisory\NSW-B10-1865 BP Solar\Project\4. Reporting\Final\2010 09 13 Final Report.docx Revision B - 13 September 2010 23
Part of the income arising from the workforce influx to Moree will be spent on the local economy. To determine what proportion of salary is spent in the Moree area, AECOM has used the ATO allowable expense for domestic travel, as set out in Table 18. Table 19 sets out the expenditure expected to occur in the Moree area as a result of non-resident employment.
Table 18: ATO reasonable travel and overtime meal allowance expense amounts for 20010-2011
Accommodation ($)
Food and drink ($)
Incidentals ($)
Total ($)
Country centres 92 Breakfast 20.65
Lunch 23.60 Dinner 40.65
16.85 193.75
Source: ATO, sourced September 2010
Table 19: Expenditure by non residents in the region
Expenditure by non residents in the region
NPV (7% discount rate) 2012 2013 2014 2015
Scenario 1 – majority of labour locally sourced
$2.3m
$1.7m $0.5m $0.5m $0.5m
Scenario 2 – Electricians brought in from elsewhere in NSW and metal work undertaken elsewhere in regional NSW
$5.0m
$1.7m $1.7m $1.7m $1.7m
Source: AECOM calculations
Notes:
Assumes people stay 240 days per annum (allowing for 4 weeks holiday and returning home at weekends). In reality it is likely people will not return every weekend and local expenditure will be higher.
Under scenario 1 it is assumed in year 1 all electricians are brought in from elsewhere in NSW, 25% of support staff are based in Moree for the duration of the project, and project development staff spend an average of 15% of time onsite in Moree.
Under Scenario 2 it is assumed all electricians are brought in from elsewhere in NSW for the duration of the project and metal work is undertaken at another site with no expenditure in the Moree area. As for scenario 1, 25% of support staff are based in Moree for the duration of the project, and project development staff spend an average of 15% of time onsite in Moree.
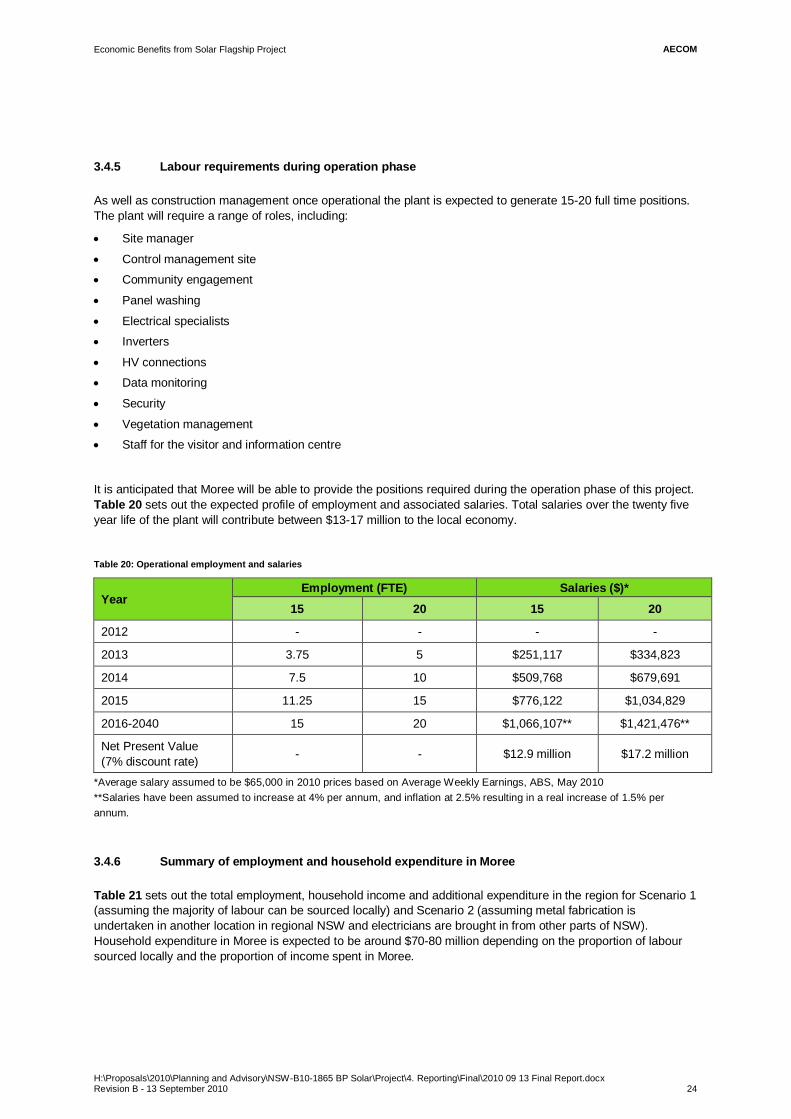
AECOMEconomic Benefits from Solar Flagship Project
H:\Proposals\2010\Planning and Advisory\NSW-B10-1865 BP Solar\Project\4. Reporting\Final\2010 09 13 Final Report.docx Revision B - 13 September 2010 24
3.4.5 Labour requirements during operation phase
As well as construction management once operational the plant is expected to generate 15-20 full time positions. The plant will require a range of roles, including:
Site manager
Control management site
Community engagement
Panel washing
Electrical specialists
Inverters
HV connections
Data monitoring
Security
Vegetation management
Staff for the visitor and information centre
It is anticipated that Moree will be able to provide the positions required during the operation phase of this project. Table 20 sets out the expected profile of employment and associated salaries. Total salaries over the twenty five year life of the plant will contribute between $13-17 million to the local economy.
Table 20: Operational employment and salaries
Year Employment (FTE) Salaries ($)*
15 20 15 20
2012 - - - -
2013 3.75 5 $251,117 $334,823
2014 7.5 10 $509,768 $679,691
2015 11.25 15 $776,122 $1,034,829
2016-2040 15 20 $1,066,107** $1,421,476**
Net Present Value (7% discount rate) - - $12.9 million $17.2 million
*Average salary assumed to be $65,000 in 2010 prices based on Average Weekly Earnings, ABS, May 2010 **Salaries have been assumed to increase at 4% per annum, and inflation at 2.5% resulting in a real increase of 1.5% per annum.
3.4.6 Summary of employment and household expenditure in Moree
Table 21 sets out the total employment, household income and additional expenditure in the region for Scenario 1 (assuming the majority of labour can be sourced locally) and Scenario 2 (assuming metal fabrication is undertaken in another location in regional NSW and electricians are brought in from other parts of NSW). Household expenditure in Moree is expected to be around $70-80 million depending on the proportion of labour sourced locally and the proportion of income spent in Moree.

AECOMEconomic Benefits from Solar Flagship Project
H:\Proposals\2010\Planning and Advisory\NSW-B10-1865 BP Solar\Project\4. Reporting\Final\2010 09 13 Final Report.docx Revision B - 13 September 2010 25
Table 21: Employment and household expenditure
Year
Scenario 1- Employment Scenario 1- Household income
Scenario 1- Additional
expenditure in region during
construction phase
Scenario 2- Employment Scenario 2- Household income
Scenario 2- Additional
expenditure in region during
construction phase
Construction (annual)
Operation (FTE) - 15
Construction ($m)
Operation ($m) Construction Operation
(FTE) - 20 Construction Operation
2012 209 - $17.2m - $1.7m 156 - $13.3m - $1.7m
2013 235 3.75 $20.2m $0.3m $0.5m 156 5 $13.5m $0.3m $1.7m
2014 235 7.5 $20.5m $0.5m $0.5m 156 10 $13.7m $0.7m $1.7m
2015 235 11.25 $20.8m $0.8m $0.5m 156 15 $13.9m $1.0m $1.7m
2016-2040 - 15 - $1.1m** - - 20 - $1.4m** -
Total (undiscounted) 914 15 per
annum $78.8m $33.6m $3.0m 625 20 per annum $54.3m $44.8m $6.8m
Net Present Value (7% discount rate)
- -
$66.4m
$12.9m $2.3m - - $46m $17.2m $5.0m
Total NPV (7% discount rate)
$81.6m $68.2m
**Salaries have been assumed to increase at 4% per annum, and inflation at 2.5% resulting in a real increase of 1.5% per annum

AECOMEconomic Benefits from Solar Flagship Project
H:\Proposals\2010\Planning and Advisory\NSW-B10-1865 BP Solar\Project\4. Reporting\Final\2010 09 13 Final Report.docx Revision B - 13 September 2010 26
3.5 Total Direct Benefits Table 22 summarises the direct project benefits for both the Moree area and NSW as a whole under two scenarios that represent different amounts of labour and supply of goods and materials being sourced locally.
This project is expected to contribute around $210 million to the NSW economy, of which $100-125 million will have a direct impact on the Moree area. The extent of the economic benefits in Moree depends on the ability to supply labour and goods and materials to the project. Section 3.7 sets out some options to ensure the economic benefits are towards the higher end of this range.
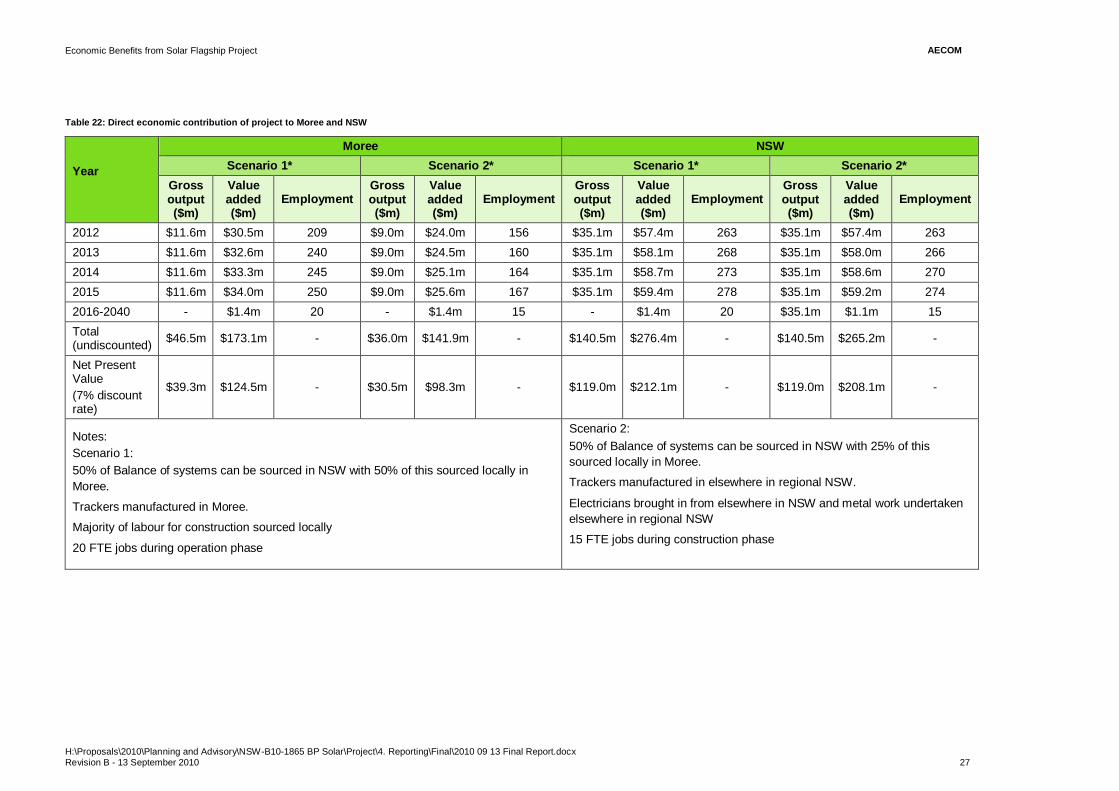
AECOMEconomic Benefits from Solar Flagship Project
H:\Proposals\2010\Planning and Advisory\NSW-B10-1865 BP Solar\Project\4. Reporting\Final\2010 09 13 Final Report.docx Revision B - 13 September 2010 27
Table 22: Direct economic contribution of project to Moree and NSW
Year
Moree NSW Scenario 1* Scenario 2* Scenario 1* Scenario 2*
Gross output ($m)
Value added ($m)
Employment Gross output ($m)
Value added ($m)
Employment Gross output ($m)
Value added ($m)
Employment Gross output ($m)
Value added ($m)
Employment
2012 $11.6m $30.5m 209 $9.0m $24.0m 156 $35.1m $57.4m 263 $35.1m $57.4m 263 2013 $11.6m $32.6m 240 $9.0m $24.5m 160 $35.1m $58.1m 268 $35.1m $58.0m 266 2014 $11.6m $33.3m 245 $9.0m $25.1m 164 $35.1m $58.7m 273 $35.1m $58.6m 270 2015 $11.6m $34.0m 250 $9.0m $25.6m 167 $35.1m $59.4m 278 $35.1m $59.2m 274 2016-2040 - $1.4m 20 - $1.4m 15 - $1.4m 20 $35.1m $1.1m 15 Total (undiscounted) $46.5m $173.1m - $36.0m $141.9m - $140.5m $276.4m - $140.5m $265.2m -
Net Present Value (7% discount rate)
$39.3m $124.5m - $30.5m $98.3m - $119.0m $212.1m - $119.0m $208.1m -
Notes: Scenario 1:
50% of Balance of systems can be sourced in NSW with 50% of this sourced locally in Moree.
Trackers manufactured in Moree.
Majority of labour for construction sourced locally
20 FTE jobs during operation phase
Scenario 2: 50% of Balance of systems can be sourced in NSW with 25% of this
sourced locally in Moree.
Trackers manufactured in elsewhere in regional NSW.
Electricians brought in from elsewhere in NSW and metal work undertaken elsewhere in regional NSW
15 FTE jobs during construction phase
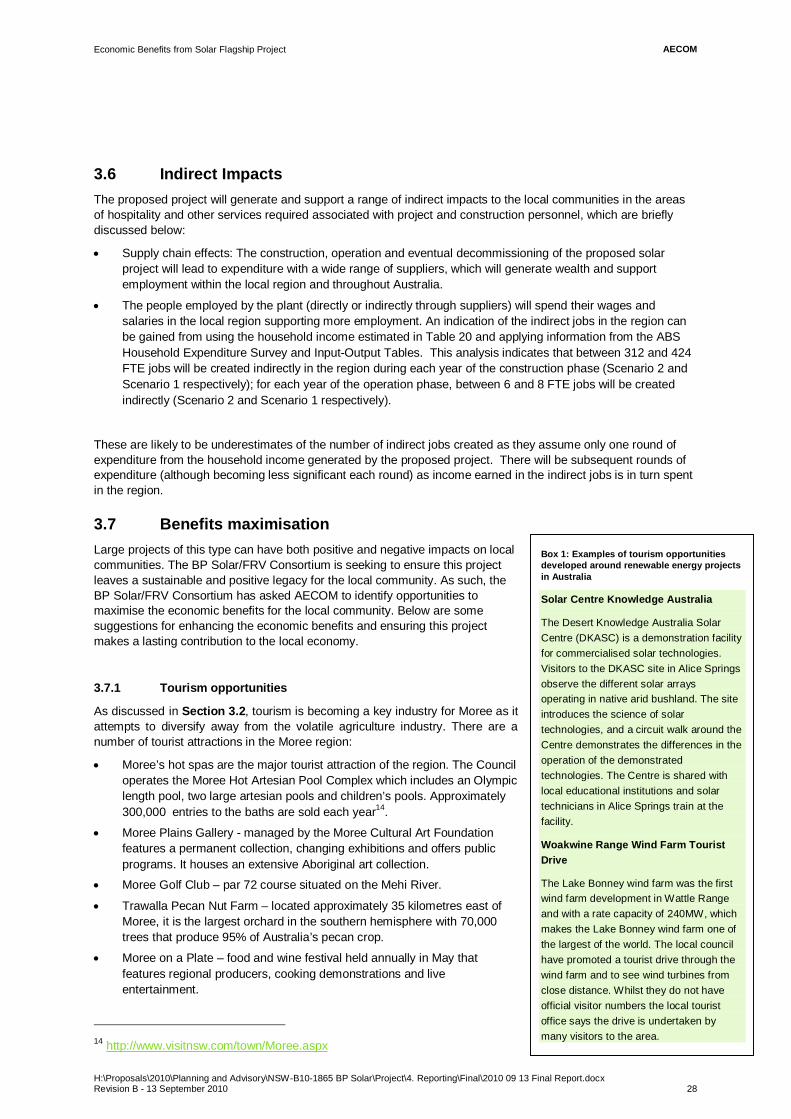
AECOMEconomic Benefits from Solar Flagship Project
H:\Proposals\2010\Planning and Advisory\NSW-B10-1865 BP Solar\Project\4. Reporting\Final\2010 09 13 Final Report.docx Revision B - 13 September 2010 28
3.6 Indirect Impacts The proposed project will generate and support a range of indirect impacts to the local communities in the areas of hospitality and other services required associated with project and construction personnel, which are briefly discussed below:
Supply chain effects: The construction, operation and eventual decommissioning of the proposed solar project will lead to expenditure with a wide range of suppliers, which will generate wealth and support employment within the local region and throughout Australia.
The people employed by the plant (directly or indirectly through suppliers) will spend their wages and salaries in the local region supporting more employment. An indication of the indirect jobs in the region can be gained from using the household income estimated in Table 20 and applying information from the ABS Household Expenditure Survey and Input-Output Tables. This analysis indicates that between 312 and 424 FTE jobs will be created indirectly in the region during each year of the construction phase (Scenario 2 and Scenario 1 respectively); for each year of the operation phase, between 6 and 8 FTE jobs will be created indirectly (Scenario 2 and Scenario 1 respectively).
These are likely to be underestimates of the number of indirect jobs created as they assume only one round of expenditure from the household income generated by the proposed project. There will be subsequent rounds of expenditure (although becoming less significant each round) as income earned in the indirect jobs is in turn spent in the region.
3.7 Benefits maximisation Large projects of this type can have both positive and negative impacts on local communities. The BP Solar/FRV Consortium is seeking to ensure this project leaves a sustainable and positive legacy for the local community. As such, the BP Solar/FRV Consortium has asked AECOM to identify opportunities to maximise the economic benefits for the local community. Below are some suggestions for enhancing the economic benefits and ensuring this project makes a lasting contribution to the local economy.
3.7.1 Tourism opportunities
As discussed in Section 3.2, tourism is becoming a key industry for Moree as it attempts to diversify away from the volatile agriculture industry. There are a number of tourist attractions in the Moree region:
Moree’s hot spas are the major tourist attraction of the region. The Council operates the Moree Hot Artesian Pool Complex which includes an Olympic length pool, two large artesian pools and children’s pools. Approximately 300,000 entries to the baths are sold each year14.
Moree Plains Gallery - managed by the Moree Cultural Art Foundation features a permanent collection, changing exhibitions and offers public programs. It houses an extensive Aboriginal art collection.
Moree Golf Club – par 72 course situated on the Mehi River.
Trawalla Pecan Nut Farm – located approximately 35 kilometres east of Moree, it is the largest orchard in the southern hemisphere with 70,000 trees that produce 95% of Australia’s pecan crop.
Moree on a Plate – food and wine festival held annually in May that features regional producers, cooking demonstrations and live entertainment.
14 http://www.visitnsw.com/town/Moree.aspx
Box 1: Examples of tourism opportunities developed around renewable energy projects in Australia
Solar Centre Knowledge Australia
The Desert Knowledge Australia Solar Centre (DKASC) is a demonstration facility for commercialised solar technologies. Visitors to the DKASC site in Alice Springs observe the different solar arrays operating in native arid bushland. The site introduces the science of solar technologies, and a circuit walk around the Centre demonstrates the differences in the operation of the demonstrated technologies. The Centre is shared with local educational institutions and solar technicians in Alice Springs train at the facility.
Woakwine Range Wind Farm Tourist Drive
The Lake Bonney wind farm was the first wind farm development in Wattle Range and with a rate capacity of 240MW, which makes the Lake Bonney wind farm one of the largest of the world. The local council have promoted a tourist drive through the wind farm and to see wind turbines from close distance. Whilst they do not have official visitor numbers the local tourist office says the drive is undertaken by many visitors to the area.
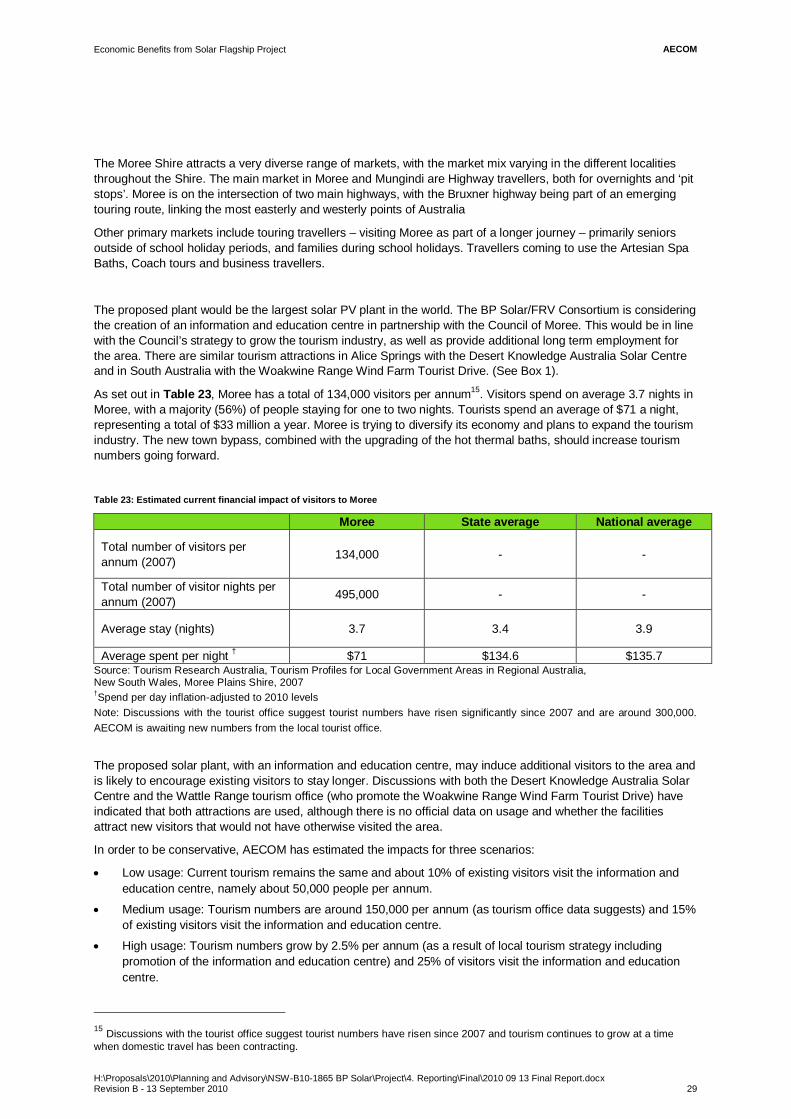
AECOMEconomic Benefits from Solar Flagship Project
H:\Proposals\2010\Planning and Advisory\NSW-B10-1865 BP Solar\Project\4. Reporting\Final\2010 09 13 Final Report.docx Revision B - 13 September 2010 29
The Moree Shire attracts a very diverse range of markets, with the market mix varying in the different localities throughout the Shire. The main market in Moree and Mungindi are Highway travellers, both for overnights and ‘pit stops’. Moree is on the intersection of two main highways, with the Bruxner highway being part of an emerging touring route, linking the most easterly and westerly points of Australia
Other primary markets include touring travellers – visiting Moree as part of a longer journey – primarily seniors outside of school holiday periods, and families during school holidays. Travellers coming to use the Artesian Spa Baths, Coach tours and business travellers.
The proposed plant would be the largest solar PV plant in the world. The BP Solar/FRV Consortium is considering the creation of an information and education centre in partnership with the Council of Moree. This would be in line with the Council’s strategy to grow the tourism industry, as well as provide additional long term employment for the area. There are similar tourism attractions in Alice Springs with the Desert Knowledge Australia Solar Centre and in South Australia with the Woakwine Range Wind Farm Tourist Drive. (See Box 1).
As set out in Table 23, Moree has a total of 134,000 visitors per annum15. Visitors spend on average 3.7 nights in Moree, with a majority (56%) of people staying for one to two nights. Tourists spend an average of $71 a night, representing a total of $33 million a year. Moree is trying to diversify its economy and plans to expand the tourism industry. The new town bypass, combined with the upgrading of the hot thermal baths, should increase tourism numbers going forward.
Table 23: Estimated current financial impact of visitors to Moree
Moree State average National average
Total number of visitors per annum (2007) 134,000 - -
Total number of visitor nights per annum (2007) 495,000 - -
Average stay (nights) 3.7 3.4 3.9
Average spent per night † $71 $134.6 $135.7 Source: Tourism Research Australia, Tourism Profiles for Local Government Areas in Regional Australia, New South Wales, Moree Plains Shire, 2007 †Spend per day inflation-adjusted to 2010 levels Note: Discussions with the tourist office suggest tourist numbers have risen significantly since 2007 and are around 300,000. AECOM is awaiting new numbers from the local tourist office.
The proposed solar plant, with an information and education centre, may induce additional visitors to the area and is likely to encourage existing visitors to stay longer. Discussions with both the Desert Knowledge Australia Solar Centre and the Wattle Range tourism office (who promote the Woakwine Range Wind Farm Tourist Drive) have indicated that both attractions are used, although there is no official data on usage and whether the facilities attract new visitors that would not have otherwise visited the area.
In order to be conservative, AECOM has estimated the impacts for three scenarios:
Low usage: Current tourism remains the same and about 10% of existing visitors visit the information and education centre, namely about 50,000 people per annum.
Medium usage: Tourism numbers are around 150,000 per annum (as tourism office data suggests) and 15% of existing visitors visit the information and education centre.
High usage: Tourism numbers grow by 2.5% per annum (as a result of local tourism strategy including promotion of the information and education centre) and 25% of visitors visit the information and education centre.
15 Discussions with the tourist office suggest tourist numbers have risen since 2007 and tourism continues to grow at a time when domestic travel has been contracting.
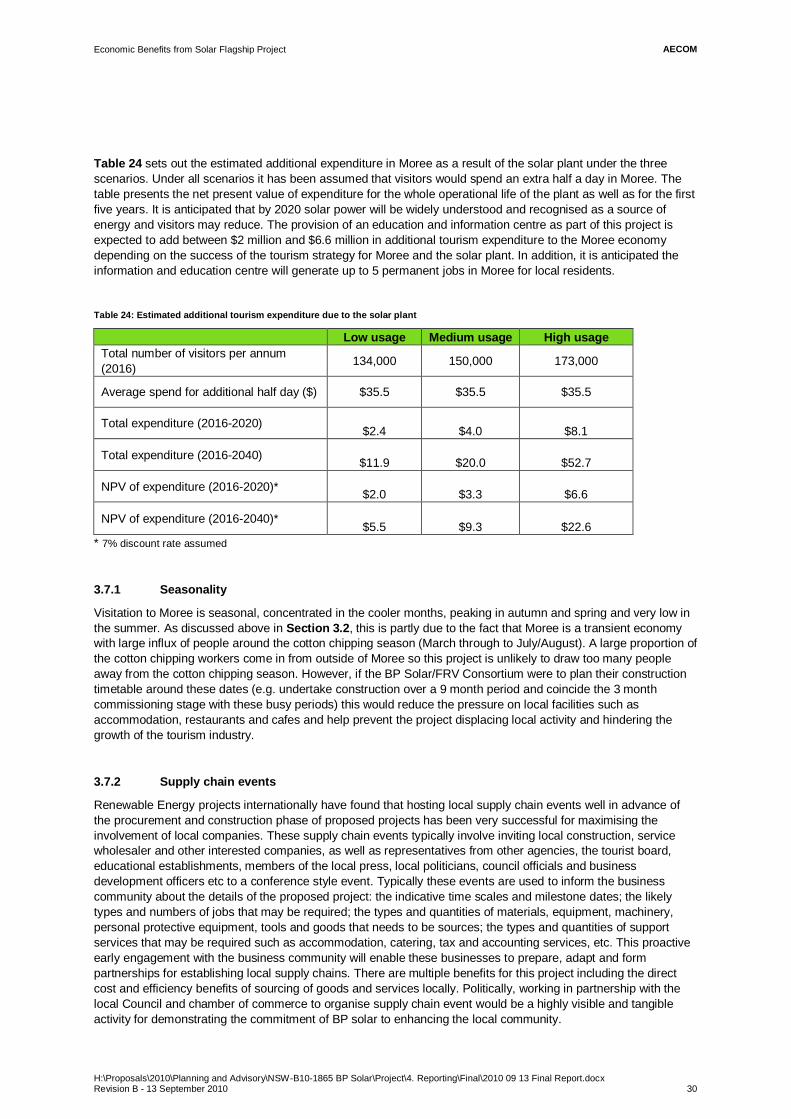
AECOMEconomic Benefits from Solar Flagship Project
H:\Proposals\2010\Planning and Advisory\NSW-B10-1865 BP Solar\Project\4. Reporting\Final\2010 09 13 Final Report.docx Revision B - 13 September 2010 30
Table 24 sets out the estimated additional expenditure in Moree as a result of the solar plant under the three scenarios. Under all scenarios it has been assumed that visitors would spend an extra half a day in Moree. The table presents the net present value of expenditure for the whole operational life of the plant as well as for the first five years. It is anticipated that by 2020 solar power will be widely understood and recognised as a source of energy and visitors may reduce. The provision of an education and information centre as part of this project is expected to add between $2 million and $6.6 million in additional tourism expenditure to the Moree economy depending on the success of the tourism strategy for Moree and the solar plant. In addition, it is anticipated the information and education centre will generate up to 5 permanent jobs in Moree for local residents.
Table 24: Estimated additional tourism expenditure due to the solar plant
Low usage Medium usage High usage Total number of visitors per annum (2016) 134,000 150,000 173,000
Average spend for additional half day ($) $35.5 $35.5 $35.5
Total expenditure (2016-2020) $2.4 $4.0 $8.1
Total expenditure (2016-2040) $11.9 $20.0 $52.7
NPV of expenditure (2016-2020)* $2.0 $3.3 $6.6
NPV of expenditure (2016-2040)* $5.5 $9.3 $22.6
* 7% discount rate assumed
3.7.1 Seasonality
Visitation to Moree is seasonal, concentrated in the cooler months, peaking in autumn and spring and very low in the summer. As discussed above in Section 3.2, this is partly due to the fact that Moree is a transient economy with large influx of people around the cotton chipping season (March through to July/August). A large proportion of the cotton chipping workers come in from outside of Moree so this project is unlikely to draw too many people away from the cotton chipping season. However, if the BP Solar/FRV Consortium were to plan their construction timetable around these dates (e.g. undertake construction over a 9 month period and coincide the 3 month commissioning stage with these busy periods) this would reduce the pressure on local facilities such as accommodation, restaurants and cafes and help prevent the project displacing local activity and hindering the growth of the tourism industry.
3.7.2 Supply chain events
Renewable Energy projects internationally have found that hosting local supply chain events well in advance of the procurement and construction phase of proposed projects has been very successful for maximising the involvement of local companies. These supply chain events typically involve inviting local construction, service wholesaler and other interested companies, as well as representatives from other agencies, the tourist board, educational establishments, members of the local press, local politicians, council officials and business development officers etc to a conference style event. Typically these events are used to inform the business community about the details of the proposed project: the indicative time scales and milestone dates; the likely types and numbers of jobs that may be required; the types and quantities of materials, equipment, machinery, personal protective equipment, tools and goods that needs to be sources; the types and quantities of support services that may be required such as accommodation, catering, tax and accounting services, etc. This proactive early engagement with the business community will enable these businesses to prepare, adapt and form partnerships for establishing local supply chains. There are multiple benefits for this project including the direct cost and efficiency benefits of sourcing of goods and services locally. Politically, working in partnership with the local Council and chamber of commerce to organise supply chain event would be a highly visible and tangible activity for demonstrating the commitment of BP solar to enhancing the local community.
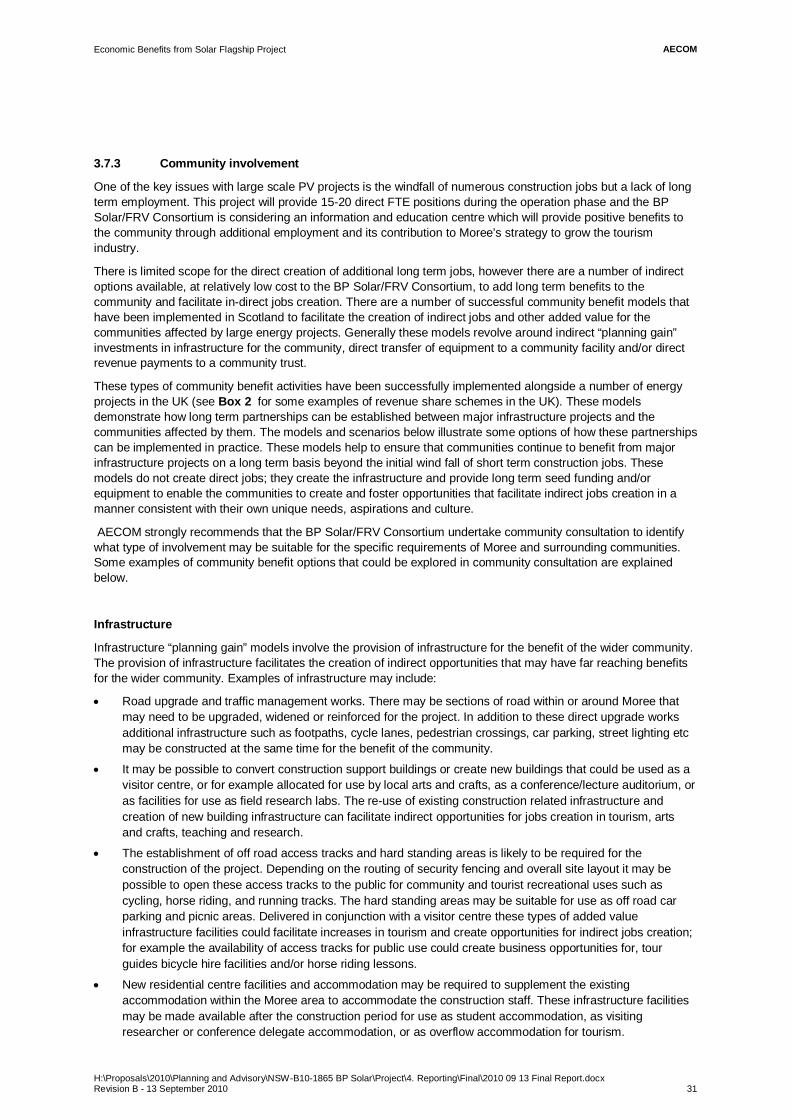
AECOMEconomic Benefits from Solar Flagship Project
H:\Proposals\2010\Planning and Advisory\NSW-B10-1865 BP Solar\Project\4. Reporting\Final\2010 09 13 Final Report.docx Revision B - 13 September 2010 31
3.7.3 Community involvement
One of the key issues with large scale PV projects is the windfall of numerous construction jobs but a lack of long term employment. This project will provide 15-20 direct FTE positions during the operation phase and the BP Solar/FRV Consortium is considering an information and education centre which will provide positive benefits to the community through additional employment and its contribution to Moree’s strategy to grow the tourism industry.
There is limited scope for the direct creation of additional long term jobs, however there are a number of indirect options available, at relatively low cost to the BP Solar/FRV Consortium, to add long term benefits to the community and facilitate in-direct jobs creation. There are a number of successful community benefit models that have been implemented in Scotland to facilitate the creation of indirect jobs and other added value for the communities affected by large energy projects. Generally these models revolve around indirect “planning gain” investments in infrastructure for the community, direct transfer of equipment to a community facility and/or direct revenue payments to a community trust.
These types of community benefit activities have been successfully implemented alongside a number of energy projects in the UK (see Box 2 for some examples of revenue share schemes in the UK). These models demonstrate how long term partnerships can be established between major infrastructure projects and the communities affected by them. The models and scenarios below illustrate some options of how these partnerships can be implemented in practice. These models help to ensure that communities continue to benefit from major infrastructure projects on a long term basis beyond the initial wind fall of short term construction jobs. These models do not create direct jobs; they create the infrastructure and provide long term seed funding and/or equipment to enable the communities to create and foster opportunities that facilitate indirect jobs creation in a manner consistent with their own unique needs, aspirations and culture.
AECOM strongly recommends that the BP Solar/FRV Consortium undertake community consultation to identify what type of involvement may be suitable for the specific requirements of Moree and surrounding communities. Some examples of community benefit options that could be explored in community consultation are explained below.
Infrastructure
Infrastructure “planning gain” models involve the provision of infrastructure for the benefit of the wider community. The provision of infrastructure facilitates the creation of indirect opportunities that may have far reaching benefits for the wider community. Examples of infrastructure may include:
Road upgrade and traffic management works. There may be sections of road within or around Moree that may need to be upgraded, widened or reinforced for the project. In addition to these direct upgrade works additional infrastructure such as footpaths, cycle lanes, pedestrian crossings, car parking, street lighting etc may be constructed at the same time for the benefit of the community.
It may be possible to convert construction support buildings or create new buildings that could be used as a visitor centre, or for example allocated for use by local arts and crafts, as a conference/lecture auditorium, or as facilities for use as field research labs. The re-use of existing construction related infrastructure and creation of new building infrastructure can facilitate indirect opportunities for jobs creation in tourism, arts and crafts, teaching and research.
The establishment of off road access tracks and hard standing areas is likely to be required for the construction of the project. Depending on the routing of security fencing and overall site layout it may be possible to open these access tracks to the public for community and tourist recreational uses such as cycling, horse riding, and running tracks. The hard standing areas may be suitable for use as off road car parking and picnic areas. Delivered in conjunction with a visitor centre these types of added value infrastructure facilities could facilitate increases in tourism and create opportunities for indirect jobs creation; for example the availability of access tracks for public use could create business opportunities for, tour guides bicycle hire facilities and/or horse riding lessons.
New residential centre facilities and accommodation may be required to supplement the existing accommodation within the Moree area to accommodate the construction staff. These infrastructure facilities may be made available after the construction period for use as student accommodation, as visiting researcher or conference delegate accommodation, or as overflow accommodation for tourism.
AECOMEconomic Benefits from Solar Flagship Project
H:\Proposals\2010\Planning and Advisory\NSW-B10-1865 BP Solar\Project\4. Reporting\Final\2010 09 13 Final Report.docx Revision B - 13 September 2010 32
Community Revenue Payments or Share Options
Long term revenue payments to a Community trust over the lifetime of the project are an effective method of assisting the community to invest in their own projects, facilities and initiatives which in turn create opportunities for indirect jobs creation and other community benefits. Direct revenue payments are typically made to a community trust, administered by the local authority with elected politicians on the board of directors. Revenue payment models ensure that the community has an interest in maximising the scale of the project that is consented, and that the community has a long term interest in the success of the plant. Payments may be based on one or a mixture of models such as:
Community trust receives a share of the revenue e.g. $0.5 / MWh generated. This would generate a variable rate annual income stream (dependent upon the performance of the solar array) of around $202,000 per annum for the local community. The variable rate model means there is some income uncertainty for the community but lowers the risk for the BP Solar/FRV Consortium in the event that the plant under performs (e.g. cloudy years).
Community trust receives annual payments circa $1,000/MWp installed. This would generate a fixed revenue stream up to $180,000 per annum (depending on the size of plant consented). This provides greater revenue certainty for the community but slightly higher risk for the BP Solar/FRV Consortium in the event that the plant does not perform as anticipated (cloudy years).
Individual members of the community buy shares in the project. This model would enable private individuals to invest their money in the project and receive proportionate revenue returns over the lifetime of the project. This model potentially facilitates the greatest level of long term revenue return into the community. There is however a risk of wider community “backlash” with this form of community ownership share model due to the disproportionate levels of investment that may be achieved between those that can afford to invest versus the rest of the community.
Community trust buys shares in the project. The individual ownership community “backlash” risks are avoided if an established community trust, credit union or similar organisation invests on behalf of the community. In practice there is unlikely to be an established community body with sufficient capital funds to make a significant investment. (The local Authority/Council may have access to sufficient capital funds or access to low cost finance; but investing in the project may have negative impacts on future council funding and other constraints preventing this form of investment. Furthermore there may be unacceptable perception of conflicts of interest if the council is both planning authority and shareholder)
Community trust gifted proportion of the solar array. For example 1 in 250 solar panels of the array could be “gifted” to the community (but managed, operated and maintained by the BP Solar/FRV Consortium on behalf of the community). The revenue earned from the generation output of these community solar panels can be paid to a community trust on an annual basis. An indicative estimate of the annual revenue payment to the community under this 1 in 250 solar panel model is approximately $178,000 per annum. This model would facilitate a real sense of community ownership of the project; it is no longer just “BP’s project” but also “the community’s solar array”. This option is a very tangible way of ensuring the community have a long term interest in the success of the plant and galvanises a real sense of community ownership and pride of the project.
Equipment and engagement
The provision equipment and engagement with the community can be another method of facilitating wider community benefits and indirect jobs creation. Examples of equipment and longer term engagement may include:
Provision of solar panels for community halls, council buildings, schools and other community infrastructure.
Establishment of solar panel distributors/installers for retail and domestic sector solar panel installations.
School and TAFE engagement activities e.g. provision of class room teaching kits and guided tours of the solar array.

AECOMEconomic Benefits from Solar Flagship Project
H:\Proposals\2010\Planning and Advisory\NSW-B10-1865 BP Solar\Project\4. Reporting\Final\2010 09 13 Final Report.docx Revision B - 13 September 2010 33
Box 2: Examples of Energy Development Community Benefit Models in Scotland
Shetland Charitable Trust: In 1976 when Sullom Voe oil terminal began operating, money was paid by the Oil Industry to Shetland as a way of compensating the people for the inconvenience of having the terminal based in Shetland. A Charitable Trust administered by the Shetland Islands Council was established to receive and disburse this money in the form of grants for community initiatives and projects principally in the areas of social care and welfare, arts, culture, sport and recreation, the environment, natural history and heritage. www.shetlandcharitabletrust.co.uk
Orkney Islands Strategic Reserve Fund: The first oil flowed into Orkney in 1977. Flotta oil terminal handles oil from the North Sea and Atlantic. Scapa Flow is also used for ship-to-ship transfers of oil from Norwegian oil fields. A levy is placed on every barrel that passes through Flotta, which goes into an 'Oil Fund' administered by the Orkney Islands Council for the benefit of the people of Orkney. The fund has paid for - and continues to pay for - community halls, schools, community initiatives and events throughout the islands. http://www.orkney.gov.uk/media/v3/publications/OIC_Budget_0809.pdf
Argyll and Bute Council Community Wind Farm Trust Funds: Wind Farm and Renewable Energy Developers are encouraged to contribute voluntary community benefit payments to fund local community projects and initiatives in those locations affected by the developments and to fund a local Energy Agency (ALIenergy) which supports community level renewable energy and energy efficiency measures.
http://www.argyll-bute.gov.uk/content/planning/environment/renewablenergy/
The Western Isles Development Trust: Comhairle nan Eilean Siar, the local Authority, established the Western Isles Development Trust (WIDT) to promote the development of a renewable energy industry in the Outer Hebrides and to administer voluntary community benefit fund contributions from renewable energy developments within the Isles. The WIDT supports community initiatives and projects across the island archipelago with grants from the funds. In addition to the islands wide WIDT, community benefit funds are also dispersed to local Development Trusts which are used to support community projects and initiatives within the immediate area directly affected by the wind farm project.
An interesting case study example is Muaitheabhal Windfarm: of the 33 consented turbine sites, four turbines sites will come into community ownership under The Muaitheabhal Community Windfarm Trust (MCWT). This will result in sites for 14.4 MW being owned by the local community. (It is believed that this will result in the establishment of the largest community-owned windfarm in the UK). In addition the community, through both MCWT and WIDT, will benefit from an annual income stream equivalent to 1.5% of the revenues from the main windfarm. http://www.scotland.gov.uk/News/Releases/2010/01/14095411
Viking Energy: Shetland Islands Council have established their own energy company Viking Energy Limited, to act as a joint venture partner alongside Scottish and Southern Energy Generation Limited in the development of a windfarm on land owned by the Council. Resources from this investment will be distributed throughout the Shetland Islands utilising a proposed Shetland Community Development Trust. http://www.vikingenergy.co.uk/the-project.asp
South Lanarkshire Renewable Energy Fund: In South Lanarkshire, the Council has established a Renewable Energy Fund from revenues received from renewable energy developments in their area. It takes two forms, 70% of the revenue received going into a Renewable Energy Fund that contributes to eligible capital projects within a 10km radius of each development, with the remaining 30% going towards a local grants scheme for capital projects within a 5km radius of each participating renewable energy site. http://www.scotland.gov.uk/Publications/2007/10/09113958/32

AECOMEconomic Benefits from Solar Flagship Project
H:\Proposals\2010\Planning and Advisory\NSW-B10-1865 BP Solar\Project\4. Reporting\Final\2010 09 13 Final Report.docx Revision B - 13 September 2010 34
3.7.4 Working with local TAFE
Construction of the proposed development will create employment opportunities for skilled and unskilled labour, and provide the local labour market opportunities for apprenticeships and skills upgrading. In particular, there is potential for vocational training development in partnership with the local TAFE, in the following areas:
Apprenticeships for new electricians
Up-skilling of existing electricians for PV installation and commissioning
Training in metal work fabrication and welding skills
Discussions with the local community suggest that TAFE NSW is supportive in responding to regional demands for trade qualifications the local TAFE has previously worked with local employers to develop and provide vocational training courses.
3.7.5 Working with local education institutions
The plant will offer unique opportunities for research and it is suggested further thought is given to working with local educational institutions to maximise these opportunities. Currently, the UNSW offers a four year degree in Photovoltaics and Solar Energy which has a requirement for 60 days of suitable industrial training. There is an opportunity to develop a “field laboratory” based course to complement the existing courses from UNSW. Moree Plains has a MOU with the University of New England through the “Working Together” network. This could be expanded to make Moree a place of research and training and development.
The New South Wales Government have established six renewable energy precincts across New South Wales in areas with the best-known wind resources in order to streamline the planning and approval process for wind developers. These areas are highlighted in Figure 4, and include: New England Tablelands, Upper Hunter, Central Tablelands, NSW/ACT Border Region, South Coast and Cooma-Monaro. Moree is within the New England Tablelands Renewable Energy Precinct, which is the only precinct likely to be suitable for both wind and solar generation. As such, the New England Tablelands has the potential to become a centre of excellence for renewable energy which will attract both national and international students to any research facilities. This is also likely to provide good opportunities for developing supply chains for the balance of systems equipment and materials.
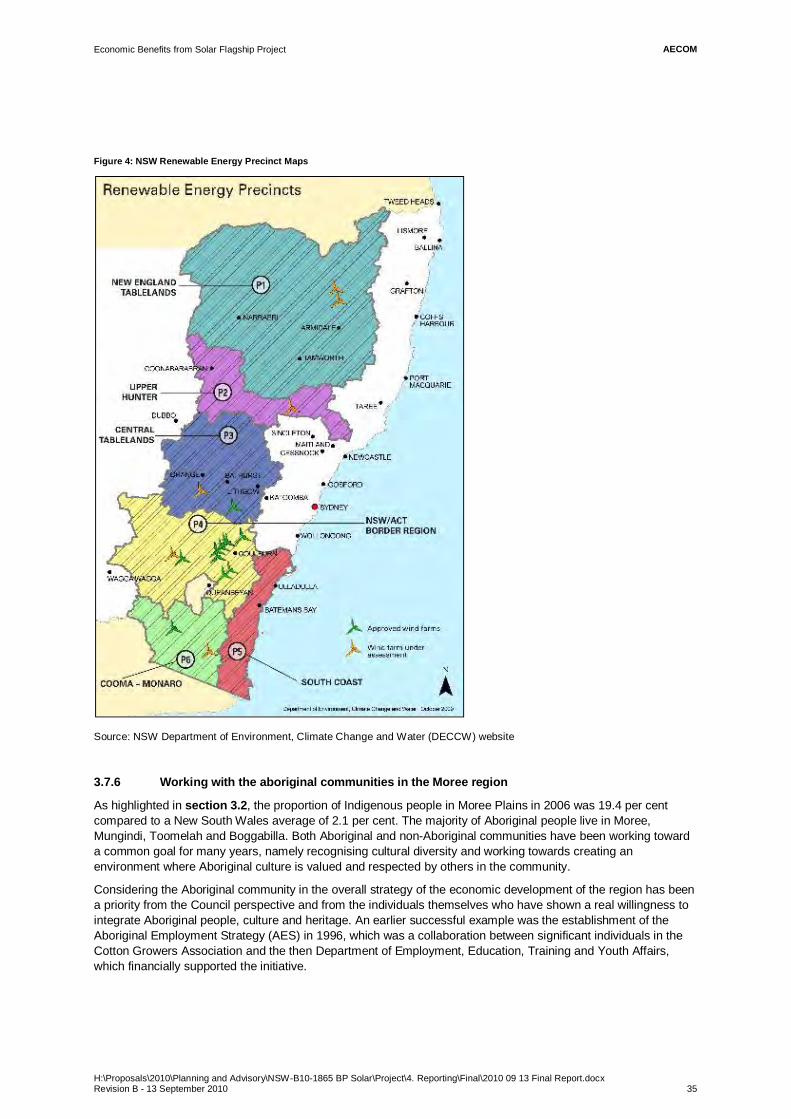
AECOMEconomic Benefits from Solar Flagship Project
H:\Proposals\2010\Planning and Advisory\NSW-B10-1865 BP Solar\Project\4. Reporting\Final\2010 09 13 Final Report.docx Revision B - 13 September 2010 35
Figure 4: NSW Renewable Energy Precinct Maps
Source: NSW Department of Environment, Climate Change and Water (DECCW) website
3.7.6 Working with the aboriginal communities in the Moree region
As highlighted in section 3.2, the proportion of Indigenous people in Moree Plains in 2006 was 19.4 per cent compared to a New South Wales average of 2.1 per cent. The majority of Aboriginal people live in Moree, Mungindi, Toomelah and Boggabilla. Both Aboriginal and non-Aboriginal communities have been working toward a common goal for many years, namely recognising cultural diversity and working towards creating an environment where Aboriginal culture is valued and respected by others in the community.
Considering the Aboriginal community in the overall strategy of the economic development of the region has been a priority from the Council perspective and from the individuals themselves who have shown a real willingness to integrate Aboriginal people, culture and heritage. An earlier successful example was the establishment of the Aboriginal Employment Strategy (AES) in 1996, which was a collaboration between significant individuals in the Cotton Growers Association and the then Department of Employment, Education, Training and Youth Affairs, which financially supported the initiative.
AECOMEconomic Benefits from Solar Flagship Project
H:\Proposals\2010\Planning and Advisory\NSW-B10-1865 BP Solar\Project\4. Reporting\Final\2010 09 13 Final Report.docx Revision B - 13 September 2010 36
Aboriginal people and employment
There is a historical disadvantage gap in employment outcomes between Aboriginal and non-Aboriginal people. The Council of Australian Governments (COAG) has set a target to halve this gap within the coming 10 years.
Recent analysis of the levels of socio-economic disparity between Aboriginal and non-Aboriginal populations in a given location, based on 2001 and 2006 Census data, confirms that Aboriginal disadvantage is not just because Aboriginal Australians are more likely to live in remote towns or outstations (Prout, S.2008). Even within the same suburb or large regional town, Indigenous Australians for a range of reasons, fare relatively poorly in terms of employment, education, income and housing.
A series of consultations undertaken across New South Wales in early 2009 relating to employment issues revealed that Aboriginal people identified a number of issues associated with recruitment, retention and career development. In addition, other barriers when seeking work included: difficulties in finding out about available position and employment programs and how to apply; challenges faced in identifying clear information regarding positions, duties and requirements; lack of computer or internet access; and difficulties in completing recruitment processes.
Aboriginal employees identified a personal pride they feel in providing services to their community, in working with Aboriginal communities around New South Wales, and in making a difference for their people. They also have tight bonds to their roots, culture and region, which should be considered while promoting Aboriginal employment opportunities in this project.
In this sense, the project, when combined with adequate community consultation and communication strategies represent a unique opportunity to develop job openings for Aboriginal people, which they would hold to be important and rewarding.
Aboriginal employment opportunities arising from the project
The project would lead to the creation of over 1000 full-time jobs in Australia, the majority of which (60-90 per cent) could be sourced from Moree.
A large number of these jobs in New South Wales would be the construction phase, proposed over a four year period, from 2012 to 2015. This project offers a unique opportunity to support the development of job creation for Aboriginal people and AECOM recommend a strategy to maximise this opportunity.
The strategy, to be inspired by the NSW Aboriginal Employment Action Plan – 2009-2012, which specifically addresses the employment of Aboriginal people in the public sector, could be used as a starting point for an enhanced employment strategy for the project in conjunction with a strong communication strategy. The possible outcomes could include:
provide better information to Aboriginal applicants about the job opportunities and recruitment processes;
provide advice and support to Aboriginal applicants;
provide work experience programs for Aboriginal school students;
provide workplaces in which Aboriginal culture is valued and respected;
value the contribution Aboriginal employees make to the work being undertaken;
support skill development, training and education program for Aboriginal employees; and
assist managers in providing regular, constructive feedback to Aboriginal employees;
Strategies to enhance Aboriginal employment could draw on the existing initiatives that already support Aboriginal employment in the Moree region. In particular, the BP Solar/FRV Consortium would benefit from a partnership with Aboriginal Employment Strategy, whose core business model is to engage and develop strong relationships between the government, corporate partners and Aboriginal career seekers working together to close the gap.
AECOMEconomic Benefits from Solar Flagship Project
H:\Proposals\2010\Planning and Advisory\NSW-B10-1865 BP Solar\Project\4. Reporting\Final\2010 09 13 Final Report.docx Revision B - 13 September 2010 37
3.8 Solar Industry development 3.8.1 Australian Solar Industry
The Australian PV industry plays a relatively small role in the energy sector, generating approximately 260GWh of energy annually (Clean Energy Council, 2009). In 2009, a total of 79MW of capacity was installed representing a 360% increase on 2008 levels, bringing total installed capacity up from 105MW in 2008 to 184MW in 2009 (APVA, 2010).
The recent strong take-up of PV has been driven by consumer demand for grid-connected systems encouraged by government policies such as feed-in tariffs and grants. These systems are typically small-scale units designed for rooftop use, in addition to off-grid industrial and agricultural applications. The largest operating system is the 1MW array at the Adelaide Showground constructed in 2009.
This demand is being serviced by a rapid increase in the number of installers accredited to install PV systems. As at August 2010 there are approximately 2400 accredited installers around Australia (Clean Energy Council, 2010). However, despite the number of installers, consumers are experiencing delays between application and installation indicating the potential for continued strong growth in the industry.
Growth in the industry is hampered by the limited domestic manufacturing capability of cells and modules. Australia’s only domestic manufacturer, BP Solar, closed its facility in western Sydney in March 2009. For the first three months of 2009, BP Solar produced 12MW of cells and modules from imported wafers. The facility has since been acquired by Silex Solar and production has commenced in early 2010. It should be noted that Origin Energy has established a pilot research and manufacturing plant in South Australia to produce small quantities of cells based on Sliver technology.
Beyond cell and module manufacturing, there are a small number of companies manufacturing or retailing balance-of-plant components such as inverters, batteries and mounting frames. Additionally, some of these companies pre-package PV kits to simplify the installation process. These companies essentially supply the small-scale market and therefore do not manufacture, wholesale or retail modules or components suitable for utility-scale generation plants. It is possible that as the PV industry develops increasingly large-scale plants, some of these companies may adapt to serve this new market.
An estimated 5300 people are employed along the PV value chain in areas such as, research, manufacturing, distribution and market analysis.
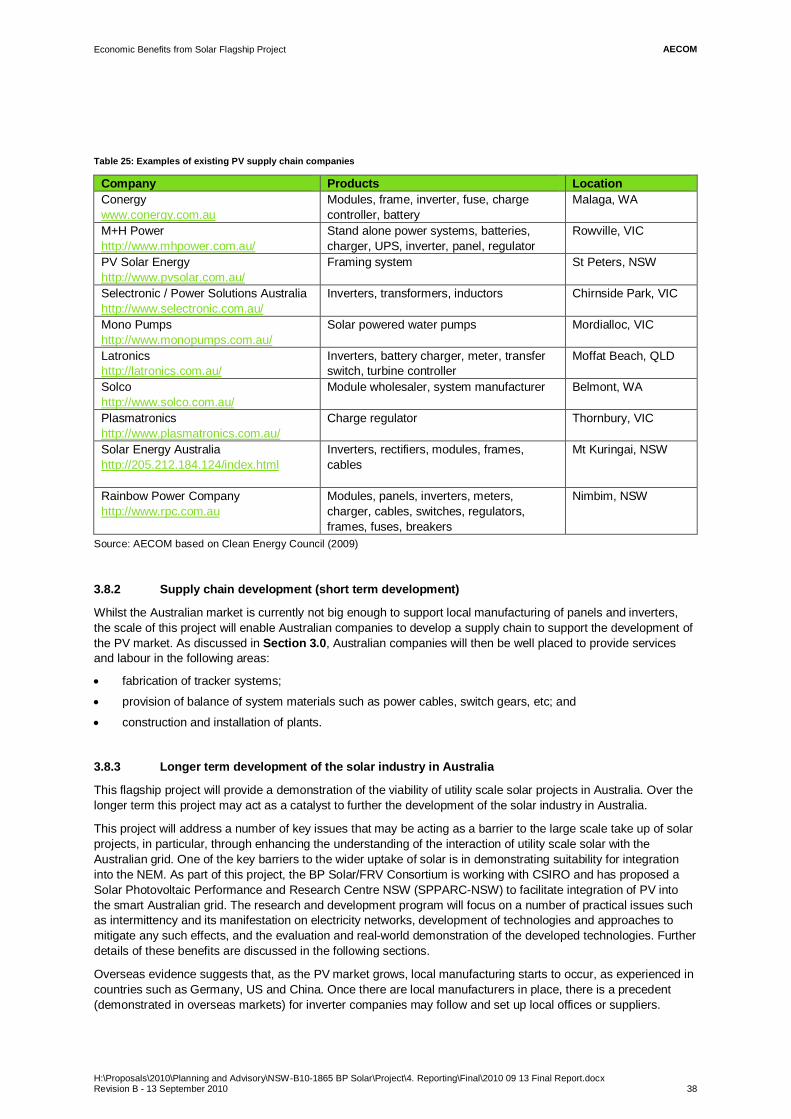
AECOMEconomic Benefits from Solar Flagship Project
H:\Proposals\2010\Planning and Advisory\NSW-B10-1865 BP Solar\Project\4. Reporting\Final\2010 09 13 Final Report.docx Revision B - 13 September 2010 38
Table 25: Examples of existing PV supply chain companies
Company Products Location Conergy www.conergy.com.au
Modules, frame, inverter, fuse, charge controller, battery
Malaga, WA
M+H Power http://www.mhpower.com.au/
Stand alone power systems, batteries, charger, UPS, inverter, panel, regulator
Rowville, VIC
PV Solar Energy http://www.pvsolar.com.au/
Framing system St Peters, NSW
Selectronic / Power Solutions Australia http://www.selectronic.com.au/
Inverters, transformers, inductors Chirnside Park, VIC
Mono Pumps http://www.monopumps.com.au/
Solar powered water pumps Mordialloc, VIC
Latronics http://latronics.com.au/
Inverters, battery charger, meter, transfer switch, turbine controller
Moffat Beach, QLD
Solco http://www.solco.com.au/
Module wholesaler, system manufacturer Belmont, WA
Plasmatronics http://www.plasmatronics.com.au/
Charge regulator Thornbury, VIC
Solar Energy Australia http://205.212.184.124/index.html
Inverters, rectifiers, modules, frames, cables
Mt Kuringai, NSW
Rainbow Power Company http://www.rpc.com.au
Modules, panels, inverters, meters, charger, cables, switches, regulators, frames, fuses, breakers
Nimbim, NSW
Source: AECOM based on Clean Energy Council (2009)
3.8.2 Supply chain development (short term development)
Whilst the Australian market is currently not big enough to support local manufacturing of panels and inverters, the scale of this project will enable Australian companies to develop a supply chain to support the development of the PV market. As discussed in Section 3.0, Australian companies will then be well placed to provide services and labour in the following areas:
fabrication of tracker systems;
provision of balance of system materials such as power cables, switch gears, etc; and
construction and installation of plants.
3.8.3 Longer term development of the solar industry in Australia
This flagship project will provide a demonstration of the viability of utility scale solar projects in Australia. Over the longer term this project may act as a catalyst to further the development of the solar industry in Australia.
This project will address a number of key issues that may be acting as a barrier to the large scale take up of solar projects, in particular, through enhancing the understanding of the interaction of utility scale solar with the Australian grid. One of the key barriers to the wider uptake of solar is in demonstrating suitability for integration into the NEM. As part of this project, the BP Solar/FRV Consortium is working with CSIRO and has proposed a Solar Photovoltaic Performance and Research Centre NSW (SPPARC-NSW) to facilitate integration of PV into the smart Australian grid. The research and development program will focus on a number of practical issues such as intermittency and its manifestation on electricity networks, development of technologies and approaches to mitigate any such effects, and the evaluation and real-world demonstration of the developed technologies. Further details of these benefits are discussed in the following sections.
Overseas evidence suggests that, as the PV market grows, local manufacturing starts to occur, as experienced in countries such as Germany, US and China. Once there are local manufacturers in place, there is a precedent (demonstrated in overseas markets) for inverter companies may follow and set up local offices or suppliers.
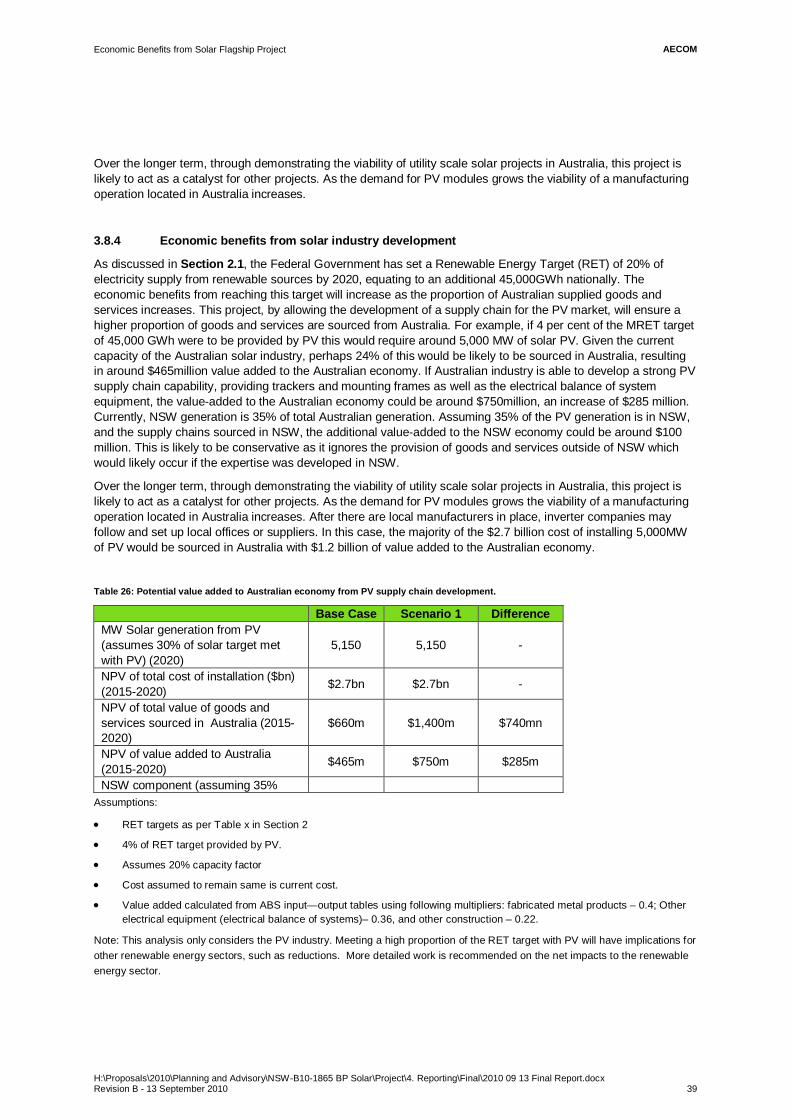
AECOMEconomic Benefits from Solar Flagship Project
H:\Proposals\2010\Planning and Advisory\NSW-B10-1865 BP Solar\Project\4. Reporting\Final\2010 09 13 Final Report.docx Revision B - 13 September 2010 39
Over the longer term, through demonstrating the viability of utility scale solar projects in Australia, this project is likely to act as a catalyst for other projects. As the demand for PV modules grows the viability of a manufacturing operation located in Australia increases.
3.8.4 Economic benefits from solar industry development
As discussed in Section 2.1, the Federal Government has set a Renewable Energy Target (RET) of 20% of electricity supply from renewable sources by 2020, equating to an additional 45,000GWh nationally. The economic benefits from reaching this target will increase as the proportion of Australian supplied goods and services increases. This project, by allowing the development of a supply chain for the PV market, will ensure a higher proportion of goods and services are sourced from Australia. For example, if 4 per cent of the MRET target of 45,000 GWh were to be provided by PV this would require around 5,000 MW of solar PV. Given the current capacity of the Australian solar industry, perhaps 24% of this would be likely to be sourced in Australia, resulting in around $465million value added to the Australian economy. If Australian industry is able to develop a strong PV supply chain capability, providing trackers and mounting frames as well as the electrical balance of system equipment, the value-added to the Australian economy could be around $750million, an increase of $285 million. Currently, NSW generation is 35% of total Australian generation. Assuming 35% of the PV generation is in NSW, and the supply chains sourced in NSW, the additional value-added to the NSW economy could be around $100 million. This is likely to be conservative as it ignores the provision of goods and services outside of NSW which would likely occur if the expertise was developed in NSW.
Over the longer term, through demonstrating the viability of utility scale solar projects in Australia, this project is likely to act as a catalyst for other projects. As the demand for PV modules grows the viability of a manufacturing operation located in Australia increases. After there are local manufacturers in place, inverter companies may follow and set up local offices or suppliers. In this case, the majority of the $2.7 billion cost of installing 5,000MW of PV would be sourced in Australia with $1.2 billion of value added to the Australian economy.
Table 26: Potential value added to Australian economy from PV supply chain development.
Base Case Scenario 1 Difference MW Solar generation from PV (assumes 30% of solar target met with PV) (2020)
5,150 5,150 -
NPV of total cost of installation ($bn) (2015-2020) $2.7bn $2.7bn -
NPV of total value of goods and services sourced in Australia (2015-2020)
$660m $1,400m $740mn
NPV of value added to Australia (2015-2020) $465m $750m $285m
NSW component (assuming 35% Assumptions:
RET targets as per Table x in Section 2
4% of RET target provided by PV.
Assumes 20% capacity factor
Cost assumed to remain same is current cost.
Value added calculated from ABS input—output tables using following multipliers: fabricated metal products – 0.4; Other electrical equipment (electrical balance of systems)– 0.36, and other construction – 0.22.
Note: This analysis only considers the PV industry. Meeting a high proportion of the RET target with PV will have implications for other renewable energy sectors, such as reductions. More detailed work is recommended on the net impacts to the renewable energy sector.
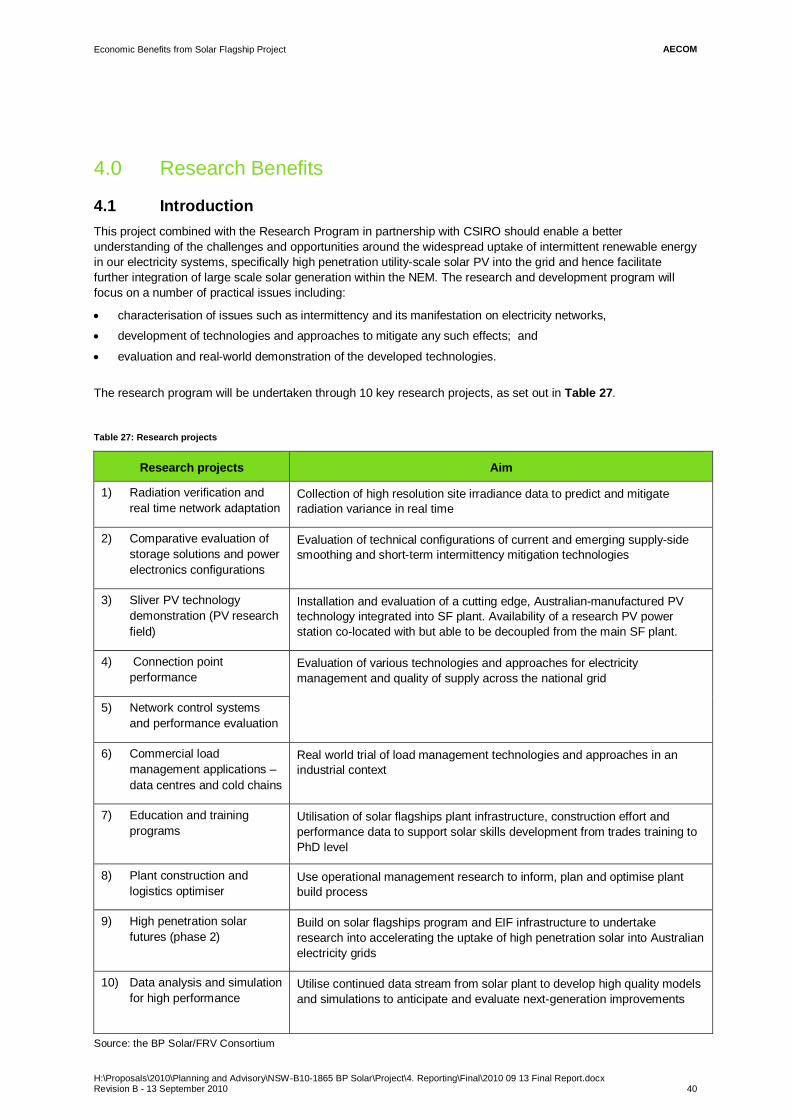
AECOMEconomic Benefits from Solar Flagship Project
H:\Proposals\2010\Planning and Advisory\NSW-B10-1865 BP Solar\Project\4. Reporting\Final\2010 09 13 Final Report.docx Revision B - 13 September 2010 40
4.0 Research Benefits
4.1 Introduction This project combined with the Research Program in partnership with CSIRO should enable a better understanding of the challenges and opportunities around the widespread uptake of intermittent renewable energy in our electricity systems, specifically high penetration utility-scale solar PV into the grid and hence facilitate further integration of large scale solar generation within the NEM. The research and development program will focus on a number of practical issues including:
characterisation of issues such as intermittency and its manifestation on electricity networks,
development of technologies and approaches to mitigate any such effects; and
evaluation and real-world demonstration of the developed technologies.
The research program will be undertaken through 10 key research projects, as set out in Table 27.
Table 27: Research projects
Research projects Aim
1) Radiation verification and real time network adaptation
Collection of high resolution site irradiance data to predict and mitigate radiation variance in real time
2) Comparative evaluation of storage solutions and power electronics configurations
Evaluation of technical configurations of current and emerging supply-side smoothing and short-term intermittency mitigation technologies
3) Sliver PV technology demonstration (PV research field)
Installation and evaluation of a cutting edge, Australian-manufactured PV technology integrated into SF plant. Availability of a research PV power station co-located with but able to be decoupled from the main SF plant.
4) Connection point performance
Evaluation of various technologies and approaches for electricity management and quality of supply across the national grid
5) Network control systems and performance evaluation
6) Commercial load management applications – data centres and cold chains
Real world trial of load management technologies and approaches in an industrial context
7) Education and training programs
Utilisation of solar flagships plant infrastructure, construction effort and performance data to support solar skills development from trades training to PhD level
8) Plant construction and logistics optimiser
Use operational management research to inform, plan and optimise plant build process
9) High penetration solar futures (phase 2)
Build on solar flagships program and EIF infrastructure to undertake research into accelerating the uptake of high penetration solar into Australian electricity grids
10) Data analysis and simulation for high performance
Utilise continued data stream from solar plant to develop high quality models and simulations to anticipate and evaluate next-generation improvements
Source: the BP Solar/FRV Consortium
AECOMEconomic Benefits from Solar Flagship Project
H:\Proposals\2010\Planning and Advisory\NSW-B10-1865 BP Solar\Project\4. Reporting\Final\2010 09 13 Final Report.docx Revision B - 13 September 2010 41
The key outcomes of this research will be two-fold:
The design and implementation of sophisticated control schemes targeted at allowing a high penetration of solar energy in our electricity systems. This will specifically address issues of intermittency, solar’s effect on the grid, load forecasting the value of peaking power generation, and optimal solutions to these issues.
Better characterisation of the solar energy resource - obtaining high-resolution solar irradiance data, solar forecasting models and quantifying the effect of various solar penetration levels on our electricity grids. This is vital to the industry development in terms of increasing the reliable prediction of solar plant performance anywhere in Australia.
Some of the benefits of this extensive research program are discussed below.
4.2 Electricity market benefits The integration of utility scale solar plants into the Australian National Electricity Market (NEM) will provide both opportunities and challenges. The lack of knowledge and hard data around the performance and intermittency of large scale solar PV and the impact on grid networks in particular presents a significant hindrance to the development of large scale solar markets in Australia.
There are a number of systems and procedures already established for dealing with short and long duration changes in generation or demand on the electrical grid network, such as the failure of a transmission line, outage of a power station, variations in daily electricity demand and sudden demand surges. These systems include:
Spinning reserve – power stations running at part load that adjust generation to meet normal fluctuations in demand
Peaking plants – power stations that are scheduled in advance to meet forecast demands such as day time peaks and shoulder periods
Pumped storage – hydro power stations that store energy during periods of low demand and provide fast response limited duration generation to meet surges in demand or unplanned outages
Load shedding – high energy consumers that can reduce their demand to facilitate network management during extreme events.
Whilst the penetration of renewable energy generation is relatively small, these existing network management systems are capable of providing the necessary backups for intermittent generation. As the proportion of renewable generation increases to meet 2020 targets the new entrants would typically trigger a requirement for additional back-up systems to be constructed to manage the grid.
The research proposals are structured to improve the understanding of the impact of large scale PV and renewable energy generation on the grid and may facilitate a reduction in the requirement for backup systems.
The economic benefit of better facilitation of large scale solar might be assessed in two ways:
deferral of gas fired peaking; and
reduction in frequency control ancillary services (FCAS), especially short term FCAS.
Each of these is discussed in more detail in the following sections.
4.2.1 Deferring peak generation
Gas fired peaking plants are turned on when there is an increase in demand or a decrease in generation. Once turned on, gas fired plants need a few hours to achieve full operating capacity, hence their role is limited to dealing with the longer term variability of renewable energy generation, and requires prediction of the generation/ demand fluctuations.

AECOMEconomic Benefits from Solar Flagship Project
H:\Proposals\2010\Planning and Advisory\NSW-B10-1865 BP Solar\Project\4. Reporting\Final\2010 09 13 Final Report.docx Revision B - 13 September 2010 42
Figure 5 shows that peak periods of electricity demand generally coincide with higher levels of PV output: at the simplest level, people work during the day when the sun is shining and sleep at night. There is a trend towards increasing peak demand in summer, partly due to increased penetration and use of air conditioners. Meeting this increased demand will necessitate additional investment in OCGT or other peaking plant. However the correlation between the generation profile of large scale PV and demand may provide an opportunity to defer the need for investment in new peak OCGT capacity.
Figure 5 - Solar generation versus demand - Moree
Source: AECOM, based on BoM data and NEM data
AECOM has valued the annual benefit of this deferred peak capacity through estimating the quantity of electricity generated by large scale solar PV at Moree, which would be dispatched into the market at times when average spot prices for the month are above the long-run marginal cost of new peak generation capacity. This methodology is based on the assumption that spot prices that average above new entrant peaking plant costs would attract additional investment in peak generation capacity.
AECOM has adopted a new entrant peak generation long-run marginal cost of $82 per MWh based on ACIL Tasman published long-run marginal costs of new entrant OCGT generation in northern New South Wales. (ACIL-Tasman 2010). Analysis of the New South Wales spot price data for the period of July 2008 to June 2010 suggests that average prices exceed new entrant costs for around 950 hours per year or 11 per cent of the time. Nearly 90 per cent of such periods occurred during the months of October to March when PV output is expected to be highest.
As set out in Table 28, this analysis suggests that the net benefit of PV production in peak periods resulting in a deferral of new entrant OCGT costs is in the order of $7.7 million annually (2010$). The total present value of deferred OCGT peak capacity over the expected 25 year operational life of the plant is $71.4 million, at a discount rate of 7 per cent. This is based on the current peaking profile which may change over time.
Table 28: Estimated value of deferred peak generation
0 5 10 15 20 25
Solar generation profile versus Demand (Summer time)
Solar generation profile
NEM demand profile
0 5 10 15 20 25
Solar generation profile versus Demand (Sunny winter day)
Solar generation profile
NEM Demand profile
$m Cost of additional peak capacity - OCGT ($/MWh installed) $82/MWh
Proportion of time that average prices exceed new entrant costs 950 hours pa (11% of time)
Annual value $7.7m NPV (2012-2040)* 7% discount rate $71.4m
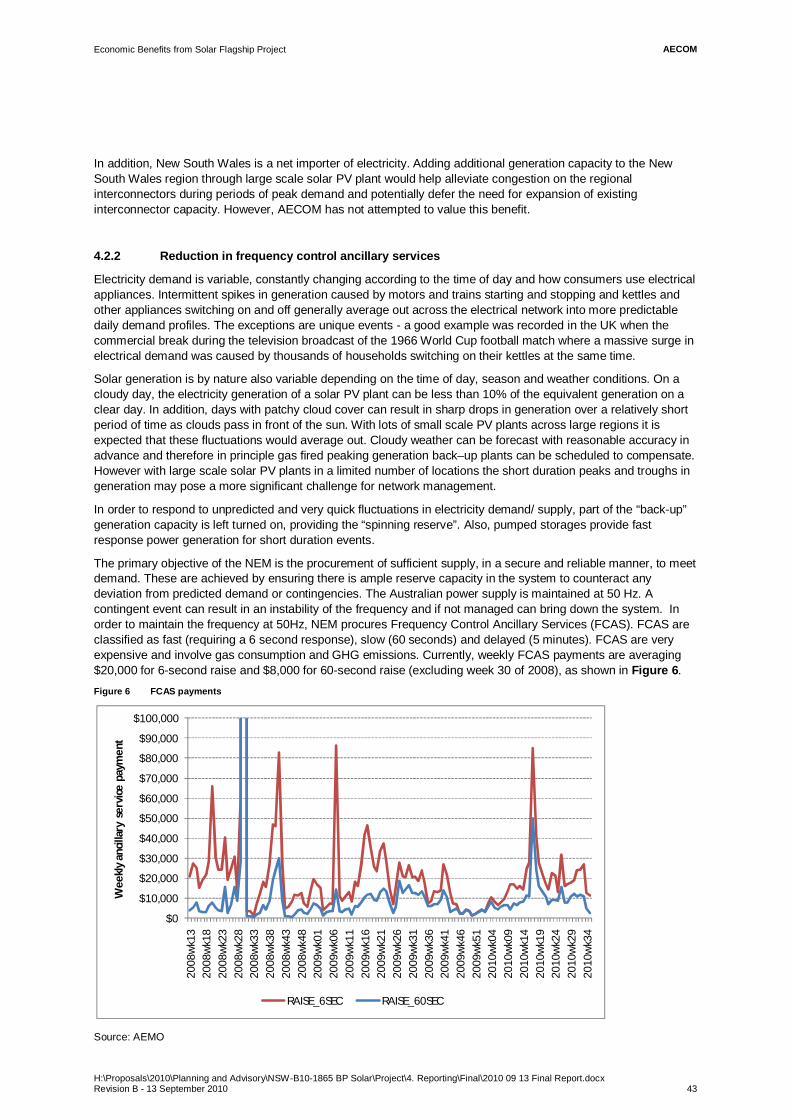
AECOMEconomic Benefits from Solar Flagship Project
H:\Proposals\2010\Planning and Advisory\NSW-B10-1865 BP Solar\Project\4. Reporting\Final\2010 09 13 Final Report.docx Revision B - 13 September 2010 43
In addition, New South Wales is a net importer of electricity. Adding additional generation capacity to the New South Wales region through large scale solar PV plant would help alleviate congestion on the regional interconnectors during periods of peak demand and potentially defer the need for expansion of existing interconnector capacity. However, AECOM has not attempted to value this benefit.
4.2.2 Reduction in frequency control ancillary services
Electricity demand is variable, constantly changing according to the time of day and how consumers use electrical appliances. Intermittent spikes in generation caused by motors and trains starting and stopping and kettles and other appliances switching on and off generally average out across the electrical network into more predictable daily demand profiles. The exceptions are unique events - a good example was recorded in the UK when the commercial break during the television broadcast of the 1966 World Cup football match where a massive surge in electrical demand was caused by thousands of households switching on their kettles at the same time.
Solar generation is by nature also variable depending on the time of day, season and weather conditions. On a cloudy day, the electricity generation of a solar PV plant can be less than 10% of the equivalent generation on a clear day. In addition, days with patchy cloud cover can result in sharp drops in generation over a relatively short period of time as clouds pass in front of the sun. With lots of small scale PV plants across large regions it is expected that these fluctuations would average out. Cloudy weather can be forecast with reasonable accuracy in advance and therefore in principle gas fired peaking generation back–up plants can be scheduled to compensate. However with large scale solar PV plants in a limited number of locations the short duration peaks and troughs in generation may pose a more significant challenge for network management.
In order to respond to unpredicted and very quick fluctuations in electricity demand/ supply, part of the “back-up” generation capacity is left turned on, providing the “spinning reserve”. Also, pumped storages provide fast response power generation for short duration events.
The primary objective of the NEM is the procurement of sufficient supply, in a secure and reliable manner, to meet demand. These are achieved by ensuring there is ample reserve capacity in the system to counteract any deviation from predicted demand or contingencies. The Australian power supply is maintained at 50 Hz. A contingent event can result in an instability of the frequency and if not managed can bring down the system. In order to maintain the frequency at 50Hz, NEM procures Frequency Control Ancillary Services (FCAS). FCAS are classified as fast (requiring a 6 second response), slow (60 seconds) and delayed (5 minutes). FCAS are very expensive and involve gas consumption and GHG emissions. Currently, weekly FCAS payments are averaging $20,000 for 6-second raise and $8,000 for 60-second raise (excluding week 30 of 2008), as shown in Figure 6. Figure 6 FCAS payments
Source: AEMO
$0
$10,000
$20,000
$30,000
$40,000
$50,000
$60,000
$70,000
$80,000
$90,000
$100,000
2008
wk1
320
08w
k18
2008
wk2
320
08w
k28
2008
wk3
320
08w
k38
2008
wk4
320
08w
k48
2009
wk0
120
09w
k06
2009
wk1
120
09w
k16
2009
wk2
120
09w
k26
2009
wk3
120
09w
k36
2009
wk4
120
09w
k46
2009
wk5
120
10w
k04
2010
wk0
920
10w
k14
2010
wk1
920
10w
k24
2010
wk2
920
10w
k34
Wee
kly
anci
llary
ser
vice
pay
men
t
RAISE_6SEC RAISE_60SEC
AECOMEconomic Benefits from Solar Flagship Project
H:\Proposals\2010\Planning and Advisory\NSW-B10-1865 BP Solar\Project\4. Reporting\Final\2010 09 13 Final Report.docx Revision B - 13 September 2010 44
In the absence of good forecasting information on the intermittency of large scale solar PV generation, the high penetration of utility scale solar power into the NEM would require large amounts of short term FCAS to cover any losses in generation due to cloud cover.
Currently, there is little published data on short duration changes in output from large scale solar PV because few installations record or publish their performance with sufficient accuracy or resolution. It is therefore difficult to make reliable estimates of the required FCAS to support large scale solar. Given this uncertainty, the NEM would likely need to provide FCAS equivalent to any solar plant generation.
The proposed Solar Photovoltaic Performance and Research Centre NSW (SPPARC-NSW) will undertake a practical research and development program to inform and support the performance of the solar flagship plant and facilitate integration of PV into the smart Australian grid. It includes:
The development of a “virtual Power Plant” software package to forecast impacts of distributed solar generation through NEM.
The characterisation of intermittency and its manifestation on electricity networks. This involves the collection of high resolution site irradiance data and real time network adaptation. This is a key point to predict and mitigate electricity generation variance in the future.
The development of technologies and approaches to mitigate any such effects,
This real world experimental research program should deliver a better understanding of this key issue, particularly while dealing with distributed solar through NEM. Since cloud systems vary from one area to another and move across Australia, all solar plants of a distributed solar generation precinct wouldn’t be affected at the same time, which, in theory, minimizes the necessity of spinning reserve. The Virtual Power Plant software to be developed would help predict fluctuations of plants distributed through the NEM, and when other plants are affected. This research therefore potentially has very significant benefits for the NEM. This research may lead to the deferral of the requirement for new spinning reserve plants and other FCAS services to backup future large scale generation.
In order to quantify this benefit, a detailed assessment needs to be undertaken of the current FCAS capacity and what additional capacity may be required to integrate large scale solar generation.

AECOMEconomic Benefits from Solar Flagship Project
H:\Proposals\2010\Planning and Advisory\NSW-B10-1865 BP Solar\Project\4. Reporting\Final\2010 09 13 Final Report.docx Revision B - 13 September 2010 45
4.3 Network benefits 4.3.1 Deferring network capital expenditure
There are two transmission lines linking the Moree substation with the rest of the New South Wales network as shown in the following figure. Figure 7: Map of transmission connections
Source: CountryEnergy and TransGrid, undated
The load served by the substation is approximately 40MW. With no significant increases in demand forecast for Moree it seems unlikely that demand driven transmission network capacity upgrading would be required in the foreseeable future.
Figure 8: Demand projections

AECOMEconomic Benefits from Solar Flagship Project
H:\Proposals\2010\Planning and Advisory\NSW-B10-1865 BP Solar\Project\4. Reporting\Final\2010 09 13 Final Report.docx Revision B - 13 September 2010 46
Meeting the renewable energy targets however will require increasing levels of renewable energy generation to be connected to the transmission network. According to figures from the ABARE Energy Update July 2010, approximately 10.9GW of renewable energy generation capacity may need to be installed by 2020. Typically the best renewable resources and sites suitable for large scale development are remote from major demand centres. Therefore it is anticipated that very significant investment in generation driven new grid transmission infrastructure and upgrades may be required to achieve the 2020 renewable energy targets.
The generation characteristics of renewable energy generation however are different from conventional generators; renewable generators such a solar PV and wind farms produce a variable electricity output according to when the sun is shining or the wind is blowing. Under traditional “fit and forget” grid connection arrangements generators have access to network export capacity equivalent to the peak generation capacity of the generator. However because solar power and wind power does not generate all of the time this means that the grid export capacity is not being fully utilised. When new transmission capacity is built for renewable power stations but not fully utilised there is potentially a poor return on investment.
The project proposes to undertake research in a number of areas including energy storage, the development of tools forecasting generation and demand and quantifying the impact on the grids. This research may facilitate enhanced management and utilisation of transmission infrastructure assets, enabling more renewable generators to share the same infrastructure and hence deferring investment in new transmission network assets. According to figures from the Australian Solar Energy Society (July 2010), the cost of new high voltage transmission lines is approximately $1.7 million per kilometre, so the reduction in future transmission capacity due to better sorage could have significant benefits.
According to a new report “Energy Storage on the Grid” , August 2010 by Pike Research, large scale energy storage technology is creating opportunities for utilities to defer transmission and distribution (T&D) capital upgrades, time of use energy cost management for the commercial and industrial (C&I) segments, and conventional energy time shifting. Pike Research estimated that the global storage system annual revenues could reach USD$35Billion by 2020. The research proposals include a range of large scale integrated energy storage devices for the solar array and at lab scale. Research facilitated by the project and this energy storage infrastructure may lead to the development of technology innovations that could enable Australia to commercialise and possibly export energy storage technology and related Intellectual property. The research may secure a slice of this global energy storage market potential for Australia. According to figures produced by the International Energy Agency, Australia’s total electricity consumption is approximately 1.3% of the world total electricity final consumption. Assuming Australia benefits pro rata according to electricity consumption, the value for Australia of the global energy storage market annual revenue market may be worth in the order of AUD$500M by 2020. If Australia is in a position to export this technology this share could be much higher.
4.3.2 Network strengthening
Electricity networks supplied by long and relatively low capacity transmission lines such as those around Moree and other parts of rural Australia are vulnerable to voltage stability issues, particularly as a result of large motors switching on and off which cause significant surges in reactive power demand. Grid voltage stability is predominantly achieved through network management of synchronous generator reactive power export and through the strategic use of automatic tap changer transformers and large capacitor banks (as shown in Figure 9). This infrastructure equipment has a significant capital cost and automatic tap changers in particular have a limited lifetime which is directly related to the number of switching cycles.
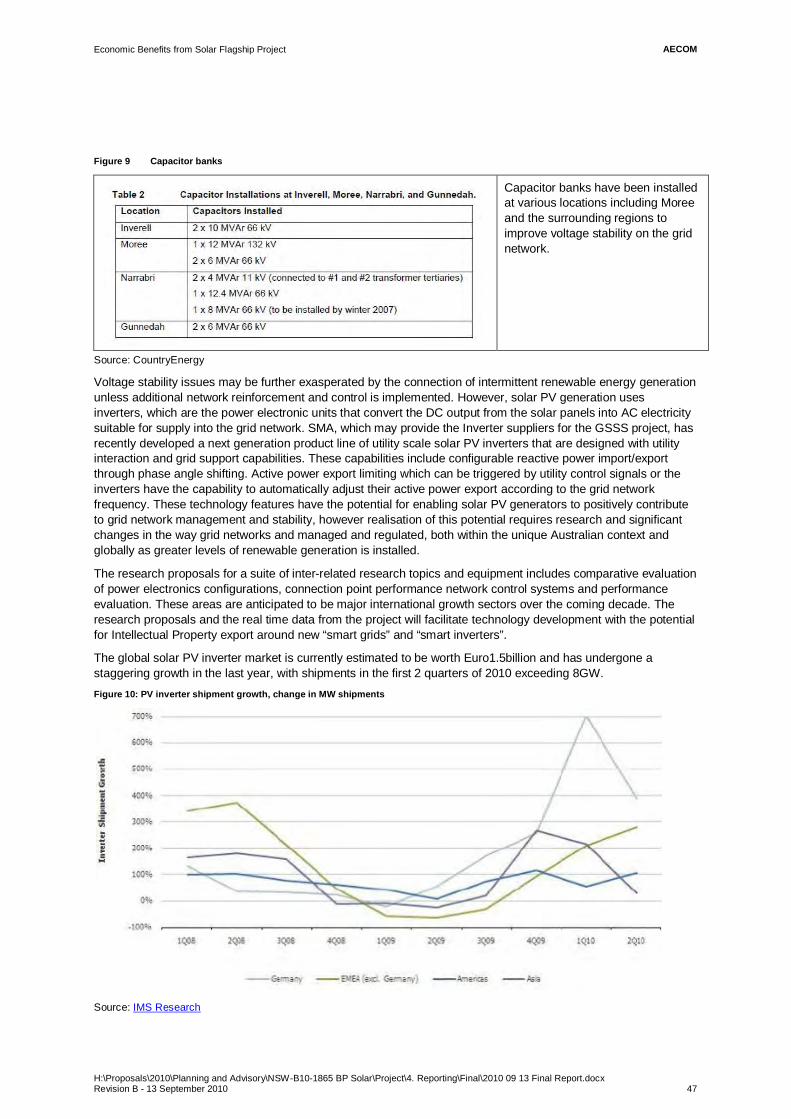
AECOMEconomic Benefits from Solar Flagship Project
H:\Proposals\2010\Planning and Advisory\NSW-B10-1865 BP Solar\Project\4. Reporting\Final\2010 09 13 Final Report.docx Revision B - 13 September 2010 47
Figure 9 Capacitor banks
Capacitor banks have been installed at various locations including Moree and the surrounding regions to improve voltage stability on the grid network.
Source: CountryEnergy
Voltage stability issues may be further exasperated by the connection of intermittent renewable energy generation unless additional network reinforcement and control is implemented. However, solar PV generation uses inverters, which are the power electronic units that convert the DC output from the solar panels into AC electricity suitable for supply into the grid network. SMA, which may provide the Inverter suppliers for the GSSS project, has recently developed a next generation product line of utility scale solar PV inverters that are designed with utility interaction and grid support capabilities. These capabilities include configurable reactive power import/export through phase angle shifting. Active power export limiting which can be triggered by utility control signals or the inverters have the capability to automatically adjust their active power export according to the grid network frequency. These technology features have the potential for enabling solar PV generators to positively contribute to grid network management and stability, however realisation of this potential requires research and significant changes in the way grid networks and managed and regulated, both within the unique Australian context and globally as greater levels of renewable generation is installed.
The research proposals for a suite of inter-related research topics and equipment includes comparative evaluation of power electronics configurations, connection point performance network control systems and performance evaluation. These areas are anticipated to be major international growth sectors over the coming decade. The research proposals and the real time data from the project will facilitate technology development with the potential for Intellectual Property export around new “smart grids” and “smart inverters”.
The global solar PV inverter market is currently estimated to be worth Euro1.5billion and has undergone a staggering growth in the last year, with shipments in the first 2 quarters of 2010 exceeding 8GW. Figure 10: PV inverter shipment growth, change in MW shipments
Source: IMS Research

AECOMEconomic Benefits from Solar Flagship Project
H:\Proposals\2010\Planning and Advisory\NSW-B10-1865 BP Solar\Project\4. Reporting\Final\2010 09 13 Final Report.docx Revision B - 13 September 2010 48
The Australian and global solar and renewable energy markets are set to significantly grow over the next decade and integration of renewables into grid networks will become an increasingly important issue. Smart grids, smart inverters, dynamic loads, electric vehicles and grid integration and management Intellectual Property will all become increasingly critical for realisation of these markets.
The PV solar generation contribution to the Australian 2020 Renewable Energy target is estimated to be 4% of the target equivalent to 6GW installed capacity (based on figures from the Australian Solar Energy Association, Dec 2009). Based on these figures the cumulative value of the Australian market for solar inverters is likely to be worth $1800M by 2020. Given that Australia has some of the richest solar resources in the world it is anticipated that the longer term demand post 2020 for solar PV inverters would be significantly greater. Assuming that the project enabled research into solar inverters leads to the development of smart inverter technology and Australian smart grid solutions, the benefit of the research to the Australian economy is likely to be an increase in the export of Australian technology and Intellectual Property.
In addition to the smart inverter technology there is the potential for deferral of network strengthening and voltage control infrastructure that may be facilitated by the development of smart inverter and smart grid research. In principle the research is anticipated to facilitate a reduction in the requirement for additional capacitor and reactor banks and facilitate a reduction in automatic tap changer switching cycles potentially extending the asset life of this equipment. Further network savings would be anticipated with the associated reduced power losses on transmission lines, reduced requirements for synchronous generator reactive power export etc. The requirements and specification of equipment and network benefits would be very site specific and it is not possible to define generic estimate of the savings at this stage, particularly as extent of the benefits that may be facilitated are dependent upon the outputs of the proposed research.
4.4 Export opportunities 4.4.1 Exporting renewables and markets expertise
Australian companies have successfully been exporting energy market related services and software around the world. Exports of such services will be bolstered after Australia can demonstrate successful integration of large scale solar generation into a wholesale electricity market.
The Australian NEM was actually designed to accommodate dispatch of renewable generation. It also successfully interacts with market based schemes such as renewable energy target. Australian businesses that are exporting services and software, drawing on their experience with the NEM and renewable energy include:
ACIL Tasman
Frontier Economics
McLennan Magasanik
Intelligent Energy Systems;
along with major multinational firms using Australian staff, such as AECOM.
It is beneficial for a company to refer to renewable energy markets in its country of origin. So export competitiveness of Australian businesses will be improved by having large scale solar in the NEM. The benefit will be even greater if the solar plant has a brand that is recognised in international markets.
ABS (5368.0.55.006 - Characteristics of Australian Exporters, 2008-09) reports that firms exporting financial services averaged $2m in exports per year and firms exporting other business services averaged $3.6m in exports per year (2009). The value of energy market and software related exports worthies therefore estimated between $5 million and $10 million per annum to Australia. This market could increase by up to 20%, or $1 million to $2 million per year, after integration of large scale solar in the NEM.

AECOMEconomic Benefits from Solar Flagship Project
H:\Proposals\2010\Planning and Advisory\NSW-B10-1865 BP Solar\Project\4. Reporting\Final\2010 09 13 Final Report.docx Revision B - 13 September 2010 49
4.4.2 Expertise in financing renewables
Key factors that affect cost of financing include:
Technology risks, especially deterioration in output; and
Credit risk of power purchase agreement counterparty.
Successful integration of large scale solar plant will, over time, enable better understanding of technology risks. This, plus lower credit risk for counter-parties, will reduce the cost of financing for solar plant. The benefit of reduced financing cost for future can be estimated as a reduction of, perhaps, 10 basis points in the cost of both debt and equity. For a future project costing $600 million, this could be worth $0.6 million per annum during the life of the project.
There may also be benefits in terms of improving prospects for Australian companies becoming involved in financing renewable projects overseas. However there is no clear basis for estimating the number of firms that might become involved, so potential benefits have not been quantified.
4.5 Solar research benefits 4.5.1 Overview of the current Solar Research in Australia
There are a number of initiatives and organisations aiming to develop the Australian solar research. CSIRO and the University of New South Wales PV Centre of Excellence are the two major players in solar research, but there are a number of other initiatives and organisations, including:
Commercial firms such as DyeSol (www.dyesol.com). Silex Systems Limited (www.silex.com.au), Spark Solar Australia (www.sparksolar.com.au).
The Australian Solar Energy Society (AusSES), a Not-for-profit organisation and leading provider of solar energy information in Australia. As, a corporate member, BP Solar support the AusSES.
Three groups in the School of Engineering at the ANU College of Engineering and Computer Science (http://solar.anu.edu.au/). The ANU Solar Thermal Group conducts Research and Development activities on Solar.
The Australian Solar Institute, formed by the Commonwealth Government of Australia. Its key stakeholders include the UNSW, ANU and the CSIRO. It consists in a $100 million commitment by the Australian Government as part of the expanded $5.1 billion Clean Energy Initiative, to support solar thermal and solar photovoltaic research and development.
4.5.1.1 CSIRO
CSIRO is undertaking a broad solar research program to facilitate a transition to increased reliance on solar supplies in the future. In particular, the National Solar Energy Centre (NSEC) was established to research, develop and demonstrate world-leading concentrated solar thermal technologies.
Researchers at CSIRO are using research and demonstration facility, specialising in advances in innovative solar technologies and work in collaboration with national and international groups to advance the uptake of solar technology in Australia and world-wide. The aim is to be a hub for national and international researchers in this area, promoting collaboration and partnerships between researchers, government and industry.
CSIRO and BP-Solar are proposing a program of research which supports the creation of a trusted market for utility scale solar PV in Australia through the solar flagship plant. This represents a considerable opportunity for further development of the Australian Solar research.
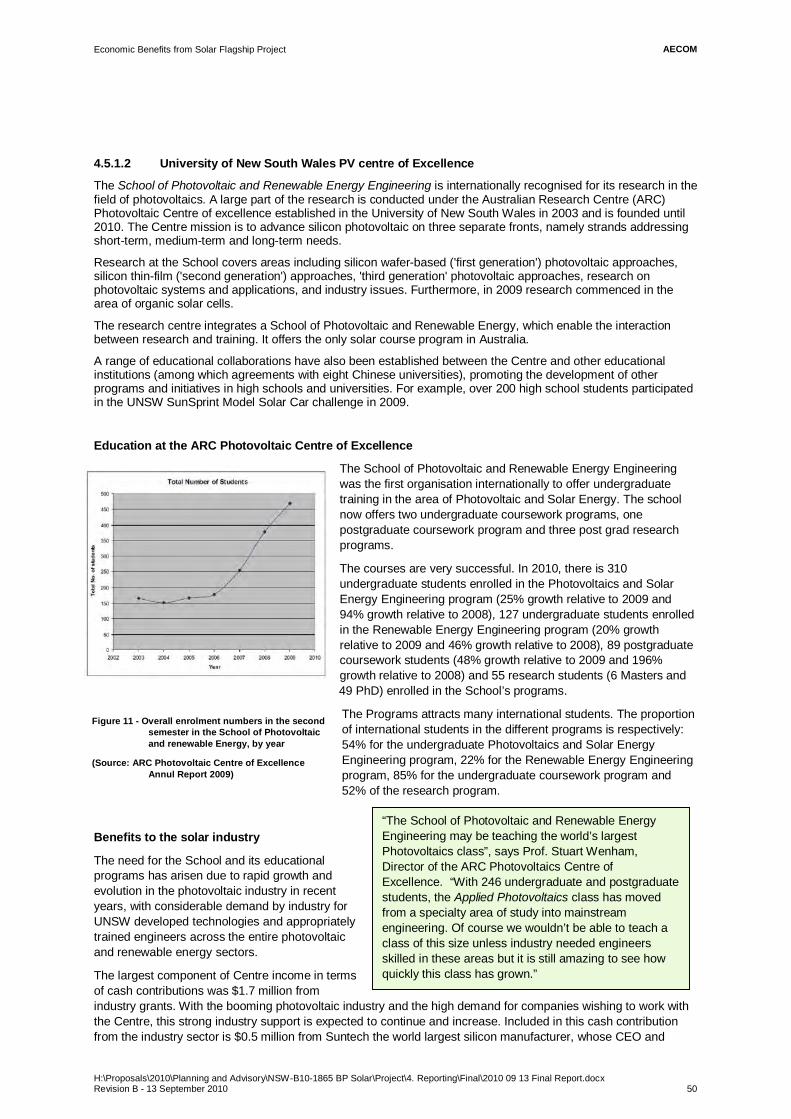
AECOMEconomic Benefits from Solar Flagship Project
H:\Proposals\2010\Planning and Advisory\NSW-B10-1865 BP Solar\Project\4. Reporting\Final\2010 09 13 Final Report.docx Revision B - 13 September 2010 50
4.5.1.2 University of New South Wales PV centre of Excellence
The School of Photovoltaic and Renewable Energy Engineering is internationally recognised for its research in the field of photovoltaics. A large part of the research is conducted under the Australian Research Centre (ARC) Photovoltaic Centre of excellence established in the University of New South Wales in 2003 and is founded until 2010. The Centre mission is to advance silicon photovoltaic on three separate fronts, namely strands addressing short-term, medium-term and long-term needs.
Research at the School covers areas including silicon wafer-based ('first generation') photovoltaic approaches, silicon thin-film ('second generation') approaches, 'third generation' photovoltaic approaches, research on photovoltaic systems and applications, and industry issues. Furthermore, in 2009 research commenced in the area of organic solar cells.
The research centre integrates a School of Photovoltaic and Renewable Energy, which enable the interaction between research and training. It offers the only solar course program in Australia.
A range of educational collaborations have also been established between the Centre and other educational institutions (among which agreements with eight Chinese universities), promoting the development of other programs and initiatives in high schools and universities. For example, over 200 high school students participated in the UNSW SunSprint Model Solar Car challenge in 2009.
Education at the ARC Photovoltaic Centre of Excellence
The School of Photovoltaic and Renewable Energy Engineering was the first organisation internationally to offer undergraduate training in the area of Photovoltaic and Solar Energy. The school now offers two undergraduate coursework programs, one postgraduate coursework program and three post grad research programs.
The courses are very successful. In 2010, there is 310 undergraduate students enrolled in the Photovoltaics and Solar Energy Engineering program (25% growth relative to 2009 and 94% growth relative to 2008), 127 undergraduate students enrolled in the Renewable Energy Engineering program (20% growth relative to 2009 and 46% growth relative to 2008), 89 postgraduate coursework students (48% growth relative to 2009 and 196% growth relative to 2008) and 55 research students (6 Masters and 49 PhD) enrolled in the School’s programs.
The Programs attracts many international students. The proportion of international students in the different programs is respectively: 54% for the undergraduate Photovoltaics and Solar Energy Engineering program, 22% for the Renewable Energy Engineering program, 85% for the undergraduate coursework program and 52% of the research program.
Benefits to the solar industry
The need for the School and its educational programs has arisen due to rapid growth and evolution in the photovoltaic industry in recent years, with considerable demand by industry for UNSW developed technologies and appropriately trained engineers across the entire photovoltaic and renewable energy sectors.
The largest component of Centre income in terms of cash contributions was $1.7 million from industry grants. With the booming photovoltaic industry and the high demand for companies wishing to work with the Centre, this strong industry support is expected to continue and increase. Included in this cash contribution from the industry sector is $0.5 million from Suntech the world largest silicon manufacturer, whose CEO and
Figure 11 - Overall enrolment numbers in the second semester in the School of Photovoltaic and renewable Energy, by year
(Source: ARC Photovoltaic Centre of Excellence Annul Report 2009)
“The School of Photovoltaic and Renewable Energy Engineering may be teaching the world’s largest Photovoltaics class”, says Prof. Stuart Wenham, Director of the ARC Photovoltaics Centre of Excellence. “With 246 undergraduate and postgraduate students, the Applied Photovoltaics class has moved from a specialty area of study into mainstream engineering. Of course we wouldn’t be able to teach a class of this size unless industry needed engineers skilled in these areas but it is still amazing to see how quickly this class has grown.”
AECOMEconomic Benefits from Solar Flagship Project
H:\Proposals\2010\Planning and Advisory\NSW-B10-1865 BP Solar\Project\4. Reporting\Final\2010 09 13 Final Report.docx Revision B - 13 September 2010 51
Chairman Zhengrong Shi studied at the UNSW. This highlights the opportunities for future benefits arising from the linked formed between international students and their Australian Universities. A notable achievement in 2009 is the introduction of high-efficiency Pluto technology, co-developed with Suntech, onto the market in large volumes.
4.5.2 Research opportunities from the project
CSIRO and BP-Solar are proposing a program of research which supports the creation of a trusted market for utility scale solar PV in Australia through the solar flagship plant. This represents a considerable opportunity for further development of the Australian Solar research and to positively impact the success of Solar coursework programs.
The research and development program will focus on a number of practical issues:
characterisation of issues such as intermittency and its manifestation on electricity networks,
development of technologies and approaches to mitigate any such effects, and
the evaluation and real-world demonstration of the developed technologies.
Importantly, this program will provide world leading research through a comprehensive approach to examining utility scale solar integration issues, impacts and potential solutions right across the energy supply chain – from generation maximisation and supply efficacy to electricity demand and management. In particular the research program will be undertaken through 10 key research projects enabled and supported by EIF research infrastructure and identified in Table 27 above.
In addition to these technical issues, the research programme will explore the wider societal and community aspects of a transition to a solar future, from the education of technical staff to meaningful community engagement and economic development.
The research infrastructure to be established will enhance the capacity of Australian research organisations by providing access to:
- Large-scale electricity network assets (which are normally prohibitively expensive and are used and installed only by electrical network operators) that are, for the first time, available for research purposes
- Distributed load management hardware for real-time energy management experiments, significantly reducing the cost of real-world trials of distributed energy management technologies
- High-speed electrical transient data to characterise network effects and facilitate the development of new technical solutions to these challenges
- High-resolution solar monitoring data for improved solar mapping, solar system design and facility operation - On-site research infrastructure capable of remote operation and thus facilitating access for researchers
nationwide and internationally
In the longer term, this work will form an important contribution towards wider Australian research into the future role of solar generators as a network asset in the smart grid. Once the plant is operational and the initial phase of research complete, the research infrastructure will be utilised in a continuing R&D program supported by the BP Solar/FRV Consortium to facilitate accelerated adoption of high penetration solar capacity into the Australian electricity market.

AECOMEconomic Benefits from Solar Flagship Project
H:\Proposals\2010\Planning and Advisory\NSW-B10-1865 BP Solar\Project\4. Reporting\Final\2010 09 13 Final Report.docx Revision B - 13 September 2010 52
4.5.3 Attracting international students
As described above, UNSW is the only Australian university to offer solar coursework programs and has experienced an increasing success over the last couple of years, reflecting the demand for solar training in Australia.
This project, through advancing the utility scale solar market and the unique research opportunity, provides an opportunity for the Australian economy to attract additional international students through the enhancement of the Renewable and Solar coursework programs given that Australia will have real world case studies made possible by the project. These international students have a double contribution to the Australian economy:
- In the future, they can help Australia meet its skill needs for the development and export of the Australian solar industry. The real-world experience gained by these students would facilitate the development of the solar industry in Australia, to be more easily exportable overseas in the future. (For example, the CEO and Chairman of Suntech, Zhengrong Shi, who studied at the UNSW remains a major contributor to the PV Photovoltaic Centre of Excellence).
- International education makes a significant contribution to the Australian economy. The international student market has grown to now be our third largest source of overseas earnings, generating $13.7 billion from on-shore students in 2008 and supporting more than 125,000 jobs16. In 2008, nearly half a million students came to Australia. In average, each international student has a contribution of about $25K per year to the Australian economy.
In order to quantify the direct benefit to the economy from attracting new international students, AECOM has developed three scenarios. The proportion of international students in the three solar coursework programs offered in Australia (at the UNSW) is currently averaging 52%, namely about 272 international students out of 526 students enrolled.
Scenario A: Growing success of the Australian solar education mostly amongst Australian students: The total number of students increases by 10% per year by 2016, then by 20% for 5 years due to the enhancement of the program linked to the BP Research program. The proportion of international student decreases by 2% per year for the first 10 years then remains constant.
Scenario B: Growing success in Australia and overseas: The total number of student’s increases by 20% per year by 2016, then by 25% for 5 years due to the enhancement of the program linked to the BP Research program. The proportion of international students remains the same.
Scenario C: Growing success, particularly amongst international students: The total number of students increases by 20% per year by 2016, then by 25% for 5 years due to the enhancement of the program linked to the BP Research program. At the same time, the proportion of international students grows by 5% per year.
16 (ABS 2008)
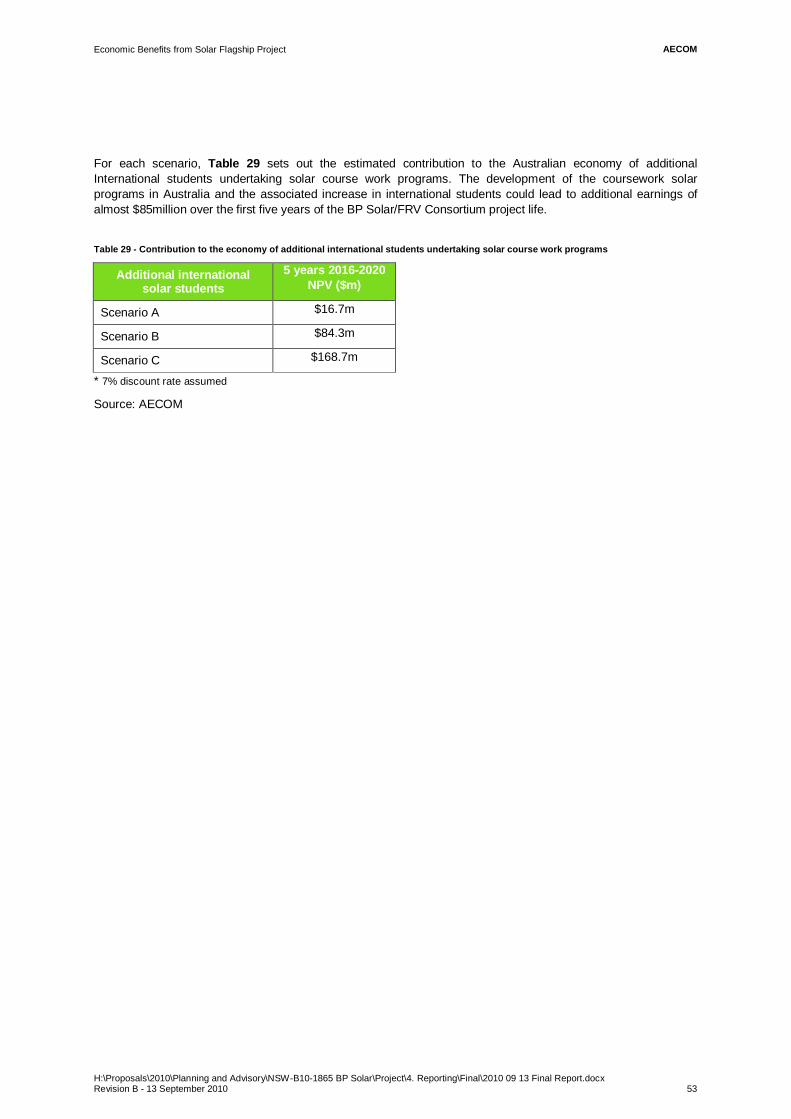
AECOMEconomic Benefits from Solar Flagship Project
H:\Proposals\2010\Planning and Advisory\NSW-B10-1865 BP Solar\Project\4. Reporting\Final\2010 09 13 Final Report.docx Revision B - 13 September 2010 53
For each scenario, Table 29 sets out the estimated contribution to the Australian economy of additional International students undertaking solar course work programs. The development of the coursework solar programs in Australia and the associated increase in international students could lead to additional earnings of almost $85million over the first five years of the BP Solar/FRV Consortium project life.
Table 29 - Contribution to the economy of additional international students undertaking solar course work programs
Additional international solar students
5 years 2016-2020 NPV ($m)
Scenario A $16.7m
Scenario B $84.3m
Scenario C $168.7m
* 7% discount rate assumed
Source: AECOM
AECOMEconomic Benefits from Solar Flagship Project
H:\Proposals\2010\Planning and Advisory\NSW-B10-1865 BP Solar\Project\4. Reporting\Final\2010 09 13 Final Report.docx Revision B - 13 September 2010 54
5.0 References AEMC 2010, NEM Reliability Settings: VoLL, CPT and Future Reliability Review, http://www.aemc.gov.au/Electricity/Rule-changes/Completed/NEM-Reliability-Settings-VoLL-CPT-and-Future-Reliability-Review.html accessed 4 Sep 2010
CountryEnergy and TransGrid 200x, Development of Electricity Supply to the Inverell Area, http://www.countryenergy.com.au/asset/cms/pdf/networkInvestments/Inverell_Report.pdf accessed 4 Sep 2010
Outhred 2006, Integrating Wind Energy into the Australian National Electricity Market, http://www.ceem.unsw.edu.au/content/userDocs/200608WREC9_WindIntegrationNEM_PPT.pdf
H Outhred & S Thorncraft, 2010, Integrating Non-storable Renewable Energy into the Australian Electricity Industry, p.3. Available from http://www.ceem.unsw.edu.au/content/userDocs/090910REintegrationAust-HICSS43-Accepted.pdf
Resources Energy and Tourism, http://www.ret.gov.au/Documents/mce/rdg/wind/submissions.html accessed 4 Sep 2010
Department of Climate Change and Energy Efficiency, National Greenhouse Account (NGA) Factors, 2010 CE Delft (2008), Handbook on estimation of external costs in the transport sector, February 2008
ABS, 2006 and 2001 Census data
ABS Tourist Accommodation, March 2010
Climate Change in the Border Rivers–Gwydir Catchment, prepared for the New South Wales Government by the CSIRO, 2007 Greenpeace and the European Photovoltaic Industry Association, Solar Generation V – 2008: Solar electricity for over one billion people and two million jobs by 2020, 2008
Access Economics Pty Ltd for the Clean Energy Council, The Economics of Feed-in Tariffs for solar PV in Australia, November 2008 Navigant Consulting for the Solar Energy Research and Education foundation (SEREF), Economic Impacts of Extending Federal Solar Tax Credits, September 2008. Access Economics for the Clean Energy Council, The net employment impacts of climate change policies, June 2009 Moree Plains Shire Growth Management Strategy, Prepared for Moree Plains Shire Council and the Department of Planning by EDGE, September 2009 Tourism Research Australia, Tourism Profiles for Local Government Areas in Regional Australia, New South Wales, Moree Plains Shire, 2007 NSW Aboriginal Employment Action Plan – 2009-2012
Pike Research, Energy Storage on the Grid, August 2010