Embed Size (px)
Citation preview
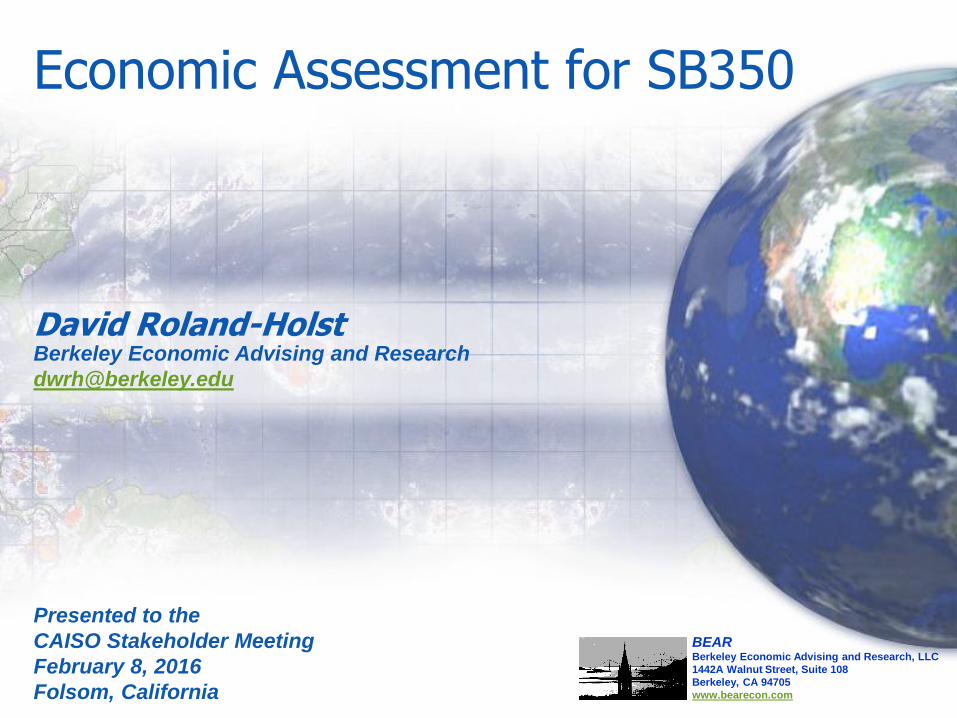
Economic Assessment for SB350
David Roland-HolstBerkeley Economic Advising and Research
Presented to the
CAISO Stakeholder Meeting
February 8, 2016
Folsom, California
BEARBerkeley Economic Advising and Research, LLC
1442A Walnut Street, Suite 108
Berkeley, CA 94705
www.bearecon.com

Roland-Holst 2
SB350 Study Process
Framework
Portfolios
Ratepayer Impact
Economic
Environmental
• You are here
8 February 2016

Roland-Holst 3
Economic Assessment - Contents
• Topics to be Covered– Overview of income and job dynamics
– Model Structure and Inputs
– Assessment Outputs
• Stakeholder Inputs– Data sources and perspectives
– Subjects and issues of emphasis
– Assumptions
• Objective – to promote evidence-based policy dialog
8 February 2016 Preliminary and Confidential
Roland-Holst 4
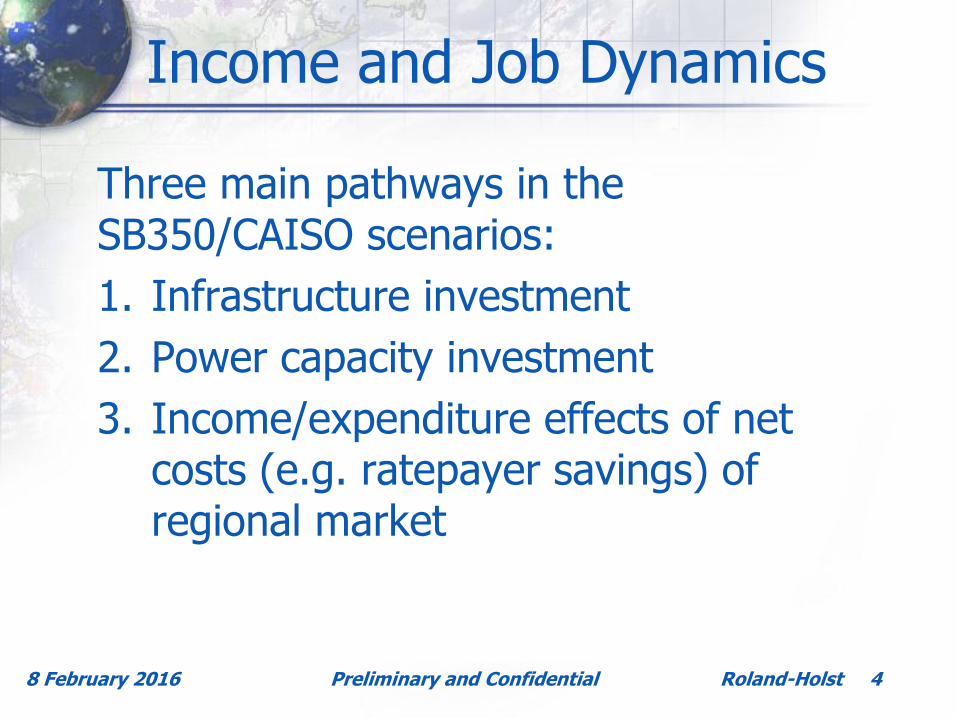
Income and Job Dynamics
Three main pathways in the SB350/CAISO scenarios:
1. Infrastructure investment
2. Power capacity investment
3. Income/expenditure effects of net costs (e.g. ratepayer savings) of regional market
8 February 2016 Preliminary and Confidential
Roland-Holst 5
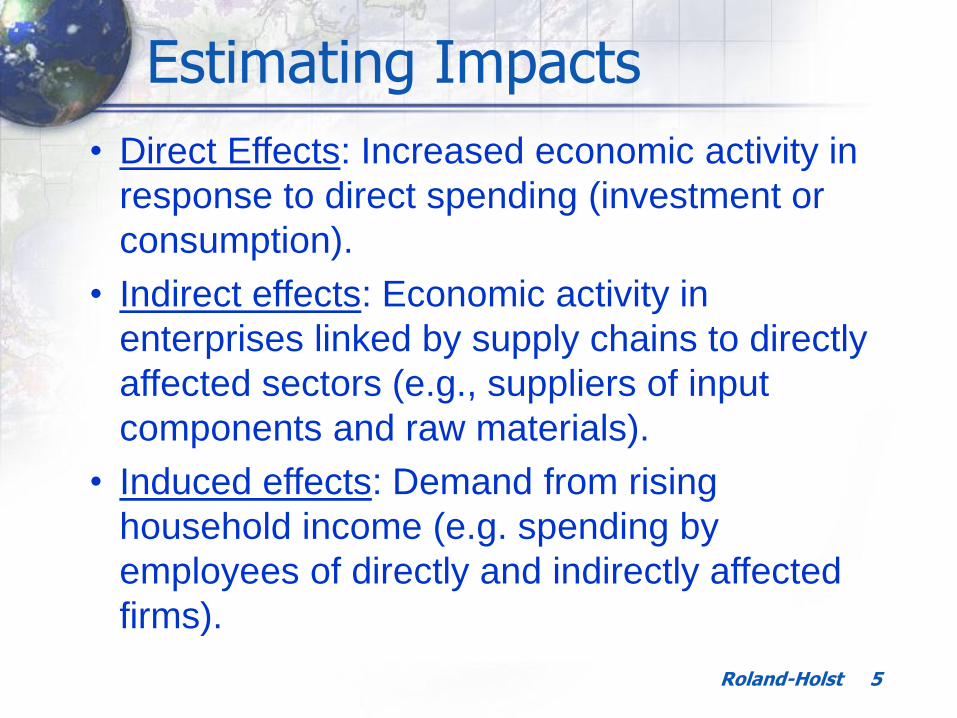
• Direct Effects: Increased economic activity in
response to direct spending (investment or
consumption).
• Indirect effects: Economic activity in
enterprises linked by supply chains to directly
affected sectors (e.g., suppliers of input
components and raw materials).
• Induced effects: Demand from rising
household income (e.g. spending by
employees of directly and indirectly affected
firms).
Estimating Impacts

Roland-Holst 6
A Few Economic Principles
1. Infrastructure investment can create short-term employment.
2. Capacity investment can create short and long term jobs, depending on import content.
3. Expenditure Shifting: Demand funded by energy savings is long term, creates more jobs, more kinds of jobs, and is more likely to be for California goods and services.
4. More affordable energy is pro-poor: Lower income households spend a larger percent of their income on energy services.
8 February 2016 Preliminary and Confidential

Roland-Holst 7
Retail
Priv Services
Construction
Oil&Gas
0.01
0.10
1.00
10.00
100.00
Job
In
tem
sity
(F
TE
/Rev
enu
e)
(lo
ga
rith
mic
sca
le)
California Agriculture, Industry, and Service Sectors
How Energy Savings Create Jobs
8 February 2012
Electric
Power
More jobs/$ Fewer jobs/$
200
Roland-Holst 8
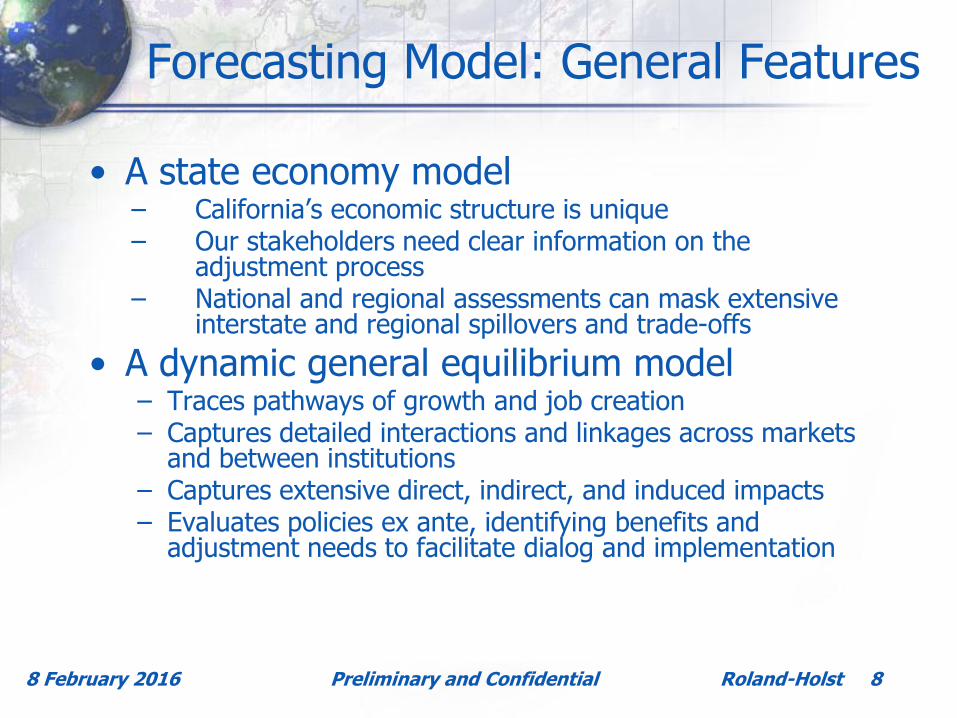
Forecasting Model: General Features
• A state economy model– California’s economic structure is unique– Our stakeholders need clear information on the
adjustment process– National and regional assessments can mask extensive
interstate and regional spillovers and trade-offs
• A dynamic general equilibrium model– Traces pathways of growth and job creation– Captures detailed interactions and linkages across markets
and between institutions– Captures extensive direct, indirect, and induced impacts– Evaluates policies ex ante, identifying benefits and
adjustment needs to facilitate dialog and implementation
8 February 2016 Preliminary and Confidential

Roland-Holst 98 February 2016 Preliminary and Confidential
Economic Assessment Framework
BEAR
Model
Brattle – Data by scenario
Detailed
employment
impacts
Disadvantaged
Community
impacts
IMPLAN
/Census
Statewide
Economic
Impacts
Economywide Structural Data
•Generation by fuel source (GWh) and year
•Net electricity imports (GWh) by fuel source
•In-State fuel costs (for coal, oil, NG, etc.)
•CO2 allowance costs (for coal, oil, NG, etc.)
•O&M costs for generation by source
•Electricity import costs
E3 – Data by scenario
•New generation capacity by fuel
source (MW) and year
•O&M costs and Capital costs for new
construction (by fuel source).
•New in-state transmission costs
•Average in-state retail electricity
prices
Roland-Holst 10
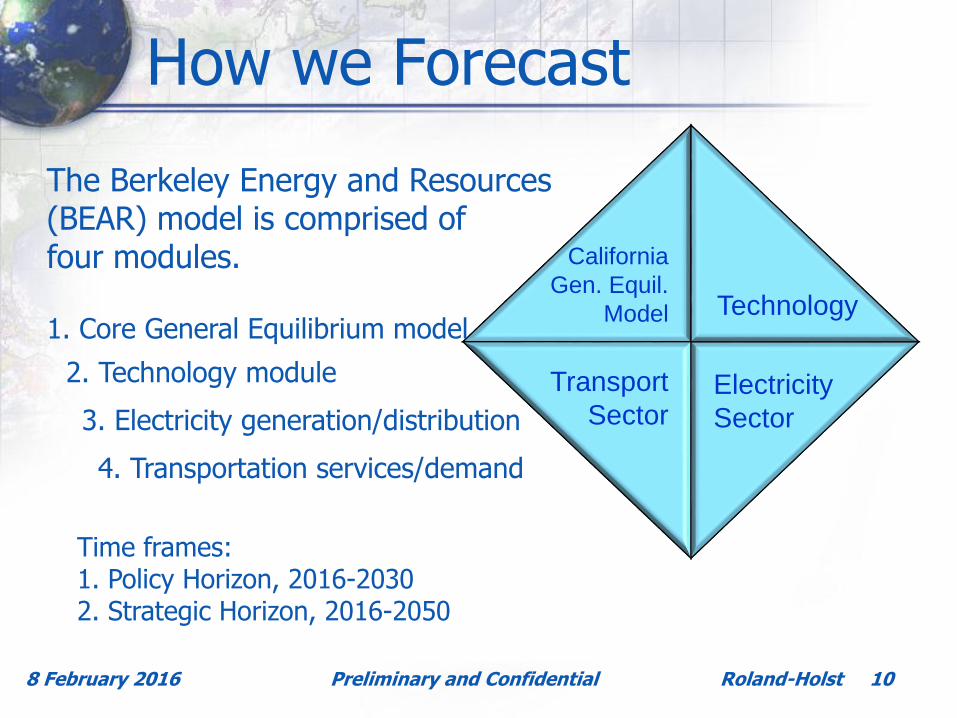
How we Forecast
8 February 2016 Preliminary and Confidential
California
Gen. Equil.
Model
Transport
SectorElectricity
Sector
Technology
The Berkeley Energy and Resources (BEAR) model is comprised of four modules.
1. Core General Equilibrium model
2. Technology module
3. Electricity generation/distribution
4. Transportation services/demand
Time frames:1. Policy Horizon, 2016-20302. Strategic Horizon, 2016-2050
Roland-Holst 11
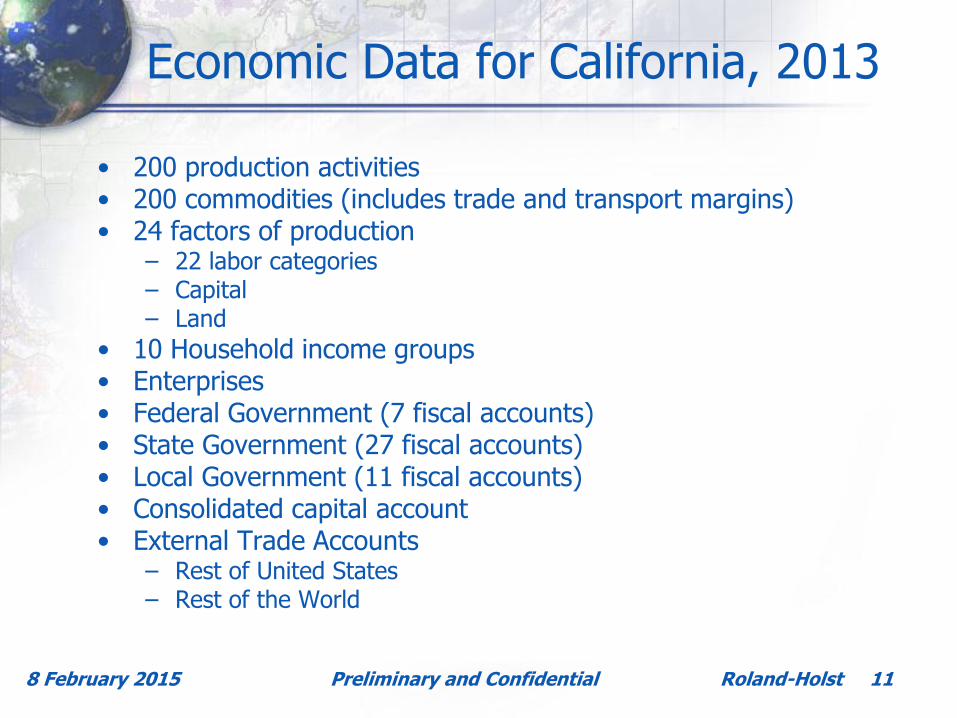
Economic Data for California, 2013
• 200 production activities • 200 commodities (includes trade and transport margins)• 24 factors of production
– 22 labor categories – Capital– Land
• 10 Household income groups• Enterprises• Federal Government (7 fiscal accounts)• State Government (27 fiscal accounts)• Local Government (11 fiscal accounts)• Consolidated capital account• External Trade Accounts
– Rest of United States– Rest of the World
8 February 2015 Preliminary and Confidential
Roland-Holst 12
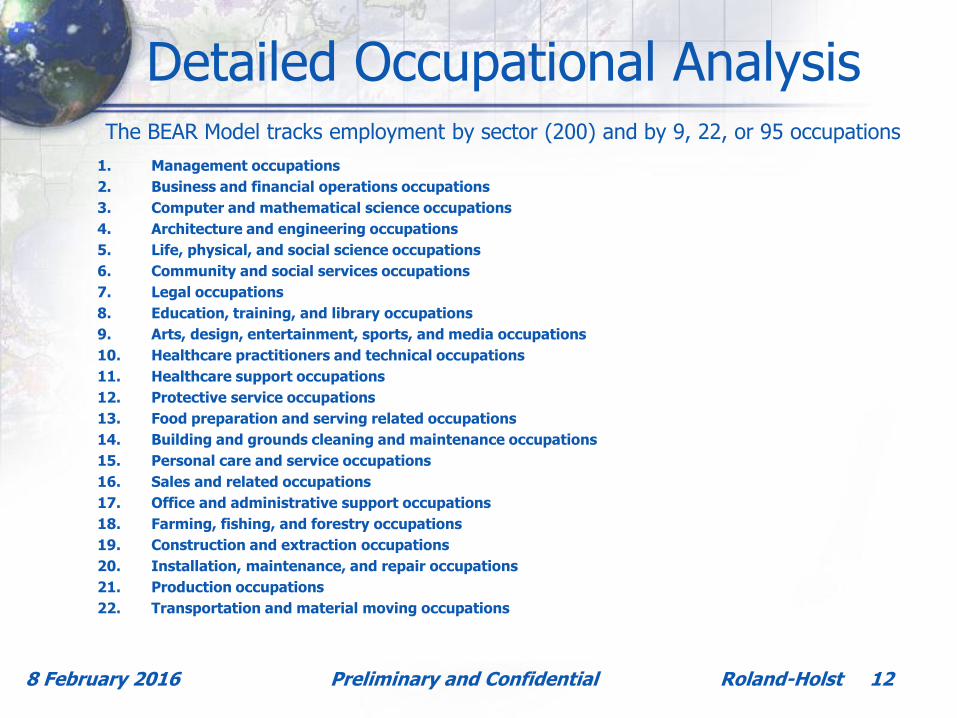
Detailed Occupational Analysis
1. Management occupations
2. Business and financial operations occupations
3. Computer and mathematical science occupations
4. Architecture and engineering occupations
5. Life, physical, and social science occupations
6. Community and social services occupations
7. Legal occupations
8. Education, training, and library occupations
9. Arts, design, entertainment, sports, and media occupations
10. Healthcare practitioners and technical occupations
11. Healthcare support occupations
12. Protective service occupations
13. Food preparation and serving related occupations
14. Building and grounds cleaning and maintenance occupations
15. Personal care and service occupations
16. Sales and related occupations
17. Office and administrative support occupations
18. Farming, fishing, and forestry occupations
19. Construction and extraction occupations
20. Installation, maintenance, and repair occupations
21. Production occupations
22. Transportation and material moving occupations
8 February 2016 Preliminary and Confidential
The BEAR Model tracks employment by sector (200) and by 9, 22, or 95 occupations
Roland-Holst 13
BEAR Macroeconomic Impacts
8 February 2016 Preliminary and Confidential
Category Output
Employment Aggregate
Sector
Households by Income Decile
Labor category (skilled, unskilled)
Gross state product Aggregate
Sector
Personal income Household ratepayer by income decile
Labor category
Enterprise Income Firm ratepayers by sector
State tax revenue Aggregate

Roland-Holst 14
Detailed Livelihoods Impacts
8 February 2016 Preliminary and Confidential
BEAR
Model
IMPLAN
Impacts in Disadvantaged Communities
1 Employment
2 Wages
3 Real Household Incomes
4 Real Household Consumption
5 Household Energy Cost
Roland-Holst 15
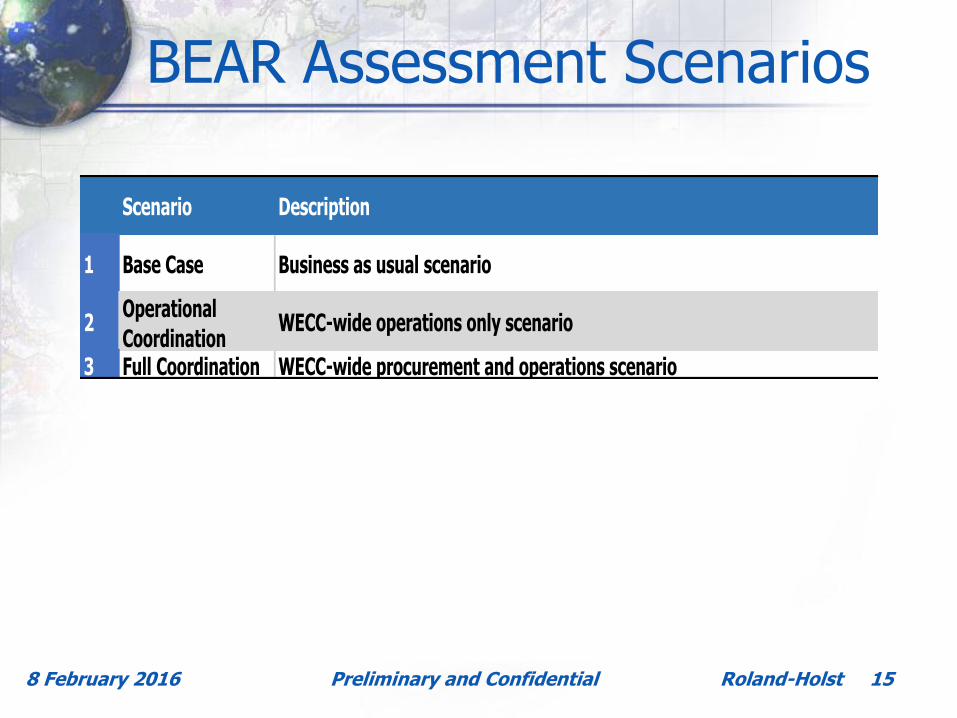
BEAR Assessment Scenarios
8 February 2016 Preliminary and Confidential
Col
um
n1
Column2 Column3
Scenario Description
1 Base Case Business as usual scenario
2Operational
CoordinationWECC-wide operations only scenario
3 Full Coordination WECC-wide procurement and operations scenario
Roland-Holst 16
Economic Assessment - Summary
• Objective – to promote evidence-based energy policy dialog
• Overview of income and job dynamics
• Economic Model, Data, and Scenarios
• Stakeholder Inputs
– Data sources and perspectives
– Subjects and issues of emphasis
– Assumptions
8 February 2016 Preliminary and Confidential

Roland-Holst 17
Discussion
8 February 2016 Preliminary and Confidential