Embed Size (px)
Citation preview
− 1 −
ECONOMIC ASPECTS OF SMOKING IN EUROPE
A European Project from 15 September 2001 – 15 September 2002 Agreement No. SI2.32443 (2001CVG2-008)
Scientific & Financial Final Report
for the period 15 September 2001 − 15 September 2002
This is a project of the European Network For Smoking Prevention
144 Chaussée d'Ixelles 1050 Bruxelles
Supporting organisations:
Catalan Institute of Oncology, Barcelona, Spain (coord) National University of Ireland, Galway, Ireland
"Mario Negri" Institute for Pharmacological Research, Milan, Italy Brunel University, Uxbridge, United Kingdom
Cancer Research UK, United Kingdom Hellenic Cancer Society, Athens, Greece
Porto University Medical School, Porto, Portugal National Institute for Health Promotion, Budapest, Hungary (observer)
Prepared by
Dr. Esteve Fernández Catalan Institute of Oncology, Spain
Project Coordinator
http://www.xtpt.net/econ/econsmk.htm
This project receives financial support from the European Commission in the framework of the Europe Against Cancer Programme
Neither the European Commission nor any person acting on its behalf is liable for any use made of the
information contained in this publication
E U R O P E A N N E T W O R K F O R S M O K I N G P R E V E N T I O N R E S E A U E U R O P E E N P O U R L A P R E V E N T I O N D U T A B A G I S M E

− 2 −
Table of contents 1. Aim of the project........................................................................................................................ 3
2. Executive summary ..................................................................................................................... 4
3. Economics of smoking: an overview .......................................................................................... 7
3.1 Trends in Smoking in Europe ................................................................................................7
3.2 Price and Consumption in Europe..........................................................................................8
3.3 Smoking and income level/socio-economic group ................................................................8
3.4 How addiction affects the response to higher prices............................................................10
3.5 The potential impact of tax increases on demand for tobacco .............................................10
4. Project implementation.............................................................................................................. 12
4.1 Tasks and phases of the research project: ............................................................................12
5. Summary of results.................................................................................................................... 13
5.1 European cross-sectional analysis of price elasticity ...........................................................13
5.2 National time-series analyses of price elasticity ..................................................................19
5.2.1 United Kingdom............................................................................................................ 21
5.2.2 Italy ............................................................................................................................... 25
5.2.3 Portugal ......................................................................................................................... 28
5.2.4 Greece ........................................................................................................................... 31
5.2.5 Ireland ........................................................................................................................... 33
5.2.6 Spain.............................................................................................................................. 36
5.3 Summary of results and discussion ......................................................................................43
5.4 Dissemination of results.......................................................................................................44
6. Conclusions ............................................................................................................................... 46
7. Project partners.......................................................................................................................... 47
8. Financial report.......................................................................................................................... 49
9. Glossary..................................................................................................................................... 49
10. Annex ...................................................................................................................................... 51

− 3 −
1. Aim of the project
The aim of the project was for a team of researchers from countries across the European
Union to work collaboratively –to collect data, to assess trends and to develop
econometric models to evaluate the impact of price, income and other economic and
tobacco control factors on cigarette consumption and prevalence across Europe.
We see economic issues as central to tobacco use. Economic considerations drive the
supply of tobacco products while prices, taxes and advertising modify demand.
Externalities related to extra health care, premature mortality and fires may be borne by
others members of society or members of other societies. Trade agreements or
restrictions, tax harmonisation or variations in interstate tax rates, affect levels of tobacco
use. These issues all impinge positively or negatively on tobacco use and related disease
and mortality across the continent and the aim of this study is to quantify some of these
effects to inform policy. Cigarette prices and consumption across Europe vary both
absolutely and relative to per capita incomes; even when prices are standardised for cost
of living, the range of price is four-fold. Tobacco price and taxation are likely to have
different effects on different income and socio-economic groups. Those on low income
tend to smoke more, but reduce their smoking more in response to tax increases.
Conversely, they are more likely to be encouraged to smoke by a reduction in the real
price. A cross-sectional study of smoking and price in Europe from the project's co-
leader, reported in 1988 a price elasticity of demand for cigarettes in Europe of –0.4 and
an income elasticity of demand of 0.5.
The study will re-estimate these cross Europe elasticities in the light of current changes
and carry out analyses for the individual countries involved in the project.
− 4 −
2. Executive summary • Each national team has collected data on the trends in tobacco consumption, smoking
prevalence, and prices in each country.
• Each national team has made a summary overview of the most recent data on tobacco
consumption and smoking prevalence, economic aspects, policy aspects, and
available trends in each country.
• At the first project meeting, participants presented the main characteristics of the
tobacco epidemic and the current situation of policy control, advertising bans,
tobacco consumption, smuggling, and prices in their country. The participants
discussed in-depth the analysis to be conducted. It was agreed that this would include
1) a “cross-sectional” analysis on price and income elasticity (consumption as
predicted variable), including as many European countries as possible (EU and
accession countries). This type of analysis uses data for different countries for a given
year in the same model; and 2) a “national analysis” (within each country) of the
relationship between price and consumption/prevalence, to assess price and income
elasticity in each country.
• Elasticity is the standard economic measure of response to change in an economic
variable −price or income in this study−, and is defined as the percentage change in
quantity consumed or bought −cigarette consumption and prevalence of smoking in
this study− for a 1% change in these variables.
• At the second project meeting, the results of the cross-sectional analysis and the
national elasticity analyses were presented and discussed.
• Results from the cross-sectional analysis. This study included 17 Western European
countries, excluding, some European former Socialist Economies States for lack of
reliable data. This model explains cigarette consumption per adult in Europe in terms
of price (foreign or most popular cigarette price adjusted for Gross Domestic
Product), women's smoking level (smoking prevalence in females was included to
adjust the data for the wide variation across Europe in the ratio between the
prevalence of smoking by men and by women), and legislation pressure (proxied by a
− 5 −
variable generated from the available information as low/intermediate/high according
to the different laws and policies on tobacco control in each country). The most
effective model included both price and correction for female prevalence, and
explained 60% of the variation in cigarette consumption per head between countries.
Price was therefore shown to have a significant effect on a country’s per capita
cigarette consumption. The cross country price elasticity at −0.67 (p<0.001) is higher
than that reported in the previous analysis with 22 European countries. So that on
average across the European countries considered, smoking consumption decreased
6.7% for a 10% increase in the real price of cigarettes. It is at the higher range of
estimates in the literature based on national elasticity analysis (mainly ranging
between -0.35 and -0.79). The coefficient for smoking among females is 0.55
(p<0.05) indicating the expected positive adjustment for female smoking to explain a
country’s per capita consumption. No effect of tobacco control legislation was
identified by the model including the dummy variables for legislation. It was not
possible to make allowance for smuggling in the cross sectional analysis, as data was
not available and this may have inflated the estimate of price elasticity.
• Results from the national analyses. Changes in cigarette price had an appreciable
impact on smoking consumption in several countries. Price elasticity of demand for
cigarettes in the United Kingdom over the period 1972-2000 was −0.36 (–0.43 for
women and −0.27 for men; statistically significant at p<0.05). Price elasticities of
demand for cigarettes in Italy over the period 1970-2001 were –0.30 for prevalence
and -0.43 for cigarette consumption (p<0.05). Price elasticity in Spain over the period
1965-1995 was –0.32 (p<0.05) and −0.66 (p<0.05) for prevalence (blond tobacco
price) among males and females. Price elasticity in Portugal over the period 1980-
2000 was –0.29 and −0.13 for cigarette consumption of national and foreign brands,
respectively. Price elasticity in Greece over the period 1987-1998 was –0.27 for
cigarette consumption. Price elasticity in Ireland over the period 1989-1999 was –
0.14 for cigarette consumption. Price elasticities in Portugal, Greece, and Ireland
were not significant mainly due to the shortage of relevant data.
• Conclusions. The estimated price elasticities of demand for cigarettes in each of the
participant countries ranged from –0.13 to –0.70 for cigarette consumption per capita

− 6 −
or for prevalence. The results from the cross-sectional analysis indicate a high price
elasticity of cigarette consumption. Differences in estimates may be attributed partly
to the existing differences in the time period studied and the availability (and quality)
of the data. Although a coordinated effort was made to conduct similar analyses in
each country, the scarce or variable availability of smoking data (particularly for
Ireland, Greece, and Portugal) including lack of information on smuggling, to some
degree limits the comparability of the results obtained.
• The present analyses however, consistently confirm the inverse association between
price and prevalence/consumption of cigarettes in Europe. European coordinated
effort to increase prices may therefore have important public health implications for
tobacco control.
• There is a need to co-ordinate collection and presentation of data on cigarette
consumption, including estimates of smuggled cigarettes, to allow improved
monitoring and evaluation of economic trends and influences, and to help contain the
problem of smuggling and to inform policy.
− 7 −
3. Economics of smoking: an overview
Economics and tobacco are inextricably linked. Economic considerations drive the
supply of tobacco products while prices, taxes and advertising modify demand.
Externalities related to extra health care, premature mortality and fires may be borne by
others members of society or members of other societies. Trade agreements or
restrictions, tax harmonisation or variations in interstate tax rates affect levels of tobacco
use. These issues all impinge positively or negatively on tobacco use and related disease
and mortality across the continent. In Europe approximately 30% of adults smoke
regularly and some 1.3 million deaths per year are caused by smoking, losing 20 years of
life each on average. Deaths from smoking are highest in Eastern Europe and at current
rates 20% of all deaths in 2020 will be from smoking. Some 550 000 people in the
European Union die from their smoking habit1.
3.1 Trends in Smoking in Europe
It would be wrong to think that smoking is decreasing in Europe. In fact cigarettes
consumed per person each year has been static or slightly rising over recent years, rising
particularly in Portugal, Greece, Russia, Czech Republic, Croatia and Slovakia. Wide
variations still exist between European countries from some 1.5 cigarettes per day per
head of population in Sweden to 10 per day per head of population in Greece. Despite
attempts to harmonise tobacco tax rates across Europe there are still wide differences – a
four fold difference in price and tax between Spain and UK.
As smoking levels vary widely across the continent, so too do tobacco related disease
rates, such as lung cancer mortality rates. Over the last decade female lung cancer rates
have risen in almost all countries, and while male lung cancer rates have fallen in some
countries they are still rising in others and in some cases such as in Spain and Portugal,
Greece, Italy and France rising rapidly.
1 WHO Europe. The European report on tobacco control policy. Copenhagen: WHO; 2002.
− 8 −
3.2 Price and Consumption in Europe
Cigarette prices and consumption vary absolutely and relative to per capita incomes. If
prices are standardised for cost of living, the range narrows to four-fold. A cross-
sectional study of smoking and price in 27 European countries (including all EU
countries) reported a price elasticity of demand for cigarettes in Europe of –0.4 and an
income elasticity of demand of 0.5 2. This means that cigarette consumption will rise with
incomes unless there are counter policies.
3.3 Smoking and income level/socio-economic group
Although in high income countries, those on high incomes were initially more likely to
smoke, this reversed in many countries particularly after the health risks were published
and made known in the 1960s and 1970s. For example in Norway smoking among high
income men fell from 75% to 28% between 1955 and 1990, while for low income men it
fell from 60% to 48% over the same period. In the UK there was little difference in
smoking by income or socio-economic group in 1960, but by 2000 only 14% women and
17% of men in the highest socio-economic group smoked, compared with 35% women
and 40% men in the lowest socio-economic group. The prevalence of smoking among
women has been lower in southern Europe than in northern Europe, with a wider gender
and socio-economic gap compared to most other developed countries. Deaths from
smoking related diseases including lung cancer and coronary heart disease have diverged
rapidly between income groups reflecting these differences in smoking prevalence trends.
It is apparent from UK government data that smoking increased during periods when the
price of cigarettes fell in real terms, during the early 1970s and late 1980s, and fell when
real cigarette prices rose in the mid 1970s and during the early 1980s and 1990s. Similar
counter movements of smoking with relative cigarette price have been shown now for
many countries including France, Canada, South Africa, Turkey, and China.
2 Townsend J. Tobacco proce and the smoking epidemic. Smoke-free Europe: 9. Geneve: WHO; 1988.
− 9 −
People in low income countries are likely to respond more to cigarette price rises than are
people in high income countries3. As well as the income effect, the age structure of most
low income countries’ populations is generally younger and research from the high
income countries suggest that, on the whole, young people are more price responsive than
older people4,5. This is partly because they have lower disposable incomes, partly
because some may, as yet, be less heavily addicted to nicotine, partly because of their
more ‘present oriented’ behaviour, and partly because they are more susceptible to peer
influences. Thus if one young person stops smoking because he or she can no longer
afford to, friends are also more likely to quit.
Similarly tobacco price and taxation are likely to have different effects on different
income and socio-economic groups5. Low income groups tend to smoke more, but reduce
their smoking more in response to tax increases. Conversely, they are more likely to be
encouraged to smoke by a reduction in the real price. A UK analysis of cigarette
consumption reported that men and women in the highest socio-economic groups did not
respond to changes in cigarette price. Adults in socio-economic groups 3 and 4 (clerical
workers, skilled and semi-skilled manual workers) responded in the middle range with a
price elasticity of about –0.5 to –0.7. Unskilled manual workers and their wives (socio-
economic group 5) showed the highest response with elasticities of –1.0 for men and –0.6
for women2. There has been much debate about whether cigarette price affects the
prevalence of smoking as well as the average adult consumption. This UK analysis
reported significant elasticities of prevalence of –0.6 for men in socio-economic group 5
(unskilled manual workers), -0.23 for all women and –0.5 for women in socio-economic
group 5. These are important results as socio-economic group 5 is the groups for whom
health education has been least effective.
Other authors have also reported significantly different responses to tobacco price in UK
households with different incomes and by factors related to socio-economic group, such
as house ownership. There has been little work on smoking by income and socio- 3 Prabha J, Chaloupka FJ. Curbing the epidemic: governments and the economics of tabacco control. Washington: The World Bank; 1999. 4 Chaloupka FJ. Macro-social influences: the effect of prices and tobacco-control policies on the demand for tobacco products. Nic Tob Res 1999;1: S105-S109.
− 10 −
economic group for other countries, and it is important that relevant data are collected, so
that the impact of price changes may be more fully understood.
3.4 How addiction affects the response to higher prices
Nicotine addiction is a powerful element in the demand for tobacco. Models that attempt
to assess the impact of nicotine addiction on the effects of price increases make varying
assumptions about whether smokers look ahead at the consequences of their actions or
not. However, all addiction models agree that, for an addictive substance such as
nicotine, an individual’s current consumption levels will be determined by his or her past
consumption levels as well as by the current price of the goods. This relationship
between past consumption and current consumption has important implications for
modelling the impact of price rises on demand for tobacco. If smokers are addicted, they
may respond relatively slowly to price increases, but their response may be greater in the
long term. The economics literature suggests that a real and permanent price increase will
have approximately twice the impact on demand in the long run as in the short run.
3.5 The potential impact of tax increases on demand for tobacco
Researchers have modelled the potential impact of a range of tax increases on demand for
cigarettes world-wide for a report to the World Bank3. The assumptions on which the
model was based, concerning price elasticity, health impact, and other variables were
highly conservative, and so the results are likely to underestimate the potential. The
model revealed that even modest price increases could have a striking impact on the
prevalence of smoking and on the number of tobacco related premature deaths among
those alive in 1995. It is calculated that a 10% increase over the average estimated price
in each region, 40 million people world-wide would quit smoking, and many more who
would otherwise have taken up smoking would be deterred from doing so3. Given that
5 Townsend J, Roderick P, Cooper J. Cigarette smoking by socioeconomic group, sex, and age: effects of price, income, and health publicity. BMJ 1994; 309: 923-927

− 11 −
not all quitters would avoid death, the number of premature deaths avoided is still
extraordinary by any standards – 10 million, or 3% of all tobacco related deaths –from
this price increase alone.

− 12 −
4. Project implementation
The project has been led by Prof. E. Fernandez from Barcelona (Spain), and Prof. J.
Townsend from London (UK), in collaboration with Prof. C. Kelleher from Galway, Eire;
Dr. N. Kordiolis from Greece; Prof. C. La Vecchia from Italy; Prof. H. Barros from
Portugal and their respective national research teams. Dr. T. Demjén from Hungary was
included as an observer (no EC funding for the project) and participated in the e-mail
discussions.
All members of the research team have provided data, not always available from official
sources. These include data on prices, prevalence and consumption where possible by
age, sex and income or socio-economic group and morbidity rates, not otherwise
available. A working data file was compiled of official data from EU and WHO statistical
sources together with the data provided by the national research teams. A literature search
was undertaken of recent economic studies of cigarette consumption in the collaborating
countries of Europe and others and members of the research team contributed relevant
reports.
4.1 Tasks and phases of the research project:
1. Initial planning of the project by the research leaders by telephone and frequent e-
mail communication between them and the national leaders. Aim: to plan, prepare
and co-ordinate the stages of the project. Preparation of the first meeting in
Barcelona. Dates: September 2001-January 2002.
2. First meeting of the research collaborators in Barcelona (February 2002). Aim: to
present the current smoking trends and economic aspects in each country, to
standardise procedures, to review the data collection, the literature, review the
planned analysis and discuss further data collection (see annex I “smoking highlights
in each participating country” and annex II “minutes of the first meeting”)
3. Second meeting of the research collaborators in Barcelona (July 2002) Aim: to
present and to review the results of the study (cross-sectional and national analyses),
− 13 −
to discuss the dissemination of results, drafting of papers and final scientific and
financial reports (see annex III “minutes of the second meeting”)
5. Summary of results
5.1 European cross-sectional analysis of price elasticity
The aim of this part of the analysis was to explain the variation in the consumption of
cigarettes across Europe. The variables included in the analysis are price of cigarettes and
income (Gross Domestic Product per capita). We also took into account another
important cigarette-smoking variable between the countries, namely the level of smoking
among women within each country, measured as the prevalence of their smoking. Thus,
the objective of this part of the project was to analyse price and income elasticity of
demand across as many European countries as possible including mainly EU and
accession countries. Elasticity is the standard economic measure of response to change in
an economic variable −price or income in this study−, and is defined as the percentage
change in quantity consumed or bought −cigarette consumption in this study− for a 1%
change in these variables.
Data collection and statistical methods.
We have used a variety of different sources of data to compile as much information as
possible, and corresponding to as many countries as possible. The main sources of
information have been the “Tobacco Control Country Profiles”1 (TCCP) compiled by the
World Health Organization (WHO) and the American Cancer Society (ACS), the
“Tobacco or Health: A Global Status Report Country Profiles by Region, 1997” from the
WHO Tobacco or Health Programme2. In addition, we have used other sources such as
the website from the Organisation for Economic Cooperation and Development3 or the
CDC’s National Tobacco Information Online System (NATIONS)4, as well as other
1 Corrao MA, Guindon GE, Sharma N, Shokoohe DF (eds). Tobacco Country Profiles, American Cancer Society, Atlanta, GA, 2000. URL: http://www5.who.int/tobacco/page.cfm?sid=57 2 Available at http://www.cdc.gov/tobacco/who/whofirst.htm 3 http://www.oecd.org/std/ppp2.pdf 4 http://apps.nccd.cdc.gov/nations/index.asp
− 14 −
websites to find out ad hoc information from specific countries not available from the
above mentioned sources (ie., web sites from ministries of health, ministries of finance or
universities from specific countries).
The “Tobacco Control Country Profiles” includes socio-demographic information, data
on smoking prevalence, and data on the tobacco economy, including annual per capita
and total cigarette consumption from different checked and verified sources. Data on
tobacco production, trade, and tobacco control measures (legislation) was obtained
mainly from the WHO “Tobacco or Health” website.
We collected data on Annual per capita cigarette consumption for the year 1995,
considering 1 cigarette stick as 1 gram in weight; the smoking prevalence (males,
females) for the years 1995 to 1999, as the proportion (%) of the population >15 years
who are smokers of any type of tobacco product, the price (retail price) of 20 cigarettes
with tax in in 1995 ($US) for most popualr domestic and foreign brand; the Gross
Domestic Product (GDP) of each country in 1995 ($US), the Purchaising Power Parities
(PPP), and the population >15 years of each country (1995). We therefore derived the
price of cigarettes adjusted for GDP-PPP. We also derived a dummy variable
representing the legislation for tobacco control in each country (low/intermediate/high).
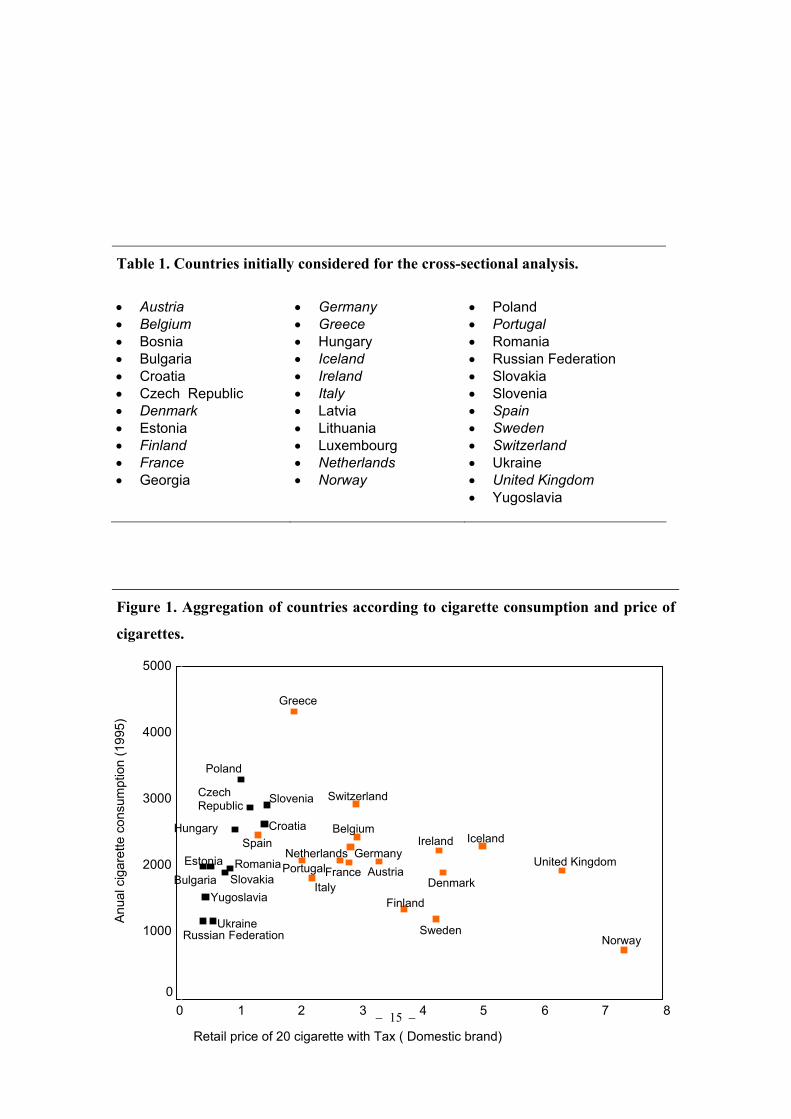
Initially, we tried to include as many European countries as possible, and we collected the
information for the 33 countries represented in Table 1 and Figure 1. In the preliminary
analysis, a variable pattern was apparent in the relationship between cigarette
consumption and price of cigarettes as shown in Figure 1; western European countries,
including EU countries, show a different pattern of price and consumption than do the
former Socialist and East European countries. Thus, we decided to restrict the analysis to
the 17 Western and European Union countries for which there was near complete
information (in italics in Table 1).
− 15 −
Table 1. Countries initially considered for the cross-sectional analysis.
• Austria • Belgium • Bosnia • Bulgaria • Croatia • Czech Republic • Denmark • Estonia • Finland • France • Georgia
• Germany • Greece • Hungary • Iceland • Ireland • Italy • Latvia • Lithuania • Luxembourg • Netherlands • Norway
• Poland • Portugal • Romania • Russian Federation • Slovakia • Slovenia • Spain • Sweden • Switzerland • Ukraine • United Kingdom • Yugoslavia
Figure 1. Aggregation of countries according to cigarette consumption and price of
cigarettes.
Retail price of 20 cigarette with Tax ( Domestic brand)
87 65432 10
Anua
l cig
aret
te c
onsu
mpt
ion
(199
5)
5000
4000
3000
2000
1000
0
Yugoslavia
United Kingdom
Ukraine
Switzerland
Sweden
Spain
Slovenia
Slovakia
Russian Federation
Romania Portugal
Poland
Norway
Netherlands
Italy
Ireland IcelandHungary
Greece
GermanyFrance
Finland
Estonia
Denmark
Czech Republic
Croatia
Bulgaria
Belgium
Austria
− 16 −
We fitted a model to explain cigarette consumption per adult in the European countries in
terms of price in each country adjusted for GDP-PPP per capita, women’s smoking levels
(prevalence of smoking among women), and a legislation pressure (proxied by the
dummy variable). From previous research, it is known that these influences are likely to
have a proportional effect on cigarette consumption and hence a logarithmic model was
used:
Ln CigConsi = α + β1ln Pricei + β2 ln FPrevali + β3 ln Legisli + εi
Where CigConsi is annual cigarette consumption for country i, Pricei is price of 20
cigarettes in US$ (adjusted for GDP-PPP) in country i, FPrevali is the prevalence
(proportion) of smoking among adult (>15 years) females, Legisli the dummy variables
indicating the degree of antismoking legislation, , and εi is a random error term
(consumption not explained by the other variables). From this model, β1is the price
elasticity (constant to be estimated), β2 is the effect of women’s smoking (constant to be
estimated), β3 is the effect of legislation (constant to be estimated), and α is a constant
consumption unrelated to the variables.
Results and discussion.
We explored the effect of inclusion of other explanatory variables of cigarette
consumption, including the proportion of persons employed in the tobacco industry in
each country and the Gross Domestic Product (GDP) itself. We finally adjusted the price
− 17 −
by GDP (GDP adjusted by PPP), in order to reflect the effect of affordability of cigarettes
in each country.
We fitted nested models by introducing the independent variables, in order to evaluate the
fit of the model, the variation in cigarette consumption between the 17 European
countries considered (Figure 2), and the estimation of the parameters (price elasticity).
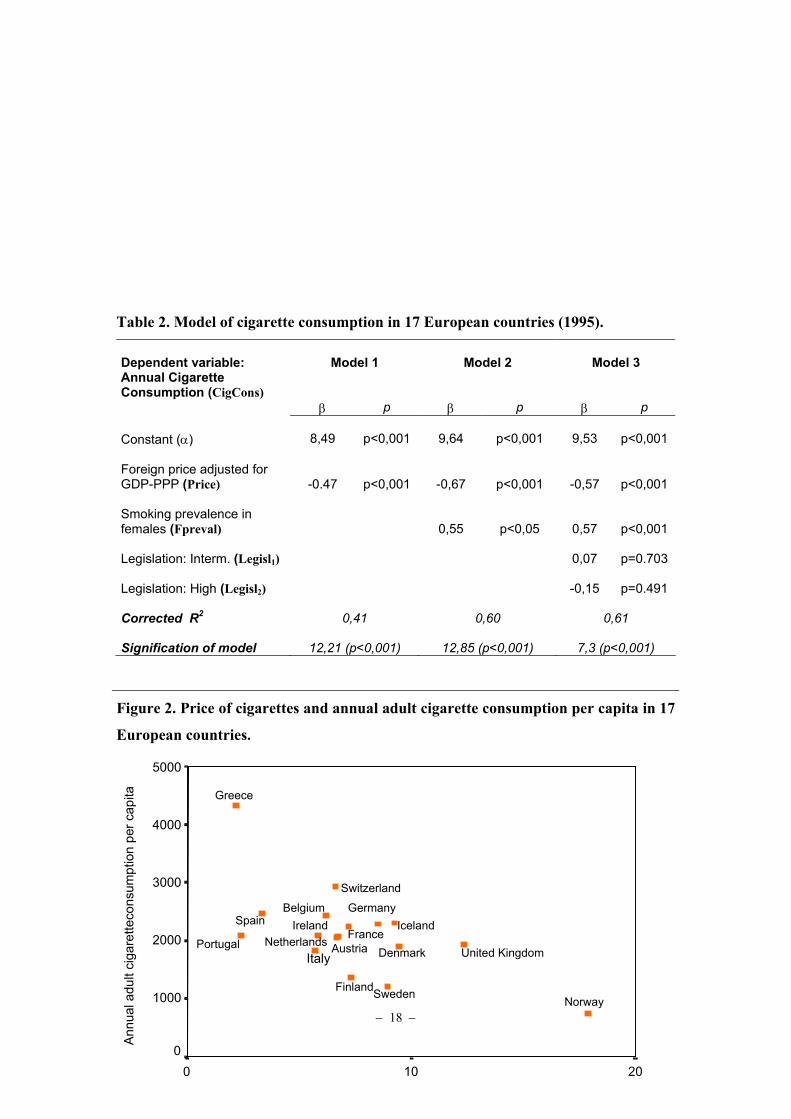
Table 2 shows the results of the three models fitted. Model 1 (with only price as
explanatory variable) explained only 41% of the variation in annual cigarette
consumption per capita, models 2 and 3 which included female smoking prevalence and
the effect of legislation explained 60% of cigarette consumption. Since the effect of level
of legislation was low (−0.15, i.e. those countries with ”high” pressure will decrease by
0.15% the consumption of cigarettes) and statistically non significant, we select model 2.
We checked the selected model in terms of error specification, normality,
homoscedasticity, multicolinearity, and self-correlation.
From model 2 (significant at 1%), we estimated that the price elasticity of demand for
cigarettes in Europe is −0.67 (significant at 1%), so that on average across the European
countries considered, smoking consumption decreased 6.7% for a 10% increase in the
real price of cigarettes. The adjustment coefficient for smoking among females was 0.55
(p<0.05). No clear effect of legislation was observed in model 3 including the dummy
variables.
Although price elasticities are mostly estimated for individual countries, from time series
data as prices do not usually vary across countries with the exception of states in the US,
this can also be estimated from cross-sectional data at one period of time from different
countries (or other units of analysis) assuming there are similar responses to price
changes between them. The estimate of price elasticities for the 17 countries analysed, is
not significantly different from the mean price elasticities estimated over time for the
individual countries and reported in the latter part of this report. Data for most countries
excluded the effects of smuggling, which is thought to be high in several of the countries
included in the analysis, and this may have biased the results.
− 18 −
Table 2. Model of cigarette consumption in 17 European countries (1995). Dependent variable: Annual Cigarette Consumption (CigCons)
Model 1
Model 2
Model 3
β p β p β p Constant (α)
8,49
p<0,001
9,64
p<0,001
9,53
p<0,001
Foreign price adjusted for GDP-PPP (Price)
-0.47
p<0,001
-0,67
p<0,001
-0,57
p<0,001 Smoking prevalence in females (Fpreval)
0,55
p<0,05
0,57
p<0,001 Legislation: Interm. (Legisl1)
0,07
p=0.703
Legislation: High (Legisl2)
-0,15
p=0.491
Corrected R2
0,41
0,60
0,61
Signification of model
12,21 (p<0,001)
12,85 (p<0,001)
7,3 (p<0,001)
Figure 2. Price of cigarettes and annual adult cigarette consumption per capita in 17
European countries.
20 100
5000
4000
3000
2000
1000
0
United Kingdom
Switzerland
Sweden
Spain Portugal
Norway
NetherlandsItaly
Ireland Iceland
Greece
Germany
France
Finland
Denmark
Belgium
Austria
Annu
al a
dult
ciga
rette
cons
umpt
ion
per c
apita
− 19 −
5.2 National time-series analyses of price elasticity
In Europe there is a wide divergence in price levels and habits of smoking. While the
main aim of this EU study was to investigate the role of economic variables in smoking
across the continent, individual country studies were also carried out to see how variation
in economic variables over time affected smoking in each country. In this part of the
project we aimed to explain the variation in the consumption of cigarettes (from legal
sales or surveys) or in the prevalence of smoking (from health surveys) according to the
price of cigarettes and income in each of the participating countries. This means that each
national team was in charge of obtaining the necessary data within each country and as
far as possible standardised methods agreed at the planning meetings and in active
electronic correspondence between the participants.
It is well know that the price of cigarettes is a determinant of tobacco consumption, and
changes in cigarette price have had an appreciable impact on smoking prevalence in some
countries5,6. Since there has been no such research for most European countries, we
decided to conduct a coordinated research in the UK, Spain, Italy, Portugal, Greece, and
Ireland to assess effects of price of cigarette on tobacco consumption in the last decades.
In this report we present the most relevant results from each of these countries where the
analysis has been conducted. More informnation on the historical development and
current status of the tobacco epidemic in each of the participating countries can be found 5 Townsend J, Roderick P, Cooper J. Cigarette smoking by socioeconomic group, sex, and age: effects of price, income, and health publicity. BMJ 1994; 309: 923-927 6 Hu TW, Ren QF, Keeler TE, Barlett J. The demand for cigarettes in California and behavioural risk factors. Health Econ 1995;4:7-14.
− 20 −
in Annex I. Although we devoted considerable effort to harmonizing the methodology to
obtain comparable results, this was limited by the different levels of completeness of the
data available in each country. This refers to the time period considered in each country
(ie. 1972-2000 for the UK, 1965-1995 for Spain, 1980-2000 for Portugal, etc) and the
type of data in each country (ie, while biennial data on smoking prevalence is available in
the UK for the entire study period, only 12 health surveys were conducted in Italy or 4 in
Spain).
In general terms, we have used multiple regression analysis to examine how price and
income influenced smoking patterns. We used a single equation model, under the
assumption that the consumption (demand) function is log-linear, following the
methodology used by Townsend et al.7 in order to obtain price elasticities of demand for
cigarettes (i.e., percentage change in cigarette consumption for a 1% change in price):
log qt = (α) + (β) log Yt + (γ) log Pt + εi [t=year]
Where qt denotes average cigarette consumption per adult per day for year t, Pt denotes
real price of cigarettes in year t, Yt denotes annual per capita gross domestic product, and
and εi is a random error term (consumption not explained by the other variables). The
coefficients (β) and (γ) give the income and price elasticities of demand. Elasticity is the
standard economic measure of response to change in an economic variable −price or
income in this study−, and is defined as the percentage change in quantity consumed or
bought −cigarette consumption and prevalence of smoking in this study− for a 1% change
in these variables.
When possible, the same model was considered to evaluate how smoking prevalence (for
the years in which prevalence was available) was influenced by price and income.
According to the availability of data, expanded models were fitted when possible (i.e.,
including data on smuggling or health publicity) and by sex or socioeconomic groups.
7 Townsend J, Roderick P, Cooper J. Cigarette smoking by socioeconomic group, sex, and age: effects of price, income, and health publicity. BMJ 1994; 309: 923-927
− 21 −
5.2.1 United Kingdom
Two different data sets of cigarette consumption have been used in the analysis. The UK
General Household survey provides biennial data from 1972, on prevalence of smoking,
defined as the proportion of adults answering, 'yes' to the question, 'do you smoke at all
nowadays'. It gives numbers of cigarettes smoked per smoker since 1972 by gender, age
and socioeconomic group. Prevalence and level of smoking per smoker, have been
combined in our analysis to give average consumption per adult in each group. There is
thought to be under reporting of cigarette smoking in this survey but this may not be a
serious problem for analysis as long as it does not vary systematically over time.
Importantly, as this is a consumer survey, the data are likely to include consumption of
both legally purchased and smuggled cigarettes. The other major data source is from
customs and excise data, based on UK tobacco released for consumption. These data are
published annually as part of consumers' expenditure in the National Accounts, are priced
and the unevenness of the series smoothed, as tobacco released for sale is not necessarily
for immediate consumption but may be released some time ahead of consumption for
commercial reasons.
We used multiple regression analysis as discussed above to examine how smoking
patterns of each group were influenced by price, income, a trend factor to represent the
net effects of health publicity, and other social trends including social acceptability and
restrictions in workplace and public places. We also included a variable to represent the
level of smuggling since 1994 (smuggling of cigarettes into the UK was low before
1994). A detailed description of the methods and data used is available in Annex IV.
The very high rates of cigarette smoking during the mid half of the twentieth century
resulted in the United Kingdom having the highest rates of smoking related disease in the
world. However in the years since the risks first became known, there has been very
substantial reduction in smoking in the UK. For example, between 1962 and 2000
prevalence of cigarette smoking fell from 57% for men and 42% for women to 29% for
men and 25% for women. The average weekly consumption halved between 1972 and the
year 2000 from 65 to 32 cigarettes per week for men and from 42 to 22 for women. In all
socio-economic groups, both prevalence and consumption of smoking decreased over this
− 22 −
time, although to varying degrees. Whereas 29% of men and 25% of women in socio-
economic group I (professional workers) smoked in 1974 compared with 61% of men
and 43% of women in socio-economic group V (unskilled manual workers), by the year
2000 the respective smoking rates had fallen to 17% for men and 14% for women in
socio-economic group I and 39% for men but 35% for women in socio-economic group
V, showing less reduction by lower SEG women (further data are available in Annex IV).
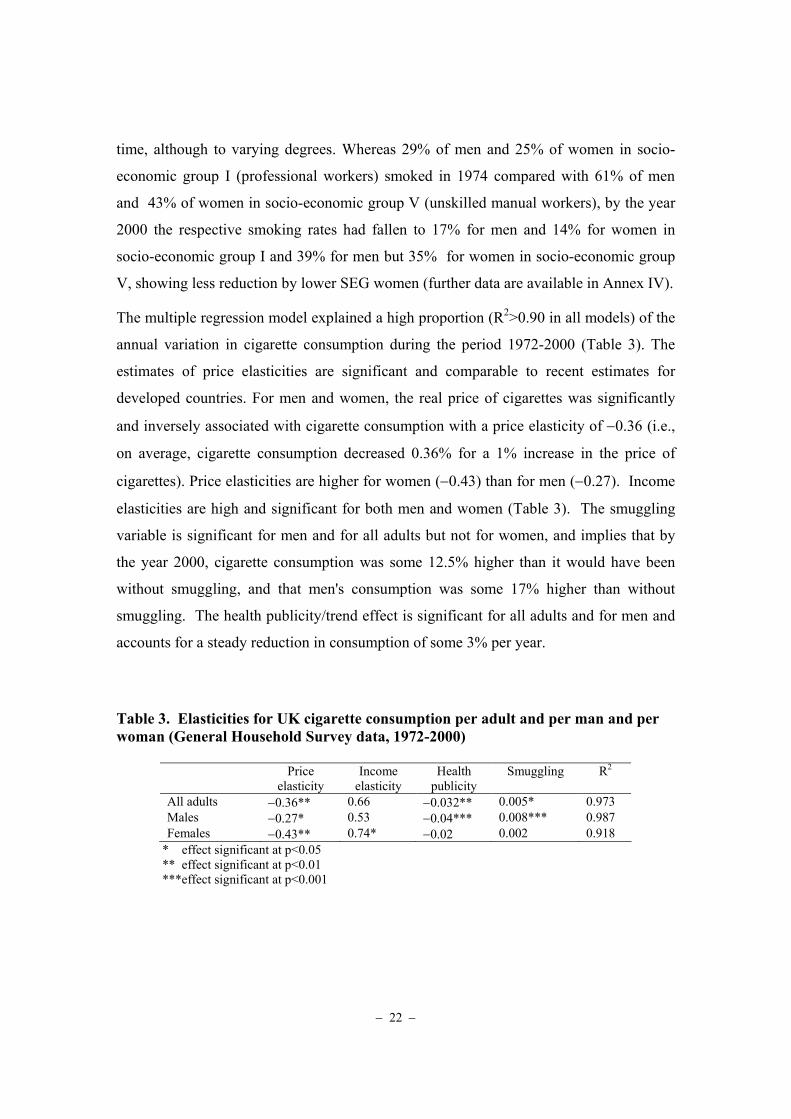
The multiple regression model explained a high proportion (R2>0.90 in all models) of the
annual variation in cigarette consumption during the period 1972-2000 (Table 3). The
estimates of price elasticities are significant and comparable to recent estimates for
developed countries. For men and women, the real price of cigarettes was significantly
and inversely associated with cigarette consumption with a price elasticity of −0.36 (i.e.,
on average, cigarette consumption decreased 0.36% for a 1% increase in the price of
cigarettes). Price elasticities are higher for women (−0.43) than for men (−0.27). Income
elasticities are high and significant for both men and women (Table 3). The smuggling
variable is significant for men and for all adults but not for women, and implies that by
the year 2000, cigarette consumption was some 12.5% higher than it would have been
without smuggling, and that men's consumption was some 17% higher than without
smuggling. The health publicity/trend effect is significant for all adults and for men and
accounts for a steady reduction in consumption of some 3% per year.
Table 3. Elasticities for UK cigarette consumption per adult and per man and per woman (General Household Survey data, 1972-2000)
Price elasticity
Income elasticity
Health publicity
Smuggling R2
All adults −0.36** 0.66 −0.032** 0.005* 0.973 Males −0.27* 0.53 −0.04*** 0.008*** 0.987 Females −0.43** 0.74* −0.02 0.002 0.918
* effect significant at p<0.05 ** effect significant at p<0.01 ***effect significant at p<0.001
− 23 −
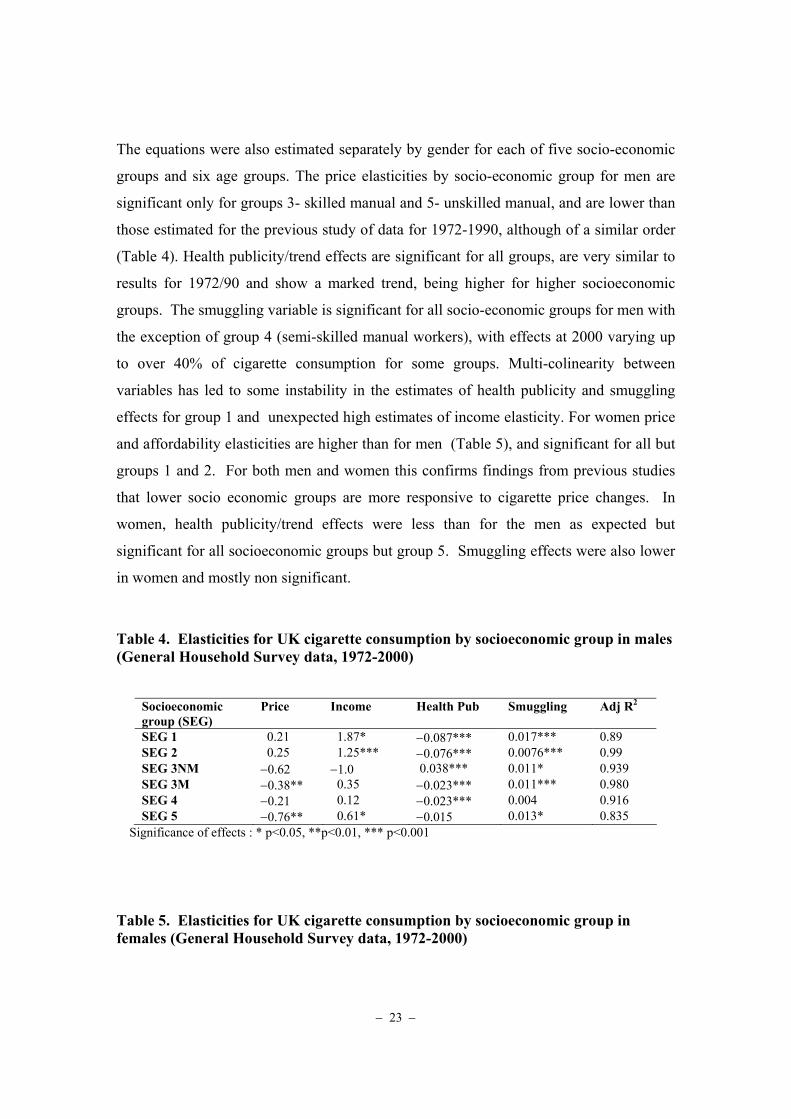
The equations were also estimated separately by gender for each of five socio-economic
groups and six age groups. The price elasticities by socio-economic group for men are
significant only for groups 3- skilled manual and 5- unskilled manual, and are lower than
those estimated for the previous study of data for 1972-1990, although of a similar order
(Table 4). Health publicity/trend effects are significant for all groups, are very similar to
results for 1972/90 and show a marked trend, being higher for higher socioeconomic
groups. The smuggling variable is significant for all socio-economic groups for men with
the exception of group 4 (semi-skilled manual workers), with effects at 2000 varying up
to over 40% of cigarette consumption for some groups. Multi-colinearity between
variables has led to some instability in the estimates of health publicity and smuggling
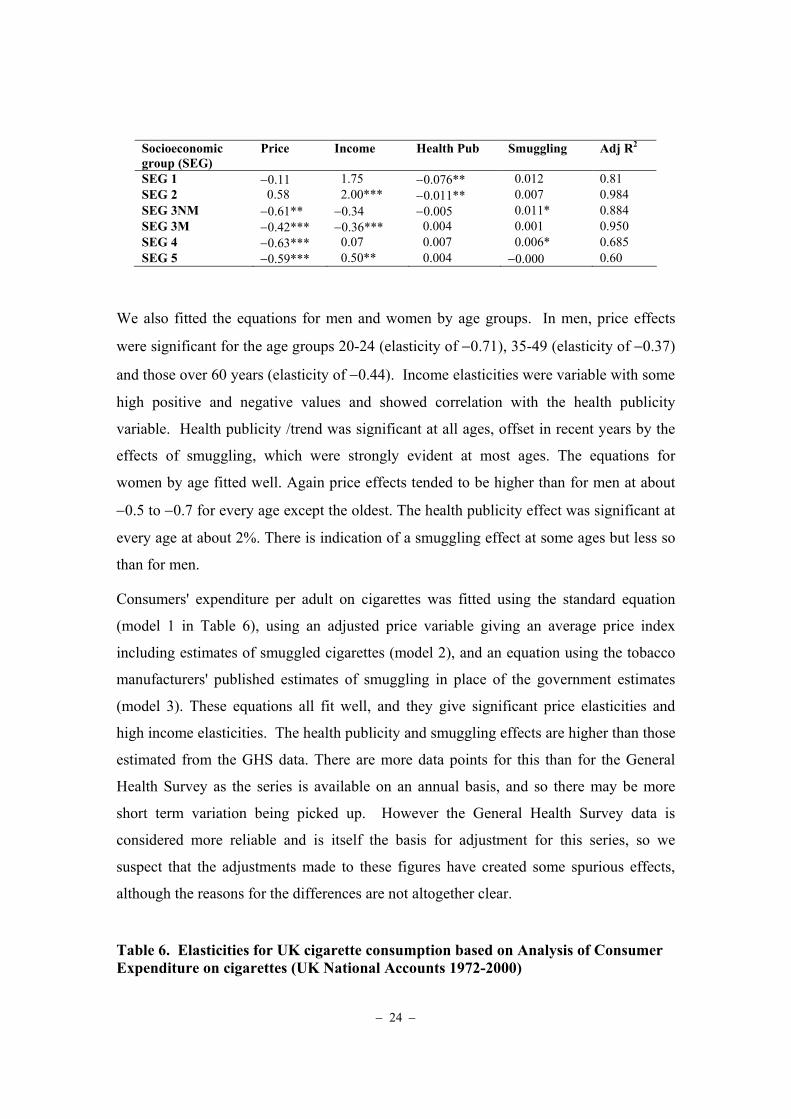
effects for group 1 and unexpected high estimates of income elasticity. For women price
and affordability elasticities are higher than for men (Table 5), and significant for all but
groups 1 and 2. For both men and women this confirms findings from previous studies
that lower socio economic groups are more responsive to cigarette price changes. In
women, health publicity/trend effects were less than for the men as expected but
significant for all socioeconomic groups but group 5. Smuggling effects were also lower
in women and mostly non significant.
Table 4. Elasticities for UK cigarette consumption by socioeconomic group in males (General Household Survey data, 1972-2000)
Socioeconomic group (SEG)
Price Income Health Pub Smuggling Adj R2
SEG 1 0.21 1.87* −0.087*** 0.017*** 0.89 SEG 2 0.25 1.25*** −0.076*** 0.0076*** 0.99 SEG 3NM −0.62 −1.0 0.038*** 0.011* 0.939 SEG 3M −0.38** 0.35 −0.023*** 0.011*** 0.980 SEG 4 −0.21 0.12 −0.023*** 0.004 0.916 SEG 5 −0.76** 0.61* −0.015 0.013* 0.835
Significance of effects : * p<0.05, **p<0.01, *** p<0.001 Table 5. Elasticities for UK cigarette consumption by socioeconomic group in females (General Household Survey data, 1972-2000)
− 24 −
Socioeconomic group (SEG)
Price Income Health Pub Smuggling Adj R2
SEG 1 −0.11 1.75 −0.076** 0.012 0.81 SEG 2 0.58 2.00*** −0.011** 0.007 0.984 SEG 3NM −0.61** −0.34 −0.005 0.011* 0.884 SEG 3M −0.42*** −0.36*** 0.004 0.001 0.950 SEG 4 −0.63*** 0.07 0.007 0.006* 0.685 SEG 5 −0.59*** 0.50** 0.004 −0.000 0.60
We also fitted the equations for men and women by age groups. In men, price effects
were significant for the age groups 20-24 (elasticity of −0.71), 35-49 (elasticity of −0.37)
and those over 60 years (elasticity of −0.44). Income elasticities were variable with some
high positive and negative values and showed correlation with the health publicity
variable. Health publicity /trend was significant at all ages, offset in recent years by the
effects of smuggling, which were strongly evident at most ages. The equations for
women by age fitted well. Again price effects tended to be higher than for men at about
−0.5 to −0.7 for every age except the oldest. The health publicity effect was significant at
every age at about 2%. There is indication of a smuggling effect at some ages but less so
than for men.
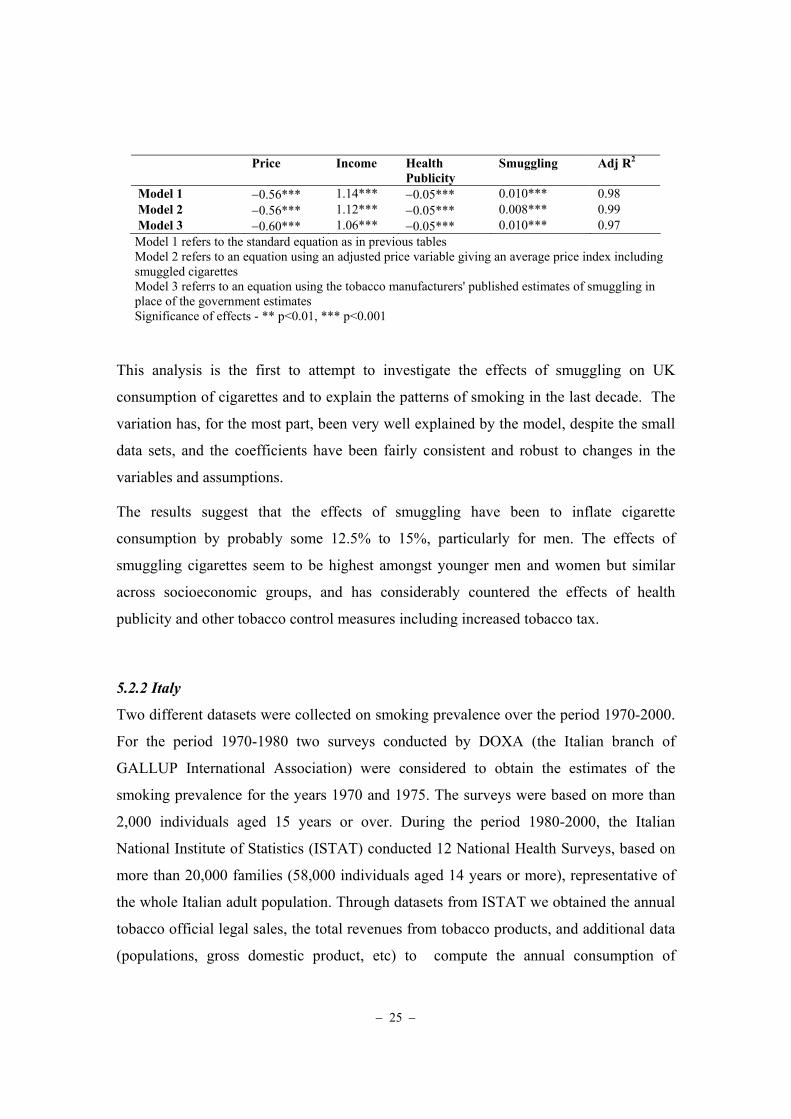
Consumers' expenditure per adult on cigarettes was fitted using the standard equation
(model 1 in Table 6), using an adjusted price variable giving an average price index
including estimates of smuggled cigarettes (model 2), and an equation using the tobacco
manufacturers' published estimates of smuggling in place of the government estimates
(model 3). These equations all fit well, and they give significant price elasticities and
high income elasticities. The health publicity and smuggling effects are higher than those
estimated from the GHS data. There are more data points for this than for the General
Health Survey as the series is available on an annual basis, and so there may be more
short term variation being picked up. However the General Health Survey data is
considered more reliable and is itself the basis for adjustment for this series, so we
suspect that the adjustments made to these figures have created some spurious effects,
although the reasons for the differences are not altogether clear. Table 6. Elasticities for UK cigarette consumption based on Analysis of Consumer Expenditure on cigarettes (UK National Accounts 1972-2000)
− 25 −
Price Income Health
Publicity Smuggling Adj R2
Model 1 −0.56*** 1.14*** −0.05*** 0.010*** 0.98 Model 2 −0.56*** 1.12*** −0.05*** 0.008*** 0.99 Model 3 −0.60*** 1.06*** −0.05*** 0.010*** 0.97 Model 1 refers to the standard equation as in previous tables Model 2 refers to an equation using an adjusted price variable giving an average price index including smuggled cigarettes Model 3 referrs to an equation using the tobacco manufacturers' published estimates of smuggling in place of the government estimates Significance of effects - ** p<0.01, *** p<0.001
This analysis is the first to attempt to investigate the effects of smuggling on UK
consumption of cigarettes and to explain the patterns of smoking in the last decade. The
variation has, for the most part, been very well explained by the model, despite the small
data sets, and the coefficients have been fairly consistent and robust to changes in the
variables and assumptions.
The results suggest that the effects of smuggling have been to inflate cigarette
consumption by probably some 12.5% to 15%, particularly for men. The effects of
smuggling cigarettes seem to be highest amongst younger men and women but similar
across socioeconomic groups, and has considerably countered the effects of health
publicity and other tobacco control measures including increased tobacco tax.
5.2.2 Italy
Two different datasets were collected on smoking prevalence over the period 1970-2000.
For the period 1970-1980 two surveys conducted by DOXA (the Italian branch of
GALLUP International Association) were considered to obtain the estimates of the
smoking prevalence for the years 1970 and 1975. The surveys were based on more than
2,000 individuals aged 15 years or over. During the period 1980-2000, the Italian
National Institute of Statistics (ISTAT) conducted 12 National Health Surveys, based on
more than 20,000 families (58,000 individuals aged 14 years or more), representative of
the whole Italian adult population. Through datasets from ISTAT we obtained the annual
tobacco official legal sales, the total revenues from tobacco products, and additional data
(populations, gross domestic product, etc) to compute the annual consumption of
− 26 −
cigarettes per adult per day, and the real price of a pack of cigarettes (in euro,
standardized at the year 2000). (Please see more details on the methodology employed in
Annex V).
We used multiple regression analysis to examine how price and income influenced
smoking patterns. We used a single equation model, in order to obtain price elasticities of
demand for cigarettes (i.e., percentage change in cigarette consumption for a 1% change
in price). The same model was considered to evaluate how smoking prevalence (for the
years in which prevalence was available) was influenced by price and income.
Smoking prevalence among Italian males declined from about 70% in the 1950’s to 55%
in the 1970’s, and to 30-35% in 2000. In women, smoking prevalence increased from less
than 10% in the 1950’s up to 15-20%, in the 1980’s and remained approximately stable
subsequently. The National Health Survey, conducted from ISTAT in 2000, reported a
smoking prevalence of 31.5% in males aged 15 years or over, 17.2% in women, and
24.1% in both sexes combined. According to legal sales data, the average number of
cigarettes per Italian adult rose in the period 1970-1975 from 5 to 6 cigarettes per day,
remained stable for the following quinquennium, and rose again to 6.3 cigarettes per day
in 1985. It declined to around 5 cigarettes per day in the period 1987-90, was stable in
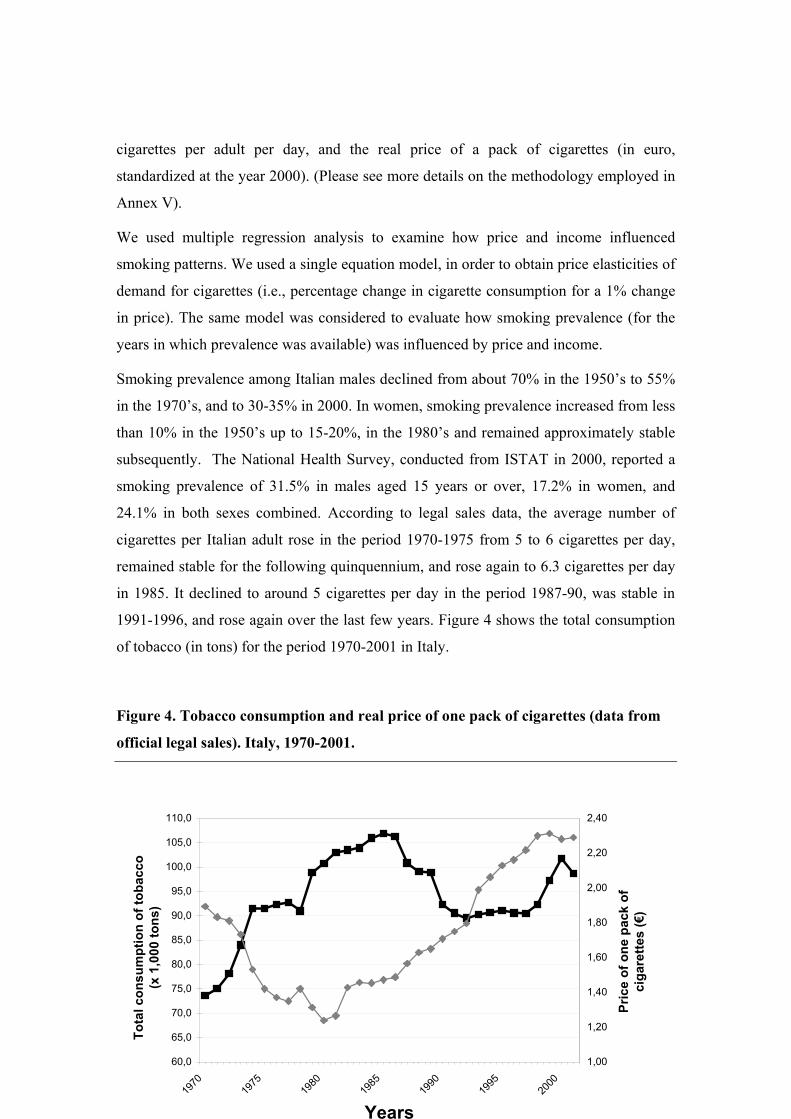
1991-1996, and rose again over the last few years. Figure 4 shows the total consumption
of tobacco (in tons) for the period 1970-2001 in Italy.
Figure 4. Tobacco consumption and real price of one pack of cigarettes (data from
official legal sales). Italy, 1970-2001.
60,0
65,0
70,0
75,0
80,0
85,0
90,0
95,0
100,0
105,0
110,0
1970
1975
1980
1985
1990
1995
2000
Years
Tota
l con
sum
ptio
n of
toba
cco
(x 1
,000
tons
)
1,00
1,20
1,40
1,60
1,80
2,00
2,20
2,40
Pric
e of
one
pac
k of
ci
gare
ttes
(€)
− 27 −
It has been estimated that smuggling accounted for around 10% to 30% of cigarettes sales
in Italy, but more precise estimates are not available for the last three decades. Available
information suggests that this phenomenon had increased in the late 1980’s, but
decreased in the last few years. This reduction, confirmed by annual variations of sales in
areas more or less affected by smuggling, has been related to the military intervention in
1999 in Kosovo, which led to a reduction of illegal activity in the Adriatic Sea area and to
a stricter control of Italian coasts.
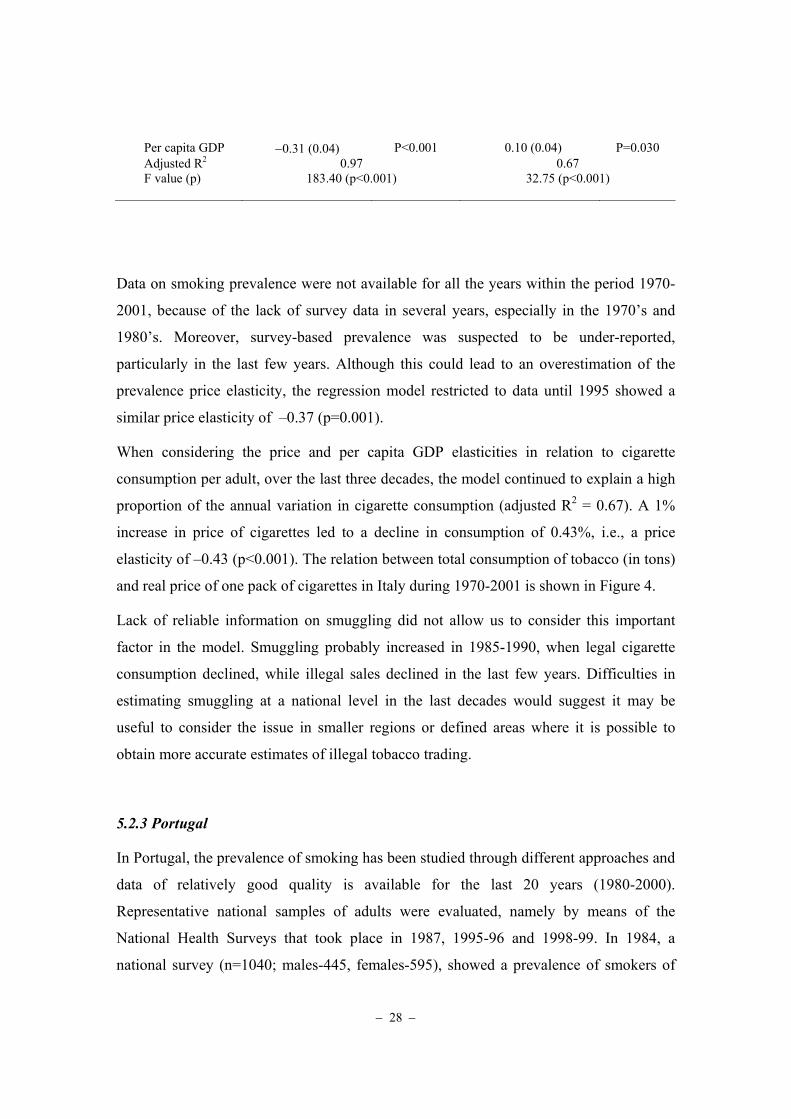
Table 7 shows the price and income (per capita Gross Domestic Product, GDP)
elasticities for smoking prevalence and cigarette consumption in Italy over the period
1970-2001. The multiple regression equation explained almost the totality of the annual
variation in smoking prevalence (adjusted R2 = 0.97). The real price of cigarettes were
significantly and inversely associated with the prevalence of current smokers with a price
elasticity of -0.30 (i.e., on average, smoking prevalence decreased 0.30% for a 1%
increase in the real price of cigarettes).
Table 7. Elasticities for Italian smoking prevalence and cigarette consumption per
adult (from official legal sales), 1970-2001. Annual prevalence of current smokers Annual cigarette consumption per
adult Coefficient
(standard error) P (test T) Coefficient (standard error) P (test T)
Constant 6.53 (0.33) P<0.001 −6.88 (0.39) P<0.001 Real Price −0.30 (0.05) P<0.001 −0.43 (0.06) P<0.001
− 28 −
Per capita GDP −0.31 (0.04) P<0.001 0.10 (0.04) P=0.030 Adjusted R2 0.97 0.67 F value (p) 183.40 (p<0.001) 32.75 (p<0.001)
Data on smoking prevalence were not available for all the years within the period 1970-
2001, because of the lack of survey data in several years, especially in the 1970’s and
1980’s. Moreover, survey-based prevalence was suspected to be under-reported,
particularly in the last few years. Although this could lead to an overestimation of the
prevalence price elasticity, the regression model restricted to data until 1995 showed a
similar price elasticity of –0.37 (p=0.001).
When considering the price and per capita GDP elasticities in relation to cigarette
consumption per adult, over the last three decades, the model continued to explain a high
proportion of the annual variation in cigarette consumption (adjusted R2 = 0.67). A 1%
increase in price of cigarettes led to a decline in consumption of 0.43%, i.e., a price
elasticity of –0.43 (p<0.001). The relation between total consumption of tobacco (in tons)
and real price of one pack of cigarettes in Italy during 1970-2001 is shown in Figure 4.
Lack of reliable information on smuggling did not allow us to consider this important
factor in the model. Smuggling probably increased in 1985-1990, when legal cigarette
consumption declined, while illegal sales declined in the last few years. Difficulties in
estimating smuggling at a national level in the last decades would suggest it may be
useful to consider the issue in smaller regions or defined areas where it is possible to
obtain more accurate estimates of illegal tobacco trading.
5.2.3 Portugal
In Portugal, the prevalence of smoking has been studied through different approaches and
data of relatively good quality is available for the last 20 years (1980-2000).
Representative national samples of adults were evaluated, namely by means of the
National Health Surveys that took place in 1987, 1995-96 and 1998-99. In 1984, a
national survey (n=1040; males-445, females-595), showed a prevalence of smokers of
− 29 −
37.3% among males and 10.1% in females. There was a lower prevalence in the north
and the interior of the country and a higher prevalence in litoral and southern regions.
Defining a smoker as a person that smokes at least a cigarette per day, the National
Health Survey showed a small decrease in male smoking (33.3% in 1987, 29.2% in 1095-
6, and 29.3 in 1998-9) but women smokers increased during the same period (5.0%, 6.5%
and 7.9%, respectively).
Current cigarette or tobacco consumption, measured as legal sales and as annual per
capita consumption, using the level of 1970 as the reference consumption (100),
increased to 134.8 in 1980, and to 152.5 in 1995. Trends in apparent per capita
consumption (cigarettes per capita per week) increased from 26.2 in 1971 to 41.3 in
1998. There is no good quality data available at the moment describing smuggling. The
most popular brand in Portugal is named “SG Ventil”. Its price increased from 1.25 € in
1994 to 1.95 € in 2002. During the same period, a Marlboro pack increased from 1.50 €
to 2.15 €. These prices are not adjusted by inflation (they are in the formal analysis), but
the increases were clearly lower than general price increases.
As the data from the National Health Interview Surveys was insufficient for analysis, we
have used the data from the annual cigarette consumption per adult derived from official
legal sales for the period 1980-2000. We used multiple regression analysis as discussed
above,to examine how price and income influenced smoking patterns. We used a single
equation model, in order to obtain price elasticities of demand for cigarettes (i.e.,
percentage change in cigarette consumption for a 1% change in price). Given the
particularity of a “dual” tobacco market with national and foreign brands of cigarettes, we
fitted different equations for price elasticity of demand according to the price of the most
popular national and foreign brands.
Figure 5 shows the relation between total annual consumption of cigarettes per capita and
real price of one pack of national and foreign cigarettes in Portugal during 1980-2000.
Table 8 shows the price and income (per capita Gross Domestic Product, GDP)
elasticities for cigarette consumption in Portugal over the period 1980-2000. In Portugal,
the multiple regression equations explained a low percentage of the annual variation in
smoking prevalence (adjusted R2 <0.20). The real price of cigarettes was inversely
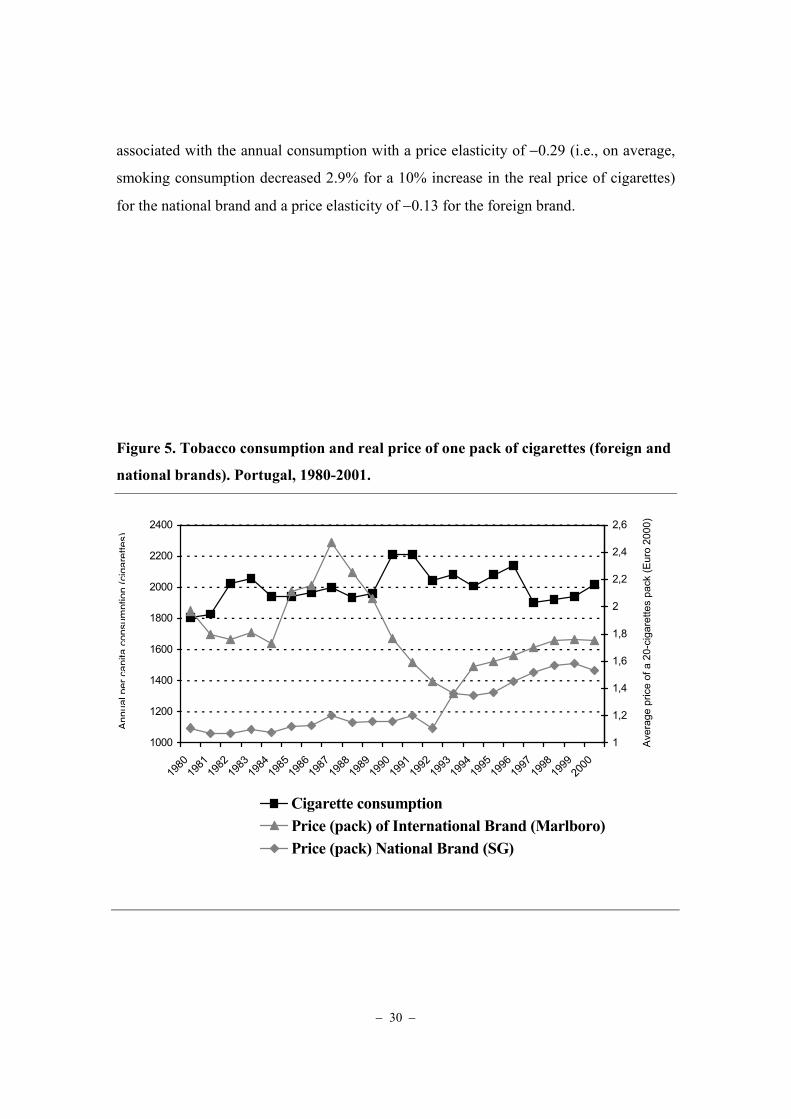
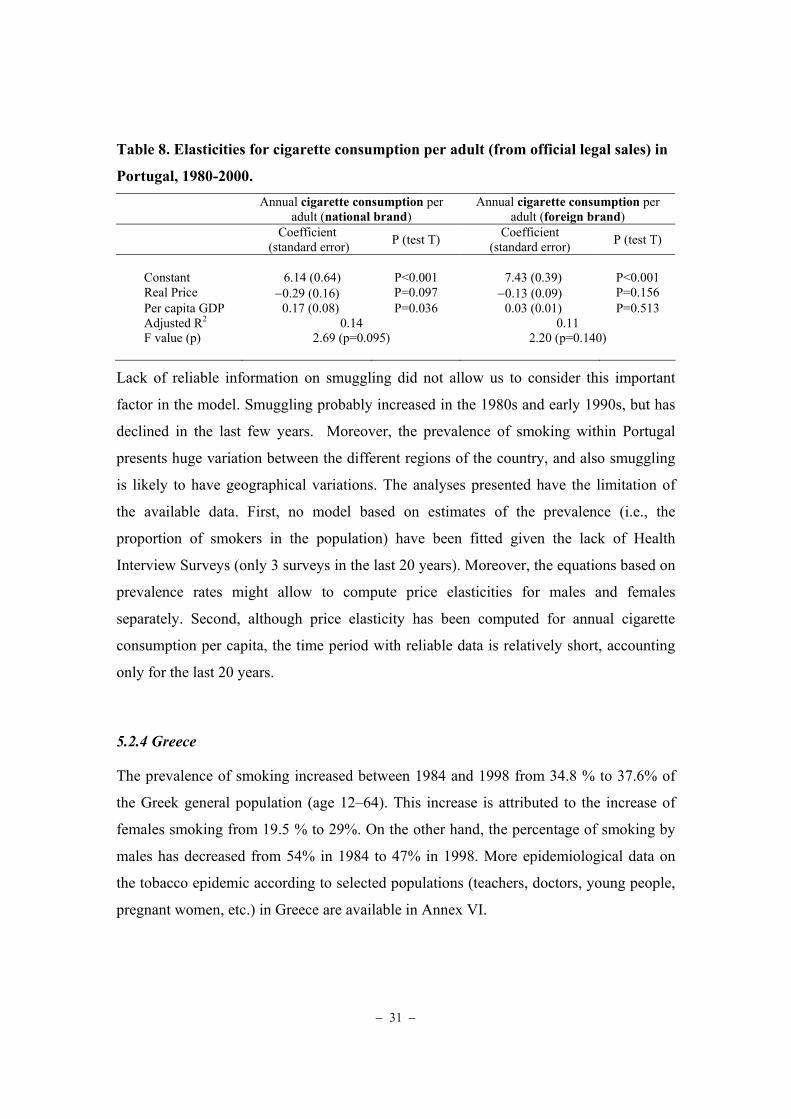
− 30 −
associated with the annual consumption with a price elasticity of −0.29 (i.e., on average,
smoking consumption decreased 2.9% for a 10% increase in the real price of cigarettes)
for the national brand and a price elasticity of −0.13 for the foreign brand.
Figure 5. Tobacco consumption and real price of one pack of cigarettes (foreign and
national brands). Portugal, 1980-2001.
1000
1200
1400
1600
1800
2000
2200
2400
1980
1981
1982
1983
1984
1985
1986
1987
1988
1989
1990
1991
1992
1993
1994
1995
1996
1997
1998
1999
2000
1
1,2
1,4
1,6
1,8
2
2,2
2,4
2,6
Cigarette consumptionPrice (pack) of International Brand (Marlboro)Price (pack) National Brand (SG)
Annu
alpe
rcap
itaco
nsum
ptio
n(c
igar
ette
s)
Ave
rage
pric
e of
a 2
0-ci
gare
ttes
pack
(Eur
o 20
00)
− 31 −
Table 8. Elasticities for cigarette consumption per adult (from official legal sales) in
Portugal, 1980-2000. Annual cigarette consumption per
adult (national brand) Annual cigarette consumption per
adult (foreign brand) Coefficient
(standard error) P (test T) Coefficient (standard error) P (test T)
Constant 6.14 (0.64) P<0.001 7.43 (0.39) P<0.001 Real Price −0.29 (0.16) P=0.097 −0.13 (0.09) P=0.156 Per capita GDP 0.17 (0.08) P=0.036 0.03 (0.01) P=0.513 Adjusted R2 0.14 0.11 F value (p) 2.69 (p=0.095) 2.20 (p=0.140)
Lack of reliable information on smuggling did not allow us to consider this important
factor in the model. Smuggling probably increased in the 1980s and early 1990s, but has
declined in the last few years. Moreover, the prevalence of smoking within Portugal
presents huge variation between the different regions of the country, and also smuggling
is likely to have geographical variations. The analyses presented have the limitation of
the available data. First, no model based on estimates of the prevalence (i.e., the
proportion of smokers in the population) have been fitted given the lack of Health
Interview Surveys (only 3 surveys in the last 20 years). Moreover, the equations based on
prevalence rates might allow to compute price elasticities for males and females
separately. Second, although price elasticity has been computed for annual cigarette
consumption per capita, the time period with reliable data is relatively short, accounting
only for the last 20 years.
5.2.4 Greece
The prevalence of smoking increased between 1984 and 1998 from 34.8 % to 37.6% of
the Greek general population (age 12–64). This increase is attributed to the increase of
females smoking from 19.5 % to 29%. On the other hand, the percentage of smoking by
males has decreased from 54% in 1984 to 47% in 1998. More epidemiological data on
the tobacco epidemic according to selected populations (teachers, doctors, young people,
pregnant women, etc.) in Greece are available in Annex VI.
− 32 −
Greece is a tobacco producing country as are other South European countries.
Controversial feelings were raised during the last decade mainly after the EU directives
and a lot of published arguments can be seen quite often in Greek daily press and the
magazines. Tobacco exports represent 3.9% of the total amount of exportation in Greece:
this represents 80% of the annual tobacco products, while the remaining 20% is used by
the national tobacco manufacturers.
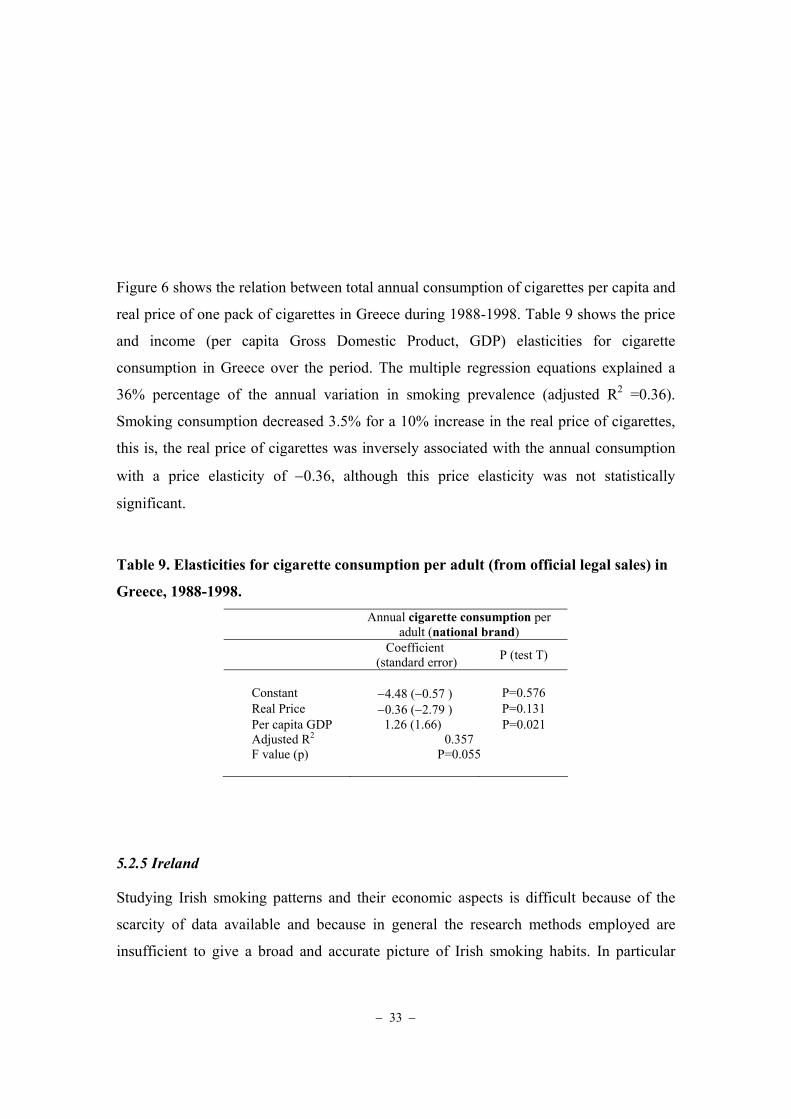
Annual consumption of cigarettes has increased over the last decades from 1011
cigarettes per adult (>15 years) in 1957 to 3358 cigarettes in 1998 (Figure 6). Retail
prices of cigarettes have increased over the last decades, although prices are still lower in
Greece as compared with other EU Countries. Regarding smuggling, it is estimated that
the overall smuggling may represent 8–10% of total sales, but there are no more precise
data on smuggling.
As the data from the National Health Surveys are scarce, we have used the data from the
annual cigarette consumption per adult derived from official legal sales for the period
1987-1998. We used multiple regression analysis to examine how price and income
influenced smoking patterns. We used a single equation model, in order to obtain price
elasticities of demand for cigarettes (i.e., percentage change in cigarette consumption for
a 1% change in price).
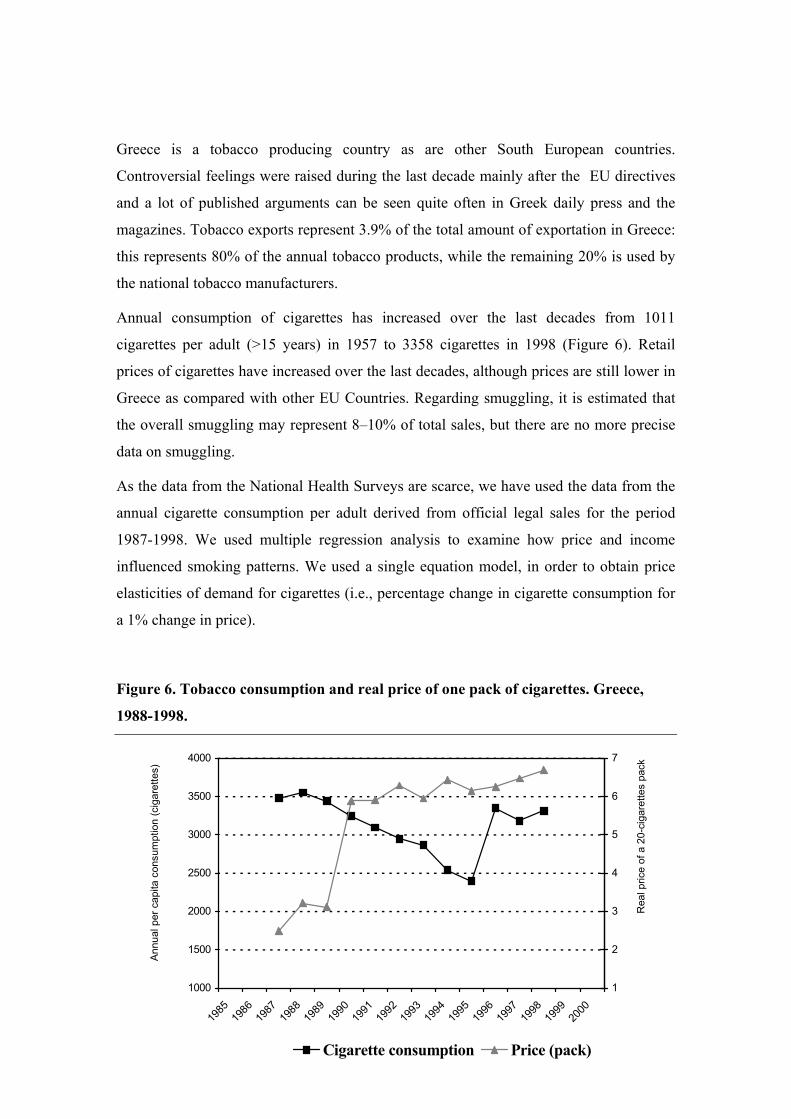
Figure 6. Tobacco consumption and real price of one pack of cigarettes. Greece,
1988-1998.
Ann
ual p
er c
apita
con
sum
ptio
n (c
igar
ette
s)
1000
1500
2000
2500
3000
3500
4000
1985
1986
1987
1988
1989
1990
1991
1992
1993
1994
1995
1996
1997
1998
1999
2000
1
2
3
4
5
6
7
Cigarette consumption Price (pack)
Rea
l pric
e of
a 2
0-ci
gare
ttes
pack
− 33 −
Figure 6 shows the relation between total annual consumption of cigarettes per capita and
real price of one pack of cigarettes in Greece during 1988-1998. Table 9 shows the price
and income (per capita Gross Domestic Product, GDP) elasticities for cigarette
consumption in Greece over the period. The multiple regression equations explained a
36% percentage of the annual variation in smoking prevalence (adjusted R2 =0.36).
Smoking consumption decreased 3.5% for a 10% increase in the real price of cigarettes,
this is, the real price of cigarettes was inversely associated with the annual consumption
with a price elasticity of −0.36, although this price elasticity was not statistically
significant.
Table 9. Elasticities for cigarette consumption per adult (from official legal sales) in
Greece, 1988-1998. Annual cigarette consumption per
adult (national brand) Coefficient
(standard error) P (test T)
Constant −4.48 (−0.57 ) P=0.576 Real Price −0.36 (−2.79 ) P=0.131 Per capita GDP 1.26 (1.66) P=0.021 Adjusted R2 0.357 F value (p) P=0.055
5.2.5 Ireland
Studying Irish smoking patterns and their economic aspects is difficult because of the
scarcity of data available and because in general the research methods employed are
insufficient to give a broad and accurate picture of Irish smoking habits. In particular

− 34 −
sociodemographic distribution of smoking prevalence has not been systematically
recorded. The data that are available on smoking prevalence in Ireland show that progress
has been made in past decades, with a considerable decline in the number of men
smoking and a less considerable decline in the number of women smoking. The overall
prevalence of smoking has reduced from 40% in the mid 1970s to about 28% in the early
1990s and is currently at 30%.
The most recent data available on smoking prevalence in Ireland comes from the
National Health and Lifestyle Surveys (SLÁN and HBSC), which commenced in 1998 on
a four yearly cycle. These surveys provide and will provide information on smoking
prevalence by gender, age and social class. The first survey indicates that overall young
women were more likely to report smoking than were young men and smoking is
prevalent at all age groups and all social classes. Although a strong social class gradient
in smoking prevalence in all age groups was evident, there was a distinct bias towards
higher prevalence in young people on low incomes. Data on consumption patterns
follows a similar trend to smoking prevalence. Annual adult per capita consumption of
cigarettes peaked in the 1970s (3050 cigarettes) and was then followed by a rapid decline
in the 1980s and decreased further during the 1990s (1722 cigarettes/adult/year) with
some recent indication of a slight increase. Trends in annual cigarette consumption per
capita (>14 years old) are shown in Figure 7. Additional data on the tobacco epidemic
development is available in Annex VII.
In Ireland prices of tobacco products are kept high with almost 80% of the cost of a
packet of cigarettes being taxes. Current tobacco prices have increased since 1987, but
after adjusting for consumer price index changes, a fluctuation of real prices is apparent
between 1987 and 1999, with no net increase during those years (Figure 7).
As the data from Health Surveys are scarce and provide insufficient points in the
regression model for good fit, we have used the data from the annual cigarette
consumption per adult derived from official legal sales for the period 1987-1999. We
used multiple regression analysis to examine how price and income influenced smoking
patterns. We used a single equation model in order to obtain price elasticities of demand
for cigarettes (data in Figure 7). Table 10 shows the price and income (per capita Gross
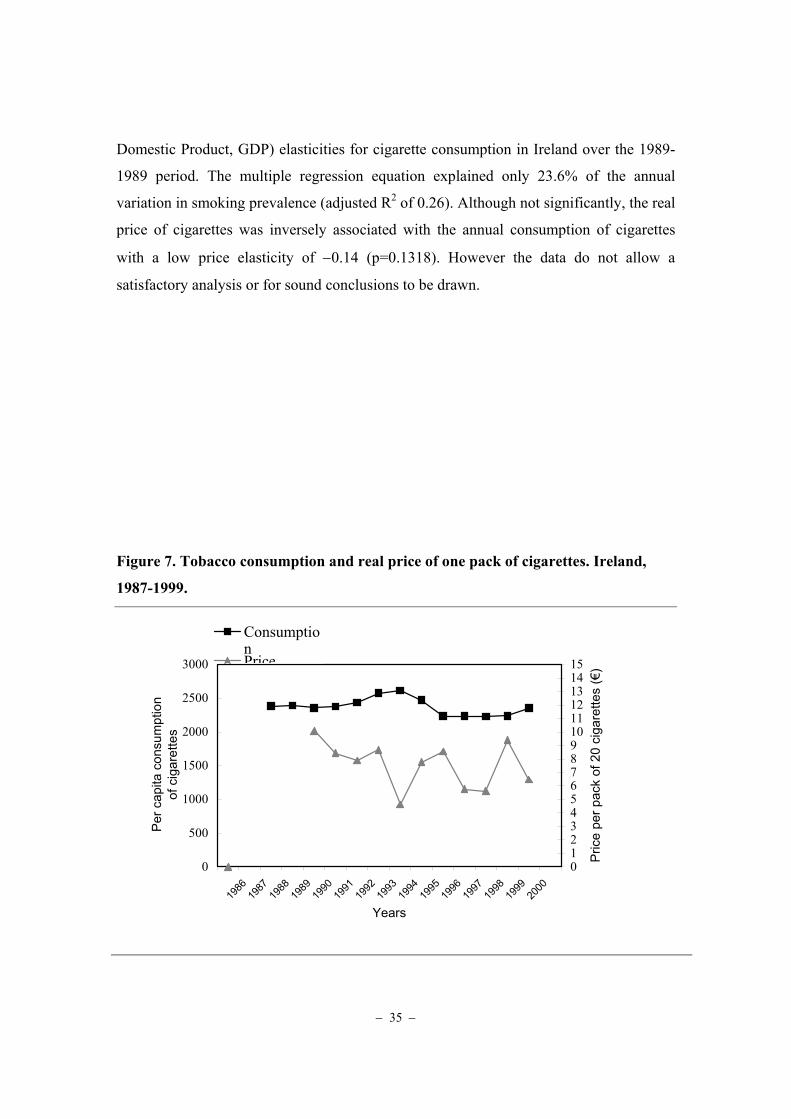
− 35 −
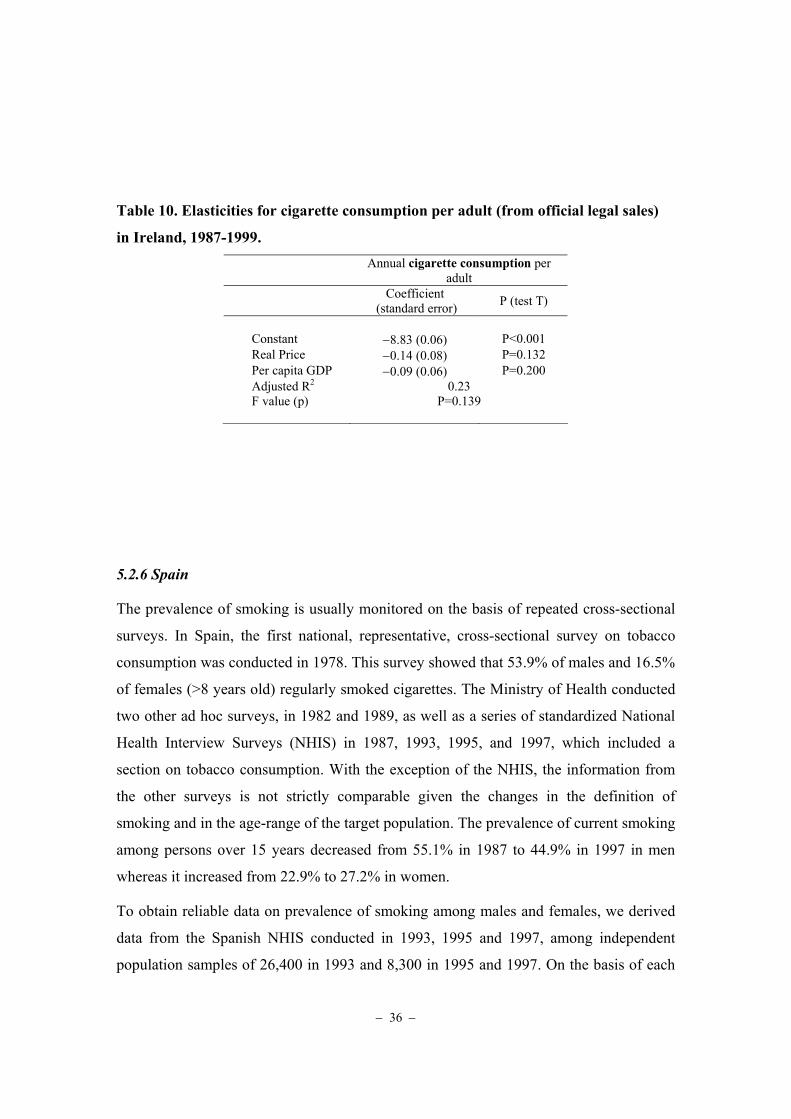
Domestic Product, GDP) elasticities for cigarette consumption in Ireland over the 1989-
1989 period. The multiple regression equation explained only 23.6% of the annual
variation in smoking prevalence (adjusted R2 of 0.26). Although not significantly, the real
price of cigarettes was inversely associated with the annual consumption of cigarettes
with a low price elasticity of −0.14 (p=0.1318). However the data do not allow a
satisfactory analysis or for sound conclusions to be drawn.
Figure 7. Tobacco consumption and real price of one pack of cigarettes. Ireland,
1987-1999.
0
500
1000
1500
2000
2500
3000
1986
1987
1988
1989
1990
1991
1992
1993
1994
1995
1996
1997
1998
1999
2000
Years
Per
cap
ita c
onsu
mpt
ion
of c
igar
ette
s
0123456789101112131415
Pric
e pe
r pac
k of
20
ciga
rette
s (€
)
ConsumptionPrice
− 36 −
Table 10. Elasticities for cigarette consumption per adult (from official legal sales)
in Ireland, 1987-1999. Annual cigarette consumption per
adult Coefficient
(standard error) P (test T)
Constant −8.83 (0.06) P<0.001 Real Price −0.14 (0.08) P=0.132 Per capita GDP −0.09 (0.06) P=0.200 Adjusted R2 0.23 F value (p) P=0.139
5.2.6 Spain
The prevalence of smoking is usually monitored on the basis of repeated cross-sectional
surveys. In Spain, the first national, representative, cross-sectional survey on tobacco
consumption was conducted in 1978. This survey showed that 53.9% of males and 16.5%
of females (>8 years old) regularly smoked cigarettes. The Ministry of Health conducted
two other ad hoc surveys, in 1982 and 1989, as well as a series of standardized National
Health Interview Surveys (NHIS) in 1987, 1993, 1995, and 1997, which included a
section on tobacco consumption. With the exception of the NHIS, the information from
the other surveys is not strictly comparable given the changes in the definition of
smoking and in the age-range of the target population. The prevalence of current smoking
among persons over 15 years decreased from 55.1% in 1987 to 44.9% in 1997 in men
whereas it increased from 22.9% to 27.2% in women.
To obtain reliable data on prevalence of smoking among males and females, we derived
data from the Spanish NHIS conducted in 1993, 1995 and 1997, among independent
population samples of 26,400 in 1993 and 8,300 in 1995 and 1997. On the basis of each

− 37 −
respondent’s sex and calendar year of birth, the person was classified into a particular
sex-birth cohort. For each year from date of birth to date of survey, a respondent was
further classified as either cigarette smoker or non-smoker. Thus, we derived for each
calendar year the number of subjects alive and his or her smoking status in that given
calendar year, and hence, the prevalence of smoking (for males and females aged >15
years old) in that given year for the period 1965-1995.
We have also used information on official legal tobacco sales from Tabacalera (the
former Spanish monopoly8), for legal sales of black tobacco, of blond tobacco, and the
average between them. Tabacalera offers the average price of a packet of black cigarettes
and a packet of blond cigarettes separately as well as the share of each of these two over
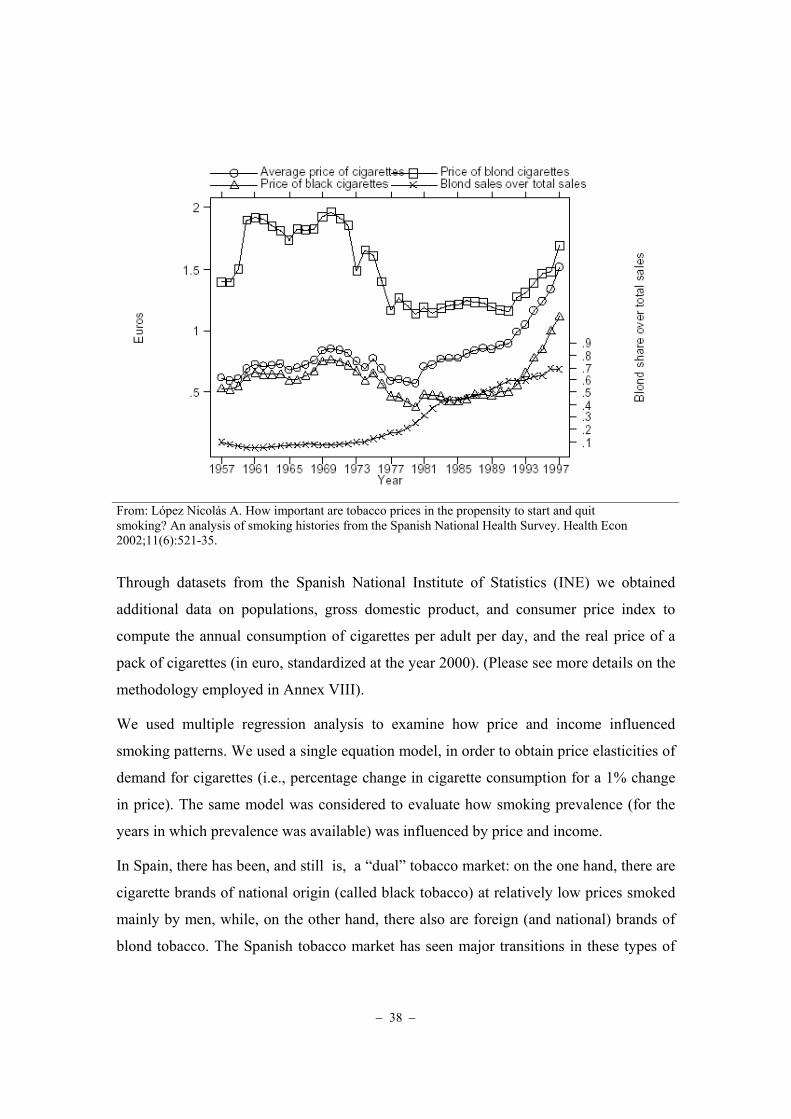
total sales starting in 1957. Figure 8 presents the evolution of the price of a packet of
cigarettes (in constant 2000 euros) distinguishing between black and blond types as well
as a weighted (by sales) average price of the two latter. The figure also presents the share
of blond cigarettes over total cigarette sales.
Figure 8. Cigarette prices of a pack of blond and black cigarettes, average price, and
blond share of sales. Spain, 1957-1997.
8 Spain’s major cigarette producer remains the former state monopoly, Tabacalera. Even after privatization in 1998, Tabacalera continues to be the leading manufacturer and distributor of tobacco in Spain. In 1998, 80.4% of cigarettes produced in Spain were produced in Tabacalera factories on the mainland, and the remaining 19.6% were produced in joint ventures on various Spanish territories. Recently, Tabacalera merged with Seita of France to become Altadis, a conglomerate of multinational corporations, creating an ever more monolithic industry presence on the European continent.
− 38 −
From: López Nicolás A. How important are tobacco prices in the propensity to start and quit smoking? An analysis of smoking histories from the Spanish National Health Survey. Health Econ 2002;11(6):521-35.
Through datasets from the Spanish National Institute of Statistics (INE) we obtained
additional data on populations, gross domestic product, and consumer price index to
compute the annual consumption of cigarettes per adult per day, and the real price of a
pack of cigarettes (in euro, standardized at the year 2000). (Please see more details on the
methodology employed in Annex VIII).
We used multiple regression analysis to examine how price and income influenced
smoking patterns. We used a single equation model, in order to obtain price elasticities of
demand for cigarettes (i.e., percentage change in cigarette consumption for a 1% change
in price). The same model was considered to evaluate how smoking prevalence (for the
years in which prevalence was available) was influenced by price and income.
In Spain, there has been, and still is, a “dual” tobacco market: on the one hand, there are
cigarette brands of national origin (called black tobacco) at relatively low prices smoked
mainly by men, while, on the other hand, there also are foreign (and national) brands of
blond tobacco. The Spanish tobacco market has seen major transitions in these types of
− 39 −
tobacco used in cigarettes in recent decades (see Figure 8, series of blond sales over total
sales): blond cigarettes containing tobacco with a relatively high sugar content (grown
primarily in the United States) have gradually supplanted Spain’s traditionally preferred
black tobacco cigarettes (a much darker and stronger tobacco variety). As in other
countries, filter and “light” cigarettes have been aggressively marketed over the past 30
years. Blond tobacco, which was legally introduced in the 1970’s in Spain, is mainly
smoked by women (the high initiation of smoking by women in the 1970’s may be due to
the introduction of Fortuna, a national, cheap, blond brand of cigarettes), although young
people and also male smokers who want to shift to “moderate” use are also smoking
blond (and so-called “lights”) brands. As previously mentioned, another particularity of
the epidemics of smoking in Spain is the recent (beginning in the 1970’s) spread of the
habit among women. Most economically developed nations in Europe and North America
began experiencing sharp increases in female smoking during the 1950’s and 1960’s but
Spain lagged behind this trend. Nevertheless, by the 1990’s Spain’s cigarette market grew
to be the third largest in Western Europe, surpassed only by Germany and Italy.
As shown in Figure 8, a packet of blond cigarettes was cheaper in the 1990’s than in the
late 50’s. At the start of the 1970’s the price of blond cigarettes descended markedly. In
1975 Tabacalera launched one of the most popular (and cheap) blond brands (Fortuna)
coinciding with the opening of the domestic market to foreign blond brands such as
Marlboro or Winston. In addition, advertising underwent a structural change in this
period: women were targeted more intensely than ever before. This may explain both the
evidence that women tend to smoke blond cigarettes and the marked rise in the share of
the blond variety over total cigarette sales. A concurrent explanatory factor for the rising
share of blond cigarettes might be an increasing preference for higher value brands
associated with rising incomes.
Given this particular distribution of the Spanish tobacco market and diffusion of the
epidemic in Spain, and after checking the inappropriateness of models with overall
consumption (blond+black tobacco) and average price, we decided to fit separate models
for consumption of blond and black tobacco, and also to fit different models for the
prevalence rates of males and females, and the price of blond and black tobacco. We
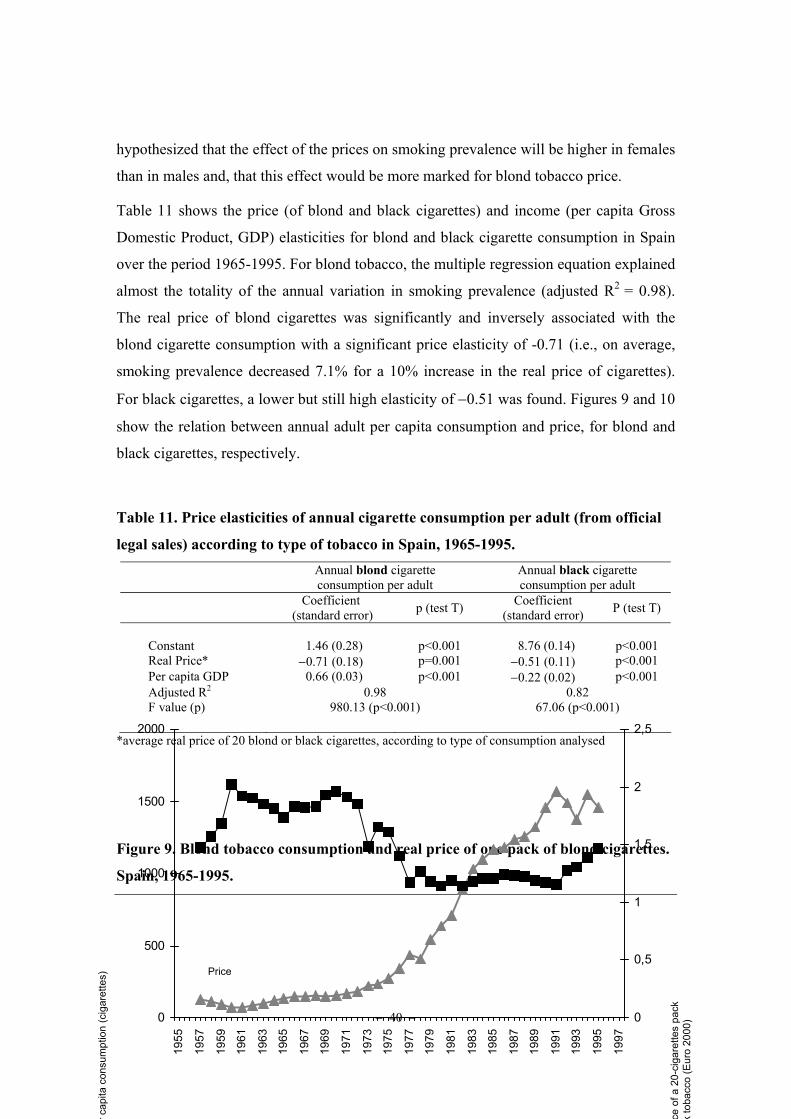
− 40 −
hypothesized that the effect of the prices on smoking prevalence will be higher in females
than in males and, that this effect would be more marked for blond tobacco price.
Table 11 shows the price (of blond and black cigarettes) and income (per capita Gross
Domestic Product, GDP) elasticities for blond and black cigarette consumption in Spain
over the period 1965-1995. For blond tobacco, the multiple regression equation explained
almost the totality of the annual variation in smoking prevalence (adjusted R2 = 0.98).
The real price of blond cigarettes was significantly and inversely associated with the
blond cigarette consumption with a significant price elasticity of -0.71 (i.e., on average,
smoking prevalence decreased 7.1% for a 10% increase in the real price of cigarettes).
For black cigarettes, a lower but still high elasticity of −0.51 was found. Figures 9 and 10
show the relation between annual adult per capita consumption and price, for blond and
black cigarettes, respectively.
Table 11. Price elasticities of annual cigarette consumption per adult (from official
legal sales) according to type of tobacco in Spain, 1965-1995. Annual blond cigarette
consumption per adult Annual black cigarette consumption per adult
Coefficient (standard error) p (test T) Coefficient
(standard error) P (test T)
Constant 1.46 (0.28) p<0.001 8.76 (0.14) p<0.001 Real Price* −0.71 (0.18) p=0.001 −0.51 (0.11) p<0.001 Per capita GDP 0.66 (0.03) p<0.001 −0.22 (0.02) p<0.001 Adjusted R2 0.98 0.82 F value (p) 980.13 (p<0.001) 67.06 (p<0.001)
*average real price of 20 blond or black cigarettes, according to type of consumption analysed
Figure 9. Blond tobacco consumption and real price of one pack of blond cigarettes.
Spain, 1965-1995.
0
500
1000
1500
2000
1955
1957
1959
1961
1963
1965
1967
1969
1971
1973
1975
1977
1979
1981
1983
1985
1987
1989
1991
1993
1995
1997
0
0,5
1
1,5
2
2,5
ce o
f a 2
0-ci
gare
ttes
pack
k
toba
cco
(Eur
o 20
00)
r cap
ita c
onsu
mpt
ion
(cig
aret
tes)
Price
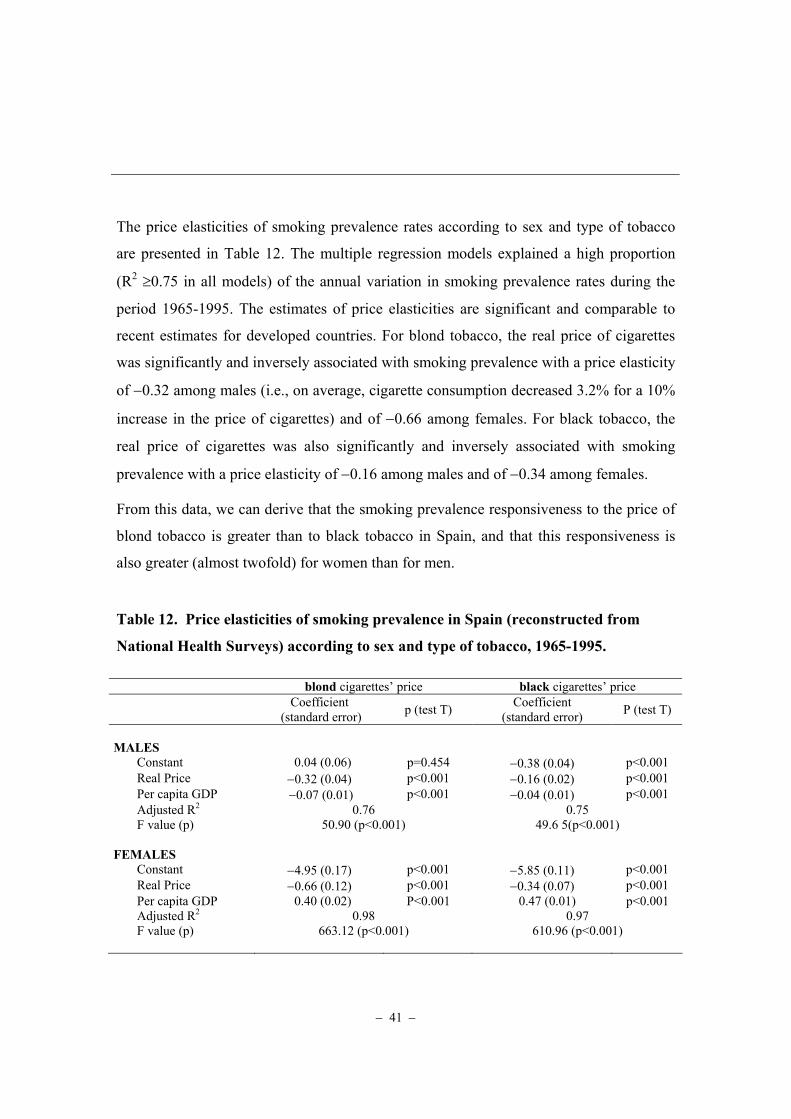
− 41 −
The price elasticities of smoking prevalence rates according to sex and type of tobacco
are presented in Table 12. The multiple regression models explained a high proportion
(R2 ≥0.75 in all models) of the annual variation in smoking prevalence rates during the
period 1965-1995. The estimates of price elasticities are significant and comparable to
recent estimates for developed countries. For blond tobacco, the real price of cigarettes
was significantly and inversely associated with smoking prevalence with a price elasticity
of −0.32 among males (i.e., on average, cigarette consumption decreased 3.2% for a 10%
increase in the price of cigarettes) and of −0.66 among females. For black tobacco, the
real price of cigarettes was also significantly and inversely associated with smoking
prevalence with a price elasticity of −0.16 among males and of −0.34 among females.
From this data, we can derive that the smoking prevalence responsiveness to the price of
blond tobacco is greater than to black tobacco in Spain, and that this responsiveness is
also greater (almost twofold) for women than for men.
Table 12. Price elasticities of smoking prevalence in Spain (reconstructed from
National Health Surveys) according to sex and type of tobacco, 1965-1995.
blond cigarettes’ price black cigarettes’ price Coefficient
(standard error) p (test T) Coefficient (standard error) P (test T)
MALES
Constant 0.04 (0.06) p=0.454 −0.38 (0.04) p<0.001 Real Price −0.32 (0.04) p<0.001 −0.16 (0.02) p<0.001 Per capita GDP −0.07 (0.01) p<0.001 −0.04 (0.01) p<0.001 Adjusted R2 0.76 0.75 F value (p) 50.90 (p<0.001) 49.6 5(p<0.001)
FEMALES
Constant −4.95 (0.17) p<0.001 −5.85 (0.11) p<0.001 Real Price −0.66 (0.12) p<0.001 −0.34 (0.07) p<0.001 Per capita GDP 0.40 (0.02) P<0.001 0.47 (0.01) p<0.001 Adjusted R2 0.98 0.97 F value (p) 663.12 (p<0.001) 610.96 (p<0.001)
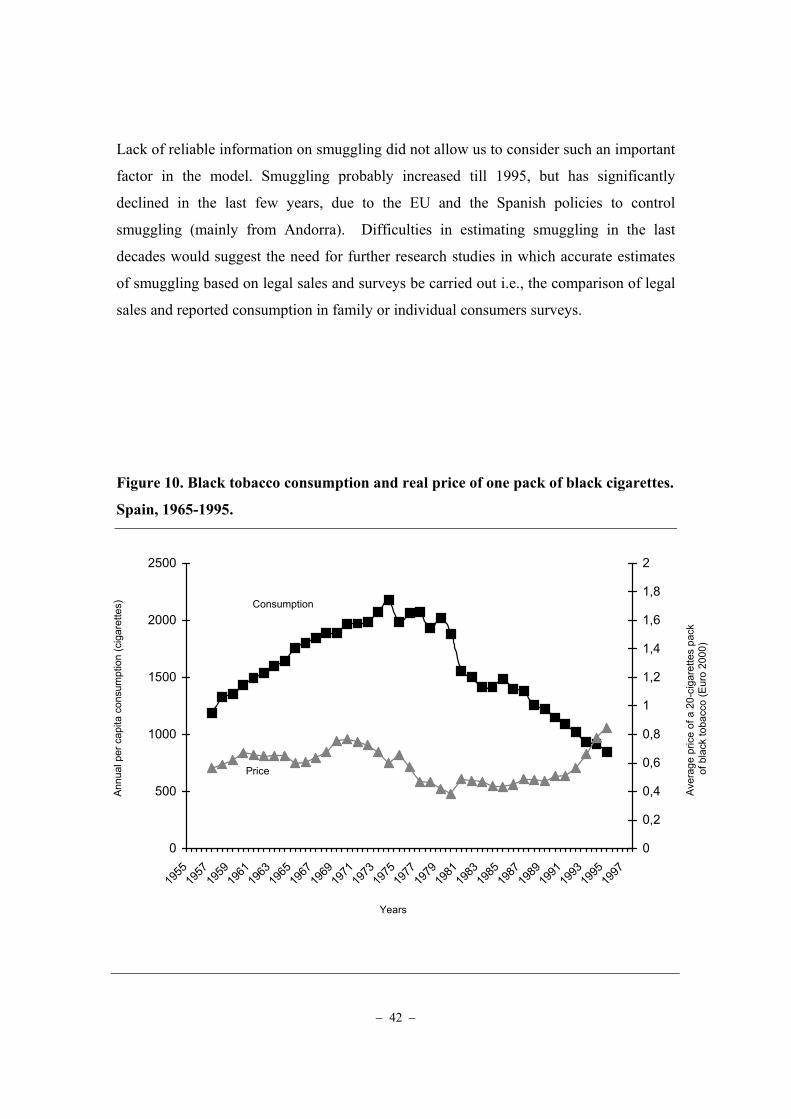
− 42 −
Lack of reliable information on smuggling did not allow us to consider such an important
factor in the model. Smuggling probably increased till 1995, but has significantly
declined in the last few years, due to the EU and the Spanish policies to control
smuggling (mainly from Andorra). Difficulties in estimating smuggling in the last
decades would suggest the need for further research studies in which accurate estimates
of smuggling based on legal sales and surveys be carried out i.e., the comparison of legal
sales and reported consumption in family or individual consumers surveys.
Figure 10. Black tobacco consumption and real price of one pack of black cigarettes.
Spain, 1965-1995.
Ave
rage
pric
e of
a 2
0-ci
gare
ttes
pack
o
f bla
ck to
bacc
o (E
uro
2000
)
Annu
al p
er c
apita
con
sum
ptio
n (c
igar
ette
s)
Consumption
Years
Price
0
500
1000
1500
2000
2500
1955
1957
1959
1961
1963
1965
1967
1969
1971
1973
1975
1977
1979
1981
1983
1985
1987
1989
1991
1993
1995
1997
0
0,2
0,4
0,6
0,8
1
1,2
1,4
1,6
1,8
2
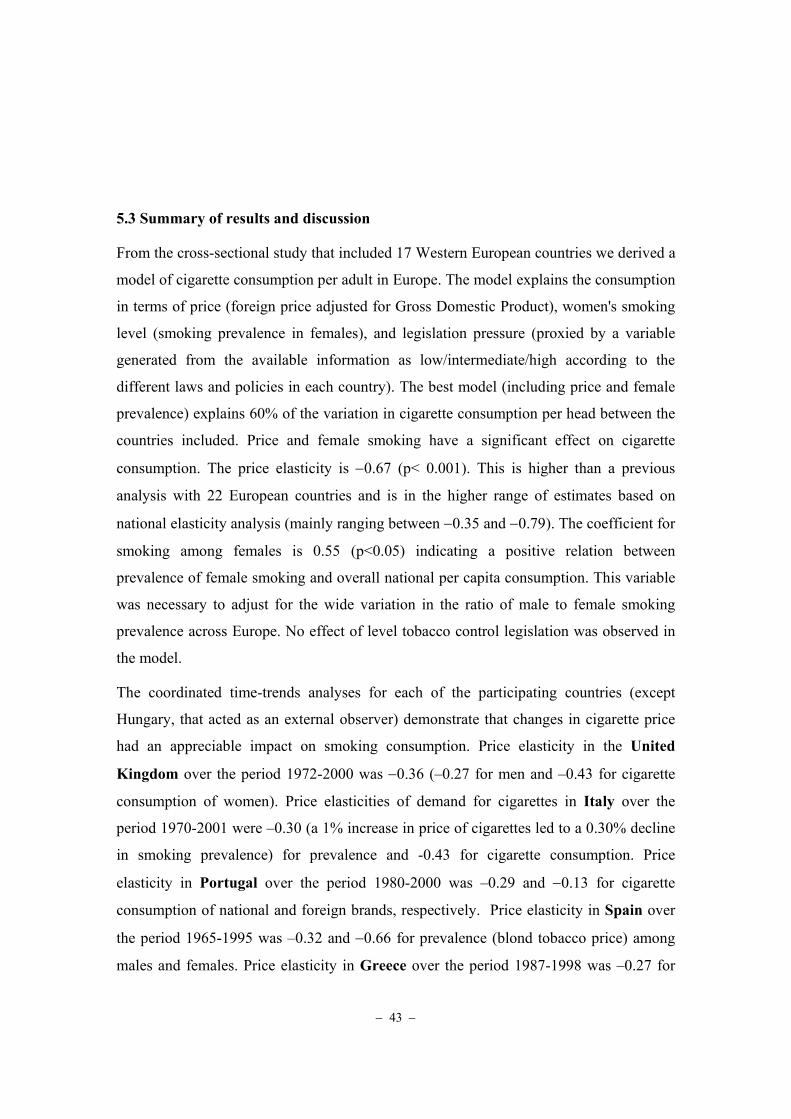
− 43 −
5.3 Summary of results and discussion
From the cross-sectional study that included 17 Western European countries we derived a
model of cigarette consumption per adult in Europe. The model explains the consumption
in terms of price (foreign price adjusted for Gross Domestic Product), women's smoking
level (smoking prevalence in females), and legislation pressure (proxied by a variable
generated from the available information as low/intermediate/high according to the
different laws and policies in each country). The best model (including price and female
prevalence) explains 60% of the variation in cigarette consumption per head between the
countries included. Price and female smoking have a significant effect on cigarette
consumption. The price elasticity is −0.67 (p< 0.001). This is higher than a previous
analysis with 22 European countries and is in the higher range of estimates based on
national elasticity analysis (mainly ranging between −0.35 and −0.79). The coefficient for
smoking among females is 0.55 (p<0.05) indicating a positive relation between
prevalence of female smoking and overall national per capita consumption. This variable
was necessary to adjust for the wide variation in the ratio of male to female smoking
prevalence across Europe. No effect of level tobacco control legislation was observed in
the model.
The coordinated time-trends analyses for each of the participating countries (except
Hungary, that acted as an external observer) demonstrate that changes in cigarette price
had an appreciable impact on smoking consumption. Price elasticity in the United
Kingdom over the period 1972-2000 was −0.36 (–0.27 for men and –0.43 for cigarette
consumption of women). Price elasticities of demand for cigarettes in Italy over the
period 1970-2001 were –0.30 (a 1% increase in price of cigarettes led to a 0.30% decline
in smoking prevalence) for prevalence and -0.43 for cigarette consumption. Price
elasticity in Portugal over the period 1980-2000 was –0.29 and −0.13 for cigarette
consumption of national and foreign brands, respectively. Price elasticity in Spain over
the period 1965-1995 was –0.32 and −0.66 for prevalence (blond tobacco price) among
males and females. Price elasticity in Greece over the period 1987-1998 was –0.27 for
− 44 −
cigarette consumption. Price elasticity in Ireland over the period 1989-1999 was –0.14
for cigarette consumption, but this was non significant and based on inadequate data.
These results are similar across the countries and are in broad agreement with previous
research, conducted mainly in the United States but also in the UK and other selected
Western countries. A recent report from the US Surgeon General reviewed in detail the
effect of prices on demand of cigarettes9. Some general conclusions can be drawn from
the studies of the effects of cigarette prices on smoking. First, increases in cigarette prices
lead to significant reductions in cigarette smoking; most studies, including the results of
this European project, using a wide variety of data and methods with various strengths
and weaknesses, predict that a 10% increase in price is associated with an overall
decrease in cigarette consumption by 3 to 10%. Second, the effects of increases in
cigarette prices include significant reductions in smoking prevalence, as also observed in
this European project for some countries (UK, Italy, Spain) where both type was
available. Hence, the reduction in smoking is not limited to reductions in average
cigarette consumption among smokers but to real decreases in the population prevalence
of smoking. These effects on smoking prevalence are explained both by an increase in
smoking cessation and, although to a lesser extent, by a reduction in smoking initiation
among potential young smokers.
5.4 Dissemination of results
All the results of this European project will be made available on the ad hoc created
website at www.xtpt.net/econ/econsmk.hmt , including the final report and all the
annexes. These annexes include intermediate products of the project itself, such as the
“tobacco country highlights” or the minutes of the project meetings as well as the drafts
of the national papers. The final inclusion f the results in the web site, however, is
conditioned to the permission from the scientific journals where we also intend to publish
9 Economic approaches (Chapter 6). In: US Department of Health and Human Services. Reducing tobacco use: a report of the Surgeon General. Atlanta, Georgia, US: US Department of Health and Human Services. Center for Disease Control and Prevention. National Center for Chronic Disease Prevention and Health Promotion, Office on Smoking and Health; 2000. URL: www.cdc.gov/tobacco/sgr_tobacco_use.htm [accesed October 15, 2002].

− 45 −
the results. The results will be written up for submission to international scientific
journals devoted to smoking prevention and control and to public health, such as
“Tobacco Control”, “Nicotine & Tobacco Research”, the “European Journal of Public
Health”, the “European Journal of Cancer Prevention”, etc. The editorial process
requires more time than that usually allocated to this type of project (dissemination
through scientific journals lasts between 4 and 8 months after finishing the papers). The
research team will maintain up-to-date the website in the future with the final (and
accepted for publication) versions of the papers.
However, we intend to disseminate the results by e-mailing a short message with the
executive summary of the project (and the website address) through GLOBALink, the
international electronic network for prevention and control of tobacco, as well as through
related e-mail list servers (ENSP, national coalitions, etc.).
Another relevant form to disseminate the results will be through their presentation in
national and international scientific tobacco control meetings (such as the meetings of the
national coalitions against tobacco and the World and the European Conference on
Tobacco or Health). These presentations, however, are subject to availability of funds not
included in the current agreement. Presentations at meetings are compatible with the
submission of the papers to the scientific journals.
− 46 −
6. Conclusions
• Price elasticities in each of the participant countries varied from –0.13 to –0.70 and were mostly around −0.3, for smoking measured as cigarettes per capita or as prevalence (proportion) of consumption across countries. The results from the cross-sectional analysis also indicate a high price elasticity of cigarette consumption. Differences between countries were not significant and such differences as there were may be attributed to the availability (and quality) of the data and to random error.
• Although a coordinated effort was made to conduct similar analyses in each country, the scarce availability of smoking data (particularly for Ireland, Greece, and Portugal) including related information on smuggling, limits the comparability of the results obtained. Thus, this project highlights the need to coordinate and standardize health information systems across the European Union.
• The lack of homogeneity in data sources can be interpreted as a limitation. However, the overall agreement of the results obtained −using a similar approach but with rather different data for different periods− supports the consistency and validity of the results.
• Since individuals in lower socio-economic groups are more influenced by price (analysis from UK), any intervention on the price of cigarettes would tend to be most effective on the smoking habits of socio-economic groups with the highest smoking prevalence (as observed in most South European countries). The same applies to adolescents and young men and women, whose smoking prevalence has risen over the last few years, and who remain a key target for any tobacco control critical intervention in the long term.
• Increases in tax revenue from cigarette tax rises, could be allocated for tobacco control and prevention of tobacco-related diseases, since currently in the European countries, only limited revenue from tobacco tax revenue is spent for tobacco control.
• The present analyses confirm the existence of an inverse relation between price and prevalence/consumption of cigarettes in several European countries and indicate that interventions at the economic level may well have strong public health implications for tobacco control. It is also important to note that, with the exception of the UK, information on this issue was almost non existent for the participating countries. This study provides an important first step in examining these relationships at an individual European country level.

− 47 −
7. Project partners
The project partners are located in six European Union countries (Spain, UK, Greece,
Portugal, Ireland, and Italy) as well as in an accession country (Hungary). Hungary has
had no specific budget for the implementation of the project but has been in contact (with
different intensity) in the different phases of the project. An effective communication
between the different partners (including Hungary) has been maintained from the
coordinators (in Spain and UK) thru the two planned project meetings (held in Barcelona)
and continous e-mail and telephone contacts.
A list with the national research teams follows, indicating the Principal Investigator (PI)
in each country and the names of the other researchers who have contributed to different
phases of the project within each country.
Spain (project coord.)
Esteve Fernandez (PI), Anna Schiaffino, Joan R. Villalbí; Angel López Cancer Prevention and Control Unit. Catalan Institute of Oncology 08028 Barcelona Phone: +34 932607788 Fax: +34 932607956 E-mail: [email protected]
United Kingdom (project coord.)
Joy Townsend (PI), Susan Griffin Health Economics Research Group. Brunel University, Uxbridge, UK Phone: +442079272185 Fax: +442076373238 E-mail: [email protected]
Hungary (observer)
Tibor Demjen (PI) National Institute for Health Promotion. Andrassy ut 82; H-1062 Budapest. Phone/fax +36 13125020 E-mail [email protected]
Italy
Carlo La Vecchia (PI), Silvano Gallus Laboratory of General Epidemiology. “Mario Negri” Institute, Milan Phone: +39 02390141; Fax: +39 0233200231 E-mail: [email protected]
Ireland
Cecily Kelleher (PI), Saoirse Nic Gabhainn, Orla Walsh Health Promotion Dept. National University of Ireland, Galway, Ireland Tel: +35391750319 Fax: +35391750547 E-mail: [email protected]
Greece
Nicolas Kordiolis (PI), Lina Tsanira, Maria Pilali, Dina Pateraki, Niki Apostolidou Hellenic Cancer Society; 18-20 Tsoha Street 11521 Athens; Greece. 18-20 An. Tscha Str. 11521 Athens Tel +30 1064 5671315 Fax +30 10644 10011 E-mail: [email protected]
Portugal
Henrique Barros (PI), Ana Patricia Padrao Dpt of Hygiene and Epidemiology, Porto Medical School; University of Porto. Alameda Prof Hernâni Monteiro; Porto, Portugal. Phone. +351225507597; Fax: +3512-5510119 E-mail: [email protected]

− 48 −
Pictures of the project partners at the end of the second meeting (Barcelona, July 11-12, 2002)
From left to right: Anna Schiaffino, Silvano Gallus, Carlo La Vecchia, Esteve Fernandez, Ana Patricia Padrao, Henrique Barros, Lina Tsanira, Nicolas Kordiolis, Joy Townsend & Susan Griffin
From left to right: Ana Patricia Padrao Anna Schiaffino, Carlo La Vecchia, Esteve Fernandez, Silvano Gallus, Joy Townsend, Susan Griffin, Henrique Barros, Nicolas Kordiolis, & Lina Tsanira

− 49 −
8. Financial report Here we present the consolidation sheet for the overall project. The detailed income and
expenditures for each of the partners are presented in Annex 10.
Budgeted Expenditures REAL
COSTS Budgeted Income REAL
INCOME Direct Eligible Costs (D) Commission funding
requested 82,055.65 82,811.90
Personnel costs 72,990.00 75,888.70 Contribution pertaining to national officials
Travelling and DSA 13,075.90 10,980.48 Applicant's financial contribution
27,579.79 36,275.29
Miscellaneous services 5,420.00 5,687.81
Administration 14,639.27 14,826.72 Income generated by the project
Reserve for unexpected costs
5,306.26 5,367.03
Other external resources 8,200.00 0.00
Indirect Eligible Costs (I)
General costs 6,404.01 6,336.45 Other current funding applications
Contribution in kind (K) Contribution in kind (K)
Unpaid voluntary work… 30,200.00 30,263.42 30,200.00 30,263.42
Contribution in kind essential to…
Grand Total 148,035.44 149,350.61 Grand Total 148,035.44
149,350.61

− 50 −
9. Glossary Cigarette consumption Defined here as the mean number of cigarettes smoked per adult over 15 years (over 16 for some country analysis) (per day or per year, and in some case by sex, age, or other socioeconomic characteristic). Current cigarette price UK Retail price index of cigarette prices (weighted price of different brands) Current cigarette price Italy and Spain Retail price index of cigarette prices (average price of different brands according to legal sales and consumption). In Spain, calculated separately for blond and black tobacco. Current cigarette price (other countries) Price of the most popular (foreign, local) brand or the benchmark brand Cross sectional analysis Analysis using data for one time period across different countries (each country is a unit) Income elasticity of demand for cigarettes Percentage change in cigarette consumption for a 1% change in real income Price elasticity of demand for cigarettes Percentage change in cigarette consumption following a 1% change in real price Prevalence of smoking Proportion (%) of population (over 16 years Spain, over 15 years Italy, over 19 years Portugal) smoking at least 1 cigarette daily; smoking at all nowadays (UK). It is generally obtained from Health Interview Surveys or cross-sectional (“prevalence”) studies Real price of cigarettes Current cigarette price divided by the consumer price index Time series analysis Analysis using data for one country for different time periods (eg each year is a unit)

− 51 −
10. Annex

This report was produced by a contractor for Health & Consumer Protection Directorate General and represents the views of thecontractor or author. These views have not been adopted or in any way approved by the Commission and do not necessarilyrepresent the view of the Commission or the Directorate General for Health and Consumer Protection. The EuropeanCommission does not guarantee the accuracy of the data included in this study, nor does it accept responsibility for any use madethereof.