Embed Size (px)
Citation preview
1
Economic and Poverty Impacts of Agricultural,
Trade and Factor Market Reforms in China
Fan Zhai
Asian Development Bank Institute
Tokyo
Thomas Hertel
Center for Global Trade Analysis
Purdue University
Agricultural Distortions Working Paper 98, June 2009
This is a product of a research project on Distortions to Agricultural Incentives, under the leadership of Kym Anderson of the World Bank’s Development Research Group. The authors are grateful for funding from World Bank Trust Funds provided by the governments of Japan, the Netherlands (BNPP) and the United Kingdom (DfID). This paper will appear in Agricultural Price Distortions, Inequality and Poverty, edited by K. Anderson, J. Cockburn and W. Martin (forthcoming 2010). This is part of a Working Paper series (see www.worldbank.org/agdistortions) that is designed to promptly disseminate the findings of work in progress for comment before they are finalized. The views expressed are the authors’ alone and not necessarily those of the World Bank and its Executive Directors, nor the countries they represent, nor of the institutions providing funds for this research project.
Pub
lic D
iscl
osur
e A
utho
rized
Pub
lic D
iscl
osur
e A
utho
rized
Pub
lic D
iscl
osur
e A
utho
rized
Pub
lic D
iscl
osur
e A
utho
rized
Pub
lic D
iscl
osur
e A
utho
rized
Pub
lic D
iscl
osur
e A
utho
rized
Pub
lic D
iscl
osur
e A
utho
rized
Pub
lic D
iscl
osur
e A
utho
rized
2
Abstract
Capitalizing on the most recent estimates of agricultural price distortions in China and in
other countries, this paper assesses the economic and poverty impact of global and domestic
trade reform in China. It also examines the interplay between the trade reforms and factor
market reforms aimed at improving the allocation of labor within the Chinese economy. The
results suggest that trade reforms in the rest of the world, land reform and hukou reform all
serve to reduce poverty, while unilateral trade reforms result in a small poverty increase.
Agricultural distortions are important factors in determining the distributional and poverty
effects of trade reform packages, although their impacts on aggregate trade and welfare
appear to be small. A comprehensive reform package which bundles the reforms in
commodity and factor markets together may benefit all broad household groups in China.
JEL codes: D30, D58, D63, F13, O53, Q18
Keywords: Poverty, trade liberalization, agricultural policy, factor market reforms
Author contact details:
Thomas W. Hertel Distinguished Professor and Executive Director Center for Global Trade Analysis Purdue University West Lafayette, IN 47907-1145 Phone +1 765 494 4199 [email protected]
Economic and Poverty Impacts of Agricultural,
Trade and Factor Market Reforms in China
Fan Zhai and Thomas Hertel
As the most populous nation in the world, China plays a critical role in the determination of
the global poverty headcount. Indeed a considerable portion of the reduction in the latter can
be attributable to the remarkable reduction in poverty incidence in China over the past two
decades. Chen and Ravallion (2004) find that, in 1981, 65 percent of the population in China
was in extreme ($1/day) poverty, whereas by 2001, this figure had fallen to nearly 12 percent.
These authors show that much of this poverty reduction was driven by reforms in the
agricultural sector. These advances notwithstanding, rural poverty continues to dominate the
national poverty headcount in China, and the headcount is highest among households which
are specialized in farming. Furthermore, there is evidence that, despite rapid economic
growth, the rural-urban wage gap is widening (Sicular et al. 2007). And within the rural
sector, rapid non-agricultural income growth and slow agricultural income growth since the
1990s is contributing to increased rural inequality (Benjamin et al. 2007). Therefore, the
agricultural sector continues to play an important role in the determination of national
poverty and inequality in China. In this chapter, we focus on the impact of agricultural, trade
and rural policy reforms – both at home and abroad – on poverty and inequality in China.
The impact of trade reforms on poverty and inequality in China has been a topic of
intense research over the past decade, culminating in a number of studies focusing on the
impact of China’s accession to the WTO on poverty (e.g., see Bhattasali, Li and Martin
2004). Chen and Ravallion (2004) examine these impacts at a highly disaggregate level using
earnings and price estimates from another study, and estimate that WTO accession will
benefit urban households – particularly poor urban households. However, their prediction of
the impact of WTO accession on rural households is that falling rural wages and increases in
consumer prices for these households are likely to hurt the rural poor. In a companion study,
Hertel, Zhai and Wang (2004) aggregate households to a greater degree, but incorporate them
2
directly into their CGE model of China. They, too, conclude that WTO accession would be
relatively more favorable for urban households, but they argue that whether or not rural
households will lose from these reforms depends critically on the degree of off-farm labor
mobility. At low (or zero) mobility, as assumed by Chen and Ravallion, the poorest rural
households lose from reform but, as the off-farm labor supply elasticity rises, the potential for
farm households to gain increases.
In closely related work, Hertel and Zhai (2006) contrast the impacts of commodity
market reforms, such as those initiated under China’s WTO accession, with factor market
reforms aimed at facilitating an improved flow of labor out of agriculture and between the
rural and urban markets. They find that the latter can result in significant gains for rural
households. Specifically, those authors explore the implications of (a) reforming agricultural
land markets to permit arms-length land rental in all rural areas, thereby facilitating the
permanent movement of labor out of farming, (b) enhancing off-farm labor mobility, and (c)
abolishing the hukou system, thereby reducing the transaction costs imposed on rural–urban
migrants. When combined, these reforms reduce the estimated 2007 urban-rural income ratio
from 2.58 (in the absence of WTO accession) to 2.09. When WTO accession is additionally
added to this mix of policy reforms, the 2007 urban-rural income ratio is still reduced – but
not quite as much – to 2.12. Given the importance of the labor market distortions for poverty
and inequality in China, we pay special attention to their presence in this study as well.
In this chapter we update the model used in earlier studies (to reflect the most recent
Chinese Social Accounting Matrix) and capitalize on the most recent estimates of agricultural
price distortions which have changed significantly since China’s accession to the WTO. We
also bring to bear new farm price distortions estimates for other developing countries,1 in
order to make an assessment of the impact of global trade reform on poverty and inequality in
China. Unlike our earlier work, which focused solely on China’s own reforms associated with
WTO accession, here we explore the impacts of reforms in the rest of the world as well as in
China. Additionally, we decompose these impacts in two ways: first by region (China versus
the rest of the world), and secondly by sector (agriculture versus non-agriculture). We also
examine the interplay between these commodity market reforms and factor market reforms
aimed at improving the allocation of labor within the Chinese economy.
1 Estimates of agricultural protection/assistance for China, based on Huang et al. (2009), are incorporated in the World
Bank’s global agricultural distortions database (Anderson and Valenzuela 2008). Those estimates cover five decades, but the representative values for developing country agriculture as of 2004 that are used in the global CGE modeling for this study are summarized in Valenzuela and Anderson (2008).

3
This chapter is organized as follows: the next section describes the specification of the
CGE model used in this study. We then assess the impact of eliminating agricultural price
distortions in rest of the world, as well as reducing China’s own distortions in commodity and
factor markets, on China’s macro-economy, agricultural production and poverty. The final
section offers conclusions.
The model and data The Chinese model used in this study is an updated version of the household-disaggregated
CGE model which we used to study the economic and poverty effects of WTO accession and
Doha round trade liberalization on China (Hertel, Zhai and Wang 2004, Hertel and Zhai
2006, Zhai and Hertel 2006). The model has its intellectual roots in the group of single-
country, applied general equilibrium models used over the past two decades to analyze the
impact of trade policy reform. The updated version in this chapter has a more recent
benchmark dataset based on 2002 Chinese Input/Output table and a very detailed sectoral
disaggregation for agriculture and food. In this section we describe the main features of the
model.
Household behavior
Following our previous work, we disaggregate rural and urban households into 40 rural and
60 urban representative households according to their primary source of income and relative
income level. In light of the fact that the focus here is on agricultural incentives, we seek to
highlight those households that depend exclusively on farming for their incomes.
Accordingly, we stratify the rural households by agriculture-specialized (more than 95
percent of household income from farming) and diversified (all other). We are also interested
in the impacts of restrictions on rural-urban labor mobility, so we separately identify urban
households and group them into three strata: transfer-specialized, labor-specialized and
diversified. Within each stratum, we order households from poorest to richest, based on per
capita income, and then group them into 20 vingtiles, each containing 5 percent of the
stratum population.
4
Household income derives from labor income, profits from family-owned agricultural
and non-agricultural enterprises, property income and transfers. Households consume goods
and services according to a preference structure determined by the Extended Linear
Expenditure System (ELES). Through specification of a subsistence quantity of each good or
service, this expenditure function generates non-homothetic demands, whereby the larger the
relative importance of subsistence consumption (e.g., it would be high for rice, and low for
automobiles) the more income-inelastic the household’s demand for that good.
The other important dimension of household behavior is the supply of labor to off-farm
activities. In China, the off-farm labor supply decision is complicated by institutional factors
which have been built into the system in order to keep the agricultural population in place,
among which the rural land tenure system is one of most widely-discussed (Zhao 1999b). The
absence of well-defined land tenure has served to raise the opportunity cost of leaving the
farm (Yang 1997). Households that cease to farm the land may lose the rights to it, so they
have a strong incentive to continue some level of agricultural activity, even when profitability
is quite low (Zhao 1999a). With only modest growth in rural, non-farm activities, this
seriously limits the ability of households to obtain off-farm work (Zhao 1999b).2 Although an
active land rental market has emerged in some regions in recent years, the overall level of
land rental transactions is still low, with around 10-15 percent of rural households renting
land in/out (Deininger and Jin 2005, 2007, Wang, Herzfel and Glauben 2007). Empirical
studies have found that the transaction costs associated with land rental are significant, and
the absence of an efficient land rental market remains a substantial barrier to the facilitation
of off-farm participation of rural labors (Deininger and Jin 2005, Wang, Herzfel and Glauben
2007).
In this study we model rural households as maximizing the total return to their labor
supply, which is offered in both the on-farm and off-farm labor markets. However, the ability
of households to shift labor between these two labor markets is constrained by a number of
factors including education, experience, and simple geography, which can serve to isolate
farm households from the non-farm labor market. We proxy the combined impact of these
factors with a single, finite, constant elasticity of transformation (CET). The labor allocation
between farm and off-farm jobs is determined by the ratio of the shadow value of labor in
agriculture, relative to the off-farm wage rate, and this elasticity of transformation.3 The CET
2 However, as noted by Parish, Zhe and Li (1995), the rural labor market is looking more like an open market all the time. 3 See Hertel and Zhai (2006) for details of off-farm labor supply behavior in the model.
5
parameter governs the off-farm labor supply elasticity, for which we adopt the estimate of
2.67 by Sicular and Zhao (2004) as the overall farm/off-farm transformation elasticity for the
total rural labor force. The empirical study by Zhang, Huang and Rozelle (2002) suggests that
this elasticity increases by 0.58 for an additional year of schooling. This is translated into the
farm/off-farm transformation elasticity of 0.68 for unskilled labor and 4.01 for semi-skilled
labor.4
Owing to the absence of an effectively functioning land market, the shadow value of
labor in agriculture in this function takes into account the potential impact which reducing
agricultural employment will have on the household’s claim to farm land. This incremental
factor is calculated as the marginal value product of land, multiplied by the probability that
the household will lose its land as a result of off-farm migration. In order to make this
amenable to use in a model of the representative farm household, with continuously variable
labor and land use, we translate this probability into a simple elasticity of land income with
respect to on-farm labor. The higher this elasticity, the greater the probability that the farmer
will lose his land if he shifts to an off-farm job. The benchmark elasticity in our model is 0.5,
that is, a ten percent reduction in on-farm work results in a 5 percent loss of land income.
However, for purposes of sensitivity analysis we also report results from two extreme
simulations. In the first, the elasticity of land income with respect to off-farm work is zero.
This is the case of a perfectly functioning land rental market with no chance of land loss. In
the second sensitivity analysis, the elasticity is set equal to one, such that the farmer leaving
his farm to work in the city is virtually guaranteed of losing his land. By comparing these two
extremes, we gain an appreciation for how important land market reform might be for
inequality.
Rural-urban migration
Migration is a key part of the rural economy in China. According to rural household survey
data collected in 2003 and compiled by Liu, Park and Zhao (2006), 19.4 percent of all rural
workers participated in migratory work in that year, and more than 40 percent of all
households had at least one member who was a migrant in 2003. More than half of the
migrants left their province, and most of these migrated to the coastal provinces where
4 Given the very small number of skilled farm workers in China, this segment is ignored in our analysis. See Zhai and Hertel
(2006) for details of the derivation of the off-farm labor supply elasticity.
6
manufacturing activity and exports have been booming. The 2000 census estimated that the
total number of migrants in China was 131 million, of which nearly two-thirds were non-
hukou migrants. (Households without the hukou urban registration face limited access to
many of urban amenities, including housing and education.) Rural-urban migration was the
largest form of migration and amounted to more than 50 million in the 2000 census (Cai,
Park and Zhao 2007). This massive migration is a rational response to the enormous rural-
urban wage gap that exists in China, which Sicular et al. (2007) recently placed at 2.27 (the
ratio of urban to rural per capita disposable income in 2002) after adjusting for housing
subsidies and spatial price differences. Remarkably, they find no evidence of this gap
declining. Indeed, if anything, the ratio of urban to rural incomes appears to have risen
slightly between 1997 and 2002. This is hardly the outcome that a standard, general
equilibrium model with perfect labor mobility would predict! Clearly there are some
important barriers to labor movement in China that need to be considered if one hopes to
accurately assess the impact of commodity market reforms on rural and urban employment,
wages and household income.
While the rural-urban per capita income gap is an indication of a potential labor market
distortion, what we really want to know is the hourly wage differential for workers of
comparable skill and ability. If there were no barriers to the movement of labor between rural
and urban areas, we would expect real wages to be equalized for an individual worker with
given characteristics. Shi, Sicular and Zhao (2002) explore the question of rural-urban
inequality in greater detail for nine different provinces using the China Health and Nutrition
Survey (CHNS). The authors conclude that the apparent labor market distortion is about 42
percent of the rural-urban labor income differential and 48 percent of the hourly earnings
differential.5 When applied to their estimated average wage differential, this amounts to an ad
valorem rate of apparent transactions “tax” on rural wages of 81 percent.6
We model these transactions costs as real costs that are assumed by the temporary rural
migrants who move to the urban areas without hukou urban registration. Of course these
migrants are heterogeneous and the extent of the burden varies widely. Those individuals
who are single and live close to the urban area in which they are working are likely to
5 There are likely other, unobserved factors inducing this rural-urban wage differential, in which case estimation of the labor
market distortion via subtraction of known factors is biased in the direction of overstating the hukou-related distortion. Therefore, it is useful to also estimate the direct impact of household registration status on the observed wage difference among households. Shi (2002) takes this approach to the problem, using the same CHNS data set. He finds that only 28 percent of the rural-urban wage difference can be explained directly via the coefficient on the hukou registration variable. This is quite a bit less than the 48 percent left unexplained via the subtraction approach of Shi, Sicular and Zhao (2002).
6 See Hertel and Zhai (2006) for a detailed description of how this ad valorem distortion is obtained.
7
experience minor inconvenience as a result of this temporary migration. We expect them to
be the first to migrate (ceteris paribus) in response to higher urban wages. On the other hand,
some migrants have large families and come from a great distance. Their urban living
conditions are often very poor and it is not uncommon for them to be robbed on the train
when they are returning home after their work. For such individuals, the decision to migrate
temporarily is likely to be a marginal one – and one which they may or may not choose to
repeat. With this heterogeneous population in mind, we postulate a transactions cost function
that is increasing in the proportion of the rural population engaged in temporary work. This
transactions cost function has a simple, constant elasticity functional form, which begins at
the origin, reflecting those migrants for whom there is essentially no cost due to their
proximity to urban areas, and reaches the observed wage gap (adjusted for transport and
living costs) at the current level of temporary migration (about 70 million workers). We
assume that further increases in temporary migration have only a modest impact on these
transactions costs.7 Finally, it is important to note that only a portion of these observed
transactions costs can be attributed to the government’s formal policy of migration restriction
– the hukou system. Indeed, Shi (2002) finds that only 28 percent of the rural-urban wage
difference can be explained directly via the coefficient on the hukou registration variable. We
will take this into account later in our study, when we investigate the implications of the
Chinese government undertaking labor market reforms.
Production and trade
Production in each of the sectors of the economy is modeled using nested constant elasticity
of substitution (CES) functions, and constant returns to scale is assumed. In the top level of
the nest, value-added and a composite of intermediate inputs produce outputs. Then a further
CES function disaggregates the value-added into capital-labor composite and agricultural
land. Capital-labor composite is further split into the capital-skilled labor composite and the
aggregated less-skilled labor. The capital-skilled labor composite consists of capital and
skilled labor, while aggregated less-skilled labor is composed of semi-skilled labor and
unskilled labor. A low substitution elasticity of 0.3 between capital and skilled labor is
assumed here to introduce the capital-skill complementarity. The elasticity of substitution
between semi-skilled labor and unskilled labor is set to 1.5, based on estimates for the United
7 We assume that a doubling of temporary migration would only increase the marginal cost of migration by 10 percent.

8
States by Katz and Murphy (1992) and Heckman and Lochner (1998).
Each sector employs a labor composite comprising both rural and urban labor that
substitute imperfectly. This is an indirect means of building into the model a geographic
flavor, since some sectors will be located largely in urban areas while others will be
predominantly in rural areas. By limiting the substitutability of rural and urban labor in each
sector, we are able to proxy the economic effect of geographically distributed activity. Ideally
we would model the geographic distribution of industrial activity, but unfortunately the data
do not exist to support this split.
All commodity and factor markets are assumed to clear through prices. In the case of
rural labor markets, there is a segmentation between agricultural and non-agricultural labor:
these two markets are linked imperfectly through the CET parameter discussed previously.
Once transactions costs associated with temporary migration are accounted for, rural wages
are equated with urban wages. Capital is assumed to be fully mobile across sectors. Import
demand is modeled using the Armington assumption, i.e. domestic products are assumed to
be differentiated from foreign products. On the export side, it is assumed that the firms treat
domestic and export markets equally. Thus the law of one price holds, that is, the export price
is identical to that of domestic supply. The small country assumption is assumed for imports
and so world import prices are exogenous in terms of foreign currency. Exports are
demanded according to constant-elasticity demand curves. Therefore the terms of trade for
China are endogenous in the simulations. The value of export demand and Armington
elasticities are based on the elasticities used in the global CGE model LINKAGE (van der
Mensbrugghe 2005).
The benchmark data
A Chinese social accounting matrix (SAM) is estimated for the year 2002 to serve as the
benchmark data set for model calibration. The SAM contains 48 sectors of production and
100 representative households, based on the 2000 household survey data for three provinces
(Guangdong, Sichuan, and Liaoning) and the most recent 2002 Input-Output table. Since the
2002 Input-Output table has only one crop sector and one livestock sector, we disaggregate
these two sectors into eight crop sectors and four livestock sectors according to the
corresponding GTAP sector classification (Hertel 1997). The information about the structure
of production, demand, inputs and trade from GTAP database version 7.0 are used for the

9
sectoral disaggregation and we employ the cross-entropy method to balance the SAM (see
Robinson, Cattaneo, and El-Said 2001).
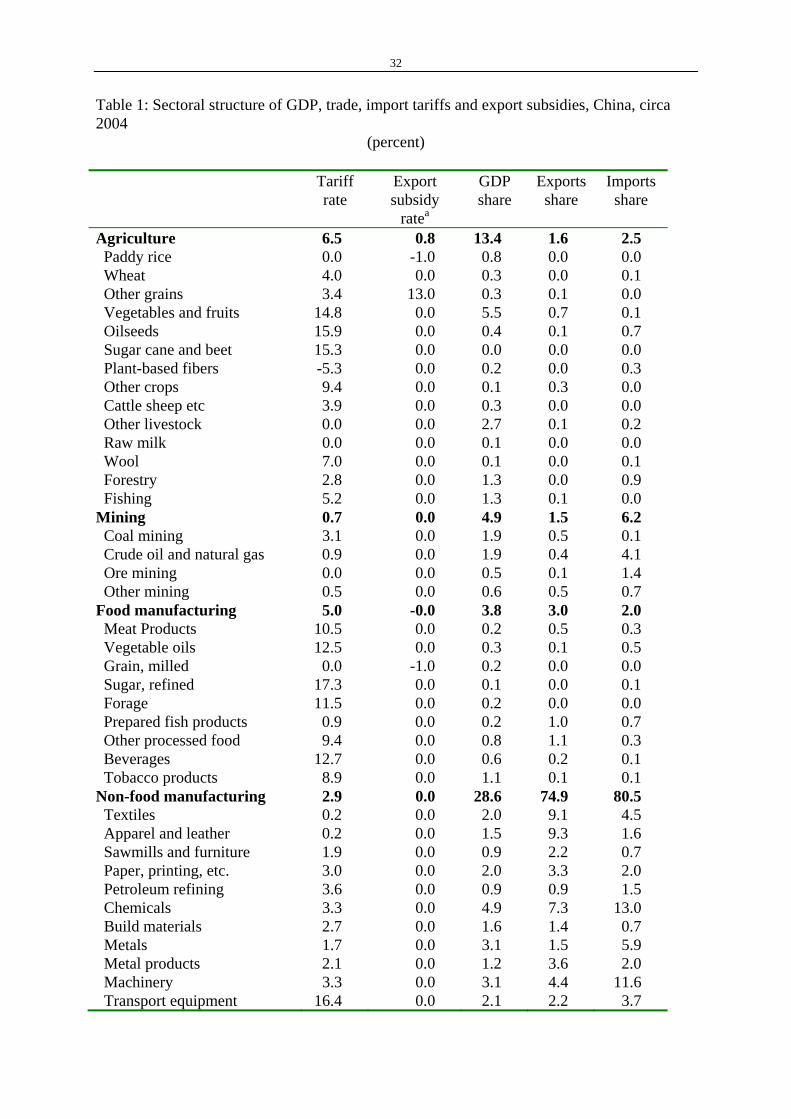
The base year tariffs and export subsidies/taxes are reported Table 1. Protection rates for
lightly processed food and agricultural products are obtained from Huang et al. (2009) and
from the GTAP database, version 7.0. For other primary goods and manufacturing products,
tariffs are estimated based on collected revenue of import tariffs and base year imports by
commodities. As shown in Table 1, China’s tariff structure provides more protection for food
and agricultural products than non-food manufacturing goods. Moreover, the import tariff
rates show considerable cross-sector variation within agriculture: vegetables and fruits,
oilseeds and sugar cane and beet have high tariff rates of around 15 percent, while imports of
plant-based fibers appear to be effectively subsidized.
Columns 3-5 of Table 1 present China’s sectoral shares of GDP, exports and imports.
Despite the diminishing importance of the agricultural sector in the Chinese economy over
the last two decades, agriculture still accounts for 13.4 percent of GDP. Vegetables, fruits and
livestock are key sources for agricultural value-added. Manufacturing value-added is 32
percent of the economy-wide total. Chemicals, metals and machinery lead the way, followed
by sectors related to electronics, textiles and apparel. Non-food manufacturing is very export
intensive, accounting for 75 percent of Chinese exports. Electronics, textiles, apparel,
chemicals and machinery are the major exporting sectors. These sectors also represent a
relatively large share of imports, reflecting the significant presence of processing trade in
China. On the other hand, China’s agricultural and food manufacturing sectors have very
limited trade exposure. Agriculture accounts for only 1.6 percent of exports and 2.5 percent
of imports. Vegetables and fruits are major agricultural exports while agricultural imports are
concentrated in oilseeds, cotton and forestry products.
Simulation design To explore the implications of agricultural distortions at home and abroad for the Chinese
economy, we consider six policy reform scenarios that eliminate various distortions in global
trade and in China’s domestic commodity and factor markets. These scenarios are
summarized in Table 2. The first two scenarios examine the effects of trade liberalization in
10
the Rest of the World. ROW-Ag, considers the impact of agricultural liberalization in the
form of elimination of import tariffs and export subsidies, as well as subsidies for domestic
production, in agriculture and lightly processed food sectors in rest of the world. The second
scenario involving Rest of World policies across all merchandise commodities (ROW) looks
at a broader-based trade liberalization. It combines the removal of policy distortions in
agricultural and lightly processed food sectors in Scenario 1 with tariff elimination for non-
agricultural goods in the rest of the world.
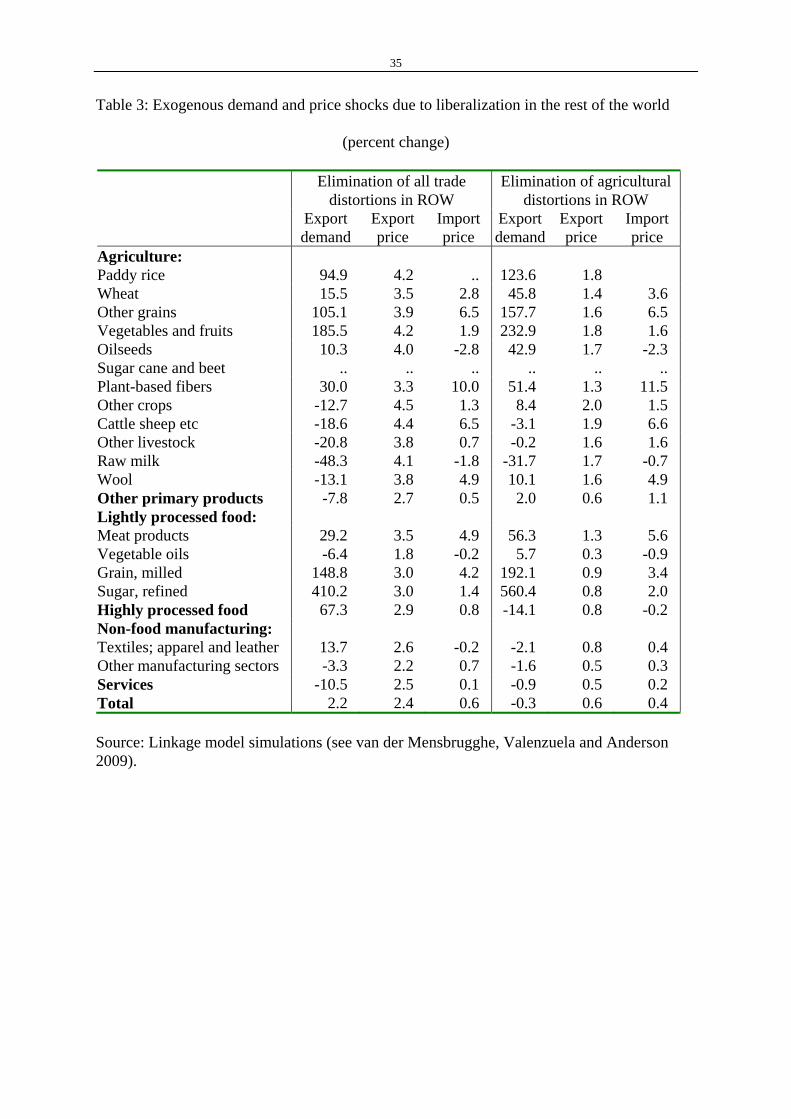
We incorporate the impacts of trade reforms in the rest of the world in the Chinese CGE
model through exogenous changes in import prices and export demands. The sizes of these
exogenous trade shocks are obtained from the global CGE model Linkage, omitting China’s
reforms in the process. Table 3 lists the external shocks imposed in the ROW and ROW-Ag
scenarios.8 It shows there are some enormous percentage increases in China’s agricultural
and food export volumes (“export demand”) generated by the elimination of very high rates
of protection elsewhere in Asia. Rice, other grain, vegetable and fruits, and refined sugar all
show very large proportionate increases. Of course the associated output volume changes are
often quite modest, as China is not a large exporter of most of these products (recall Table 1).
China’s export volume declines in most livestock sectors, reflecting relatively smaller ROW
barriers faced by its exporters in these sectors.
China’s average export price increases by 2.4 percent while average import price
increases by just 0.6 percent (both relative to the price of OECD manufacturing exports) in
the case of a broad-based trade reform, indicating a gain in its terms of trade when other
countries liberalize and China does not. However, given the relatively greater importance of
manufacturing exports to China, if liberalization is confined to the agricultural sectors, the
terms of trade improvement diminishes, with a 0.6 percent increase in average export price
and 0.4 percent increase in average import price. The increase in sector export prices range
from 1.8 to 4.5 percent in the case of broad-based trade liberalization and from 0.3 to 2.0
percent in the case of agricultural liberalization only, with food and agricultural prices rising
relative to non-food prices in both cases.
The changes in China’s import prices show much greater sector variation. The import
prices of most food and agricultural products rise more than non-food products, reflecting the
elimination of agricultural subsidies in OECD countries. However, the world price of China’s
oilseed imports declines by 2.8 and 2.3 percent, respectively, in these two scenarios, largely
8 Annex Table A.1 provides the mapping between 48 sectors in Chinese CGE model and 23 sectors in Linkage model.
11
due to the elimination of the very high export taxes for soybean exports from Argentina
which becomes a dominant source for oilseed imports into China in the wake of their
elimination.
The next two scenarios focus on the impacts of China’s own trade liberalization.
Scenario 3 (DOM-Ag) eliminates the import tariffs and export taxes and subsidies for China’s
agricultural goods and lightly-processed foods. In Scenario 4, DOM, the tariff elimination is
extended to non-agricultural sectors. These two scenarios are intended to show the effects of
distortions in China’s factor markets. Scenario 5 (LABOR) examines the impact of a
relaxation of the hukou system such that the ad valorem tax equivalent of the indirect
transaction costs are reduced from 81 to 34 percent (when evaluated at current levels of
migration). As noted above, this is the portion of the observed differential in wages that has
been directly attributed to possession of a hukou certificate. In scenario 6 (LAND), we
consider the impact of relaxing one of the important barriers to off-farm labor mobility,
namely, the absence of well-defined property rights for agricultural land. As noted
previously, this leads to the retention of additional labor in the farm sector. The reason for
this is that farm households presently tend to include the returns to communal land in their
decision to work on- or off-farm, since leaving the farm means potentially forgoing rights to
their farm land. This scenario introduces a land reform such that farm households migrating
to the city can keep full land returns by renting their land out, and thereby only need consider
the ratio of the marginal value products of their labor in agriculture and non-farm rural wages
in deciding where to work.
In all six scenarios, government real spending and real saving (deflated by the GDP
deflator) are fixed at their base year levels. Thus the policy reforms are assumed to be
revenue neutral, with a unified, endogenous factor income tax designed to replace lost
government tariff revenue. The goal of this tax replacement closure is to avoid unrealistic
macro-economic effects of tariff removal, while having a relatively neutral impact on
inequality. Foreign saving is also fixed in foreign currency terms and the real exchange rate
adjusts endogenously in order to maintain current account balance. Total investment is
endogenously adjusted, driven by the changes in households and enterprises savings.
Impacts of reforms on China’s economy
12
In this section we examine the impacts of the above scenarios in turn on the macroeconomy,
on poverty and inequality, and then on households and sectors.
Macroeconomic effects
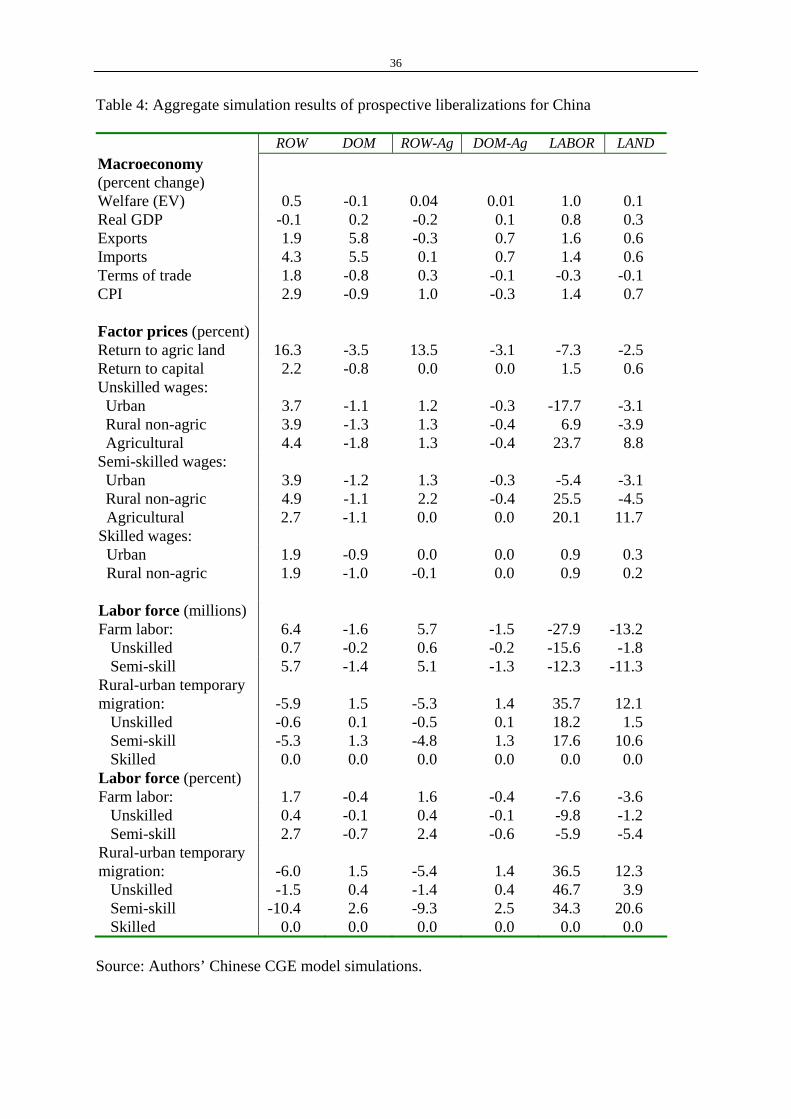
The macro-economic results from these simulations are reported in Table 4. We begin by
focusing on the two scenarios of broad-based commodity trade liberalization (ROW and
DOM , reported in the first two columns). The elimination of trade distortions in all
commodity sectors gives a substantial boost to trade in China, with both exports and imports
rising by more than 5 percent in the unilateral liberalization scenario and by 2-4 percent in
the scenario of trade liberalization in rest of the world (first two columns of Table 4).
Aggregate welfare effects, which we proxy by the summation of equivalent variation
(EV) of individual households and the representative firm,9 are generally quite small, as one
would expect in a model with fixed endowments, perfect competition and constant returns to
scale. Composite EV is projected to increase by 0.5 percent of GDP in the case of trade
liberalization in rest of the world, due to improved terms of trade. By contrast, there is a
small deterioration in welfare under unilateral liberalization due to a deterioration in China’s
terms of trade. This reflects China's relatively low import protection following WTO
accession, as well as her growing influence in world export markets where trade expansion
tends to depress export prices.
With fixed labor endowments and capital stocks, and assuming fixed unemployment and
no productivity changes, real GDP changes little under both trade liberalization scenarios.
The small decrease under ROW is driven by the ensuing labor reallocation from non-
agriculture to agriculture. The stronger demand in China’s agricultural exports following
elimination of trade barriers in the rest of the world diverts the labor force from high-
productivity manufacturing sectors to lower productivity agricultural sectors.10 As a
consequence, real GDP declines slightly. This contrasts with China’s unilateral trade
liberalization, where the elimination of the relatively higher import protection in agricultural
sectors encourages the movement of the labor force from rural, agricultural sectors to urban,
non-agricultural activities, leading to an increase in GDP.
9 The EV of the representative firm is calculated based on its utility derived from the part of investment financed by the
firm’s retained earnings. 10 In reality, this is likely to be evidenced in the form of slower rates of outmigration from agriculture.
13
As the bottom section of Table 4 indicates, temporary migration from the rural to urban
sectors slows down as a result of the trade liberalization in rest of the world, which boosts
economic prospects in agriculture. Under ROW, there are about 5.9 million fewer rural-urban
migrants in the new equilibrium, as compared to the base year. The larger rural labor force is
mainly due to the retention of additional on-farm labor (increased by 6.4 million) under the
ROW scenario. In contrast, China’s unilateral trade liberalization accelerates off-farm
migration, with about 1.5-1.6 million workers leaving agriculture and migrating to the urban
areas, relative to the baseline.
Table 4 also reports changes in factor prices, from which it is clear that trade
liberalization in rest of the world favors unskilled and semi-skilled labor over skilled labor,
and rural labor over urban labor. This is due to the relative increase in demand for
agricultural exports and the rise in the price of competing agricultural imports. Agricultural
profitability in China is also boosted by the trade reforms in rest of the world, as reflected in
the rise in returns to agricultural land under ROW. Both returns to capital and skilled wages
increase less than CPI, which rises by 2.9 percent under ROW. This pattern of changes in
factor prices contrasts sharply with that obtained under China’s unilateral liberalization,
wherein returns to capital and skilled wages increase most relative to the CPI while returns to
agricultural land decrease most.
Next we turn to the third and fourth columns of macro-economic results reported in
Table 4, namely, those stemming from the liberalization of agriculture and lightly processed
food sectors only. Here we see that agricultural liberalization has only modest impacts on
aggregate exports and imports, reflecting the minor role of agricultural and food sectors in
China’s total trade (recall Table 1). Consequently, China’s welfare gains from agricultural
liberalization are trivial, ranging from 0.01 to 0.04 percent of its GDP. In contrast to
unilateral trade liberalization in all sectors, China’s unilateral agricultural liberalization leads
to an aggregate EV gain of 0.01 percent of GDP, mainly due to much smaller losses in terms
of trade. The changes in factor prices induced by agricultural liberalization show similar
patterns to those of broad-based commodity trade liberalization, i.e. agricultural liberalization
in the rest of the world would favor unskilled and semi-skilled labor as well as agricultural
land in China, while China’s unilateral agricultural reforms would favor capital and skilled
labor which are intensively employed in the relatively lightly protected manufacturing
sectors. The changes in off-farm employment and rural-urban migration under the two
agricultural liberalization scenarios are comparable to their corresponding broad-based trade
14
liberalization scenarios, indicating the dominant role played by distortions in agricultural
sectors in determining the mobility of the rural labor forces in China.
Compared to the reduction of China’s trade distortions, the labor market reforms
investigated in scenarios LABOR and LAND generally have larger impacts on welfare, GDP
and other macroeconomic aggregates. This reflects the large, and persistent, rural-urban
distortions in China’s labor markets. It is evident from the last two columns of Table 4 that
both of the factor market reforms serve to increase migration out of the relatively low
productivity agricultural sector, into the higher productivity non-agricultural sectors, and
from the rural to urban economy. In the case of land reform, 13.2 million additional workers
leave agriculture when they are assured of retaining land ownership in the wake of migration
(LAND scenario, final column, row Farm Labor, in Table 4). These individuals migrate
initially to the off-farm rural labor market, which in turn releases an additional 12.1 million
temporary rural migrants to the urban sector in order to restore equality in rural and urban
wages, net of transactions costs. The release of workers from agriculture tends to depress
wages in the rural, non-farm economy, where wages fall by 3.9 percent in the case of land
reform. This wage drop plays a role in dampening out-migration from agriculture.
While the LAND reform scenario focuses on the barriers to off-farm mobility of labor,
the LABOR scenario focuses on rural-urban migration. When the transactions costs associated
with temporary migration are reduced, due to elimination of the hukou system, rural-urban
migration expands by 35.7 million workers. Since the transactions costs associated with
temporary rural-urban migration operate like a tax on rural labor, the first effect of their
reduction is to increase the supply of rural labor to the urban economy, thereby boosting rural
wages and depressing urban wages. This represents a redistribution of the rents associated
with the hukou system from urban to rural households. In addition, by raising rural wages,
this hukou reform scenario also draws 27.9 million additional workers out of agriculture.
Poverty and inequality impacts
Since poverty and income distribution are central to our study, we provide several related
measures of inequality and poverty in Table 5. The first column in this table simply reports
the initial level of each indicator in our data base, while subsequent columns report changes,
or percentage changes, in these indicators. The initial urban/rural income ratio, at 3.5, is
higher than in some of the household survey-based studies cited previously. This is largely
15
due to our inability to adjust for spatial price variation which, if fully taken into account,
would reduce this ratio considerably. The initial Gini coefficient in our model, 0.442, is
heavily influenced by rural-urban income disparity. This estimate is also consistent with the
recent work of Benjamin et al. (2007), who identify limitations with many of the existing
estimates of inequality and place the Gini in the 0.4-0.5 range.
Using the $2/day poverty line and 1993 PPP exchange rate, the World Bank estimates
that 58.11 percent of the rural population in China was in poverty and 2.51 percent of the
urban population was in poverty in 2004.11 We start with these target rates of poverty and
compute the poverty line in our data set which reproduces this same poverty headcount. This
yields a poverty line of 3520 Yuan/person for urban and 2591 Yuan/person for rural areas.
By assuming a uniform distribution of the population within each of the income vingtiles in
our source data from NBS, we are able to estimate the poverty headcounts in each stratum.
This information is also reported in Table 5. As can be seen there, the national poverty
picture in China is largely driven by rural poverty, with 455 million poor residing in rural
areas. The poverty headcount rate is highest in the agriculture-dependent household group,
where nearly two thirds (63.7 percent) of the population is poor.
Turning to the reform scenarios, the two scenarios that do not reduce the rural-urban
income disparity are DOM and DOM-Ag (China’s unilateral liberalization), as rural
households generally lose from declining agricultural factor returns. Although the magnitude
of the change in the rural-urban income ratio is very small in the cases of trade liberalization,
it is very substantial in the factor market reform scenarios. In the case where the hukou
registration system is abolished (LABOR), for example, this ratio declines from 3.54 to 3.23.
The decline for the land reform scenario (LAND) is also large (0.17 points).
Table 5 also reports the absolute changes in several Gini coefficients. As income
inequality in China is dominated by urban-rural inequality, the narrowed urban-rural income
gaps under scenarios of trade liberalization in the rest of the world and reforms in factor
markets are reflected in an improvement in overall inequality, as measured by the national
Gini coefficient. There are no discernible changes in inequality within the urban and rural
areas under the scenarios of unilateral liberalization. However, under the two factor market
reform scenarios, the Gini coefficients show a slight increase in inequality within urban areas
and a slight decline within rural areas. This is because the low-income, unskilled labor
dependent urban households are hurt most by the increase in rural-urban migration of
11 The World Bank’s poverty estimates are available at http://iresearch.worldbank.org/PovcalNet/jsp/index.jsp
16
unskilled workers under labor market reforms, whereas low-income, diversified rural
households gain more from the resulting increase in rural unskilled wages than those at high
income levels.
Next we turn to the changes in poverty as a consequence of the reform scenarios. In the
scenario of broad-based trade liberalization in the rest of the world (ROW), the monetary
poverty line increases by 2.9 percent, following the change in CPI (Table 4). Nevertheless,
higher factor earnings mean that the poverty headcount ratio declines for all household
groups with significant poverty. Urban poverty decreases by 0.3 million (bottom panel
reports poverty change in millions) while rural households enjoy a 1.9 percentage point
reduction in the poverty headcount (the middle panel reports percentage point change in
poverty). Given the large population base in rural China, this translates into a rural poverty
reduction of 14.6 million. In the case of agricultural liberalization in the rest of the world, the
poverty reduction is smaller but still significant, with the rural poverty headcount declining
by 10.8 million.
Given the adverse impacts of China’s unilateral liberalization on agricultural sectors,
rural poverty increases slightly, by 3.5 million, in the DOM scenario and 2.4 million in the
scenario of DOM-Ag. Given the predominance of rural poverty in China, these rises in rural
poverty, in turn, translate into comparable changes in total poverty. On the other hand, labor
market reforms would significantly reduce rural poverty, but slightly increase urban poverty.
The rural poverty headcount ratio declines from 58.1 percent in the base year to 51.0 percent
in the LABOR scenario and 56.2 percent in the LAND scenario, while the urban headcount
ratio rises slightly, from 2.5 percent to 2.8-3.2 percent. Overall, the share of the national
population that is impoverished falls quite sharply in the case of hukou reforms, from 36.4
percent of the total population to 32.3 percent under the LABOR scenario (hukou reforms)
and to 35.4 percent under the LAND reform scenario. When combined, these two scenarios
together generate a poverty reduction of 65.5 million. Thus it is clear that, if a poverty
reduction and greater income equality are the objectives of the next round of reforms in
China, then factor market reforms will need to be part of the package.
Household impacts
It is important to dig down below the aggregate indicators of poverty and inequality and
consider the disaggregated, household incidence curves reported in Figures 1a - 1f. These
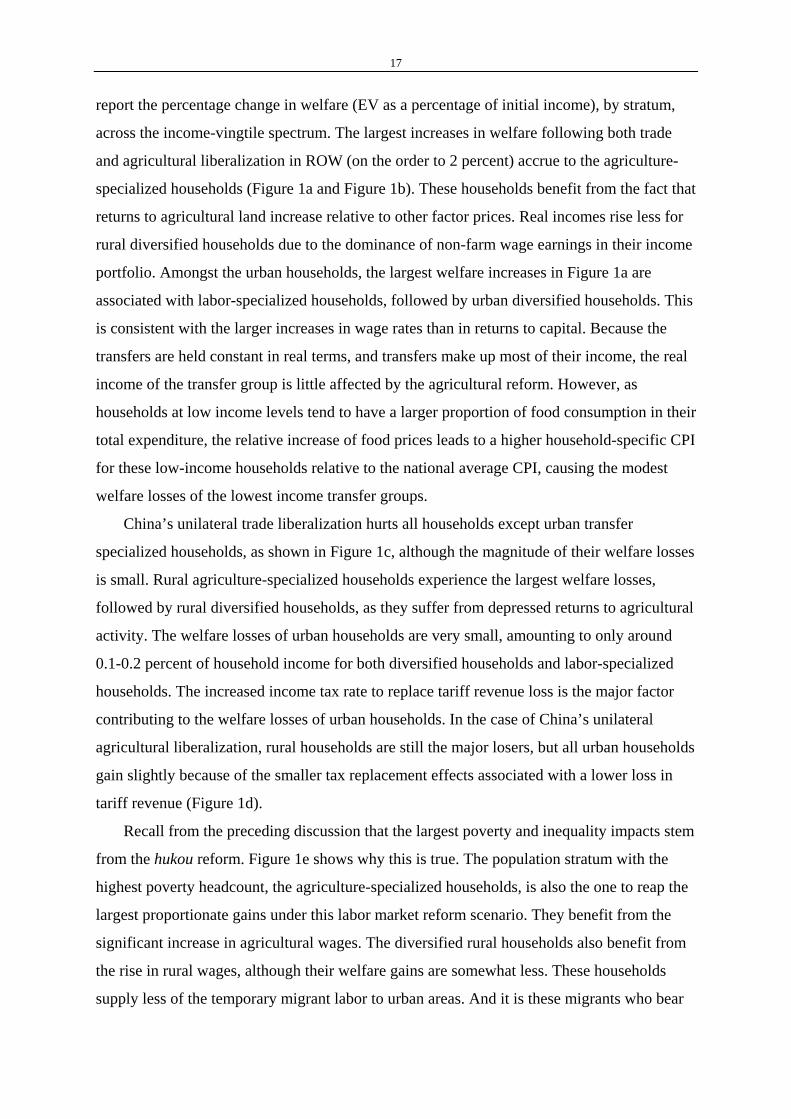
17
report the percentage change in welfare (EV as a percentage of initial income), by stratum,
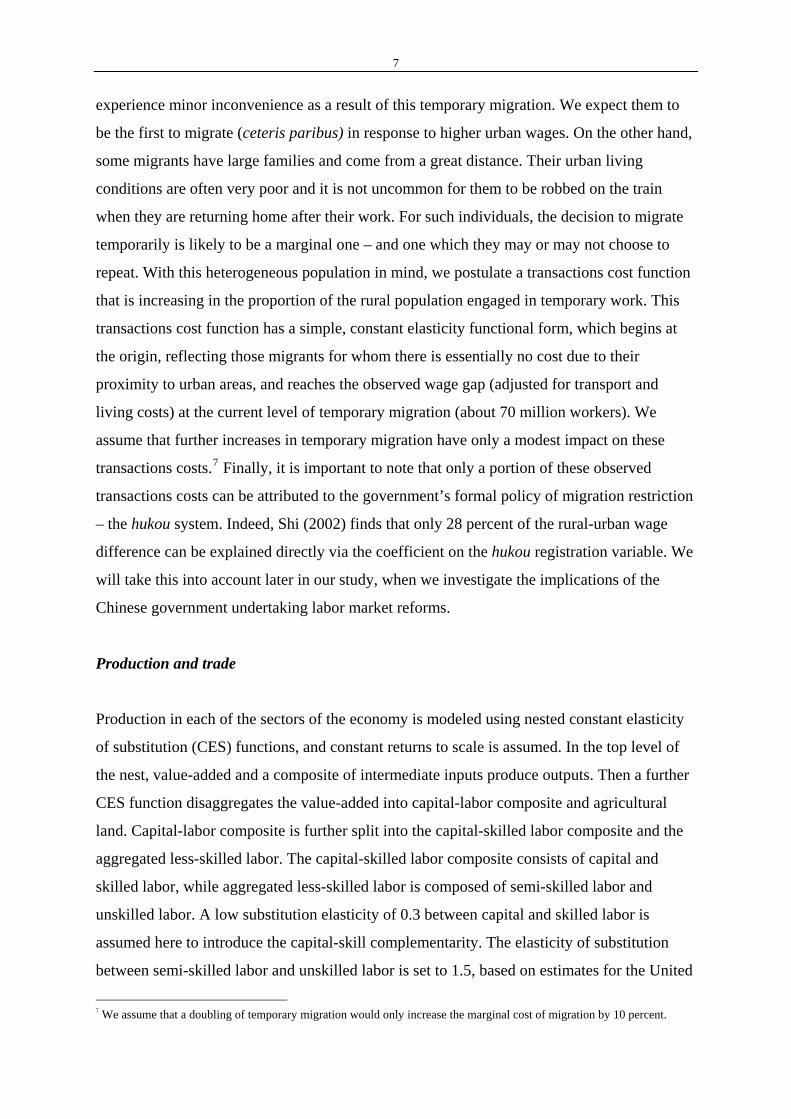
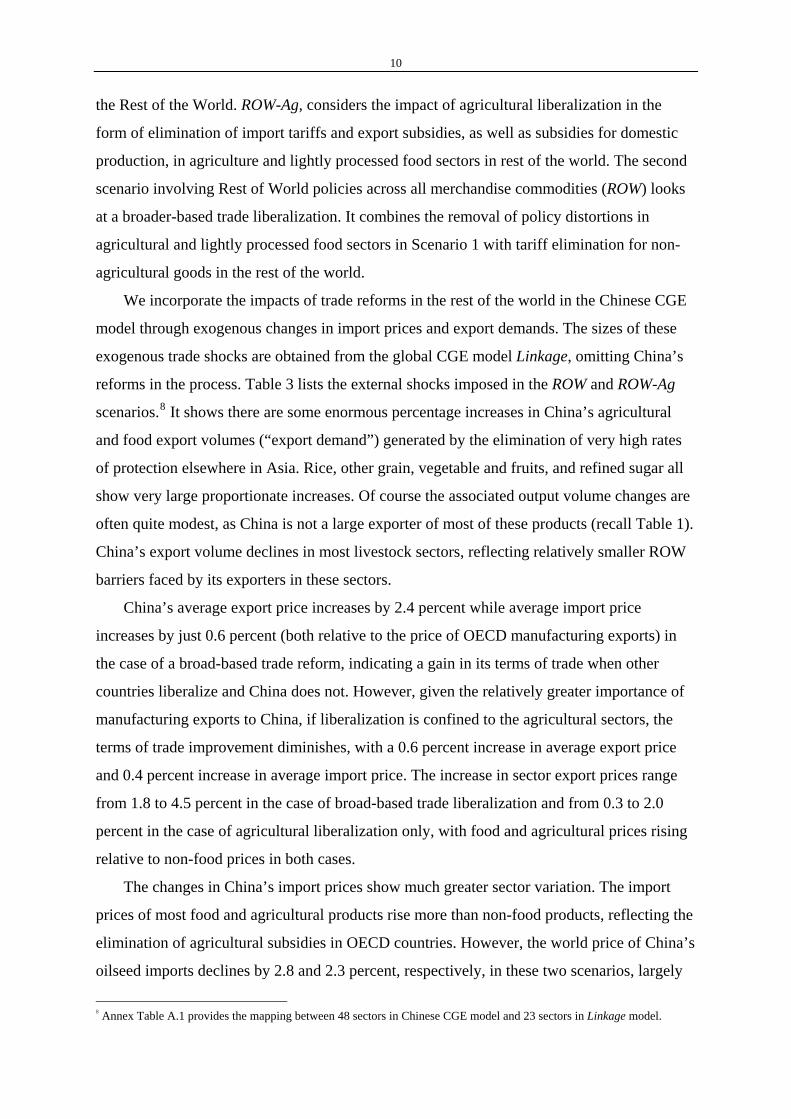
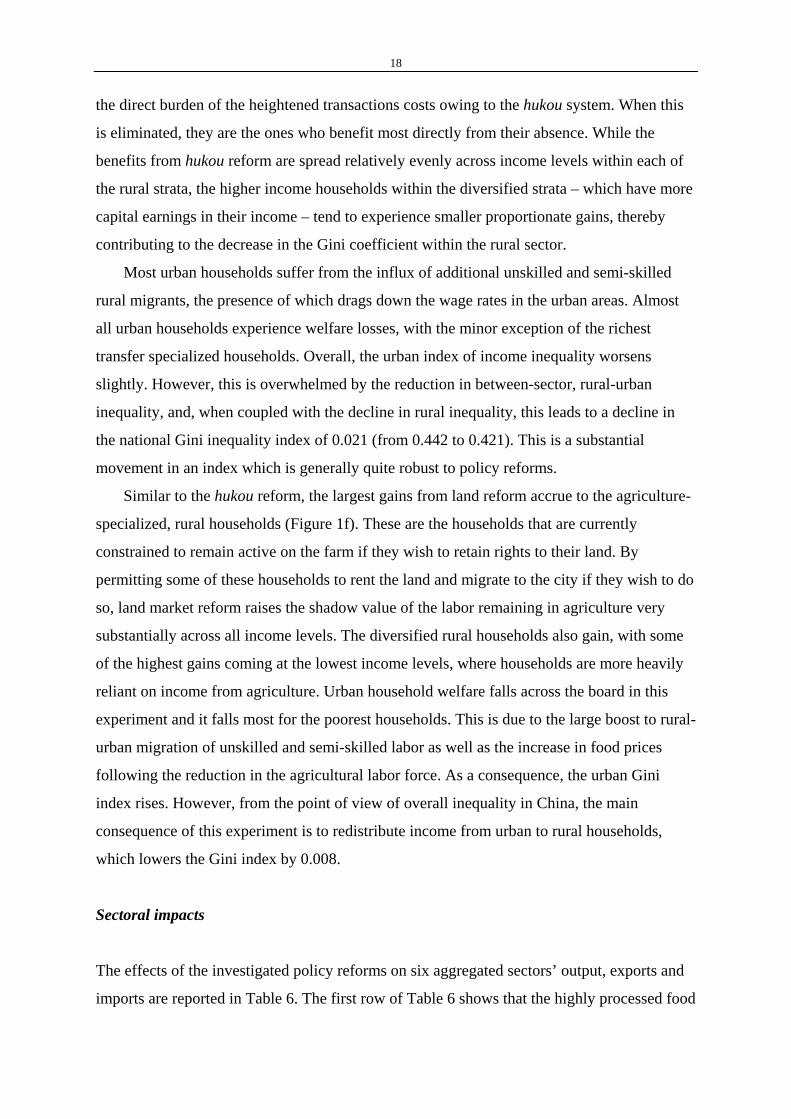
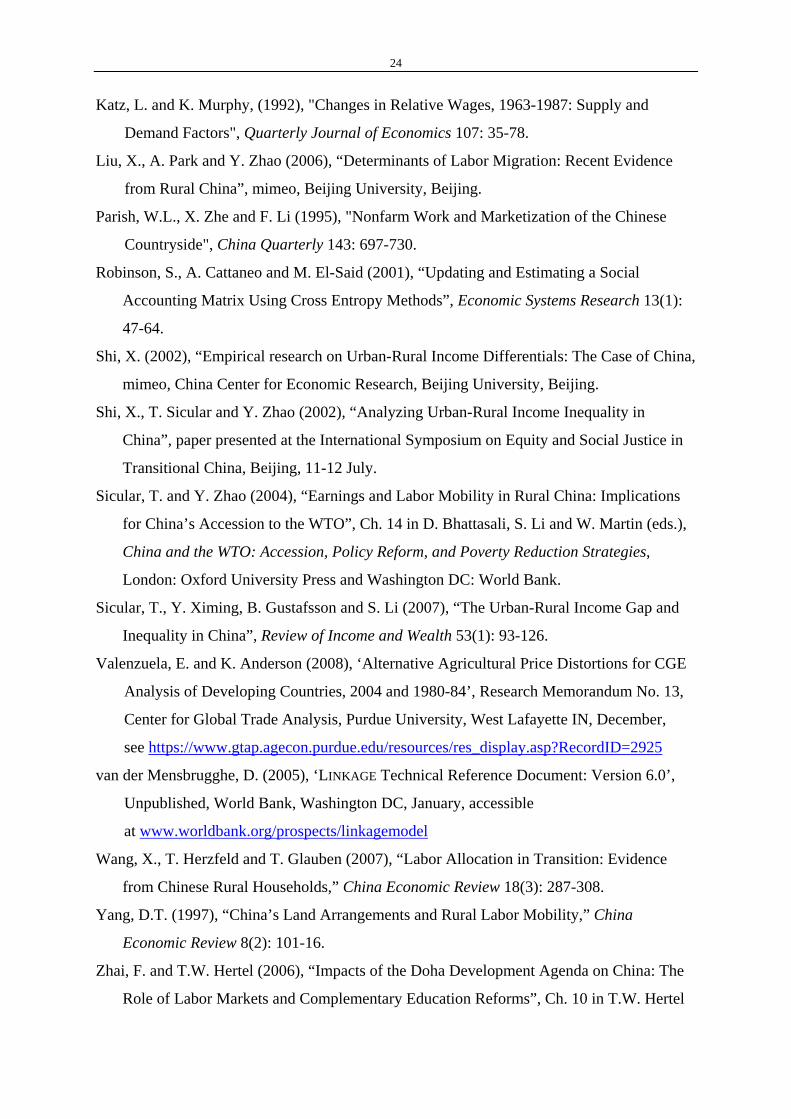
across the income-vingtile spectrum. The largest increases in welfare following both trade
and agricultural liberalization in ROW (on the order to 2 percent) accrue to the agriculture-
specialized households (Figure 1a and Figure 1b). These households benefit from the fact that
returns to agricultural land increase relative to other factor prices. Real incomes rise less for
rural diversified households due to the dominance of non-farm wage earnings in their income
portfolio. Amongst the urban households, the largest welfare increases in Figure 1a are
associated with labor-specialized households, followed by urban diversified households. This
is consistent with the larger increases in wage rates than in returns to capital. Because the
transfers are held constant in real terms, and transfers make up most of their income, the real
income of the transfer group is little affected by the agricultural reform. However, as
households at low income levels tend to have a larger proportion of food consumption in their
total expenditure, the relative increase of food prices leads to a higher household-specific CPI
for these low-income households relative to the national average CPI, causing the modest
welfare losses of the lowest income transfer groups.
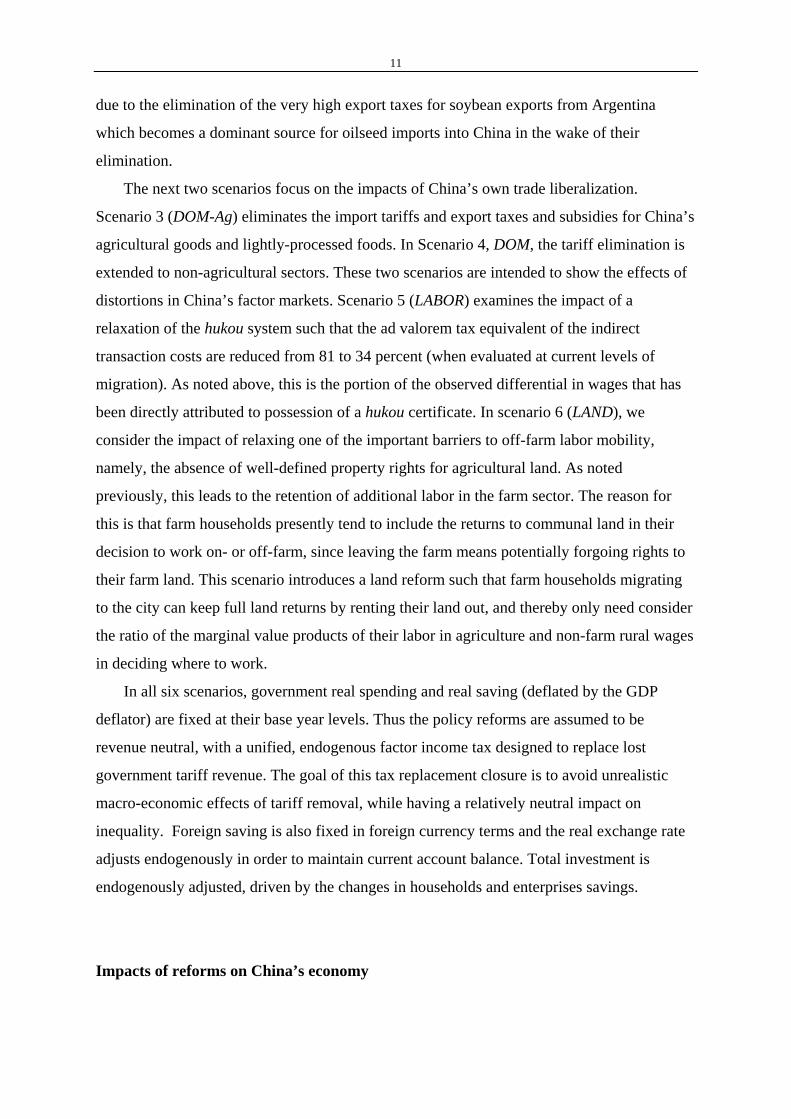
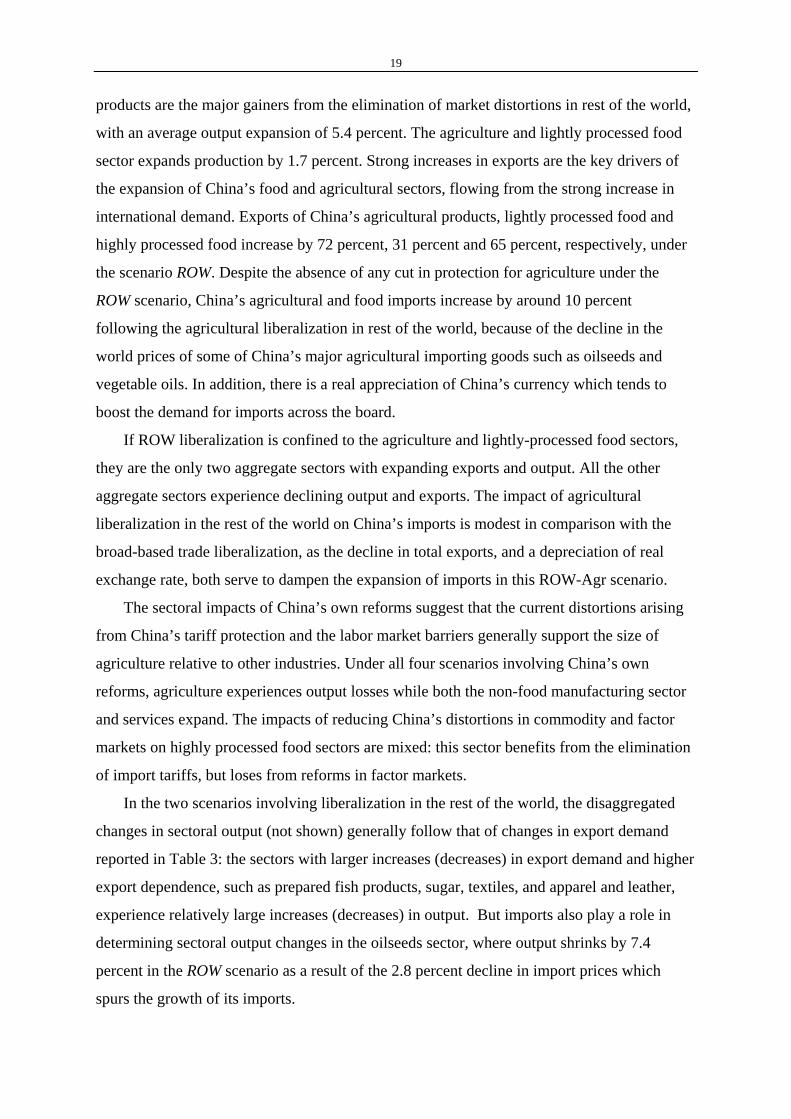
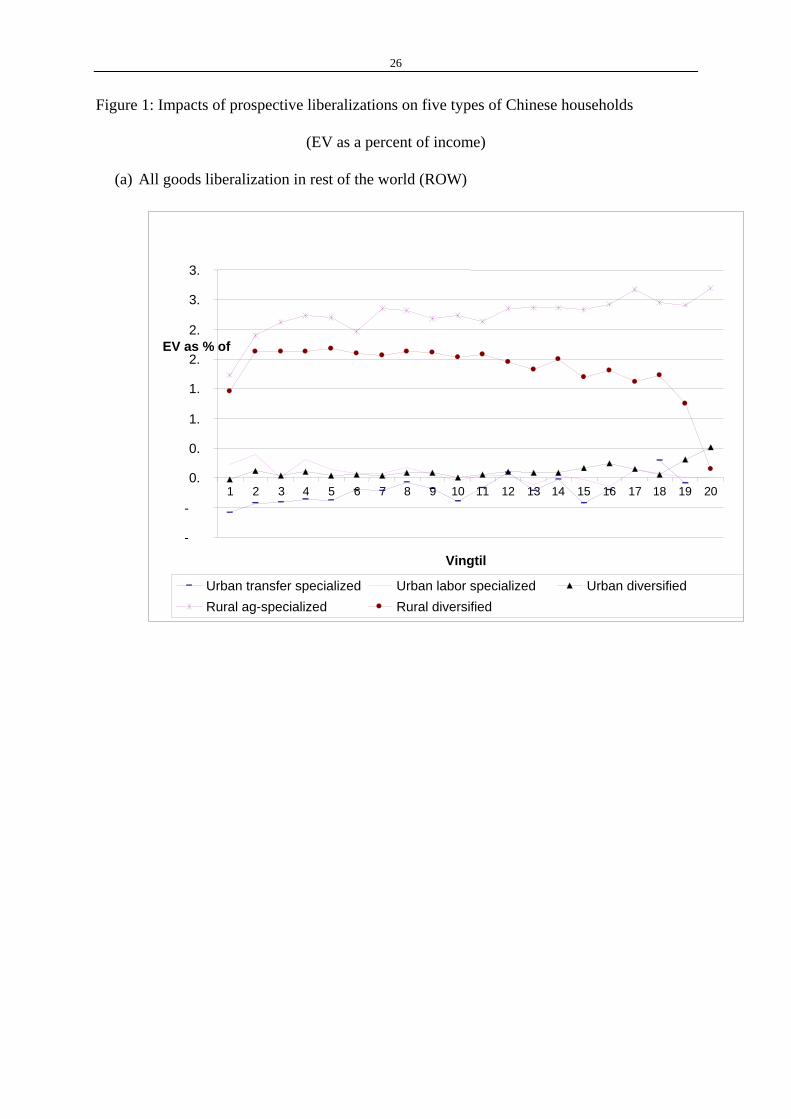
China’s unilateral trade liberalization hurts all households except urban transfer
specialized households, as shown in Figure 1c, although the magnitude of their welfare losses
is small. Rural agriculture-specialized households experience the largest welfare losses,
followed by rural diversified households, as they suffer from depressed returns to agricultural
activity. The welfare losses of urban households are very small, amounting to only around
0.1-0.2 percent of household income for both diversified households and labor-specialized
households. The increased income tax rate to replace tariff revenue loss is the major factor
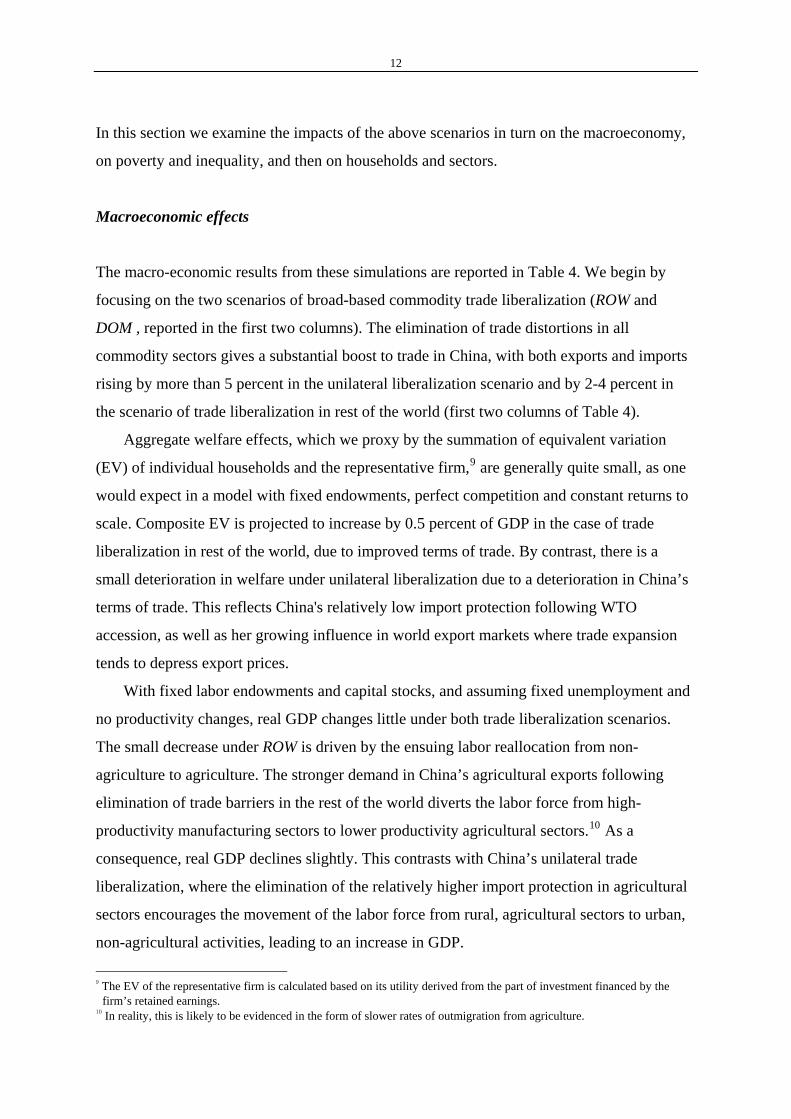
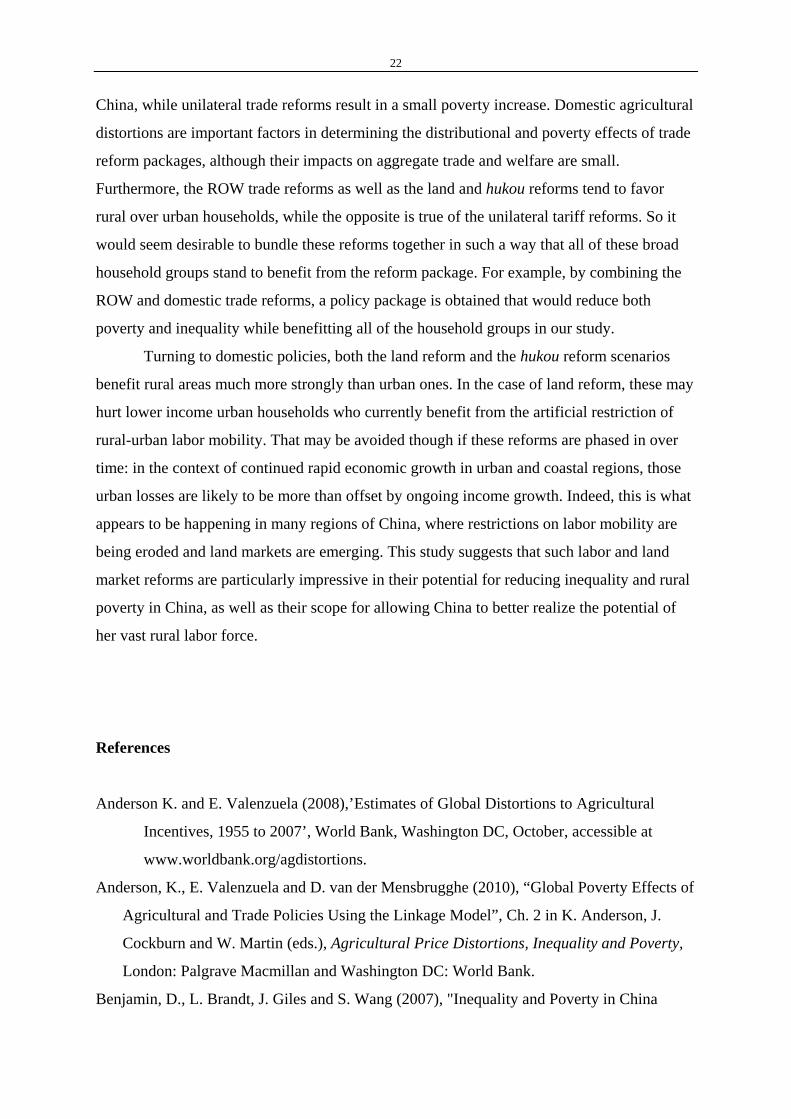
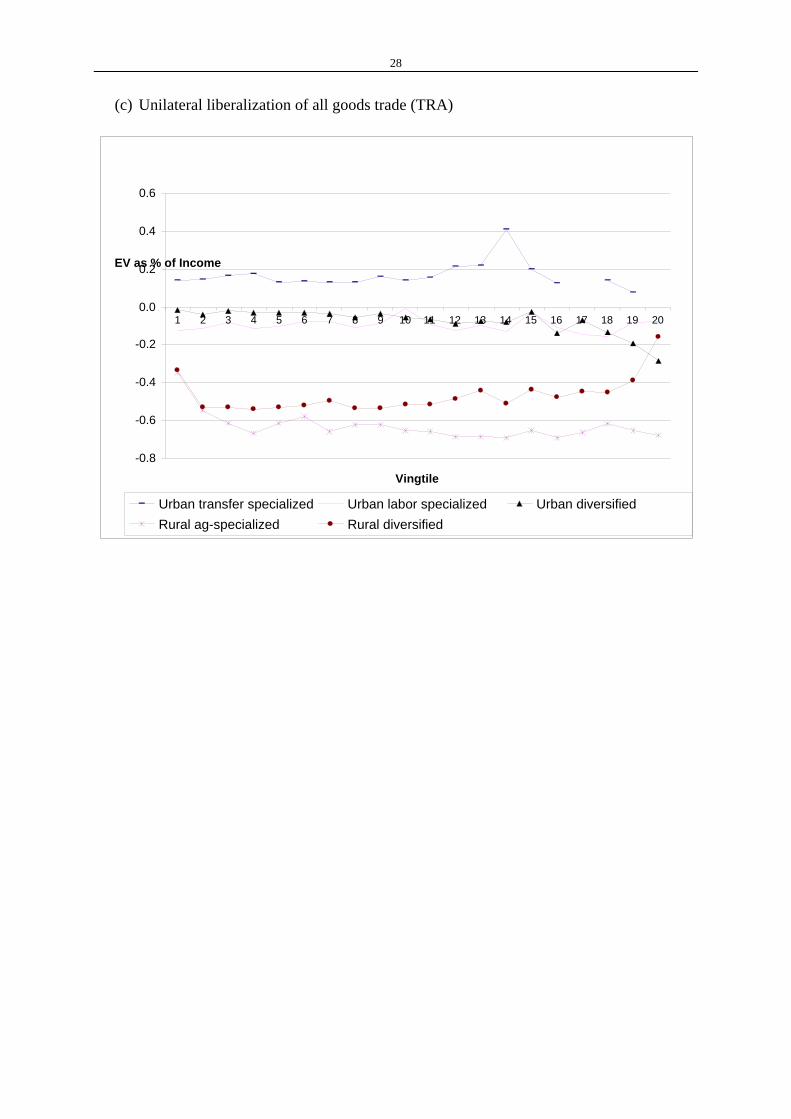
contributing to the welfare losses of urban households. In the case of China’s unilateral
agricultural liberalization, rural households are still the major losers, but all urban households
gain slightly because of the smaller tax replacement effects associated with a lower loss in
tariff revenue (Figure 1d).
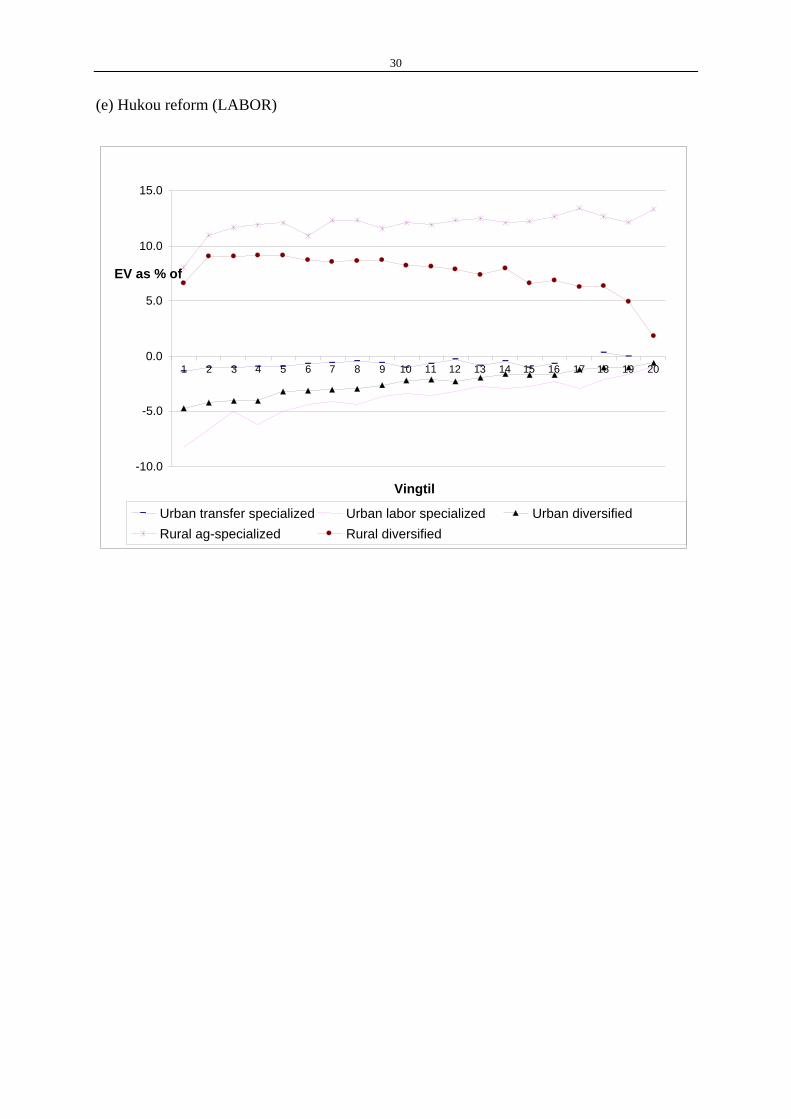
Recall from the preceding discussion that the largest poverty and inequality impacts stem
from the hukou reform. Figure 1e shows why this is true. The population stratum with the
highest poverty headcount, the agriculture-specialized households, is also the one to reap the
largest proportionate gains under this labor market reform scenario. They benefit from the
significant increase in agricultural wages. The diversified rural households also benefit from
the rise in rural wages, although their welfare gains are somewhat less. These households
supply less of the temporary migrant labor to urban areas. And it is these migrants who bear
18
the direct burden of the heightened transactions costs owing to the hukou system. When this
is eliminated, they are the ones who benefit most directly from their absence. While the
benefits from hukou reform are spread relatively evenly across income levels within each of
the rural strata, the higher income households within the diversified strata – which have more
capital earnings in their income – tend to experience smaller proportionate gains, thereby
contributing to the decrease in the Gini coefficient within the rural sector.
Most urban households suffer from the influx of additional unskilled and semi-skilled
rural migrants, the presence of which drags down the wage rates in the urban areas. Almost
all urban households experience welfare losses, with the minor exception of the richest
transfer specialized households. Overall, the urban index of income inequality worsens
slightly. However, this is overwhelmed by the reduction in between-sector, rural-urban
inequality, and, when coupled with the decline in rural inequality, this leads to a decline in
the national Gini inequality index of 0.021 (from 0.442 to 0.421). This is a substantial
movement in an index which is generally quite robust to policy reforms.
Similar to the hukou reform, the largest gains from land reform accrue to the agriculture-
specialized, rural households (Figure 1f). These are the households that are currently
constrained to remain active on the farm if they wish to retain rights to their land. By
permitting some of these households to rent the land and migrate to the city if they wish to do
so, land market reform raises the shadow value of the labor remaining in agriculture very
substantially across all income levels. The diversified rural households also gain, with some
of the highest gains coming at the lowest income levels, where households are more heavily
reliant on income from agriculture. Urban household welfare falls across the board in this
experiment and it falls most for the poorest households. This is due to the large boost to rural-
urban migration of unskilled and semi-skilled labor as well as the increase in food prices
following the reduction in the agricultural labor force. As a consequence, the urban Gini
index rises. However, from the point of view of overall inequality in China, the main
consequence of this experiment is to redistribute income from urban to rural households,
which lowers the Gini index by 0.008.
Sectoral impacts
The effects of the investigated policy reforms on six aggregated sectors’ output, exports and
imports are reported in Table 6. The first row of Table 6 shows that the highly processed food
19
products are the major gainers from the elimination of market distortions in rest of the world,
with an average output expansion of 5.4 percent. The agriculture and lightly processed food
sector expands production by 1.7 percent. Strong increases in exports are the key drivers of
the expansion of China’s food and agricultural sectors, flowing from the strong increase in
international demand. Exports of China’s agricultural products, lightly processed food and
highly processed food increase by 72 percent, 31 percent and 65 percent, respectively, under
the scenario ROW. Despite the absence of any cut in protection for agriculture under the
ROW scenario, China’s agricultural and food imports increase by around 10 percent
following the agricultural liberalization in rest of the world, because of the decline in the
world prices of some of China’s major agricultural importing goods such as oilseeds and
vegetable oils. In addition, there is a real appreciation of China’s currency which tends to
boost the demand for imports across the board.
If ROW liberalization is confined to the agriculture and lightly-processed food sectors,
they are the only two aggregate sectors with expanding exports and output. All the other
aggregate sectors experience declining output and exports. The impact of agricultural
liberalization in the rest of the world on China’s imports is modest in comparison with the
broad-based trade liberalization, as the decline in total exports, and a depreciation of real
exchange rate, both serve to dampen the expansion of imports in this ROW-Agr scenario.
The sectoral impacts of China’s own reforms suggest that the current distortions arising
from China’s tariff protection and the labor market barriers generally support the size of
agriculture relative to other industries. Under all four scenarios involving China’s own
reforms, agriculture experiences output losses while both the non-food manufacturing sector
and services expand. The impacts of reducing China’s distortions in commodity and factor
markets on highly processed food sectors are mixed: this sector benefits from the elimination
of import tariffs, but loses from reforms in factor markets.
In the two scenarios involving liberalization in the rest of the world, the disaggregated
changes in sectoral output (not shown) generally follow that of changes in export demand
reported in Table 3: the sectors with larger increases (decreases) in export demand and higher
export dependence, such as prepared fish products, sugar, textiles, and apparel and leather,
experience relatively large increases (decreases) in output. But imports also play a role in
determining sectoral output changes in the oilseeds sector, where output shrinks by 7.4
percent in the ROW scenario as a result of the 2.8 percent decline in import prices which
spurs the growth of its imports.

20
Under China’s unilateral trade liberalization (DOM), instruments, electronics, textiles,
apparel and leather are major manufacturing sectors with rapid output expansion. As the most
export oriented sectors, they benefit from the real depreciation of Chinese currency in the
wake of China’s unilateral trade liberalization. At the other end of the spectrum, the most
heavily protected sectors, with sizable trade exposure, experience declining output, including:
oilseeds, sugar, transportation equipment, other grains and vegetable oil. In the case of
China’s unilateral agricultural liberalization, there are large output contractions in the
agricultural sectors with high levels of protection.
In the scenarios of hukou reform (reduced transactions costs) and land reform,
agricultural output falls sharply, as the farm labor force is diverted to off-farm rural activities
as well as urban-based manufacturing sectors. Within manufacturing, the consumption goods
sectors experience declining output but most capital goods sectors expand, because the
changes in final demand favor investment over consumption in these two scenarios.
Sensitivity of results to the land rental market assumption
As noted previously, China’s rural land markets have been undergoing reform and a nascent
market for land is emerging in many areas. In principle, this should facilitate off-farm
migration, as migrants may no longer risk losing control of this asset when they leave the
farm. However, to date these reforms have been restricted to certain regions, and it is not
clear how efficiently this market is functioning – even in those special cases. Therefore, in
our base case results, we assumed that the transfer of rural labor from farm to off-farm
activities would diminish earnings from land rents by 50 percent, on average (that is, there is
a 50 percent probability that migrants will lose control of their land). Since this parameter
choice is somewhat arbitrary, we contrast the base case results with those from the two
extreme assumptions about the functioning of rural land rental market: one in which there is
zero loss in land returns following off-farm employment, and the other in which there is no
land rental market (100 percent loss in land returns if farmers switch to off-farm jobs).
Thereupon we repeat the two trade liberalization scenarios, ROW and DOM. The key
simulation results are presented in Table 7. Since the macro aggregate results are essentially
unchanged from our base line results, only revised results on factor prices and labor
migration are reported.
The first pair of columns in Table 7 report the results when the land market is fully

21
absent, so that migration results in the loss of all land farmed by the migrant. The second pair
of columns reports the results when the opposite assumption is made, namely, a fully
functioning land market. Consider first the case of trade reforms in the rest of the world
(ROW). Here, both the returns to land and wage rates in agriculture rise. Furthermore, the rise
in land returns is greater than the rise in wages. Therefore, households that had hitherto been
considering leaving agriculture due to depressed factor returns have an even stronger
incentive to continue do devote their labor to agriculture than do those who, at the margin,
had been indifferent to the wage differential between the farm and non-farm sectors (fully
functioning land market). Thus the movement of labor into agriculture in the ROW scenario is
greater when the land market is not functioning than when it is, provided there is no change
in the underlying structure of the land market.
The same situation applies, but in reverse, in the case of unilateral trade reforms when
labor is leaving agriculture. Here, by including returns to land in the off-farm migration
decision(since these fall by more than wages), the incentive to work off-farm is accentuated
in the absence of a land market. As we saw above, moving from no land market to a fully
functioning land market (experiment LAND) generates a much larger flow of workers from
agriculture to the rest of the economy (more than 13 million), and a significant poverty
reduction. So we are not concluding that a poorly functioning land market is good for poverty
reduction. Since the impact of land reforms dominates the trade reform impacts on labor
markets, it is the former that rules the day if both are undertaken together. However, this
sensitivity analysis does show that our predictions about the impact of trade reforms on
intersectoral labor mobility depend importantly on the extent to which farmers are able to
lease their land when migrating to the city for work.
Conclusions and policy implications
Absolute poverty in China is now largely a rural problem and, within the rural sector, the
intensity of poverty is greatest on the farm. Thus policy reforms that either boost returns to
farming or enhance off-farm opportunities for those presently working in agriculture offer the
best prospects for reducing poverty and inequality in China. Of the reforms considered, trade
reforms in the rest of the world, land reform and hukou reform all serve to reduce poverty in
22
China, while unilateral trade reforms result in a small poverty increase. Domestic agricultural
distortions are important factors in determining the distributional and poverty effects of trade
reform packages, although their impacts on aggregate trade and welfare are small.
Furthermore, the ROW trade reforms as well as the land and hukou reforms tend to favor
rural over urban households, while the opposite is true of the unilateral tariff reforms. So it
would seem desirable to bundle these reforms together in such a way that all of these broad
household groups stand to benefit from the reform package. For example, by combining the
ROW and domestic trade reforms, a policy package is obtained that would reduce both
poverty and inequality while benefitting all of the household groups in our study.
Turning to domestic policies, both the land reform and the hukou reform scenarios
benefit rural areas much more strongly than urban ones. In the case of land reform, these may
hurt lower income urban households who currently benefit from the artificial restriction of
rural-urban labor mobility. That may be avoided though if these reforms are phased in over
time: in the context of continued rapid economic growth in urban and coastal regions, those
urban losses are likely to be more than offset by ongoing income growth. Indeed, this is what
appears to be happening in many regions of China, where restrictions on labor mobility are
being eroded and land markets are emerging. This study suggests that such labor and land
market reforms are particularly impressive in their potential for reducing inequality and rural
poverty in China, as well as their scope for allowing China to better realize the potential of
her vast rural labor force.
References
Anderson K. and E. Valenzuela (2008),’Estimates of Global Distortions to Agricultural
Incentives, 1955 to 2007’, World Bank, Washington DC, October, accessible at
www.worldbank.org/agdistortions.
Anderson, K., E. Valenzuela and D. van der Mensbrugghe (2010), “Global Poverty Effects of
Agricultural and Trade Policies Using the Linkage Model”, Ch. 2 in K. Anderson, J.
Cockburn and W. Martin (eds.), Agricultural Price Distortions, Inequality and Poverty,
London: Palgrave Macmillan and Washington DC: World Bank.
Benjamin, D., L. Brandt, J. Giles and S. Wang (2007), "Inequality and Poverty in China

23
During Reform", PEP-PMMA Working Paper 2007-07, March.
Bhattasali, D., S. Li and W.J. Martin (2004), China and the WTO: Accession, Policy Reform,
and Poverty Strategies, London: Oxford University Press and Washington DC: World
Bank.
Cai, F., A. Park and Y. Zhao (2007), “The Chinese Labor Market in the Reform Era”, Ch. 6
in L. Brandt and T. Rawski (eds.), China’s Great Economic Transformation, Cambridge
and New York: Cambridge University Press.
Chen, S. and M. Ravallion (2004), “Welfare Impacts of China’s Accession to the WTO”, Ch.
15 in D. Bhattasali, S. Li and W. Martin (eds.), China and the WTO: Accession, Policy
Reform, and Poverty Reduction Strategies, London: Oxford University Press and
Washington DC: World Bank.
Deininger, K. and S. Jin (2005), "The Potential of Land Rental Markets in the Process of
Economic Development: Evidence from China," Journal of Development Economics
78(1): 241-70.
Deininger, K. and S. Jin (2007), "Land Rental Markets in the Process of Rural Structural
Transformation: Productivity and Equity Impacts in China," Policy Research Working
Paper 4454, The World Bank, Washington DC.
Heckman, J. J. and L. Lochner (1998), “Explaining Rising Wage Inequality: Explorations
with a Dynamic General Equilibrium Model of Labor Earnings with Heterogeneous
Agents", Review of Economic Dynamics 1: 1-58.
Hertel, T.W. (ed.) (1997), Global Trade Analysis: Modeling and Applications, Cambridge
and New York: Cambridge University Press.
Hertel, T.W., P.V. Preckel, J. Cranfield and M. Ivanic (2004), “Poverty Impacts of
Multilateral Trade Liberalization”, World Bank Economic Review 18(2): 205-36.
Hertel, T.W. and F. Zhai (2006), “Labor Market Distortions, Rural-Urban Inequality and the
Opening of China’s Economy,” Economic Modeling 23: 76–109.
Hertel, T., F. Zhai and Z. Wang (2004), “Implications of WTO Accession for Poverty in
China", Ch. 16 in D. Bhattasali, S. Li and W. Martin (eds.), China and the WTO:
Accession, Policy Reform, and Poverty Strategies, London: Oxford University Press and
Washington DC: World Bank.
Huang, J., S. Rozelle, W. Martin and Y. Liu (2009), “China”, Ch. 3 in Anderson, K. and W.
Martin (eds.), Distortions to Agricultural Incentives in Asia, Washington DC: World
Bank.
24
Katz, L. and K. Murphy, (1992), "Changes in Relative Wages, 1963-1987: Supply and
Demand Factors", Quarterly Journal of Economics 107: 35-78.
Liu, X., A. Park and Y. Zhao (2006), “Determinants of Labor Migration: Recent Evidence
from Rural China”, mimeo, Beijing University, Beijing.
Parish, W.L., X. Zhe and F. Li (1995), "Nonfarm Work and Marketization of the Chinese
Countryside", China Quarterly 143: 697-730.
Robinson, S., A. Cattaneo and M. El-Said (2001), “Updating and Estimating a Social
Accounting Matrix Using Cross Entropy Methods”, Economic Systems Research 13(1):
47-64.
Shi, X. (2002), “Empirical research on Urban-Rural Income Differentials: The Case of China,
mimeo, China Center for Economic Research, Beijing University, Beijing.
Shi, X., T. Sicular and Y. Zhao (2002), “Analyzing Urban-Rural Income Inequality in
China”, paper presented at the International Symposium on Equity and Social Justice in
Transitional China, Beijing, 11-12 July.
Sicular, T. and Y. Zhao (2004), “Earnings and Labor Mobility in Rural China: Implications
for China’s Accession to the WTO”, Ch. 14 in D. Bhattasali, S. Li and W. Martin (eds.),
China and the WTO: Accession, Policy Reform, and Poverty Reduction Strategies,
London: Oxford University Press and Washington DC: World Bank.
Sicular, T., Y. Ximing, B. Gustafsson and S. Li (2007), “The Urban-Rural Income Gap and
Inequality in China”, Review of Income and Wealth 53(1): 93-126.
Valenzuela, E. and K. Anderson (2008), ‘Alternative Agricultural Price Distortions for CGE
Analysis of Developing Countries, 2004 and 1980-84’, Research Memorandum No. 13,
Center for Global Trade Analysis, Purdue University, West Lafayette IN, December,
see https://www.gtap.agecon.purdue.edu/resources/res_display.asp?RecordID=2925
l
van der Mensbrugghe, D. (2005), ‘LINKAGE Technical Reference Document: Version 6.0’,
Unpublished, World Bank, Washington DC, January, accessible
at www.worldbank.org/prospects/linkagemode
Wang, X., T. Herzfeld and T. Glauben (2007), “Labor Allocation in Transition: Evidence
from Chinese Rural Households,” China Economic Review 18(3): 287-308.
Yang, D.T. (1997), “China’s Land Arrangements and Rural Labor Mobility,” China
Economic Review 8(2): 101-16.
Zhai, F. and T.W. Hertel (2006), “Impacts of the Doha Development Agenda on China: The
Role of Labor Markets and Complementary Education Reforms”, Ch. 10 in T.W. Hertel

25
and L.A. Winters (eds.), Poverty and the WTO: Impacts of the Doha Development
Agenda, London: Palgrave Macmillan and Washington DC: World Bank.
Zhang, L., J. Huang and S. Rozelle (2002), "Employment, Emerging labor markets, and the
Role of Education in Rural China", China Economic Review 13(2-3): 313-28.
Zhao, Y. (1999a), “Labor Migration and Earnings Differences: The Case of Rural China,”
Economic Development and Cultural Change 47: 767-82.
Zhao, Y. (1999b), “Leaving the Countryside: Rural-to-Urban Migration Decisions in China,”
American Economic Review 89(2): 281-86.
26
Figure 1: Impacts of prospective liberalizations on five types of Chinese households
(EV as a percent of income)
(a) All goods liberalization in rest of the world (ROW)
-
-
0.
0.
1.
1.
2.
2.
3.
3.
1 2 3 4 5 6 7 8 9 10 11 12 13 14 15 16 17 18 19 20
Vingtil
EV as % of
Urban transfer specialized Urban labor specialized Urban diversifiedRural ag-specialized Rural diversified

27
(b) Agricultural liberalization in rest of the world (ROWag)
-1.0
-0.5
0.0
0.5
1.0
1.5
2.0EV as % of
2.5
3.0
1 2 3 4 5 6 7 8 9 10 11 12 13 14 15 16 17 18 19 20
Vingtil
Urban transfer specialized Urban labor specialized Urban diversifiedRural ag-specialized Rural diversified
28
(c) Unilateral liberalization of all goods trade (TRA)
-0.8
-0.6
-0.4
-0.2
0.0
0.2EV as % of Income
0.4
0.6
1 2 3 4 5 6 7 8 9 10 11 12 13 14 15 16 17 18 19 20
Vingtile
Urban transfer specialized Urban labor specialized Urban diversifiedRural ag-specialized Rural diversified
29
(d) Unilateral liberalization of agricultural trade (TRA-ag)
-0.6
-0.5
-0.4
-0.3
-0.2
-0.1
0.0 EV as % of
0.1
0.2
0.3
1 2 3 4 5 6 7 8 9 10 11 12 13 14 15 16 17 18 19 20
Vingtil
Urban transfer specialized Urban labor specialized Urban diversifiedRural ag-specialized Rural diversified
30
(e) Hukou reform (LABOR)
-10.0
-5.0
0.0
5.0
10.0
15.0
1 2 3 4 5 6 7 8 9 10 11 12 13 14 15 16 17 18 19 20
Vingtil
EV as % of
Urban transfer specialized Urban labor specialized Urban diversifiedRural ag-specialized Rural diversified

31
(f) Land reform (LAND)
-6.0
-4.0
-2.0
0.0
2.0
4.0 EV as % of Income
6.0
8.0
1 2 3 4 5 6 7 8 9 10 11 12 13 14 15 16 17 18 19 20
Vingtile
Urban transfer specialized Urban labor specialized Urban diversified Rural ag-specialized Rural diversified
Source: Authors’ simulations
32
Table 1: Sectoral structure of GDP, trade, import tariffs and export subsidies, China, circa 2004
(percent)
Tariff rate
Export subsidy
ratea
GDP share
Exports share
Imports share
Agriculture 6.5 0.8 13.4 1.6 2.5 Paddy rice 0.0 -1.0 0.8 0.0 0.0 Wheat 4.0 0.0 0.3 0.0 0.1 Other grains 3.4 13.0 0.3 0.1 0.0 Vegetables and fruits 14.8 0.0 5.5 0.7 0.1 Oilseeds 15.9 0.0 0.4 0.1 0.7 Sugar cane and beet 15.3 0.0 0.0 0.0 0.0 Plant-based fibers -5.3 0.0 0.2 0.0 0.3 Other crops 9.4 0.0 0.1 0.3 0.0 Cattle sheep etc 3.9 0.0 0.3 0.0 0.0 Other livestock 0.0 0.0 2.7 0.1 0.2 Raw milk 0.0 0.0 0.1 0.0 0.0 Wool 7.0 0.0 0.1 0.0 0.1 Forestry 2.8 0.0 1.3 0.0 0.9 Fishing 5.2 0.0 1.3 0.1 0.0 Mining 0.7 0.0 4.9 1.5 6.2 Coal mining 3.1 0.0 1.9 0.5 0.1 Crude oil and natural gas 0.9 0.0 1.9 0.4 4.1 Ore mining 0.0 0.0 0.5 0.1 1.4 Other mining 0.5 0.0 0.6 0.5 0.7 Food manufacturing 5.0 -0.0 3.8 3.0 2.0 Meat Products 10.5 0.0 0.2 0.5 0.3 Vegetable oils 12.5 0.0 0.3 0.1 0.5 Grain, milled 0.0 -1.0 0.2 0.0 0.0 Sugar, refined 17.3 0.0 0.1 0.0 0.1 Forage 11.5 0.0 0.2 0.0 0.0 Prepared fish products 0.9 0.0 0.2 1.0 0.7 Other processed food 9.4 0.0 0.8 1.1 0.3 Beverages 12.7 0.0 0.6 0.2 0.1 Tobacco products 8.9 0.0 1.1 0.1 0.1 Non-food manufacturing 2.9 0.0 28.6 74.9 80.5 Textiles 0.2 0.0 2.0 9.1 4.5 Apparel and leather 0.2 0.0 1.5 9.3 1.6 Sawmills and furniture 1.9 0.0 0.9 2.2 0.7 Paper, printing, etc. 3.0 0.0 2.0 3.3 2.0 Petroleum refining 3.6 0.0 0.9 0.9 1.5 Chemicals 3.3 0.0 4.9 7.3 13.0 Build materials 2.7 0.0 1.6 1.4 0.7 Metals 1.7 0.0 3.1 1.5 5.9 Metal products 2.1 0.0 1.2 3.6 2.0 Machinery 3.3 0.0 3.1 4.4 11.6 Transport equipment 16.4 0.0 2.1 2.2 3.7
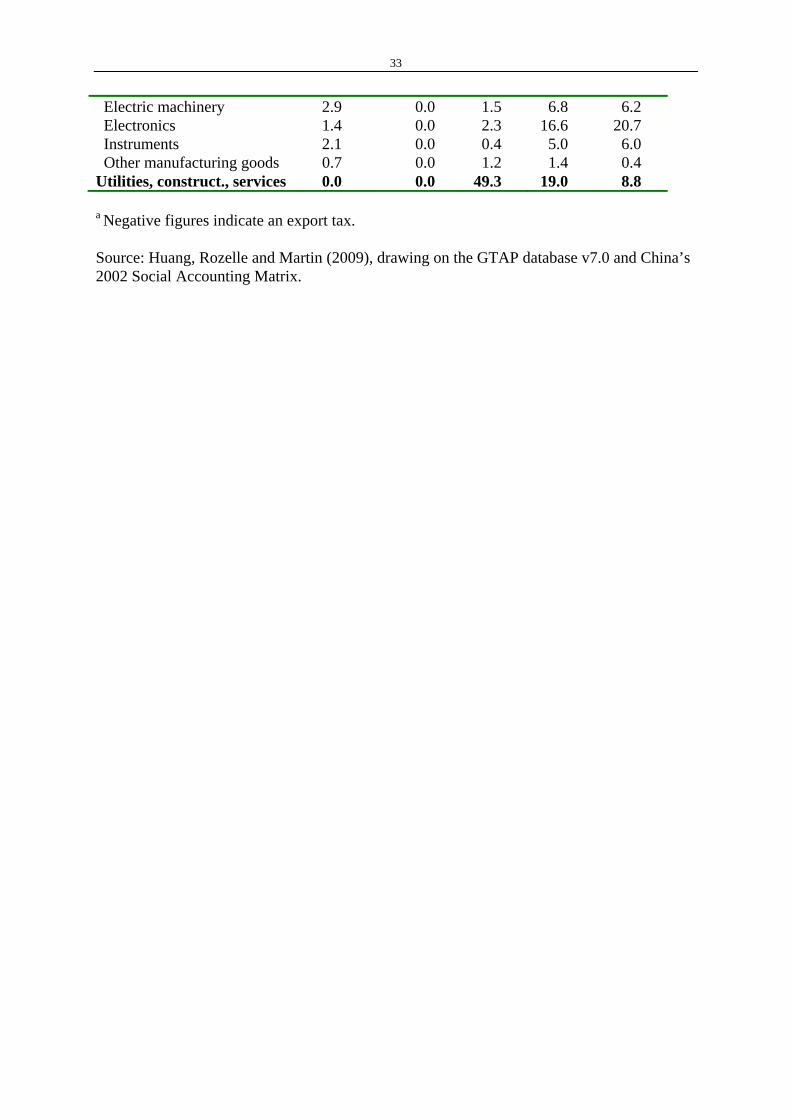
33
Electric machinery 2.9 0.0 1.5 6.8 6.2 Electronics 1.4 0.0 2.3 16.6 20.7 Instruments 2.1 0.0 0.4 5.0 6.0 Other manufacturing goods 0.7 0.0 1.2 1.4 0.4 Utilities, construct., services 0.0 0.0 49.3 19.0 8.8 a Negative figures indicate an export tax. Source: Huang, Rozelle and Martin (2009), drawing on the GTAP database v7.0 and China’s 2002 Social Accounting Matrix.

34
Table 2: Modeled liberalization scenarios for China Scenario Description ROW-Ag Agricultural liberalization in the rest of the world
- Elimination of production taxes and subsidies in agricultural and lightly processed food sectors
- Elimination of export taxes and subsidies in agricultural and lightly processed food sectors
- Elimination of import tariffs in agricultural and lightly processed food sector sectors
ROW All merchandise trade liberalization in the rest of the world
- Elimination of production taxes and subsidies in agricultural and lightly processed food sectors
- Elimination of export taxes and subsidies in agricultural and lightly processed food sectors
- Elimination of import tariffs in all sectors
DOM-Ag Agricultural liberalization in China - Elimination of export taxes and subsidies in agricultural and lightly
processed food sectors - Elimination of import tariffs in agricultural and lightly processed food
sectors
DOM All merchandise trade liberalization in China - Elimination of export taxes and subsidies in agricultural and lightly
processed food sector - Elimination of import tariffs in all sectors
LABOR Relaxation of the hukou system - Cut the indirect transactions costs from 81 to 34 percent of the non-farm
rural wage
LAND Introduction of land reform - Farm households do not include the returns to land in their temporal
migration decision
Source: Authors’ specifications.
35
Table 3: Exogenous demand and price shocks due to liberalization in the rest of the world
(percent change)
Elimination of all trade
distortions in ROW Elimination of agricultural
distortions in ROW
Export demand
Export price
Import price
Export demand
Export price
Import price
Agriculture: Paddy rice 94.9 4.2 .. 123.6 1.8 Wheat 15.5 3.5 2.8 45.8 1.4 3.6 Other grains 105.1 3.9 6.5 157.7 1.6 6.5 Vegetables and fruits 185.5 4.2 1.9 232.9 1.8 1.6 Oilseeds 10.3 4.0 -2.8 42.9 1.7 -2.3 Sugar cane and beet .. .. .. .. .. .. Plant-based fibers 30.0 3.3 10.0 51.4 1.3 11.5 Other crops -12.7 4.5 1.3 8.4 2.0 1.5 Cattle sheep etc -18.6 4.4 6.5 -3.1 1.9 6.6 Other livestock -20.8 3.8 0.7 -0.2 1.6 1.6 Raw milk -48.3 4.1 -1.8 -31.7 1.7 -0.7 Wool -13.1 3.8 4.9 10.1 1.6 4.9 Other primary products -7.8 2.7 0.5 2.0 0.6 1.1 Lightly processed food: Meat products 29.2 3.5 4.9 56.3 1.3 5.6 Vegetable oils -6.4 1.8 -0.2 5.7 0.3 -0.9 Grain, milled 148.8 3.0 4.2 192.1 0.9 3.4 Sugar, refined 410.2 3.0 1.4 560.4 0.8 2.0 Highly processed food 67.3 2.9 0.8 -14.1 0.8 -0.2 Non-food manufacturing: Textiles; apparel and leather 13.7 2.6 -0.2 -2.1 0.8 0.4 Other manufacturing sectors -3.3 2.2 0.7 -1.6 0.5 0.3 Services -10.5 2.5 0.1 -0.9 0.5 0.2 Total 2.2 2.4 0.6 -0.3 0.6 0.4 Source: Linkage model simulations (see van der Mensbrugghe, Valenzuela and Anderson 2009).
36
Table 4: Aggregate simulation results of prospective liberalizations for China
ROW DOM ROW-Ag DOM-Ag LABOR LAND Macroeconomy (percent change)
Welfare (EV) 0.5 -0.1 0.04 0.01 1.0 0.1 Real GDP -0.1 0.2 -0.2 0.1 0.8 0.3 Exports 1.9 5.8 -0.3 0.7 1.6 0.6 Imports 4.3 5.5 0.1 0.7 1.4 0.6 Terms of trade 1.8 -0.8 0.3 -0.1 -0.3 -0.1 CPI 2.9 -0.9 1.0 -0.3 1.4 0.7 Factor prices (percent) Return to agric land 16.3 -3.5 13.5 -3.1 -7.3 -2.5 Return to capital 2.2 -0.8 0.0 0.0 1.5 0.6 Unskilled wages: Urban 3.7 -1.1 1.2 -0.3 -17.7 -3.1 Rural non-agric 3.9 -1.3 1.3 -0.4 6.9 -3.9 Agricultural 4.4 -1.8 1.3 -0.4 23.7 8.8 Semi-skilled wages: Urban 3.9 -1.2 1.3 -0.3 -5.4 -3.1 Rural non-agric 4.9 -1.1 2.2 -0.4 25.5 -4.5 Agricultural 2.7 -1.1 0.0 0.0 20.1 11.7 Skilled wages: Urban 1.9 -0.9 0.0 0.0 0.9 0.3 Rural non-agric 1.9 -1.0 -0.1 0.0 0.9 0.2 Labor force (millions) Farm labor: 6.4 -1.6 5.7 -1.5 -27.9 -13.2 Unskilled 0.7 -0.2 0.6 -0.2 -15.6 -1.8 Semi-skill 5.7 -1.4 5.1 -1.3 -12.3 -11.3 Rural-urban temporary migration: -5.9 1.5 -5.3 1.4 35.7 12.1 Unskilled -0.6 0.1 -0.5 0.1 18.2 1.5 Semi-skill -5.3 1.3 -4.8 1.3 17.6 10.6 Skilled 0.0 0.0 0.0 0.0 0.0 0.0 Labor force (percent) Farm labor: 1.7 -0.4 1.6 -0.4 -7.6 -3.6 Unskilled 0.4 -0.1 0.4 -0.1 -9.8 -1.2 Semi-skill 2.7 -0.7 2.4 -0.6 -5.9 -5.4 Rural-urban temporary migration: -6.0 1.5 -5.4 1.4 36.5 12.3 Unskilled -1.5 0.4 -1.4 0.4 46.7 3.9 Semi-skill -10.4 2.6 -9.3 2.5 34.3 20.6 Skilled 0.0 0.0 0.0 0.0 0.0 0.0 Source: Authors’ Chinese CGE model simulations.
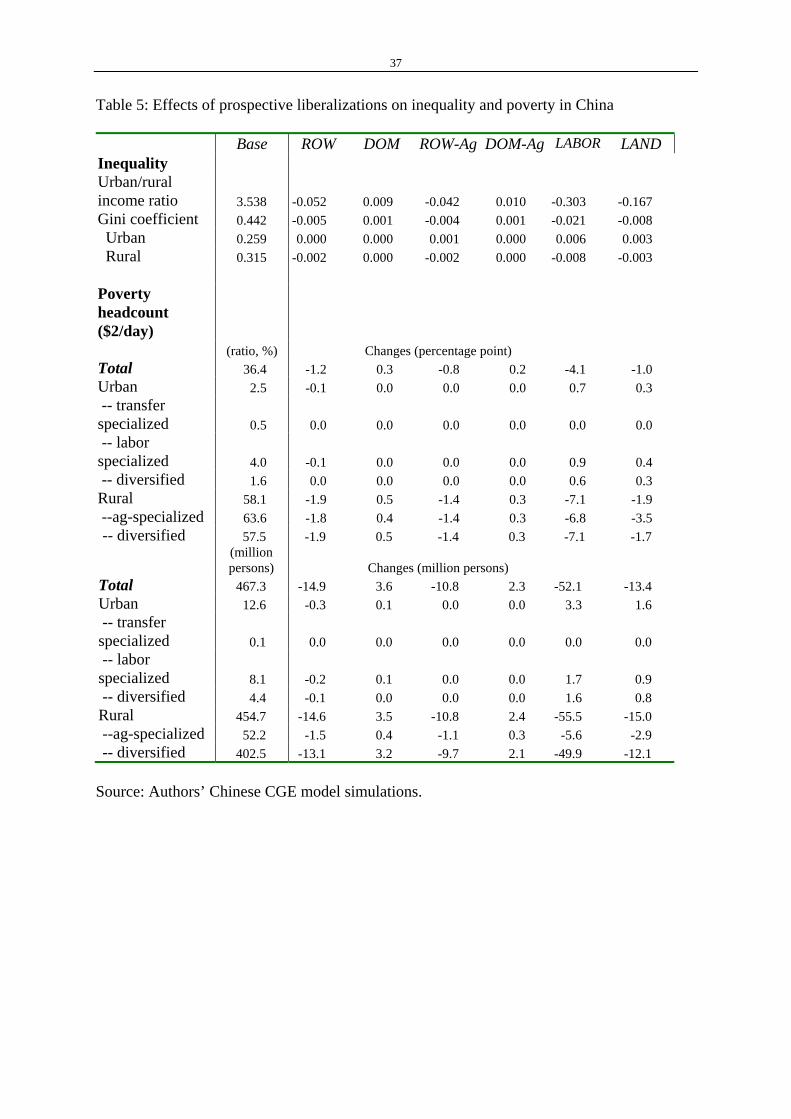
37
Table 5: Effects of prospective liberalizations on inequality and poverty in China Base ROW DOM ROW-Ag DOM-Ag LABOR LAND Inequality Urban/rural income ratio 3.538 -0.052 0.009 -0.042 0.010 -0.303 -0.167 Gini coefficient 0.442 -0.005 0.001 -0.004 0.001 -0.021 -0.008 Urban 0.259 0.000 0.000 0.001 0.000 0.006 0.003 Rural 0.315 -0.002 0.000 -0.002 0.000 -0.008 -0.003 Poverty headcount ($2/day)
(ratio, %) Changes (percentage point) Total 36.4 -1.2 0.3 -0.8 0.2 -4.1 -1.0 Urban 2.5 -0.1 0.0 0.0 0.0 0.7 0.3 -- transfer specialized 0.5 0.0 0.0 0.0 0.0 0.0 0.0 -- labor specialized 4.0 -0.1 0.0 0.0 0.0 0.9 0.4 -- diversified 1.6 0.0 0.0 0.0 0.0 0.6 0.3 Rural 58.1 -1.9 0.5 -1.4 0.3 -7.1 -1.9 --ag-specialized 63.6 -1.8 0.4 -1.4 0.3 -6.8 -3.5 -- diversified 57.5 -1.9 0.5 -1.4 0.3 -7.1 -1.7 (million
persons)
Changes (million persons)
Total 467.3 -14.9 3.6 -10.8 2.3 -52.1 -13.4 Urban 12.6 -0.3 0.1 0.0 0.0 3.3 1.6 -- transfer specialized 0.1 0.0 0.0 0.0 0.0 0.0 0.0 -- labor specialized 8.1 -0.2 0.1 0.0 0.0 1.7 0.9 -- diversified 4.4 -0.1 0.0 0.0 0.0 1.6 0.8 Rural 454.7 -14.6 3.5 -10.8 2.4 -55.5 -15.0 --ag-specialized 52.2 -1.5 0.4 -1.1 0.3 -5.6 -2.9 -- diversified 402.5 -13.1 3.2 -9.7 2.1 -49.9 -12.1 Source: Authors’ Chinese CGE model simulations.
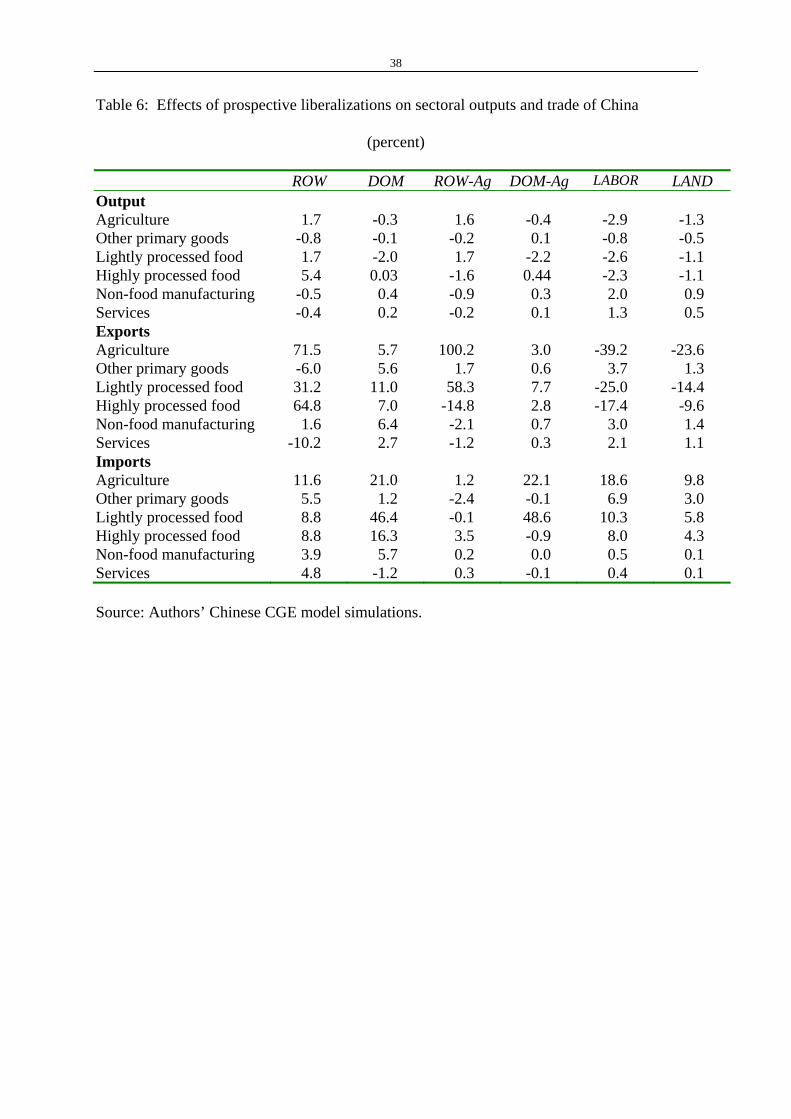
38
Table 6: Effects of prospective liberalizations on sectoral outputs and trade of China
(percent)
ROW DOM ROW-Ag DOM-Ag LABOR LAND Output Agriculture 1.7 -0.3 1.6 -0.4 -2.9 -1.3 Other primary goods -0.8 -0.1 -0.2 0.1 -0.8 -0.5 Lightly processed food 1.7 -2.0 1.7 -2.2 -2.6 -1.1 Highly processed food 5.4 0.03 -1.6 0.44 -2.3 -1.1 Non-food manufacturing -0.5 0.4 -0.9 0.3 2.0 0.9 Services -0.4 0.2 -0.2 0.1 1.3 0.5 Exports Agriculture 71.5 5.7 100.2 3.0 -39.2 -23.6 Other primary goods -6.0 5.6 1.7 0.6 3.7 1.3 Lightly processed food 31.2 11.0 58.3 7.7 -25.0 -14.4 Highly processed food 64.8 7.0 -14.8 2.8 -17.4 -9.6 Non-food manufacturing 1.6 6.4 -2.1 0.7 3.0 1.4 Services -10.2 2.7 -1.2 0.3 2.1 1.1 Imports Agriculture 11.6 21.0 1.2 22.1 18.6 9.8 Other primary goods 5.5 1.2 -2.4 -0.1 6.9 3.0 Lightly processed food 8.8 46.4 -0.1 48.6 10.3 5.8 Highly processed food 8.8 16.3 3.5 -0.9 8.0 4.3 Non-food manufacturing 3.9 5.7 0.2 0.0 0.5 0.1 Services 4.8 -1.2 0.3 -0.1 0.4 0.1 Source: Authors’ Chinese CGE model simulations.
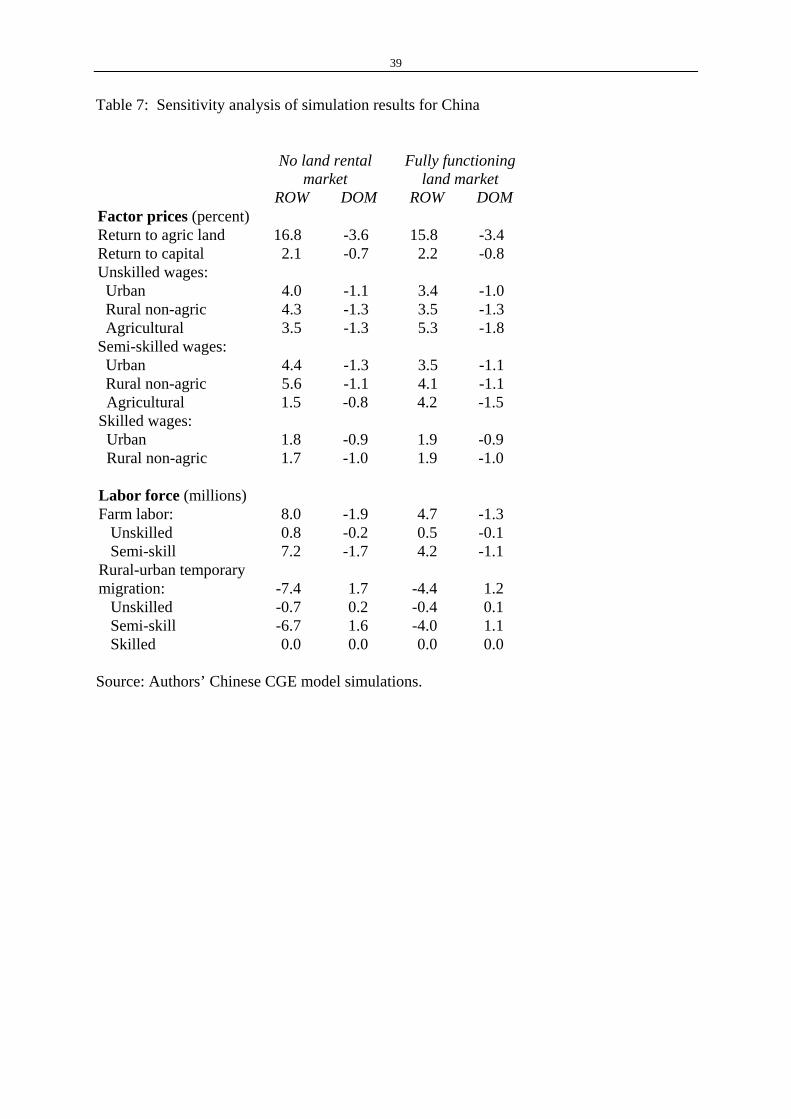
39
Table 7: Sensitivity analysis of simulation results for China
No land rental
market Fully functioning
land market ROW DOM ROW DOM
Factor prices (percent) Return to agric land 16.8 -3.6 15.8 -3.4 Return to capital 2.1 -0.7 2.2 -0.8 Unskilled wages: Urban 4.0 -1.1 3.4 -1.0 Rural non-agric 4.3 -1.3 3.5 -1.3 Agricultural 3.5 -1.3 5.3 -1.8 Semi-skilled wages: Urban 4.4 -1.3 3.5 -1.1 Rural non-agric 5.6 -1.1 4.1 -1.1 Agricultural 1.5 -0.8 4.2 -1.5 Skilled wages: Urban 1.8 -0.9 1.9 -0.9 Rural non-agric 1.7 -1.0 1.9 -1.0 Labor force (millions) Farm labor: 8.0 -1.9 4.7 -1.3 Unskilled 0.8 -0.2 0.5 -0.1 Semi-skill 7.2 -1.7 4.2 -1.1 Rural-urban temporary migration: -7.4 1.7 -4.4 1.2 Unskilled -0.7 0.2 -0.4 0.1 Semi-skill -6.7 1.6 -4.0 1.1 Skilled 0.0 0.0 0.0 0.0 Source: Authors’ Chinese CGE model simulations.
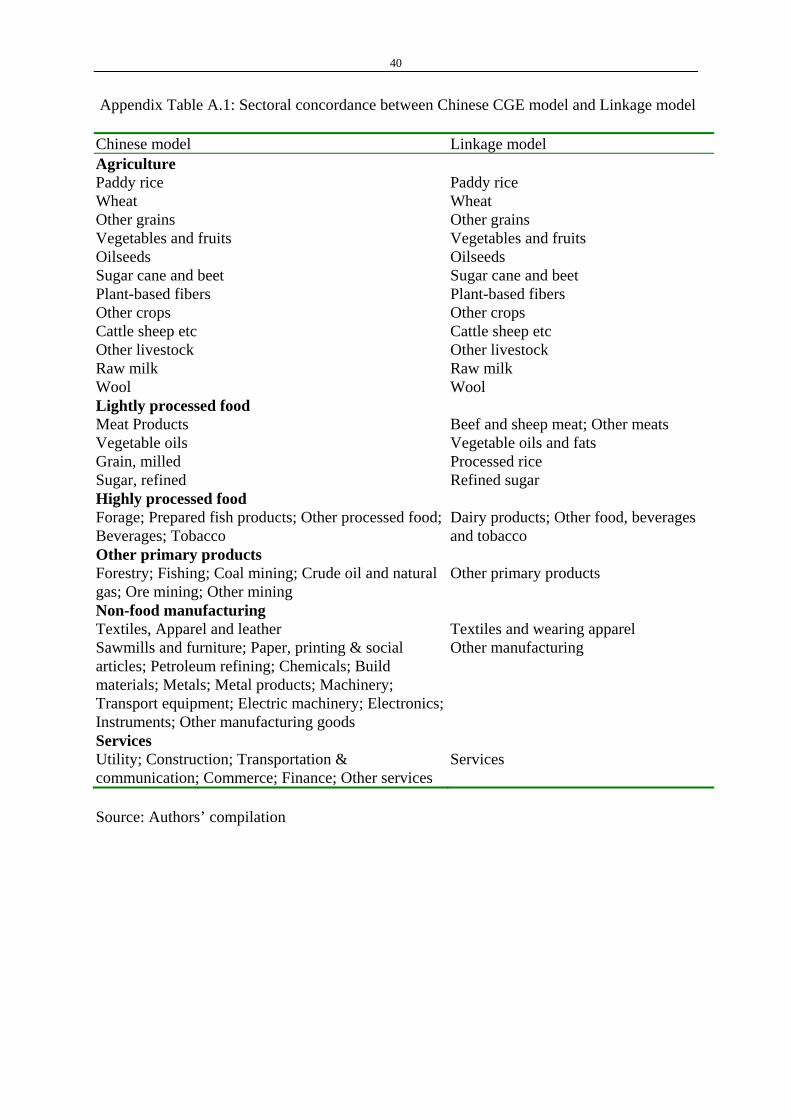
40
Appendix Table A.1: Sectoral concordance between Chinese CGE model and Linkage model Chinese model Linkage model Agriculture Paddy rice Paddy rice Wheat Wheat Other grains Other grains Vegetables and fruits Vegetables and fruits Oilseeds Oilseeds Sugar cane and beet Sugar cane and beet Plant-based fibers Plant-based fibers Other crops Other crops Cattle sheep etc Cattle sheep etc Other livestock Other livestock Raw milk Raw milk Wool Wool Lightly processed food Meat Products Beef and sheep meat; Other meats Vegetable oils Vegetable oils and fats Grain, milled Processed rice Sugar, refined Refined sugar Highly processed food Forage; Prepared fish products; Other processed food; Beverages; Tobacco
Dairy products; Other food, beverages and tobacco
Other primary products Forestry; Fishing; Coal mining; Crude oil and natural gas; Ore mining; Other mining
Other primary products
Non-food manufacturing Textiles, Apparel and leather Textiles and wearing apparel Sawmills and furniture; Paper, printing & social articles; Petroleum refining; Chemicals; Build materials; Metals; Metal products; Machinery; Transport equipment; Electric machinery; Electronics; Instruments; Other manufacturing goods
Other manufacturing
Services Utility; Construction; Transportation & communication; Commerce; Finance; Other services
Services
Source: Authors’ compilation
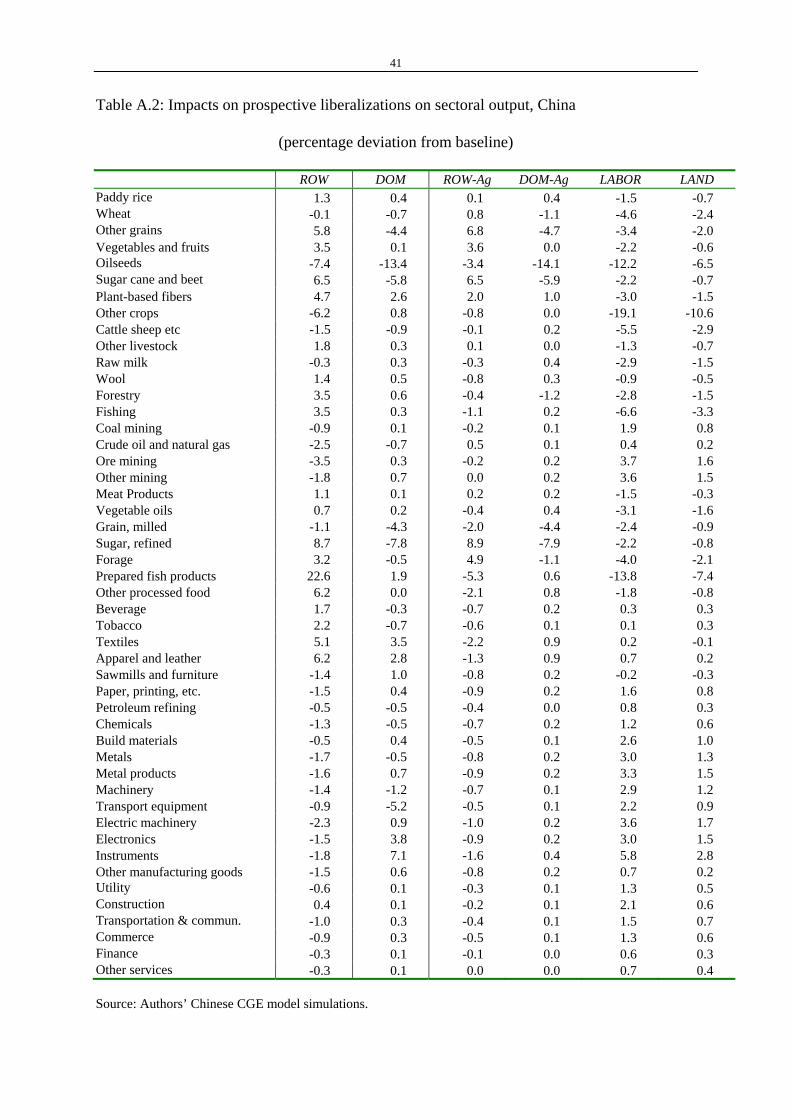
41
Table A.2: Impacts on prospective liberalizations on sectoral output, China
(percentage deviation from baseline)
ROW DOM ROW-Ag DOM-Ag LABOR LAND Paddy rice 1.3 0.4 0.1 0.4 -1.5 -0.7 Wheat -0.1 -0.7 0.8 -1.1 -4.6 -2.4 Other grains 5.8 -4.4 6.8 -4.7 -3.4 -2.0 Vegetables and fruits 3.5 0.1 3.6 0.0 -2.2 -0.6 Oilseeds -7.4 -13.4 -3.4 -14.1 -12.2 -6.5 Sugar cane and beet 6.5 -5.8 6.5 -5.9 -2.2 -0.7 Plant-based fibers 4.7 2.6 2.0 1.0 -3.0 -1.5 Other crops -6.2 0.8 -0.8 0.0 -19.1 -10.6 Cattle sheep etc -1.5 -0.9 -0.1 0.2 -5.5 -2.9 Other livestock 1.8 0.3 0.1 0.0 -1.3 -0.7 Raw milk -0.3 0.3 -0.3 0.4 -2.9 -1.5 Wool 1.4 0.5 -0.8 0.3 -0.9 -0.5 Forestry 3.5 0.6 -0.4 -1.2 -2.8 -1.5 Fishing 3.5 0.3 -1.1 0.2 -6.6 -3.3 Coal mining -0.9 0.1 -0.2 0.1 1.9 0.8 Crude oil and natural gas -2.5 -0.7 0.5 0.1 0.4 0.2 Ore mining -3.5 0.3 -0.2 0.2 3.7 1.6 Other mining -1.8 0.7 0.0 0.2 3.6 1.5 Meat Products 1.1 0.1 0.2 0.2 -1.5 -0.3 Vegetable oils 0.7 0.2 -0.4 0.4 -3.1 -1.6 Grain, milled -1.1 -4.3 -2.0 -4.4 -2.4 -0.9 Sugar, refined 8.7 -7.8 8.9 -7.9 -2.2 -0.8 Forage 3.2 -0.5 4.9 -1.1 -4.0 -2.1 Prepared fish products 22.6 1.9 -5.3 0.6 -13.8 -7.4 Other processed food 6.2 0.0 -2.1 0.8 -1.8 -0.8 Beverage 1.7 -0.3 -0.7 0.2 0.3 0.3 Tobacco 2.2 -0.7 -0.6 0.1 0.1 0.3 Textiles 5.1 3.5 -2.2 0.9 0.2 -0.1 Apparel and leather 6.2 2.8 -1.3 0.9 0.7 0.2 Sawmills and furniture -1.4 1.0 -0.8 0.2 -0.2 -0.3 Paper, printing, etc. -1.5 0.4 -0.9 0.2 1.6 0.8 Petroleum refining -0.5 -0.5 -0.4 0.0 0.8 0.3 Chemicals -1.3 -0.5 -0.7 0.2 1.2 0.6 Build materials -0.5 0.4 -0.5 0.1 2.6 1.0 Metals -1.7 -0.5 -0.8 0.2 3.0 1.3 Metal products -1.6 0.7 -0.9 0.2 3.3 1.5 Machinery -1.4 -1.2 -0.7 0.1 2.9 1.2 Transport equipment -0.9 -5.2 -0.5 0.1 2.2 0.9 Electric machinery -2.3 0.9 -1.0 0.2 3.6 1.7 Electronics -1.5 3.8 -0.9 0.2 3.0 1.5 Instruments -1.8 7.1 -1.6 0.4 5.8 2.8 Other manufacturing goods -1.5 0.6 -0.8 0.2 0.7 0.2 Utility -0.6 0.1 -0.3 0.1 1.3 0.5 Construction 0.4 0.1 -0.2 0.1 2.1 0.6 Transportation & commun. -1.0 0.3 -0.4 0.1 1.5 0.7 Commerce -0.9 0.3 -0.5 0.1 1.3 0.6 Finance -0.3 0.1 -0.1 0.0 0.6 0.3 Other services -0.3 0.1 0.0 0.0 0.7 0.4 Source: Authors’ Chinese CGE model simulations.