Embed Size (px)
Citation preview
“Economic and Industrial Development” EID – EMPLOY
Methodological guidelines for estimating the employment impacts of us-ing renewable energies in electricity gen-
eration
Annex 2: Country fact sheets
RE related gross employment in RETD member countries
Authors:
Carsten Nathani, Christian Schmid Rütter + Partner Socioeconomic Research + Consulting, Switzerland
Gustav Resch Vienna University of Technology, Energy Economics Group (EEG), Austria
with a contribution from Ulrike Lehr Gesellschaft für Wirtschaftliche Strukturforschung GWS, Osnabrück, Germany
Karlsruhe, 11. November 2012
Study commissioned by IEA’s Implementing Agreement on Renewa-
ble Energy Technology Deployment (IEA-RETD)
with contributions from

Project coordination: Fraunhofer Institute for Systems and Innovation Research
Contact:
Barbara Breitschopf
Breslauer Str. 48, D-76139 Karlsruhe, Tel. +49 721 6809 356/157, Fax –272
e-mail: [email protected]
I IEA-RETD EMPLOY EID
1 Overview ............................................................................................................... 1
2 Canada .................................................................................................................. 8
3 Denmark .............................................................................................................. 13
4 France .................................................................................................................. 19
5 Germany .............................................................................................................. 25
6 Ireland .................................................................................................................. 31
7 Japan ................................................................................................................... 36
8 Netherlands ......................................................................................................... 41
9 Norway ................................................................................................................ 47
10 United Kingdom ................................................................................................. 52
11 Tunisia ................................................................................................................ 58
12 References ......................................................................................................... 63

II IEA-RETD EMPLOY EID
IEA-RETD EMPLOY EID 1
1 Overview
1.1 Introduction
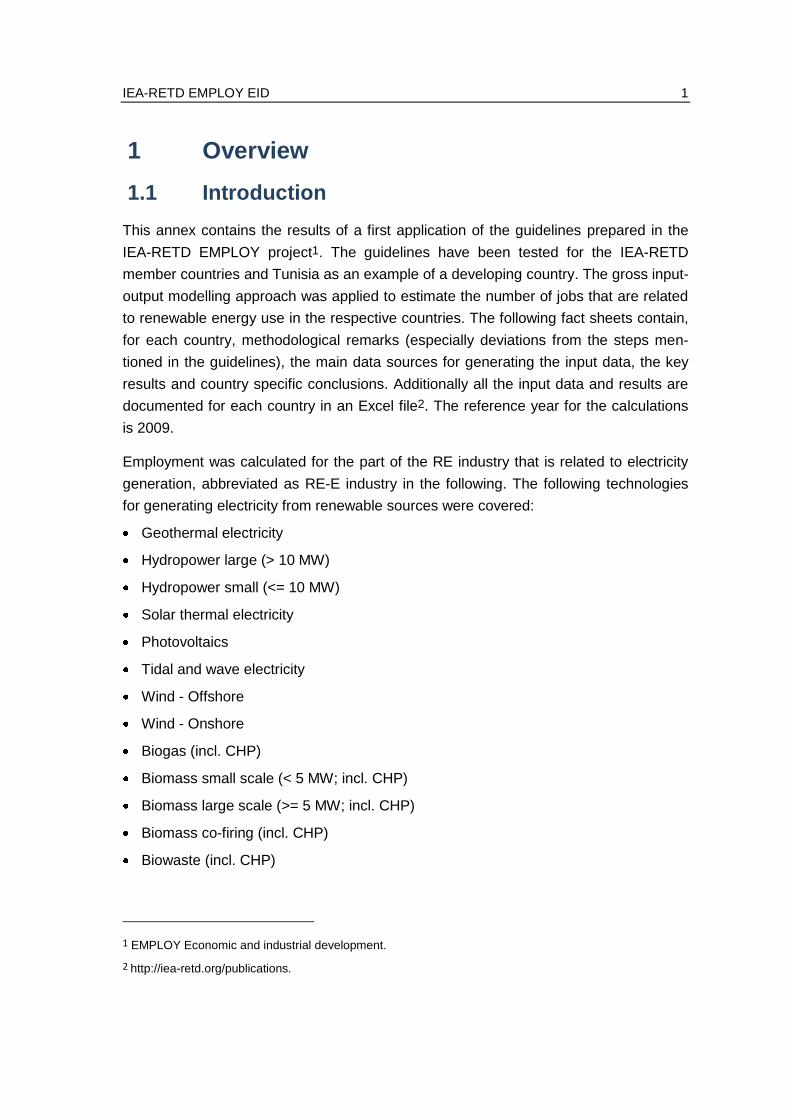
This annex contains the results of a first application of the guidelines prepared in the
IEA-RETD EMPLOY project1. The guidelines have been tested for the IEA-RETD
member countries and Tunisia as an example of a developing country. The gross input-
output modelling approach was applied to estimate the number of jobs that are related
to renewable energy use in the respective countries. The following fact sheets contain,
for each country, methodological remarks (especially deviations from the steps men-
tioned in the guidelines), the main data sources for generating the input data, the key
results and country specific conclusions. Additionally all the input data and results are
documented for each country in an Excel file2. The reference year for the calculations
is 2009.
Employment was calculated for the part of the RE industry that is related to electricity
generation, abbreviated as RE-E industry in the following. The following technologies
for generating electricity from renewable sources were covered:
Geothermal electricity
Hydropower large (> 10 MW)
Hydropower small (<= 10 MW)
Solar thermal electricity
Photovoltaics
Tidal and wave electricity
Wind - Offshore
Wind - Onshore
Biogas (incl. CHP)
Biomass small scale (< 5 MW; incl. CHP)
Biomass large scale (>= 5 MW; incl. CHP)
Biomass co-firing (incl. CHP)
Biowaste (incl. CHP)
1 EMPLOY Economic and industrial development.
2 http://iea-retd.org/publications.

2 IEA-RETD EMPLOY EID
For each of these technologies the life cycle phases manufacturing, construction and
installation (MCI) and operation and maintenance (O&M) with the main economic ac-
tivities, that generate employment, were considered. The demolition phase was ne-
glected, since this phase is of minor importance for current employment, compared to
the construction and operation phases, and data availability is poor. The full list of ac-
tivities that is taken into account, can be found in the accompanying Excel files. As an
example the following table shows an overview of activities taken into account for the
wind onshore technology.
Table 1-1: Activities in the life cycle of onshore wind power plants
Life cycle phase Employment generating activities
Planning and project devel-opment
Planning and project development
Manufacturing, construction and installation
Manufacturing of wind turbine (WT) nacelles
Manufacturing of WT rotor blades
Manufacturing of WT towers
Transport of WT components to installation site
Site preparation (e.g. road construction)
WT foundations
Installation of WTs on site
Connection of the wind power plant (WPP) to the net
Insurance
Miscellaneous activities
Operation and maintenance
WPP operation
Maintenance
Land lease
Insurance services
Financial services
Power supply
Miscellaneous activities
Due to the restricted resources it was not possible to do a full scale study on RE relat-
ed employment. Therefore some simplifications were necessary:
Data on installation capacities, electricity generation and biomass input are country
specific as well as data on specific installation, operation and fuel costs. As a simpli-
fication the same cost structures were used for all the countries.
Comprehensive data on imports and exports of RE technology products is scarce.
We covered the most important trade markets (wind, photovoltaics and hydro power,
wood pellets), but assumed zero net trade for the other technologies. For wind tech-
nology, data on domestic production of wind technology industry, imports and ex-
ports were derived from the IEA wind annual reports 2009 and 2010 (IEA 2010b,
IEA 2011b) and national wind energy industry associations. For photovoltaics, the
IEA-RETD EMPLOY EID 3
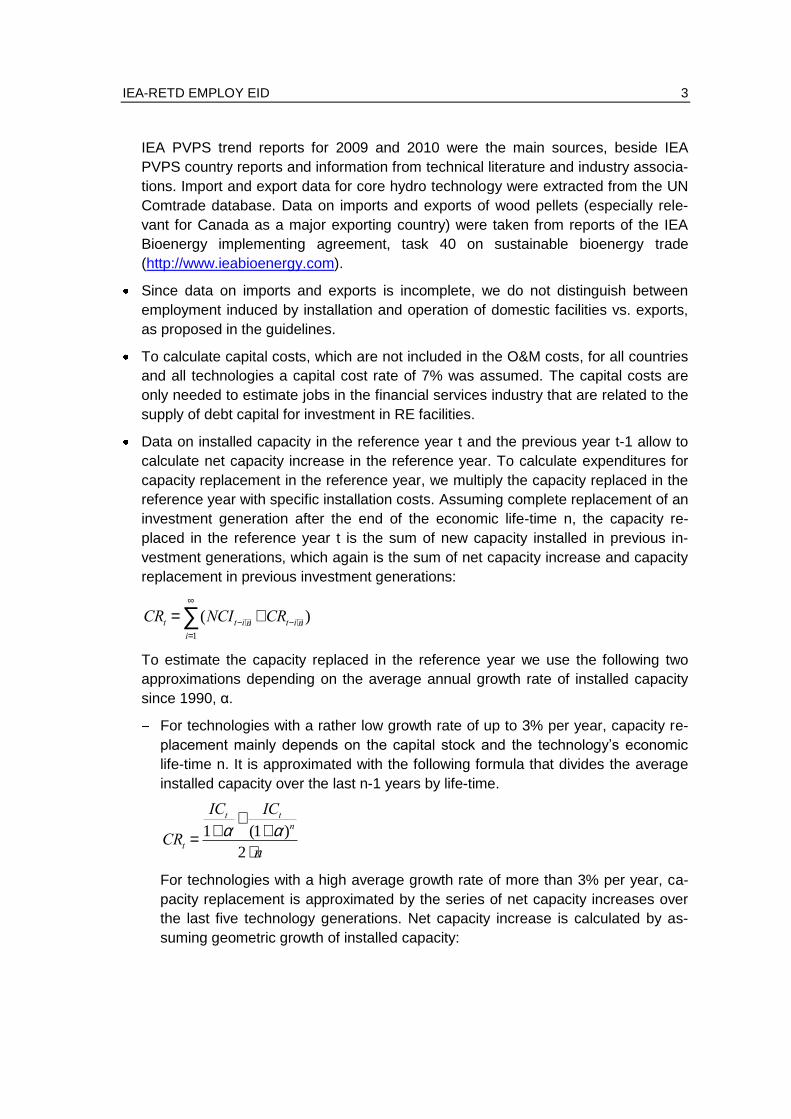
IEA PVPS trend reports for 2009 and 2010 were the main sources, beside IEA
PVPS country reports and information from technical literature and industry associa-
tions. Import and export data for core hydro technology were extracted from the UN
Comtrade database. Data on imports and exports of wood pellets (especially rele-
vant for Canada as a major exporting country) were taken from reports of the IEA
Bioenergy implementing agreement, task 40 on sustainable bioenergy trade
(http://www.ieabioenergy.com).
Since data on imports and exports is incomplete, we do not distinguish between
employment induced by installation and operation of domestic facilities vs. exports,
as proposed in the guidelines.
To calculate capital costs, which are not included in the O&M costs, for all countries
and all technologies a capital cost rate of 7% was assumed. The capital costs are
only needed to estimate jobs in the financial services industry that are related to the
supply of debt capital for investment in RE facilities.
Data on installed capacity in the reference year t and the previous year t-1 allow to
calculate net capacity increase in the reference year. To calculate expenditures for
capacity replacement in the reference year, we multiply the capacity replaced in the
reference year with specific installation costs. Assuming complete replacement of an
investment generation after the end of the economic life-time n, the capacity re-
placed in the reference year t is the sum of new capacity installed in previous in-
vestment generations, which again is the sum of net capacity increase and capacity
replacement in previous investment generations:
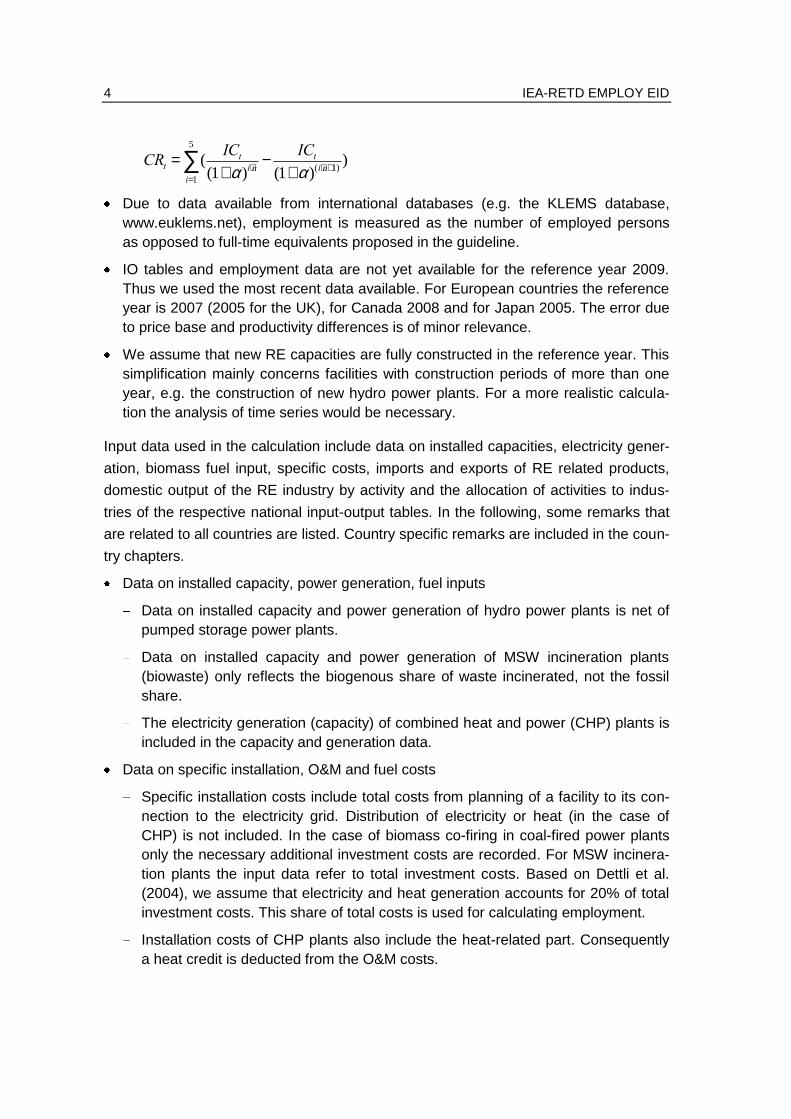
CRt = (NCIt-i×ni=1
¥
å +CRt-i×n )
To estimate the capacity replaced in the reference year we use the following two
approximations depending on the average annual growth rate of installed capacity
since 1990, α.
For technologies with a rather low growth rate of up to 3% per year, capacity re-
placement mainly depends on the capital stock and the technology’s economic
life-time n. It is approximated with the following formula that divides the average
installed capacity over the last n-1 years by life-time.
CRt =
ICt1+a
+ICt
(1+a)n
2 ×n
For technologies with a high average growth rate of more than 3% per year, ca-
pacity replacement is approximated by the series of net capacity increases over
the last five technology generations. Net capacity increase is calculated by as-
suming geometric growth of installed capacity:
4 IEA-RETD EMPLOY EID
CRt = (ICt
(1+a)i×n-
ICt
(1+a)(i×n+1))
i=1
5
å
Due to data available from international databases (e.g. the KLEMS database,
www.euklems.net), employment is measured as the number of employed persons
as opposed to full-time equivalents proposed in the guideline.
IO tables and employment data are not yet available for the reference year 2009.
Thus we used the most recent data available. For European countries the reference
year is 2007 (2005 for the UK), for Canada 2008 and for Japan 2005. The error due
to price base and productivity differences is of minor relevance.
We assume that new RE capacities are fully constructed in the reference year. This
simplification mainly concerns facilities with construction periods of more than one
year, e.g. the construction of new hydro power plants. For a more realistic calcula-
tion the analysis of time series would be necessary.
Input data used in the calculation include data on installed capacities, electricity gener-
ation, biomass fuel input, specific costs, imports and exports of RE related products,
domestic output of the RE industry by activity and the allocation of activities to indus-
tries of the respective national input-output tables. In the following, some remarks that
are related to all countries are listed. Country specific remarks are included in the coun-
try chapters.
Data on installed capacity, power generation, fuel inputs
Data on installed capacity and power generation of hydro power plants is net of
pumped storage power plants.
Data on installed capacity and power generation of MSW incineration plants
(biowaste) only reflects the biogenous share of waste incinerated, not the fossil
share.
The electricity generation (capacity) of combined heat and power (CHP) plants is
included in the capacity and generation data.
Data on specific installation, O&M and fuel costs
Specific installation costs include total costs from planning of a facility to its con-
nection to the electricity grid. Distribution of electricity or heat (in the case of
CHP) is not included. In the case of biomass co-firing in coal-fired power plants
only the necessary additional investment costs are recorded. For MSW incinera-
tion plants the input data refer to total investment costs. Based on Dettli et al.
(2004), we assume that electricity and heat generation accounts for 20% of total
investment costs. This share of total costs is used for calculating employment.
Installation costs of CHP plants also include the heat-related part. Consequently
a heat credit is deducted from the O&M costs.
IEA-RETD EMPLOY EID 5
Specific O&M costs do not include capital costs. These are estimated seperately
as described above.
With regard to fuel costs, the cost of waste supply to waste incineration plants
(waste collection etc.) is not considered in calculating RE related employment.
Waste collection and supply is not considered as part of the RE system bounda-
ries, since collection for waste treatment would be necessary in any case, irre-
spective of energy recovery.
All cost data reflect purchasers’ prices, net of VAT, i.e. they include trade and
transport margins.
1.2 Conclusions from the calculation experience
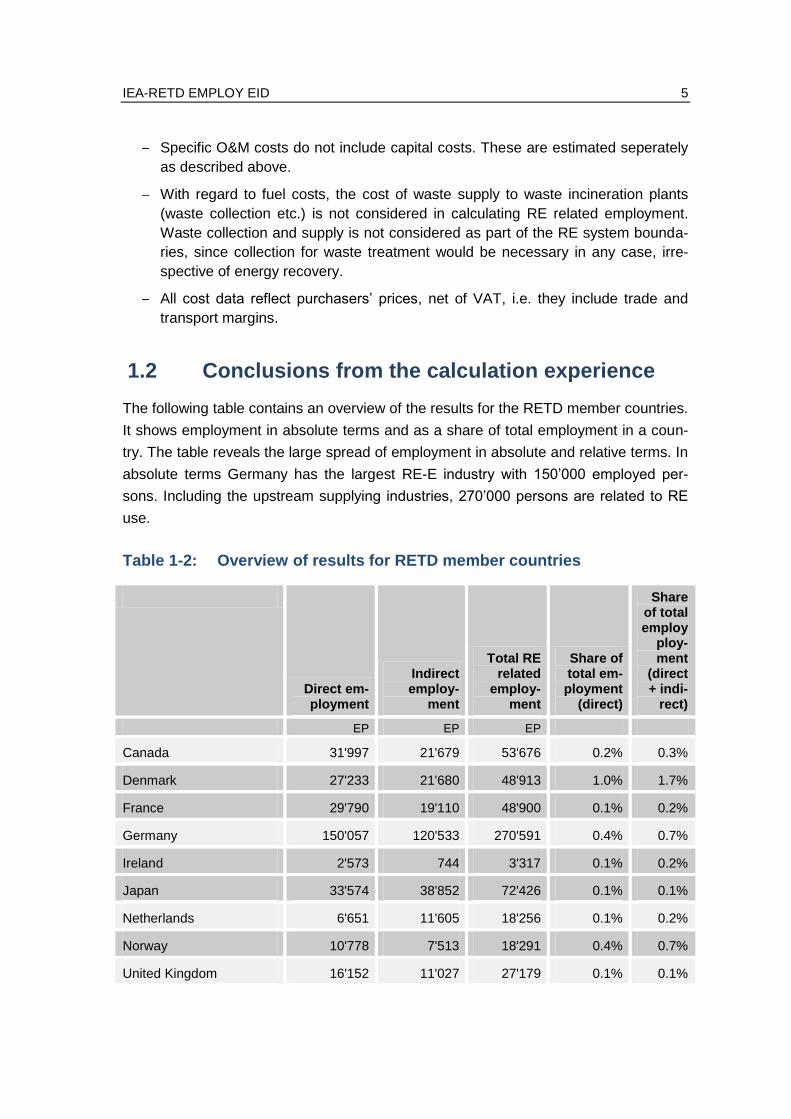
The following table contains an overview of the results for the RETD member countries.
It shows employment in absolute terms and as a share of total employment in a coun-
try. The table reveals the large spread of employment in absolute and relative terms. In
absolute terms Germany has the largest RE-E industry with 150’000 employed per-
sons. Including the upstream supplying industries, 270’000 persons are related to RE
use.
Table 1-2: Overview of results for RETD member countries
Direct em-ployment
Indirect employ-
ment
Total RE related
employ-ment
Share of total em-ployment
(direct)
Share of total employ
ploy-ment
(direct + indi-
rect)
EP EP EP
Canada 31'997 21'679 53'676 0.2% 0.3%
Denmark 27'233 21'680 48'913 1.0% 1.7%
France 29'790 19'110 48'900 0.1% 0.2%
Germany 150'057 120'533 270'591 0.4% 0.7%
Ireland 2'573 744 3'317 0.1% 0.2%
Japan 33'574 38'852 72'426 0.1% 0.1%
Netherlands 6'651 11'605 18'256 0.1% 0.2%
Norway 10'778 7'513 18'291 0.4% 0.7%
United Kingdom 16'152 11'027 27'179 0.1% 0.1%
6 IEA-RETD EMPLOY EID
In relative terms the RE-E industry has the largest share in total employment in Den-
mark. The RE-E industry itself accounts for 1% of total employment. Including indirect
effects, 1.7% of employees work for RE deployment in Denmark and abroad. The de-
tailed results in the following chapters reveal the specific structural characteristics of
the RE-E industry in the RETD member countries with regard to technologies and life
cycle phases.
The calculations for the RETD member countries have shown that in general the guide-
lines for the gross IO modelling approach are feasible for estimating employment that is
related to renewable energy use. As in every modelling exercise the results are deter-
mined by the quality of input data and assumptions. In the following some conclusions
are drawn with regard to data collection, methodology and results.
Data collection
Physical data on installed capacities, electricity generation and fuel inputs usually
are available from official statistics or industry associations, though the technology
detail may vary. Thus the level of detail applied in a study has to be tailored to the
available data or technical expertise has to be available to further differentiate the
data.
Data on specific costs are usually not available from statistical sources but from
studies that analyse cost developments. It may be difficult to find costs that refer to a
specific country.
Data on cost structures, that distribute total costs to cost components and further to
economic activities, are less abundant. Here it may be difficult to find comprehen-
sive data for a specific country. In this case additional expertise may be required to
adapt cost information to the respective country.
With the available physical and cost data, the expenditures for construction and op-
eration of domestic RE facilities can be calculated. It is more difficult to comprehen-
sively determine imports and exports, that allow to calculate output of the domestic
RE industry. If these data are not readily available, a survey of enterprises or indus-
try associations may be required to some extent. For some countries a good cover-
age of imports and exports will be critical for the accuracy of results.
Methodology and results
The methodological approach is rather straightforward, but requires some knowledge
on RE technologies and on input-output modelling. It can be flexibly adapted to differ-
ent data availability situations. Existing data on turnover or direct employment in the RE
industry can be integrated to improve the accuracy of the results. The latter is amongst
others influenced by the fact that industry-average values from national accounts data
on employment intensity and input structures are used as proxies for the enterprises in

IEA-RETD EMPLOY EID 7
the RE industry. If possible this assumption should be cross-checked with other availa-
ble data to improve results.
Even though the guidelines are restricted to electricity generating technologies, they
can easily be extended to heat generation and biofuel production from renewable
sources.
8 IEA-RETD EMPLOY EID
2 Canada
This chapter contains a brief overview of methodological remarks, input data and re-
sults of the calculations for Canada. Detailed input data and results can be found in the
annex Excel file “Annex_Data_Canada.xls”.
2.1 Methodological remarks
The employment calculations for Canada followed the methodological approach out-
lined in the guidelines with the following exceptions:
Domestic output of PV modules was directly estimated from data on production in
physical units (IEA 2010 and IEA 2011) and cost data, instead of calculating the da-
ta from expenditures, imports and exports, as foreseen in the guidelines (cf. chapter
4.3.3, calculation steps 2 and 3).
2.2 Input data
The input data used for the calculations are documented in detail in the Excel file. The
following data sources were used to generate the input data:
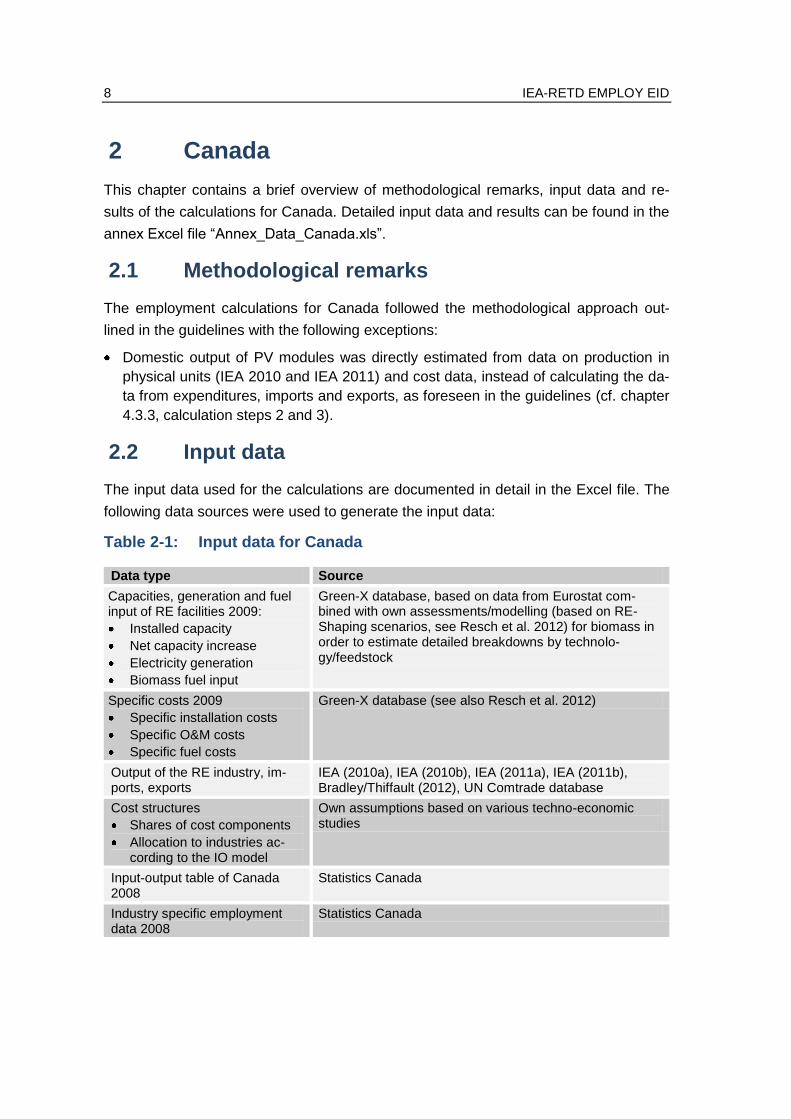
Table 2-1: Input data for Canada
Data type Source
Capacities, generation and fuel input of RE facilities 2009:
Installed capacity
Net capacity increase
Electricity generation
Biomass fuel input
Green-X database, based on data from Eurostat com-bined with own assessments/modelling (based on RE-Shaping scenarios, see Resch et al. 2012) for biomass in order to estimate detailed breakdowns by technolo-gy/feedstock
Specific costs 2009
Specific installation costs
Specific O&M costs
Specific fuel costs
Green-X database (see also Resch et al. 2012)
Output of the RE industry, im-ports, exports
IEA (2010a), IEA (2010b), IEA (2011a), IEA (2011b), Bradley/Thiffault (2012), UN Comtrade database
Cost structures
Shares of cost components
Allocation to industries ac-cording to the IO model
Own assumptions based on various techno-economic studies
Input-output table of Canada 2008
Statistics Canada
Industry specific employment data 2008
Statistics Canada
IEA-RETD EMPLOY EID 9
2.3 Results
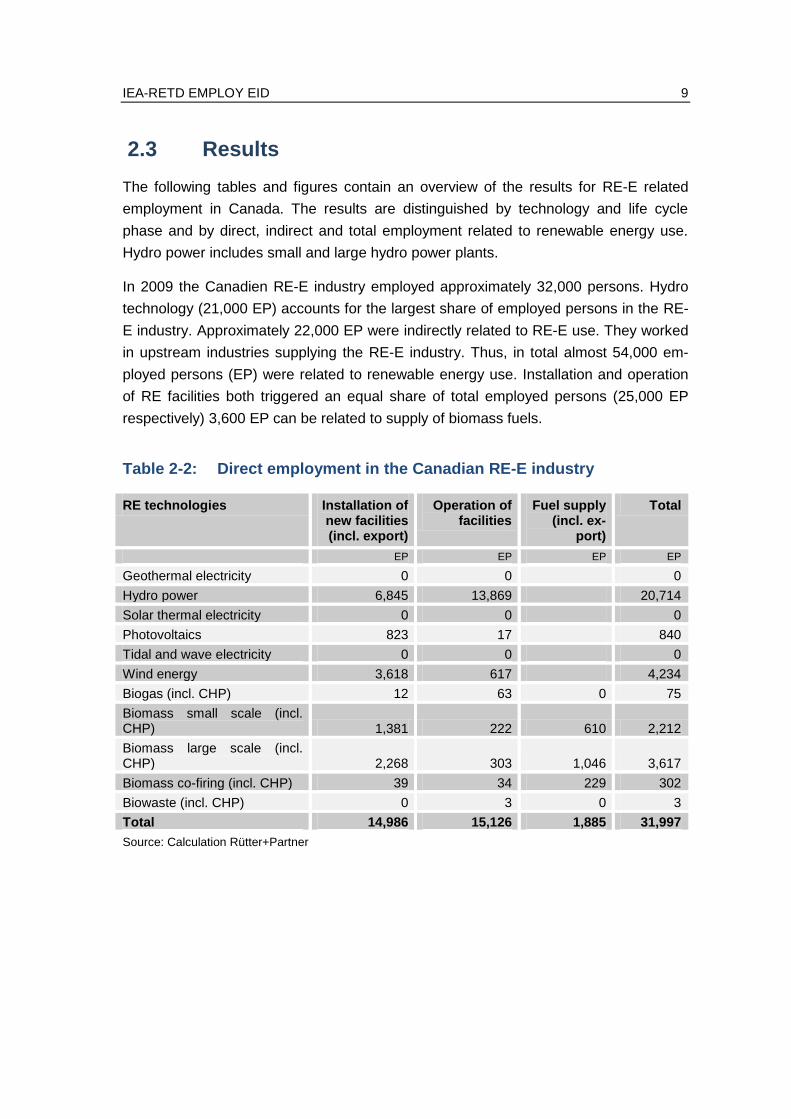
The following tables and figures contain an overview of the results for RE-E related
employment in Canada. The results are distinguished by technology and life cycle
phase and by direct, indirect and total employment related to renewable energy use.
Hydro power includes small and large hydro power plants.
In 2009 the Canadien RE-E industry employed approximately 32,000 persons. Hydro
technology (21,000 EP) accounts for the largest share of employed persons in the RE-
E industry. Approximately 22,000 EP were indirectly related to RE-E use. They worked
in upstream industries supplying the RE-E industry. Thus, in total almost 54,000 em-
ployed persons (EP) were related to renewable energy use. Installation and operation
of RE facilities both triggered an equal share of total employed persons (25,000 EP
respectively) 3,600 EP can be related to supply of biomass fuels.
Table 2-2: Direct employment in the Canadian RE-E industry
RE technologies Installation of new facilities (incl. export)
Operation of facilities
Fuel supply (incl. ex-
port)
Total
EP EP EP EP
Geothermal electricity 0 0 0
Hydro power 6,845 13,869 20,714
Solar thermal electricity 0 0 0
Photovoltaics 823 17 840
Tidal and wave electricity 0 0 0
Wind energy 3,618 617 4,234
Biogas (incl. CHP) 12 63 0 75
Biomass small scale (incl. CHP) 1,381 222 610 2,212
Biomass large scale (incl. CHP) 2,268 303 1,046 3,617
Biomass co-firing (incl. CHP) 39 34 229 302
Biowaste (incl. CHP) 0 3 0 3
Total 14,986 15,126 1,885 31,997
Source: Calculation Rütter+Partner

10 IEA-RETD EMPLOY EID
Table 2-3: Indirect RE-E-related employment in Canada
RE technologies Installation of new facilities (incl. export)
Operation of facilities
Fuel supply (incl. ex-
port)
Total
EP EP EP EP
Geothermal electricity 0 0 0
Hydro power 4,662 9,131 13,793
Solar thermal electricity 0 0 0
Photovoltaics 566 12 579
Tidal and wave electricity 0 0 0
Wind energy 2,402 387 2,789
Biogas (incl. CHP) 8 41 0 49
Biomass small scale (incl. CHP) 904 132 584 1,621
Biomass large scale (incl. CHP) 1,485 183 926 2,594
Biomass co-firing (incl. CHP) 25 20 208 253
Biowaste (incl. CHP) 0 2 0 2
Total 10,052 9,908 1,718 21,679
Source: Calculation Rütter+Partner
Table 2-4: Total RE-E-related employment in Canada
RE technologies Installation of new facilities (incl. export)
Operation of facilities
Fuel supply (incl. ex-
port)
Total
EP EP EP EP
Geothermal electricity 0 0 0 0
Hydro power 11,507 23,000 0 34,507
Solar thermal electricity 0 0 0 0
Photovoltaics 1,389 29 0 1,419
Tidal and wave electricity 0 0 0 0
Wind energy 6,019 1,004 0 7,023
Biogas (incl. CHP) 20 104 0 124
Biomass small scale (incl. CHP) 2,285 354 1,194 3,833
Biomass large scale (incl. CHP) 3,753 485 1,972 6,210
Biomass co-firing (incl. CHP) 64 54 437 555
Biowaste (incl. CHP) 1 4 0 5
Total 25,038 25,034 3,603 53,676
Source: Calculation Rütter+Partner

IEA-RETD EMPLOY EID 11
Figure 2-1: Direct employment in the RE-E industry by technology
0 5'000 10'000 15'000 20'000
Geothermal electricity
Hydropower large
Hydropower small
Solar thermal electricity
Photovoltaics
Tidal and wave electricity
Wind - Offshore
Wind - Onshore
Biogas (incl. CHP)
Biomass small scale (incl. CHP)
Biomass large scale (incl. CHP)
Biomass co-firing (incl. CHP)
Biowaste (incl. CHP)
Installation of new facilities Operation of facilities Fuels
Employed persons
Figure 2-2: Total employment in the RE-E industry and upstream indus-
tries by life cycle phase
14'986 15'126
1'885
10'052 9'908
1'718
0
4'000
8'000
12'000
16'000
20'000
24'000
28'000
Installation of new facilities Operation of facilities Biomass fuel supply
Employed persons
Direct employment Indirect employment

12 IEA-RETD EMPLOY EID
2.4 Conclusions
The application of the guidelines was feasible for Canada. Data on imports and exports
could mainly be identified for wind, PV, partially for hydro technology and for wood pel-
lets. A more comprehensive study could possibly improve data on imports and exports
in the hydro and the biomass sector.
A comparison with existing studies (e.g. Delphi 2007) is difficult due to differing refer-
ence years, methodological approaches and input data. This would require an in-depth-
analysis that was not feasible in this project. A rough comparison shows that the results
of this study for the year 2009 generally lie between the results in Delphi (2007) for
2004 and the projections for 2012.
IEA-RETD EMPLOY EID 13
3 Denmark
This chapter contains a brief overview of methodological remarks, input data and re-
sults of the calculations for Denmark. Detailed input data and results can be found in
the annex Excel file “Annex_Data_Denmark.xls”.
3.1 Methodological remarks
The employment calculations for Denmark followed the methodological approach out-
lined in the guidelines with the following exceptions:
In Denmark annual data on employment, turnover and exports of the wind industry
are collected by the Danish wind industry association via enterprise surveys (DWIA
2010). Therefore data on direct employment in the wind industry was directly taken
from the DWIA. Output and exports of the wind industry were adjusted to match the
DWIA data and distributed to cost components according to the cost structure of
wind power plants (cf. guidelines, chapter 4.3.3, calculation steps 2 and 3).
Domestic output of PV modules was directly estimated from data on production in
physical units (IEA 2010a and IEA 2011a) and cost data, instead of calculating the
data from expenditures, imports and exports, as proposed in the guidelines (cf.
guidelines, chapter 4.3.3, calculation steps 2 and 3).
3.2 Input data
The input data used for the calculations are documented in detail in the Excel file. The
following data sources were used to generate the input data:
Table 3-1: Input data for Denmark
Data type Source
Capacities, generation and fuel input of RE facilities 2009:
Installed capacity
Net capacity increase
Electricity generation
Biomass fuel input
Green-X database, based on data from Eurostat com-bined with own assessments/modelling (based on RE-Shaping scenarios (see Resch et al. (2012)) for biomass in order to estimate detailed breakdowns by technolo-gy/feedstock
Specific costs 2009
Specific installation costs
Specific O&M costs
Specific fuel costs
Green-X database (see also Resch et al. (2012))
Output of the RE industry by technology, imports, exports
DWIA (2010), IEA (2010a), IEA (2010b), IEA (2011a), IEA (2011b), UN Comtrade database
14 IEA-RETD EMPLOY EID
Data type Source
Cost structures
Shares of cost components
Allocation to industries ac-cording to the IO model
Own assumptions based on various techno-economic studies
Input-output table of Denmark 2007
Download from Eurostat website (Eurostat 2011)
Industry specific employment data
KLEMS database; Download from www.euklems.net
3.3 Results
The following tables and figures contain an overview of the results for RE-E related
employment in Denmark. The results are distinguished by technology and life cycle
phase and by direct, indirect and total employment related to renewable energy use.
In 2009 the Danish RE-E industry employed approximately 27,000 persons. Direct em-
ployment is dominated by wind technology (approx. 25,000 EP). Almost 22,000 EP
were indirectly related to RE-E use. They worked in upstream industries supplying the
RE-E industry. Thus, in total almost 49,000 employed persons (EP) were related to
renewable energy use. Installation of new RE facilities, mainly in foreign countries, ac-
counted for the major share of total employed persons (over 46,000 EP). Operation of
RE facilities and supply of biomass fuels have a much lower relevance with between
1,000 and 2,000 jobs in 2009.
IEA-RETD EMPLOY EID 15
Table 3-2: Direct employment in the Danish RE-E industry
RE technologies Installation of new facilities (incl. export)
Operation of facilities
Fuel supply (incl. ex-
port)
Total
EP EP EP EP
Geothermal electricity 0 0 0
Hydro power large (> 10 MW) 0 0 0
Hydro power small (<= 10 MW) 0 3 3
Solar thermal electricity 0 0 0
Photovoltaics 283 1 284
Tidal and wave electricity 0 0 0
Wind 24,027 673 24,700
Biogas (incl. CHP) 4 40 93 137
Biomass small scale (incl. CHP) 743 201 326 1,269
Biomass large scale (incl. CHP) 391 144 179 713
Biomass co-firing (incl. CHP) 9 35 28 72
Biowaste (incl. CHP) 20 36 0 56
Total 25,477 1,131 625 27,233
Source: Calculation Rütter+Partner
Table 3-3: Indirect RE-related employment in Denmark
RE technologies Installation of new facilities (incl. export)
Operation of facilities
Fuel supply (incl. ex-
port)
Total
EP EP EP EP
Geothermal electricity 0 0 0
Hydro power large (> 10 MW) 0 0 0
Hydro power small (<= 10 MW) 0 1 1
Solar thermal electricity 0 0 0
Photovoltaics 290 0 290
Tidal and wave electricity 0 0 0
Wind 19,810 293 0 20,103
Biogas (incl. CHP) 3 12 72 87
Biomass small scale (incl. CHP) 493 49 211 754
Biomass large scale (incl. CHP) 259 20 124 403
Biomass co-firing (incl. CHP) 6 3 15 24
Biowaste (incl. CHP) 14 5 0 19
16 IEA-RETD EMPLOY EID
Total 20,875 383 422 21,680
Source: Calculation Rütter+Partner
Table 3-4: Total RE-related employment in Denmark
RE technologies Installation of new facilities (incl. export)
Operation of facilities
Fuel supply (incl. ex-
port)
Total
EP EP EP EP
Geothermal electricity 0 0 0 0
Hydro power large (> 10 MW) 0 0 0 0
Hydro power small (<= 10 MW) 0 3 0 3
Solar thermal electricity 0 0 0 0
Photovoltaics 573 1 0 574
Tidal and wave electricity 0 0 0 0
Wind 43,837 966 0 44,803
Biogas (incl. CHP) 7 52 165 223
Biomass small scale (incl. CHP) 1,236 250 538 2,023
Biomass large scale (incl. CHP) 650 164 302 1,116
Biomass co-firing (incl. CHP) 15 38 42 95
Biowaste (incl. CHP) 34 41 0 75
Total 46,352 1,515 1,047 48,913
Source: Calculation Rütter+Partner
IEA-RETD EMPLOY EID 17
Figure 3-1: Direct employment in the RE-E industry by technology
0 5'000 10'000 15'000 20'000 25'000
Geothermal electricity
Hydropower large
Hydropower small
Solar thermal electricity
Photovoltaics
Tidal and wave electricity
Wind
Biogas (incl. CHP)
Biomass small scale (incl. CHP)
Biomass large scale (incl. CHP)
Biomass co-firing (incl. CHP)
Biowaste (incl. CHP)
Installation of new facilities Operation of facilities Fuels
Employed persons
Source: Calculation Rütter+Partner

18 IEA-RETD EMPLOY EID
Figure 3-2: Total employment in the RE-E industry and upstream indus-
tries by life cycle phase
25'477
1'131 625
20'875
383 422
0
5'000
10'000
15'000
20'000
25'000
30'000
35'000
40'000
45'000
50'000
Installation of new facilities Operation of facilities Biomass fuel supply
Employed persons
Direct employment Indirect employment
Source: Calculation Rütter+Partner
3.4 Conclusions
The application of the guidelines was feasible for Denmark. Data availability is good
and data quality is rather high in the dominating wind industry. Therefore the data from
the Danish Wind Industry Association could be incorporated into the calculations.
IEA-RETD EMPLOY EID 19
4 France
This chapter contains a brief overview of methodological remarks, input data and re-
sults of the calculations for France. Detailed input data and results can be found in the
annex Excel file “Annex_Data_France.xls”.
4.1 Methodological remarks
In France the expenditures for RE facilities, output and employment in the RE industry
are regularly monitored (e.g. ADEME 2010). The method for calculating expenditures
and output are close to the approach proposed in the guidelines. Direct employment is
also calculated with a similar approach and with detailed data. The quality of results
can be considered as high. We therefore generally adopted the data from the ADEME
study for expenditures, output and direct employment (cf. guidelines, chapter 4.3.3,
calculation steps 2, 3 and 4).
The ADEME study does not allow to distinguish between biomass use for electricity
and heat generation (with the exception of biogas and biowaste). Therefore we fol-
lowed the approach described in the guidelines for small and large scale biomass
plants and for biomass co-firing.
The ADEME study specifies for each technology total value of produced energy but
not the O&M and fuel expenditures needed for employment calculations. We there-
fore calculated these expenditures according to the guidelines.
In the case of biogas electricity accounts for approximately half of the energy output.
Therefore half of the expenditure, output and employment values were allocated to
electricity use in biogas plants.
Indirect employment was calculated according to the guidelines, since these are not
included in the ADEME study.
4.2 Input data
The input data used for the calculations are documented in detail in the Excel file. The
following data sources were used to generate the input data:
20 IEA-RETD EMPLOY EID
Table 4-1: Input data for France
Data type Source
Capacities, generation and fuel input of RE facilities 2009:
Installed capacity
Net capacity increase
Electricity generation
Biomass fuel input
Green-X database, based on data from Eurostat com-bined with own assessments/modelling (based on RE-Shaping scenarios (see Resch et al. (2012)) for biomass in order to estimate detailed breakdowns by technolo-gy/feedstock
Exception: technologies where we used data from
ADEME (2010) as mentioned above
Specific costs 2009
Specific installation costs
Specific O&M costs
Specific fuel costs
Green-X database (see also Resch et al. (2012))
Exception: technologies where we used data from
ADEME (2010) as mentioned above
Expenditures, imports, exports, output of the RE industry by technology
ADEME (2010)
Cost structures
Shares of cost components
Allocation to industries ac-cording to the IO model
Own assumptions based on various techno-economic studies
Input-output table of France 2007
Download from Eurostat website (Eurostat 2011)
Industry specific employment data
KLEMS database; Download from www.euklems.net
4.3 Results
The following tables and figures contain an overview of the results for RE-E related
employment in France. The results are distinguished by technology and life cycle
phase and by direct, indirect and total employment related to renewable energy use.
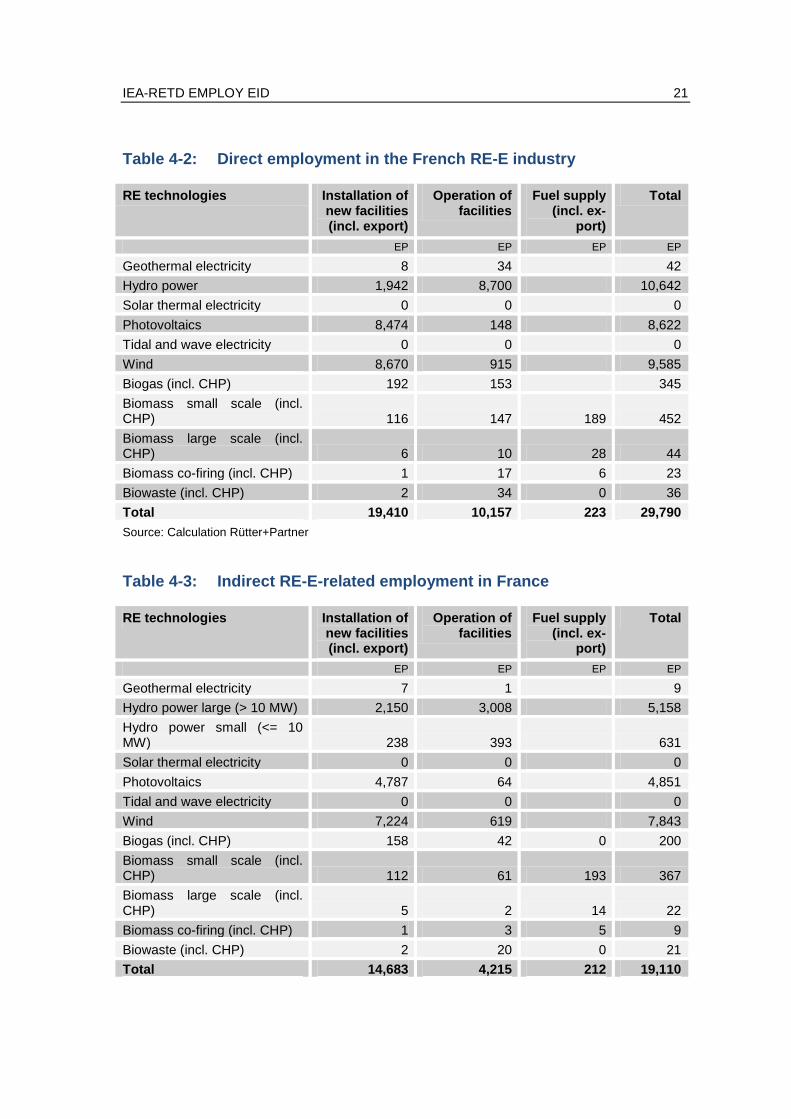
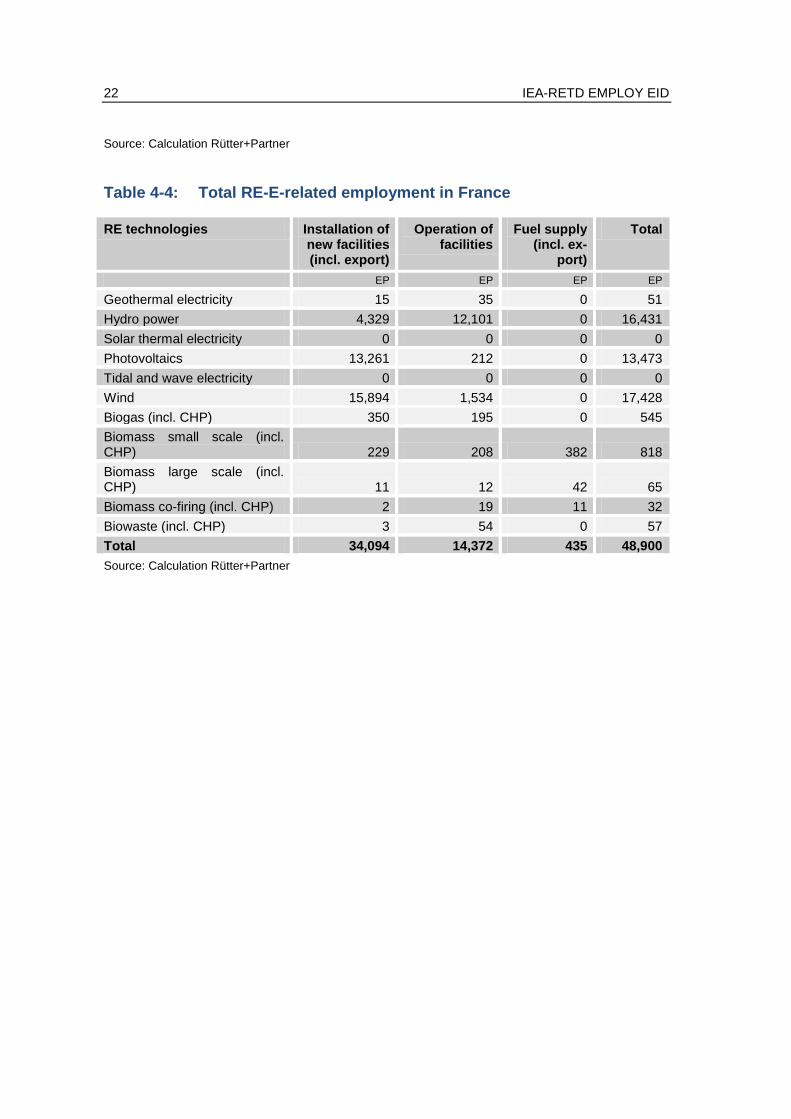
In 2009 the French RE-E industry employed approximately 30,000 persons. Hydro
power, wind energy and photovoltaics accounted for almost all of direct employment.
Approximately 19,000 EP were indirectly related to RE-E use. They worked in up-
stream industries supplying the RE-E industry. Thus, in total almost 49,000 employed
persons (EP) were related to renewable energy use. Installation of RE facilities trig-
gered about two thirds of total employed persons (34,000 EP) while operation of facili-
ties is responsible for approximately one third (14,000 EP). The employment related to
biomass fuel supply is of minor relevance.
IEA-RETD EMPLOY EID 21
Table 4-2: Direct employment in the French RE-E industry
RE technologies Installation of new facilities (incl. export)
Operation of facilities
Fuel supply (incl. ex-
port)
Total
EP EP EP EP
Geothermal electricity 8 34 42
Hydro power 1,942 8,700 10,642
Solar thermal electricity 0 0 0
Photovoltaics 8,474 148 8,622
Tidal and wave electricity 0 0 0
Wind 8,670 915 9,585
Biogas (incl. CHP) 192 153 345
Biomass small scale (incl. CHP) 116 147 189 452
Biomass large scale (incl. CHP) 6 10 28 44
Biomass co-firing (incl. CHP) 1 17 6 23
Biowaste (incl. CHP) 2 34 0 36
Total 19,410 10,157 223 29,790
Source: Calculation Rütter+Partner
Table 4-3: Indirect RE-E-related employment in France
RE technologies Installation of new facilities (incl. export)
Operation of facilities
Fuel supply (incl. ex-
port)
Total
EP EP EP EP
Geothermal electricity 7 1 9
Hydro power large (> 10 MW) 2,150 3,008 5,158
Hydro power small (<= 10 MW) 238 393 631
Solar thermal electricity 0 0 0
Photovoltaics 4,787 64 4,851
Tidal and wave electricity 0 0 0
Wind 7,224 619 7,843
Biogas (incl. CHP) 158 42 0 200
Biomass small scale (incl. CHP) 112 61 193 367
Biomass large scale (incl. CHP) 5 2 14 22
Biomass co-firing (incl. CHP) 1 3 5 9
Biowaste (incl. CHP) 2 20 0 21
Total 14,683 4,215 212 19,110
22 IEA-RETD EMPLOY EID
Source: Calculation Rütter+Partner
Table 4-4: Total RE-E-related employment in France
RE technologies Installation of new facilities (incl. export)
Operation of facilities
Fuel supply (incl. ex-
port)
Total
EP EP EP EP
Geothermal electricity 15 35 0 51
Hydro power 4,329 12,101 0 16,431
Solar thermal electricity 0 0 0 0
Photovoltaics 13,261 212 0 13,473
Tidal and wave electricity 0 0 0 0
Wind 15,894 1,534 0 17,428
Biogas (incl. CHP) 350 195 0 545
Biomass small scale (incl. CHP) 229 208 382 818
Biomass large scale (incl. CHP) 11 12 42 65
Biomass co-firing (incl. CHP) 2 19 11 32
Biowaste (incl. CHP) 3 54 0 57
Total 34,094 14,372 435 48,900
Source: Calculation Rütter+Partner

IEA-RETD EMPLOY EID 23
Figure 5: Direct employment in the RE-E industry by technology
0 2'000 4'000 6'000 8'000 10'000 12'000
Geothermal electricity
Hydropower
Solar thermal electricity
Photovoltaics
Tidal and wave electricity
Wind
Biogas (incl. CHP)
Biomass small scale (incl. CHP)
Biomass large scale (incl. CHP)
Biomass co-firing (incl. CHP)
Biowaste (incl. CHP)
Installation of new facilities Operation of facilities Fuels
Employed persons
Source: Calculation Rütter+Partner

24 IEA-RETD EMPLOY EID
Figure 6: Total employment in the RE-E industry and upstream indus-
tries by life cycle phase
19'410
10'157
223
14'683
4'215
212
0
5'000
10'000
15'000
20'000
25'000
30'000
35'000
40'000
Installation of new facilities Operation of facilities Biomass fuel supply
Employed persons
Direct employment Indirect employment
Source: Calculation Rütter+Partner
4.4 Conclusions
The application of the guidelines was feasible for France. Since expenditures for re-
newable energy deployment, industry output and direct employment are regularly moni-
tored in France, the most relevant input data are available in sufficient detail and good
quality. The flexibility of the approach described in the guidelines allows to integrate the
data on direct employment into the calculations.

IEA-RETD EMPLOY EID 25
5 Germany
This chapter contains a brief overview of methodological remarks, input data and re-
sults of the calculations for Germany. Detailed input data and results can be found in
the annex Excel file “Annex_Data_Germany.xls”.
5.1 Methodological remarks
Germany is a country where RE related employment has been closely monitored for
several years. Therefore data availability is good and data quality is high. Data on in-
vestment and O&M expenditures, turnover and employment in the RE industry for 2009
can be found in Lehr et al. (2011) and Nitsch et al. (2010), but also from industry asso-
ciations. Where possible, we integrated published data into the calculation approach.
We deviated from the steps mentioned in the guidelines for calculating domestic output
by activity (cf. guidelines, chapter 4.3.3, calculation steps 2 and 3) as follows:
For hydro power, solar thermal electricity, photovoltaics, wind energy and biogas,
domestic output of RE companies was directly extracted from published data, in-
stead of calculating the data from expenditures, imports and exports, as foreseen in
the guidelines.
For photovoltaics, domestic output of wafers, cells and modules was directly esti-
mated from data on production in physical units (IEA, 2010 and IEA 2011) and cost
data, before scaling the values to total PV-related domestic output published in Lehr
et al. (2011). In other cases output was distributed to activities according to the
technology specific cost structures.
For the other technologies this approach was not feasible due to lack of necessary data
(Lehr et al. (2011) do not separate electricity generation from heat generation with re-
gard to domestic output). Here the steps mentioned in the guidelines were followed.
This is an example of how the methodological approach can be adjusted, when reliable
data are already available for a country.

26 IEA-RETD EMPLOY EID
5.2 Input data
The following input data were used for the calculations:
Table 5-1: Input data for Germany
Data type Source
Capacities, generation and fuel input of RE facilities 2009:
Installed capacity
Net capacity increase
Electricity generation
Biomass fuel input
Green-X database, based on data from Eurostat com-bined with own assessments/modelling (based on RE-Shaping scenarios (see Resch et al. (2012)) for biomass in order to estimate detailed breakdowns by technolo-gy/feedstock
Nitsch et al. (2010) for wind energy and PV
Specific costs 2009
Specific installation costs
Specific O&M costs
Specific fuel costs
Green-X database (see also Resch et al. (2012))
Nitsch et al. (2010) for wind energy and PV
Imports, exports, output of the RE industry by technology
Lehr et al. (2011), BWE/VDMA (2011), IEA (2010a), IEA (2010b), IEA (2011a), IEA (2011b)
Cost structures
Shares of cost components
Allocation to industries ac-cording to the IO model
Own assumptions based on various techno-economic studies
Input-output table of Germany 2007
Download from Eurostat website (Eurostat 2011)
Industry specific employment data
KLEMS database; Download from www.euklems.net
5.3 Results
The following tables and figures contain an overview of the results for RE related em-
ployment in Germany. The results are distinguished by technology and life cycle phase
and by direct, indirect and total employment related to renewable energy use.
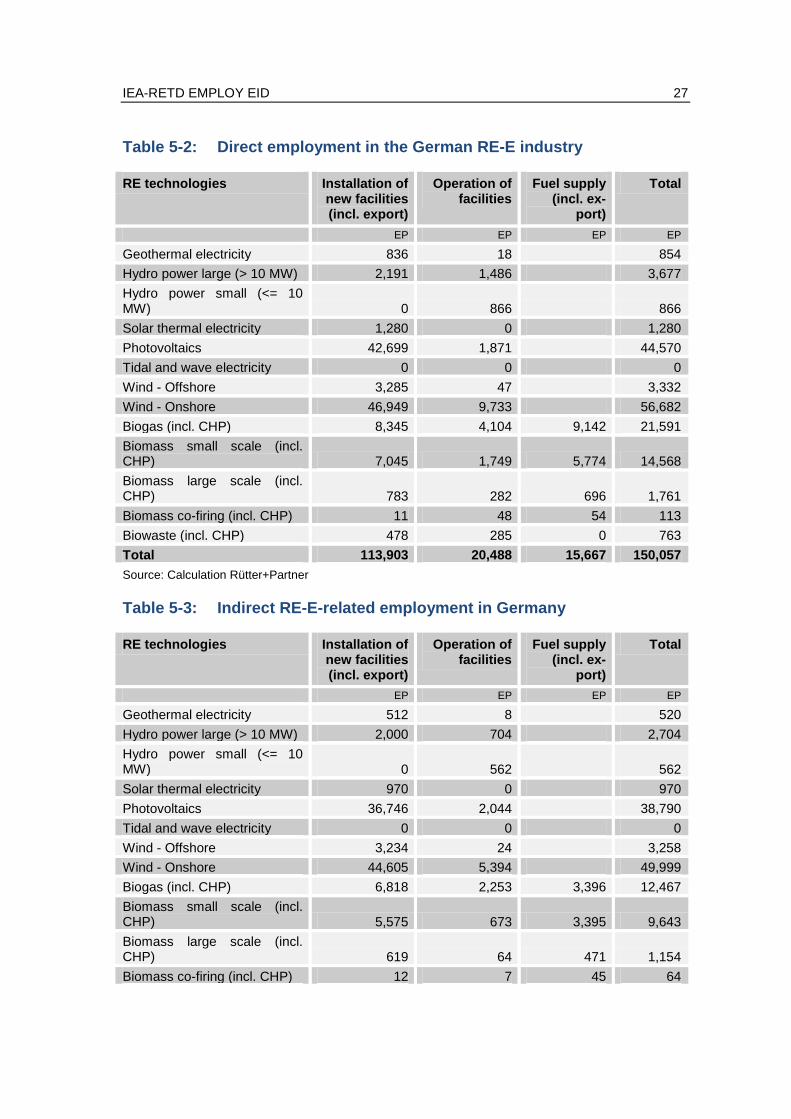
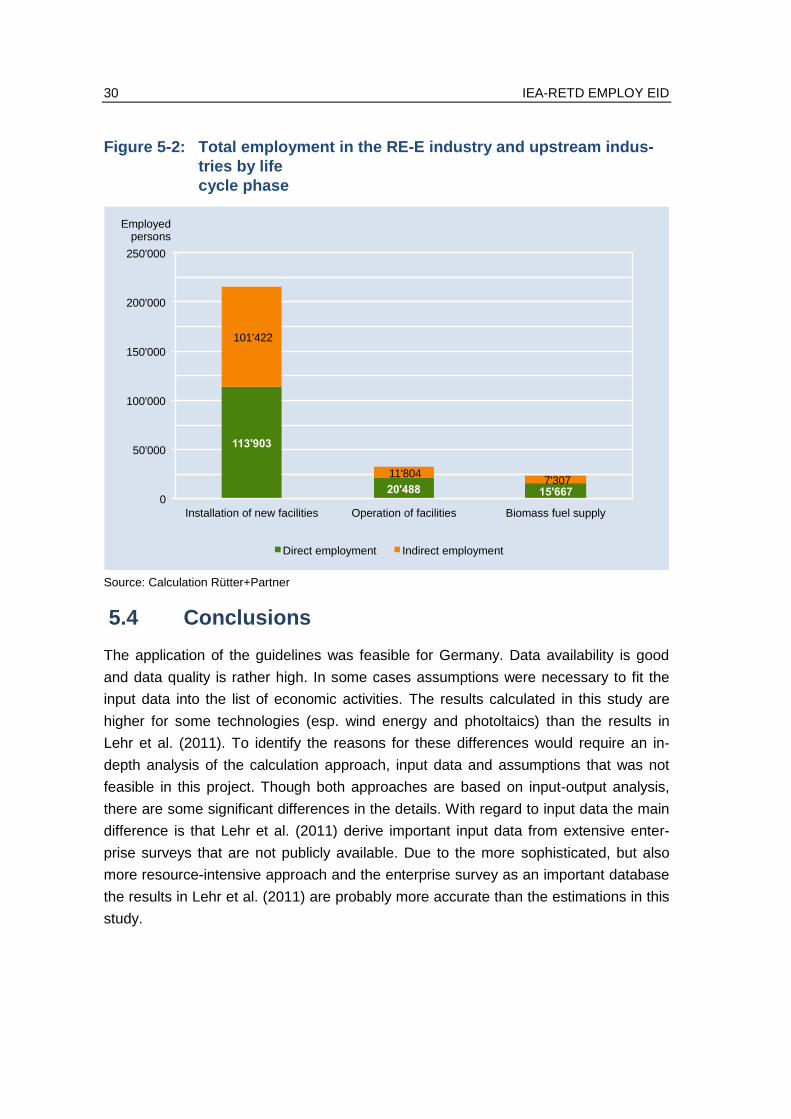
In 2009 the German RE-E industry employed approximately 150,000 persons. Wind
technology (60,000 EP) and photovoltaics (45,000 EP) account for the largest share of
employed persons in the RE-E industry. Approximately 120,000 EP are indirectly relat-
ed to RE-E use. They work in upstream industries supplying the RE-E industry. Thus,
in total more than 270,000 employed persons (EP) were related to renewable energy
use. By far the major share of total employed persons (in total 215,000 EP) is triggered
by installation of RE-E facilities in Germany and abroad. More than 32,000 EP can be
related to operation and maintenance of RE-E facilities in Germany and almost 23,000
EP to supply of biomass fuels.
IEA-RETD EMPLOY EID 27
Table 5-2: Direct employment in the German RE-E industry
RE technologies Installation of new facilities (incl. export)
Operation of facilities
Fuel supply (incl. ex-
port)
Total
EP EP EP EP
Geothermal electricity 836 18 854
Hydro power large (> 10 MW) 2,191 1,486 3,677
Hydro power small (<= 10 MW) 0 866 866
Solar thermal electricity 1,280 0 1,280
Photovoltaics 42,699 1,871 44,570
Tidal and wave electricity 0 0 0
Wind - Offshore 3,285 47 3,332
Wind - Onshore 46,949 9,733 56,682
Biogas (incl. CHP) 8,345 4,104 9,142 21,591
Biomass small scale (incl. CHP) 7,045 1,749 5,774 14,568
Biomass large scale (incl. CHP) 783 282 696 1,761
Biomass co-firing (incl. CHP) 11 48 54 113
Biowaste (incl. CHP) 478 285 0 763
Total 113,903 20,488 15,667 150,057
Source: Calculation Rütter+Partner
Table 5-3: Indirect RE-E-related employment in Germany
RE technologies Installation of new facilities (incl. export)
Operation of facilities
Fuel supply (incl. ex-
port)
Total
EP EP EP EP
Geothermal electricity 512 8 520
Hydro power large (> 10 MW) 2,000 704 2,704
Hydro power small (<= 10 MW) 0 562 562
Solar thermal electricity 970 0 970
Photovoltaics 36,746 2,044 38,790
Tidal and wave electricity 0 0 0
Wind - Offshore 3,234 24 3,258
Wind - Onshore 44,605 5,394 49,999
Biogas (incl. CHP) 6,818 2,253 3,396 12,467
Biomass small scale (incl. CHP) 5,575 673 3,395 9,643
Biomass large scale (incl. CHP) 619 64 471 1,154
Biomass co-firing (incl. CHP) 12 7 45 64

28 IEA-RETD EMPLOY EID
Biowaste (incl. CHP) 332 70 0 402
Total 101,422 11,804 7,307 120,533
Source: Calculation Rütter+Partner
Table 5-4: Total RE-E-related employment in Germany
RE technologies Installation of new facilities (incl. export)
Operation of facilities
Fuel supply (incl. ex-
port)
Total
EP EP EP EP
Geothermal electricity 1,348 26 0 1,373
Hydro power large (> 10 MW) 4,191 2,190 0 6,381
Hydro power small (<= 10 MW) 0 1,428 0 1,428
Solar thermal electricity 2,250 0 0 2,250
Photovoltaics 79,446 3,915 0 83,361
Wind - Offshore 6,519 71 0 6,590
Wind - Onshore 91,554 15,127 0 106,681
Biogas (incl. CHP) 15,163 6,357 12,538 34,059
Biomass small scale (incl. CHP) 12,620 2,422 9,169 24,211
Biomass large scale (incl. CHP) 1,402 346 1,167 2,915
Biomass co-firing (incl. CHP) 23 55 100 178
Biowaste (incl. CHP) 810 355 0 1,165
Total 215,325 32,291 22,974 270,591
Source: Calculation Rütter+Partner

IEA-RETD EMPLOY EID 29
Figure 5-1: Direct employment in the RE-E industry by technology
0 10'000 20'000 30'000 40'000 50'000 60'000
Geothermal electricity
Hydropower large
Hydropower small
Solar thermal electricity
Photovoltaics
Tidal and wave electricity
Wind - Offshore
Wind - Onshore
Biogas (incl. CHP)
Biomass small scale (incl.
Biomass large scale (incl. CHP)
Biomass co-firing (incl. CHP)
Biowaste (incl. CHP)
Installation of new facilities Operation of facilities Fuels Employed persons
Source: Calculation Rütter+Partner
30 IEA-RETD EMPLOY EID
Figure 5-2: Total employment in the RE-E industry and upstream indus-
tries by life
cycle phase
113'903
20'488 15'667
101'422
11'804 7'307
0
50'000
100'000
150'000
200'000
250'000
Installation of new facilities Operation of facilities Biomass fuel supply
Employed persons
Direct employment Indirect employment
Source: Calculation Rütter+Partner
5.4 Conclusions
The application of the guidelines was feasible for Germany. Data availability is good
and data quality is rather high. In some cases assumptions were necessary to fit the
input data into the list of economic activities. The results calculated in this study are
higher for some technologies (esp. wind energy and photoltaics) than the results in
Lehr et al. (2011). To identify the reasons for these differences would require an in-
depth analysis of the calculation approach, input data and assumptions that was not
feasible in this project. Though both approaches are based on input-output analysis,
there are some significant differences in the details. With regard to input data the main
difference is that Lehr et al. (2011) derive important input data from extensive enter-
prise surveys that are not publicly available. Due to the more sophisticated, but also
more resource-intensive approach and the enterprise survey as an important database
the results in Lehr et al. (2011) are probably more accurate than the estimations in this
study.
IEA-RETD EMPLOY EID 31
6 Ireland
This chapter contains a brief overview of methodological remarks, input data and re-
sults of the calculations for Ireland. Detailed input data and results can be found in the
annex Excel file “Annex_Data_Ireland.xls”.
6.1 Methodological remarks
The employment calculations for Ireland followed the methodological approach outlined
in the guidelines with the following exceptions:
Investment in wind power plants was directly adopted from the IEA wind annual re-
port 2009 (IEA 2010b) and then distributed to cost components, as foreseen in the
guidelines (cf. guidelines, chapter 4.3.3, calculation step 2.1 - 2.3).
6.2 Input data
The input data used for the calculations are documented in detail in the Excel file. The
following data sources were used to generate the input data:
Table 6-1: Input data for Ireland
Data type Source
Capacities, generation and fuel input of RE facilities 2009:
Installed capacity
Net capacity increase
Electricity generation
Biomass fuel input
Green-X database, based on data from Eurostat com-bined with own assessments/modelling (based on RE-Shaping scenarios, see Resch et al. (2012) for biomass in order to estimate detailed breakdowns by technolo-gy/feedstock
Specific costs 2009
Specific installation costs
Specific O&M costs
Specific fuel costs
Green-X database (see also Resch et al. (2012))
Imports, exports, output of the RE industry by technology
IEA (2010a), IEA (2010b), IEA (2011a), IEA (2011b), UN Comtrade database
Cost structures
Shares of cost components
Allocation to industries ac-cording to the IO model
Own assumptions based on various techno-economic studies
Input-output table of Ireland 2005
Download from Eurostat website (Eurostat 2011)
Industry specific employment data 2005
KLEMS database; Download from www.euklems.net

32 IEA-RETD EMPLOY EID
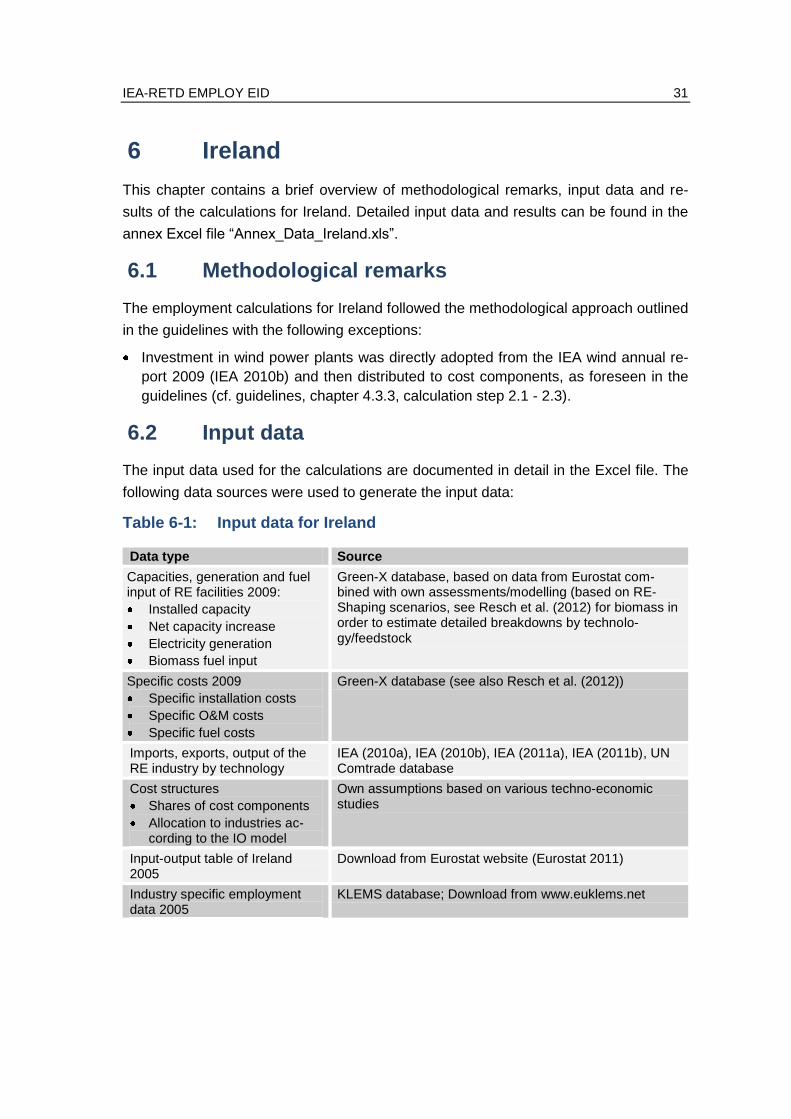
6.3 Results
The following tables and figures contain an overview of the results for RE-E related
employment in Ireland. The results are distinguished by technology and life cycle
phase and by direct, indirect and total employment related to renewable energy use.
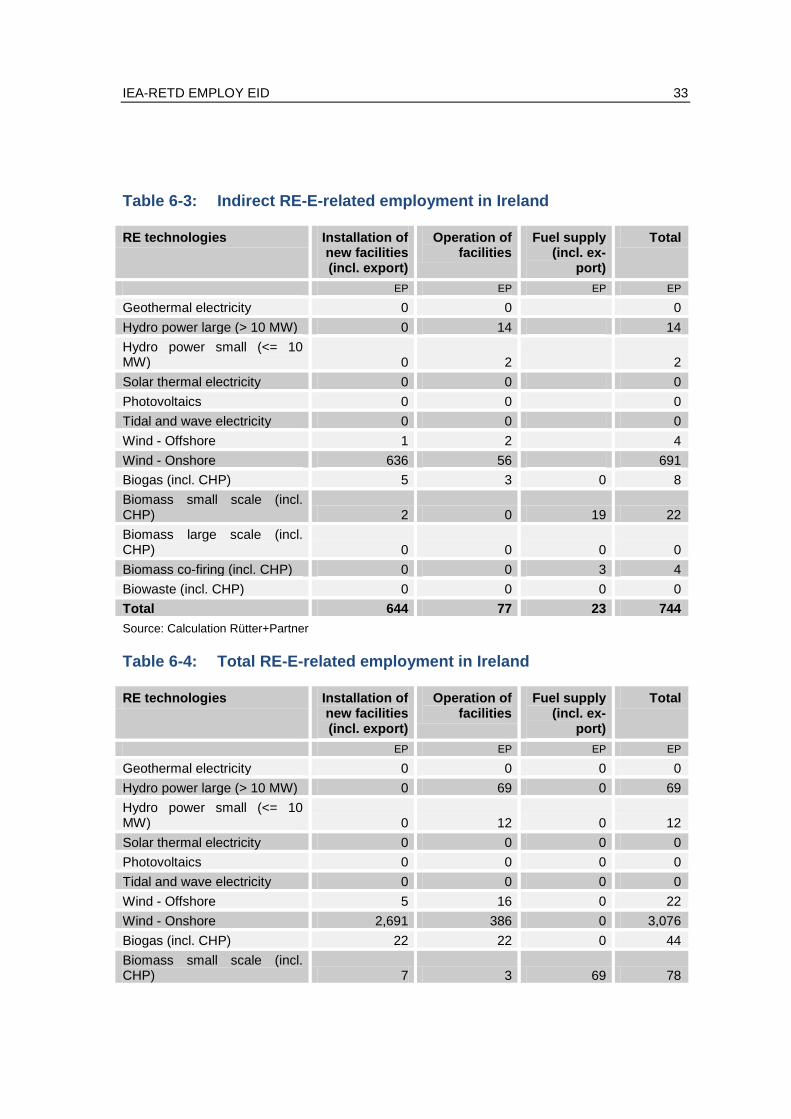
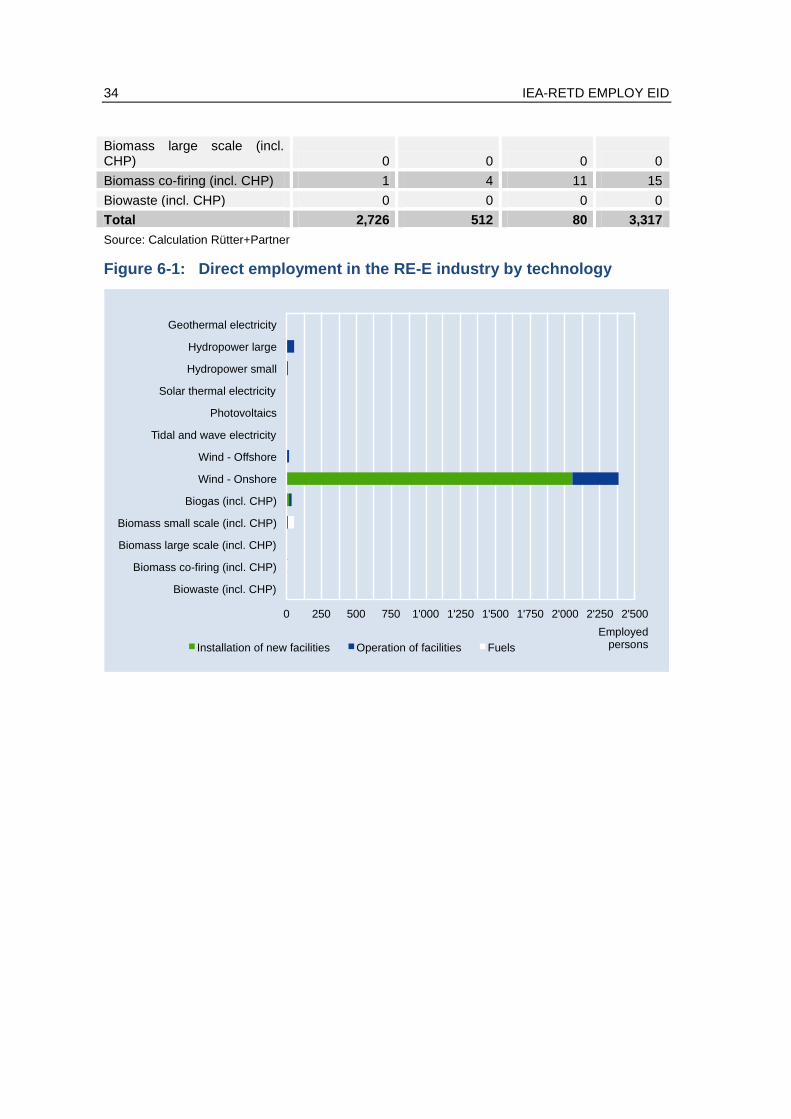
In 2009 the Irish RE-E industry employed approximately 2,600 persons. Wind technol-
ogy (2,400 EP) accounts for the largest share of employed persons (EP) in the RE-E
industry. Almost 750 EP were indirectly related to RE-E use. They worked in upstream
industries supplying the RE-E industry. Thus, in total approximately 3,300 employed
persons were related to renewable energy use. Installation of new RE-E facilities ac-
count for a major share of total employed persons (2,700 EP). 500 EP are induced by
operation and management of RE-E facilities and 80 EP by supply of biomass fuels.
Table 6-2: Direct employment in the Irish RE-E industry
RE technologies Installation of new facilities (incl. export)
Operation of facilities
Fuel supply (incl. ex-
port)
Total
EP EP EP EP
Geothermal electricity 0 0 0
Hydro power large (> 10 MW) 0 56 56
Hydro power small (<= 10 MW) 0 11 11
Solar thermal electricity 0 0 0
Photovoltaics 0 0 0
Tidal and wave electricity 0 0 0
Wind - Offshore 4 14 18
Wind - Onshore 2,055 330 2,385
Biogas (incl. CHP) 16 19 0 36
Biomass small scale (incl. CHP) 5 2 49 57
Biomass large scale (incl. CHP) 0 0 0 0
Biomass co-firing (incl. CHP) 1 3 8 12
Biowaste (incl. CHP) 0 0 0 0
Total 2,082 435 57 2,573
Source: Calculation Rütter+Partner
IEA-RETD EMPLOY EID 33
Table 6-3: Indirect RE-E-related employment in Ireland
RE technologies Installation of new facilities (incl. export)
Operation of facilities
Fuel supply (incl. ex-
port)
Total
EP EP EP EP
Geothermal electricity 0 0 0
Hydro power large (> 10 MW) 0 14 14
Hydro power small (<= 10 MW) 0 2 2
Solar thermal electricity 0 0 0
Photovoltaics 0 0 0
Tidal and wave electricity 0 0 0
Wind - Offshore 1 2 4
Wind - Onshore 636 56 691
Biogas (incl. CHP) 5 3 0 8
Biomass small scale (incl. CHP) 2 0 19 22
Biomass large scale (incl. CHP) 0 0 0 0
Biomass co-firing (incl. CHP) 0 0 3 4
Biowaste (incl. CHP) 0 0 0 0
Total 644 77 23 744
Source: Calculation Rütter+Partner
Table 6-4: Total RE-E-related employment in Ireland
RE technologies Installation of new facilities (incl. export)
Operation of facilities
Fuel supply (incl. ex-
port)
Total
EP EP EP EP
Geothermal electricity 0 0 0 0
Hydro power large (> 10 MW) 0 69 0 69
Hydro power small (<= 10 MW) 0 12 0 12
Solar thermal electricity 0 0 0 0
Photovoltaics 0 0 0 0
Tidal and wave electricity 0 0 0 0
Wind - Offshore 5 16 0 22
Wind - Onshore 2,691 386 0 3,076
Biogas (incl. CHP) 22 22 0 44
Biomass small scale (incl. CHP) 7 3 69 78
34 IEA-RETD EMPLOY EID
Biomass large scale (incl. CHP) 0 0 0 0
Biomass co-firing (incl. CHP) 1 4 11 15
Biowaste (incl. CHP) 0 0 0 0
Total 2,726 512 80 3,317
Source: Calculation Rütter+Partner
Figure 6-1: Direct employment in the RE-E industry by technology
0 250 500 750 1'000 1'250 1'500 1'750 2'000 2'250 2'500
Geothermal electricity
Hydropower large
Hydropower small
Solar thermal electricity
Photovoltaics
Tidal and wave electricity
Wind - Offshore
Wind - Onshore
Biogas (incl. CHP)
Biomass small scale (incl. CHP)
Biomass large scale (incl. CHP)
Biomass co-firing (incl. CHP)
Biowaste (incl. CHP)
Installation of new facilities Operation of facilities Fuels
Employed persons
IEA-RETD EMPLOY EID 35
Figure 6-2: Total employment in the RE-E industry and upstream indus-
tries by life cycle phase
2'082
435 57
644
77
23
0
500
1'000
1'500
2'000
2'500
3'000
Installation of new facilities Operation of facilities Biomass fuel supply
Employed persons
Direct employment Indirect employment
6.4 Conclusions
The application of the guidelines was feasible for Ireland. A comparison with the Eur-
Observ’ER 2010 report for wind energy shows that results are similar (+10%).
36 IEA-RETD EMPLOY EID
7 Japan
This chapter contains a brief overview of methodological remarks, input data and re-
sults of the calculations for Japan. Detailed input data and results can be found in the
annex Excel file “Annex_Data_Japan.xls”.
7.1 Methodological remarks
The employment calculations for Japan followed the methodological approach outlined
in the guidelines with the following exceptions:
Domestic output of PV modules was directly estimated from data on production in
physical units (IEA 2010a and IEA 2011a) and cost data, instead of calculating the
data from expenditures, imports and exports, as foreseen in the guidelines (cf.
guidelines, chapter 4.3.3, calculation step 2.1 - 2.3).
7.2 Input data
The input data used for the calculations are documented in detail in the Excel file. The
following data sources were used to generate the input data:
Table 7-1: Input data for Japan
Data type Source
Capacities, generation and fuel input of RE facilities 2009:
Installed capacity
Net capacity increase
Electricity generation
Biomass fuel input
Green-X database, based on data from Eurostat and IEA combined with own assessments/modelling (based on RE-Shaping scenarios (see Resch et al. (2012)) for bio-mass in order to estimate detailed breakdowns by tech-nology/feedstock
Specific costs 2009
Specific installation costs
Specific O&M costs
Specific fuel costs
Green-X database (see also Resch et al. (2012))
Imports, exports, output of the RE industry by technology
IEA (2010a), IEA (2010b), IEA (2011a), IEA (2011b), UN Comtrade database, Matsumoto/Hondo (2010) for validation.
Cost structures
Shares of cost components
Allocation to industries ac-cording to the IO model
Own assumptions based on various techno-economic studies
Input-output table of Japan 2005 JSB (2012)
Industry specific employment data
JSB (2012)

IEA-RETD EMPLOY EID 37
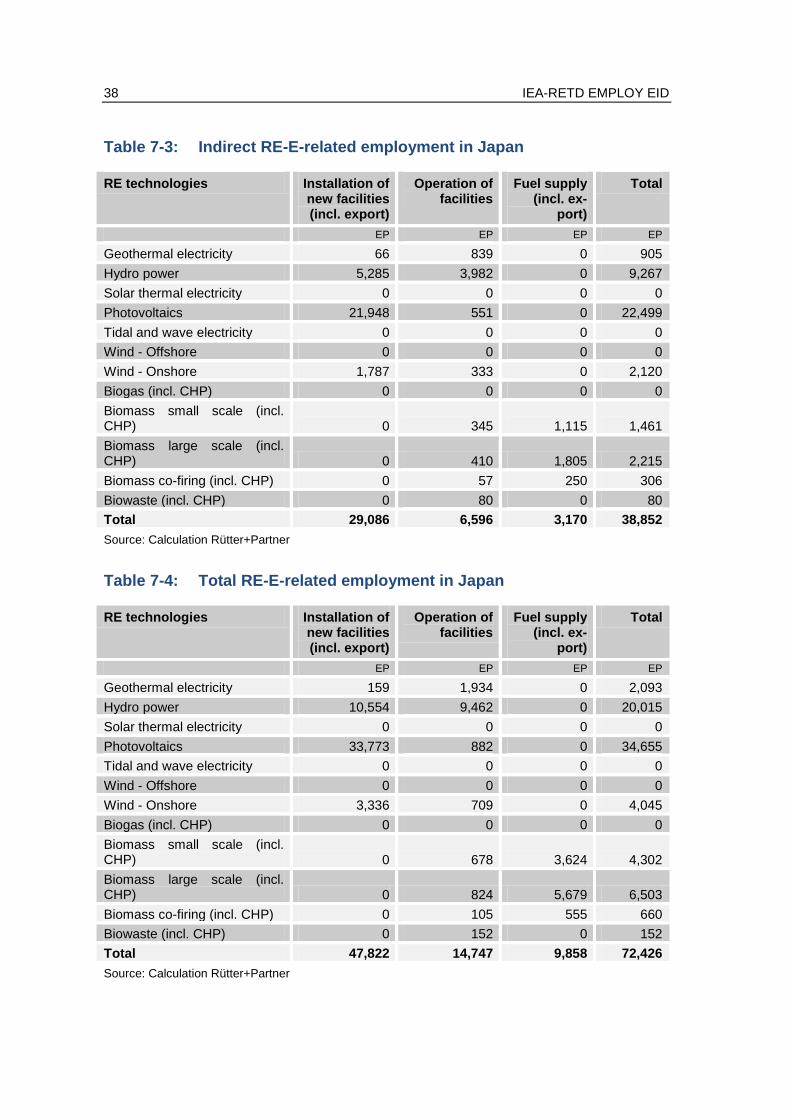
7.3 Results
The following tables and figures contain an overview of the results for RE-E related
employment in Japan. The results are distinguished by technology and life cycle phase
and by direct, indirect and total employment related to renewable energy use. Hydro
power includes small and large hydro power plants.
In 2009 the Japanese RE-E industry employed almost 34,000 persons. Photovoltaics
(12,000 EP) and large hydro power (11,000 EP) were the most important technology
areas, followed by large scale biomass (4,300 EP). Approximately 39,000 employed
persons (EP) were indirectly related to RE-E use. They worked in upstream industries
supplying the RE-E industry. Thus, in total more than 72,000 EP were related to re-
newable energy use. Installation of new RE-E facilities triggered the major share of
total employed persons (48,000 EP). Operation of facilities was responsible for almost
15,000 EP and roughly 10,000 EP can be related to supply of biomass fuels.
Table 7-2: Direct employment in the Japanese RE-E industry
RE technologies Installation of new facilities (incl. export)
Operation of facilities
Fuel supply (incl. ex-
port)
Total
EP EP EP EP
Geothermal electricity 93 1,095 0 1,188
Hydro power 5,269 5,480 0 10,748
Solar thermal electricity 0 0 0 0
Photovoltaics 11,825 331 0 12,156
Tidal and wave electricity 0 0 0 0
Wind - Offshore 0 0 0 0
Wind - Onshore 1,549 376 0 1,925
Biogas (incl. CHP) 0 0 0 0
Biomass small scale (incl. CHP) 0 333 2,509 2,842
Biomass large scale (incl. CHP) 0 414 3,874 4,288
Biomass co-firing (incl. CHP) 0 49 306 354
Biowaste (incl. CHP) 0 72 0 72
Total 18,736 8,150 6,688 33,574
Source: Calculation Rütter+Partner
38 IEA-RETD EMPLOY EID
Table 7-3: Indirect RE-E-related employment in Japan
RE technologies Installation of new facilities (incl. export)
Operation of facilities
Fuel supply (incl. ex-
port)
Total
EP EP EP EP
Geothermal electricity 66 839 0 905
Hydro power 5,285 3,982 0 9,267
Solar thermal electricity 0 0 0 0
Photovoltaics 21,948 551 0 22,499
Tidal and wave electricity 0 0 0 0
Wind - Offshore 0 0 0 0
Wind - Onshore 1,787 333 0 2,120
Biogas (incl. CHP) 0 0 0 0
Biomass small scale (incl. CHP) 0 345 1,115 1,461
Biomass large scale (incl. CHP) 0 410 1,805 2,215
Biomass co-firing (incl. CHP) 0 57 250 306
Biowaste (incl. CHP) 0 80 0 80
Total 29,086 6,596 3,170 38,852
Source: Calculation Rütter+Partner
Table 7-4: Total RE-E-related employment in Japan
RE technologies Installation of new facilities (incl. export)
Operation of facilities
Fuel supply (incl. ex-
port)
Total
EP EP EP EP
Geothermal electricity 159 1,934 0 2,093
Hydro power 10,554 9,462 0 20,015
Solar thermal electricity 0 0 0 0
Photovoltaics 33,773 882 0 34,655
Tidal and wave electricity 0 0 0 0
Wind - Offshore 0 0 0 0
Wind - Onshore 3,336 709 0 4,045
Biogas (incl. CHP) 0 0 0 0
Biomass small scale (incl. CHP) 0 678 3,624 4,302
Biomass large scale (incl. CHP) 0 824 5,679 6,503
Biomass co-firing (incl. CHP) 0 105 555 660
Biowaste (incl. CHP) 0 152 0 152
Total 47,822 14,747 9,858 72,426
Source: Calculation Rütter+Partner

IEA-RETD EMPLOY EID 39
Figure 7-1: Direct employment in the RE-E industry by technology
0 2'000 4'000 6'000 8'000 10'000 12'000 14'000
Geothermal electricity
Hydropower large
Hydropower small
Solar thermal electricity
Photovoltaics
Tidal and wave electricity
Wind - Offshore
Wind - Onshore
Biogas (incl. CHP)
Biomass small scale (incl. CHP)
Biomass large scale (incl. CHP)
Biomass co-firing (incl. CHP)
Biowaste (incl. CHP)
Installation of new facilities Operation of facilities Fuels
Employed persons
Figure 7-2: Total employment in the RE-E industry and upstream indus-
tries by life cycle phase
18'736
8'150 6'688
29'086
6'596
3'170
0
5'000
10'000
15'000
20'000
25'000
30'000
35'000
40'000
45'000
50'000
Installation of new facilities Operation of facilities Biomass fuel supply
Employed persons
Direct employment Indirect employment

40 IEA-RETD EMPLOY EID
7.4 Conclusions
The application of the guidelines was feasible for Japan. The accuracy of results could
be improved by collecting specific data on cost structures of Japanese facilities or by
enhancing data on imports and exports, that may require conducting an enterprise sur-
vey or analysing business registers.

IEA-RETD EMPLOY EID 41
8 Netherlands
This chapter contains a brief overview of methodological remarks, input data and re-
sults of the calculations for the Netherlands. Detailed input data and results can be
found in the annex Excel file “Annex_Data_Netherlands.xls”.
8.1 Methodological remarks
The employment calculations for the Netherlands followed the methodological ap-
proach outlined in the guidelines with the following exceptions:
Turnover and employment of the Durch RE industry is regularly monitored by ECN
(Lako/Beurskens 2011). This is done by identifying enterprises active in the RE field
and by estimating turnover and employment related to renewable energy. The scope
of the RE industry may in some areas be wider than in other studies since e.g. also
manufacturers of equipment for PV cell or module producers are included. On the
other hand it seems to focus on technology oriented companies, so that e.g. installa-
tion companies or wood suppliers may not be comprehensively covered. We adopt-
ed output and direct employment in the PV and wind subsector from this study, in-
stead of calculating the data from expenditures, imports and exports, as proposed in
the guidelines (cf. guidelines, chapter 4.3.3, calculation steps 2 and 3). For the bio-
mass subsectors this is not feasible, since it is not possible to distinguish the share
of electricity generation in turnover and employment. Here we followed the guide-
lines. Indirect employment was also calculated according to the guidelines.
8.2 Input data
The input data used for the calculations are documented in detail in the Excel file. The
following data sources were used to generate the input data:
Table 8-1: Input data for the Netherlands
Data type Source
Capacities, generation and fuel input of RE facilities 2009:
Installed capacity
Net capacity increase
Electricity generation
Biomass fuel input
Green-X database, based on data from Eurostat com-bined with own assessments/modelling (based on RE-Shaping scenarios (see Resch et al. (2012)) for biomass in order to estimate detailed breakdowns by technolo-gy/feedstock
Specific costs 2009
Specific installation costs
Specific O&M costs
Specific fuel costs
Green-X database (see also Resch et al. (2012))

42 IEA-RETD EMPLOY EID
Data type Source
Output of the RE industry by technology
Lako/Beurskens (2011), UN Comtrade database, Cocchi et al. (2011), Junginger et al. (2011)
Cost structures
Shares of cost components
Allocation to industries ac-cording to the IO model
Own assumptions based on various techno-economic studies
Input-output table of Nether-lands 2007
Download from Eurostat website (Eurostat 2011)
Industry specific employment data
KLEMS database; Download from www.euklems.net
8.3 Results
The following tables and figures contain an overview of the results for RE-E related
employment in the Netherlands. The results are distinguished by technology and life
cycle phase and by direct, indirect and total employment related to renewable energy
use.
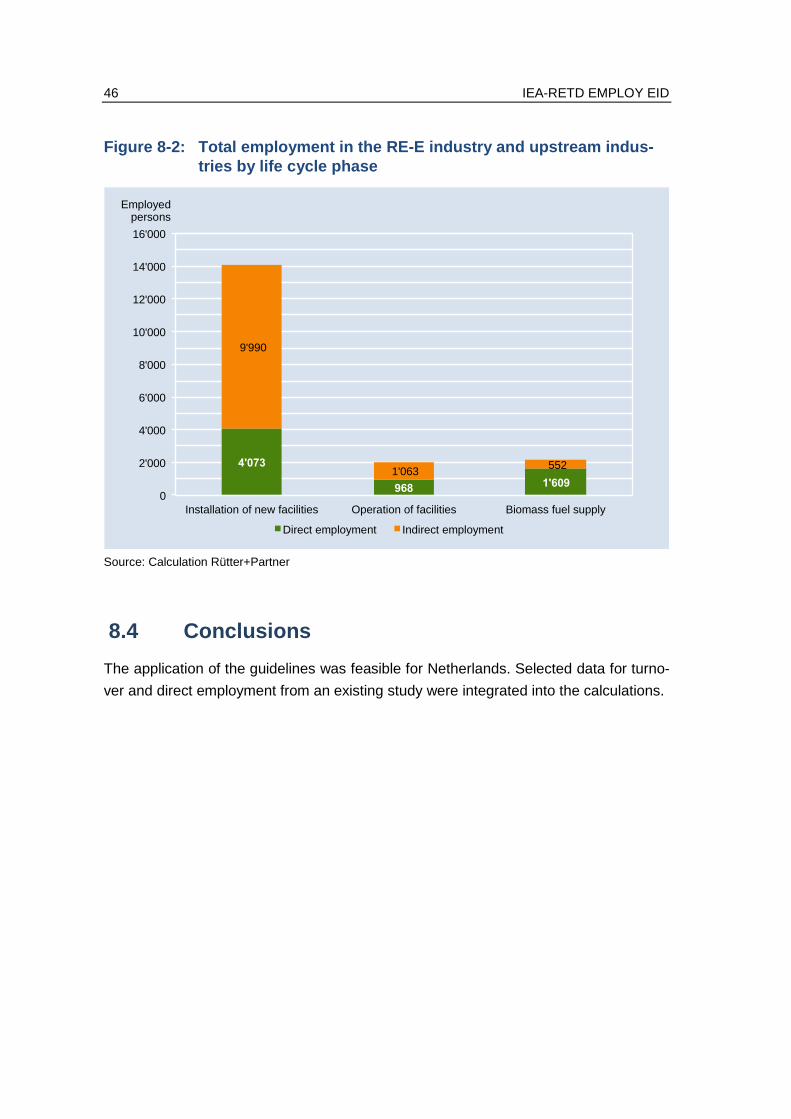
In 2009 the Dutch RE-E industry employed over 6,500 persons. The most important
subsectors are small scale biomass (2,300 EP), wind energy (2,200 EP) and photovol-
taics (1,200 EP). Approximately 11,500 EP were indirectly related to RE-E use. They
worked in upstream industries supplying the RE-E industry. Thus, in total more than
18,000 employed persons were related to renewable energy use. Installation of new
RE-E facilities (incl. exports) triggered a major share of total employed persons (14,000
EP). The rest is almost equally shared by operation of RE-E facilities and supply of
biomass fuels.
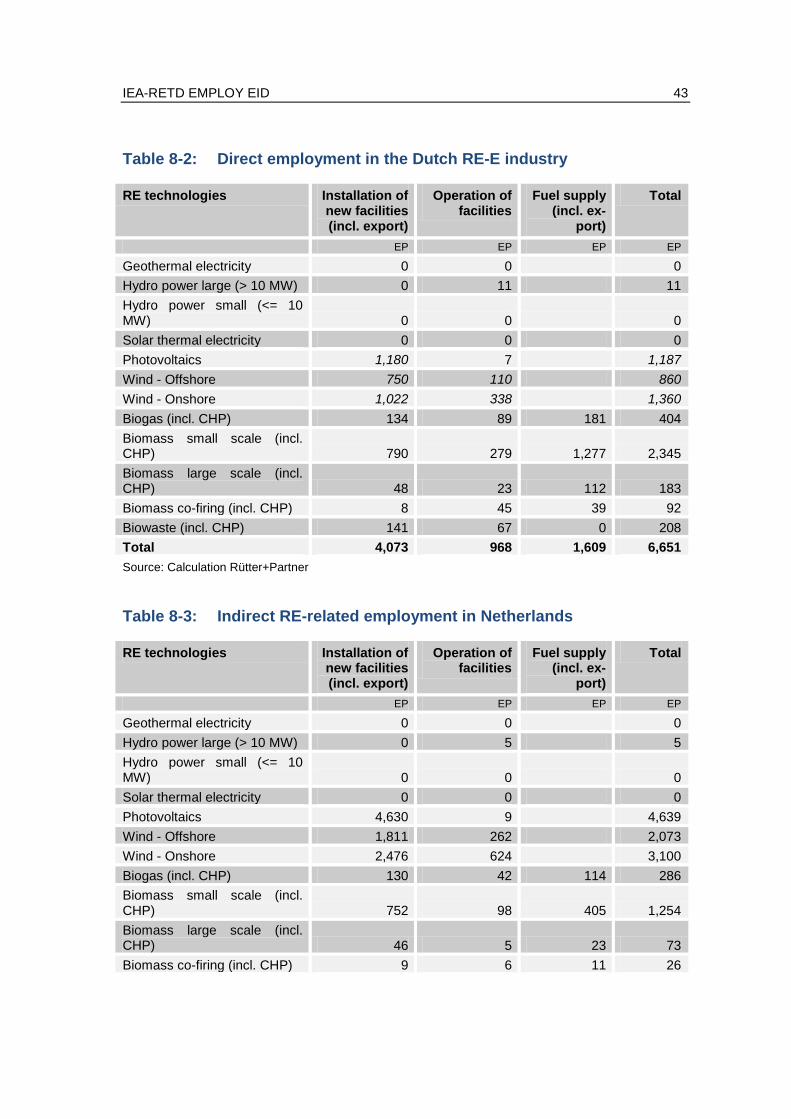
IEA-RETD EMPLOY EID 43
Table 8-2: Direct employment in the Dutch RE-E industry
RE technologies Installation of new facilities (incl. export)
Operation of facilities
Fuel supply (incl. ex-
port)
Total
EP EP EP EP
Geothermal electricity 0 0 0
Hydro power large (> 10 MW) 0 11 11
Hydro power small (<= 10 MW) 0 0 0
Solar thermal electricity 0 0 0
Photovoltaics 1,180 7 1,187
Wind - Offshore 750 110 860
Wind - Onshore 1,022 338 1,360
Biogas (incl. CHP) 134 89 181 404
Biomass small scale (incl. CHP) 790 279 1,277 2,345
Biomass large scale (incl. CHP) 48 23 112 183
Biomass co-firing (incl. CHP) 8 45 39 92
Biowaste (incl. CHP) 141 67 0 208
Total 4,073 968 1,609 6,651
Source: Calculation Rütter+Partner
Table 8-3: Indirect RE-related employment in Netherlands
RE technologies Installation of new facilities (incl. export)
Operation of facilities
Fuel supply (incl. ex-
port)
Total
EP EP EP EP
Geothermal electricity 0 0 0
Hydro power large (> 10 MW) 0 5 5
Hydro power small (<= 10 MW) 0 0 0
Solar thermal electricity 0 0 0
Photovoltaics 4,630 9 4,639
Wind - Offshore 1,811 262 2,073
Wind - Onshore 2,476 624 3,100
Biogas (incl. CHP) 130 42 114 286
Biomass small scale (incl. CHP) 752 98 405 1,254
Biomass large scale (incl. CHP) 46 5 23 73
Biomass co-firing (incl. CHP) 9 6 11 26

44 IEA-RETD EMPLOY EID
Biowaste (incl. CHP) 137 13 0 151
Total 9,990 1,063 552 11,605
Source: Calculation Rütter+Partner
Table 8-4: Total RE-related employment in Netherlands
RE technologies Installation of new facilities (incl. export)
Operation of facilities
Fuel supply (incl. ex-
port)
Total
EP EP EP EP
Geothermal electricity 0 0 0 0
Hydro power large (> 10 MW) 0 16 0 16
Hydro power small (<= 10 MW) 0 0 0 0
Solar thermal electricity 0 0 0 0
Photovoltaics 5,810 15 0 5,825
Wind - Offshore 2,561 372 0 2,933
Wind - Onshore 3,498 962 0 4,460
Biogas (incl. CHP) 264 131 295 690
Biomass small scale (incl. CHP) 1,542 376 1,681 3,600
Biomass large scale (incl. CHP) 94 28 134 256
Biomass co-firing (incl. CHP) 17 50 51 118
Biowaste (incl. CHP) 278 80 0 358
Total 14,064 2,031 2,161 18,256
Source: Calculation Rütter+Partner

IEA-RETD EMPLOY EID 45
Figure 8-1: Direct employment in the RE-E industry by technology
0 500 1'000 1'500 2'000 2'500
Geothermal electricity
Hydropower large
Hydropower small
Solar thermal electricity
Photovoltaics
Tidal and wave electricity
Wind - Offshore1
Wind - Onshore1
Biogas (incl. CHP)
Biomass small scale (incl. CHP)
Biomass large scale (incl. CHP)
Biomass co-firing (incl. CHP)
Biowaste (incl. CHP)
Installation of new facilities Operation of facilities Fuels
Employed persons
Source: Calculation Rütter+Partner
46 IEA-RETD EMPLOY EID
Figure 8-2: Total employment in the RE-E industry and upstream indus-
tries by life cycle phase
4'073
968 1'609
9'990
1'063 552
0
2'000
4'000
6'000
8'000
10'000
12'000
14'000
16'000
Installation of new facilities Operation of facilities Biomass fuel supply
Employed persons
Direct employment Indirect employment
Source: Calculation Rütter+Partner
8.4 Conclusions
The application of the guidelines was feasible for Netherlands. Selected data for turno-
ver and direct employment from an existing study were integrated into the calculations.
IEA-RETD EMPLOY EID 47
9 Norway
This chapter contains a brief overview of methodological remarks, input data and re-
sults of the calculations for Norway. Detailed input data and results can be found in the
annex Excel file “Annex_Data_Norway.xls”.
9.1 Methodological remarks
The employment calculations for Norway followed the methodological approach out-
lined in the guidelines with the following exceptions:
Domestic output of PV wafers and cells was directly estimated from data on produc-
tion in physical units (IEA 2010a and IEA 2011a) and cost data, instead of calculat-
ing the data from expenditures, imports and exports, as proposed in the guidelines
(cf. guidelines, chapter 4.3.3, calculation steps 2 and 3).
9.2 Input data
The input data used for the calculations are documented in detail in the Excel file. The
following data sources were used to generate the input data:
Table 9-1: Input data for Norway
Data type Source
Capacities, generation and fuel input of RE facilities 2009:
Installed capacity
Net capacity increase
Electricity generation
Biomass fuel input
Green-X database, based on data from Eurostat com-bined with own assessments/modelling (based on RE-Shaping scenarios (see Resch et al. (2012)) for biomass in order to estimate detailed breakdowns by technolo-gy/feedstock
Specific costs 2009
Specific installation costs
Specific O&M costs
Specific fuel costs
Green-X database (see also Resch et al. (2012))
Output of the RE industry by technology
IEA (2010a), IEA (2010b), IEA (2011a), IEA (2011b), UN Comtrade database
Cost structures
Shares of cost components
Allocation to industries ac-cording to the IO model
Own assumptions based on various techno-economic studies
Input-output table of Norway 2007
Download from Eurostat website (Eurostat 2011)
Industry specific employment data
Statistics Norway

48 IEA-RETD EMPLOY EID
9.3 Results
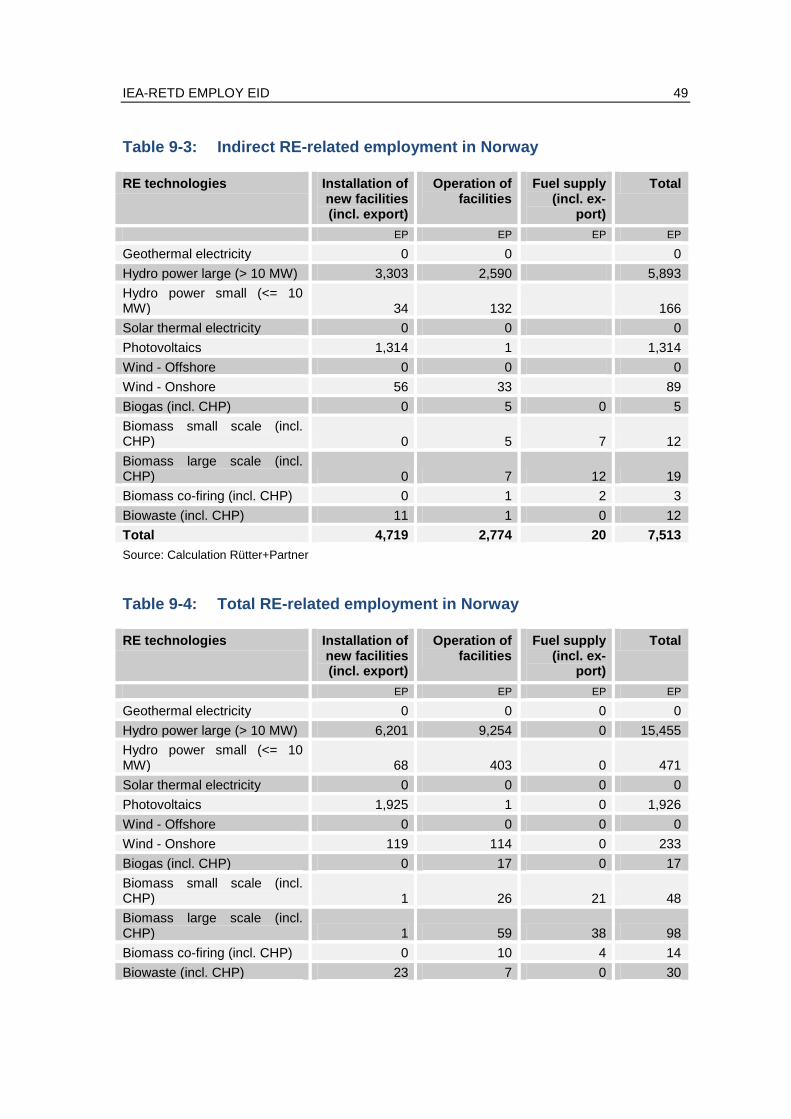
The following tables and figures contain an overview of the results for RE-E related
employment in Norway. The results are distinguished by technology and life cycle
phase and by direct, indirect and total employment related to renewable energy use.
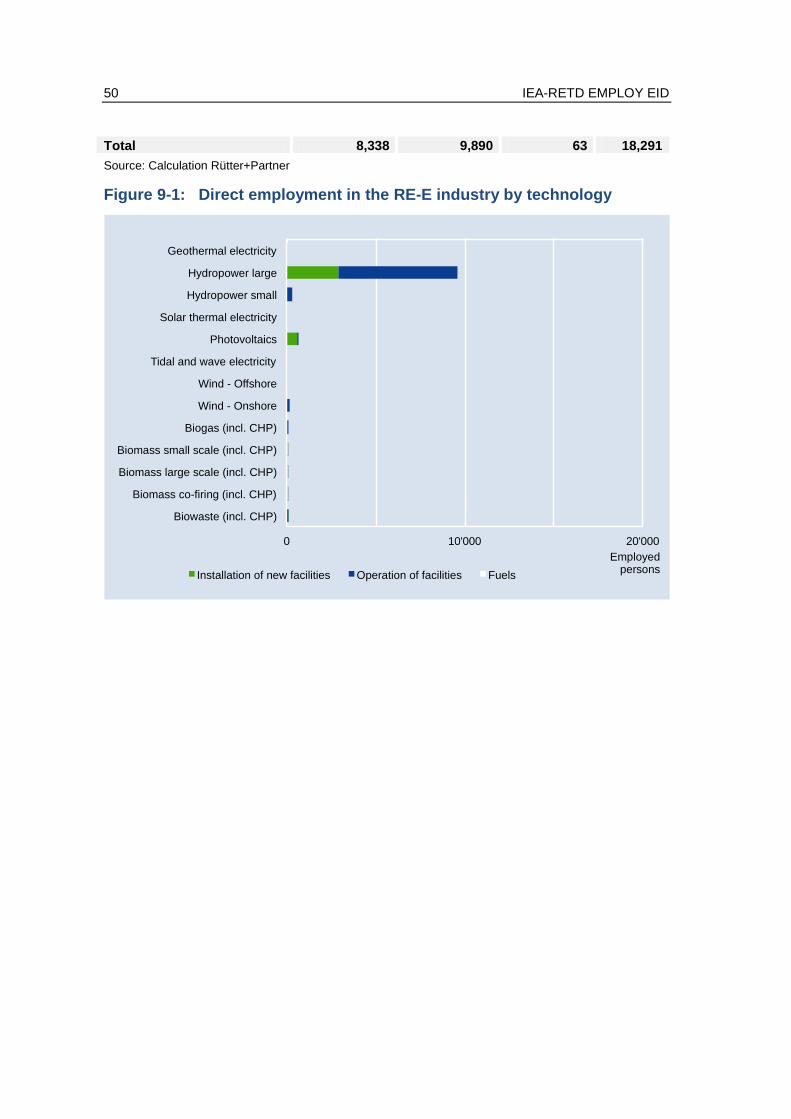
In 2009 the Norwegian RE-E industry employed almost 11,000 persons. Hydro power
(10,000 EP) accounts for the largest share of employed persons in the RE-E industry.
Approximately 7,500 EP were indirectly related to RE-E use. They worked in upstream
industries supplying the RE-E industry. Thus, in total over 18,000 employed persons
(EP) were related to renewable energy use. Operation of RE facilities, especially of
hydro power plants triggered more than half of total employed persons (10,000 EP re-
spectively) Installation of new RE-E facilities (incl. exports) was responsible for more
than 8,000 EP, while the relevance of biomass supply was neglectable.
Table 9-2: Direct employment in the Norwegian RE-E industry
RE technologies Installation of new facilities (incl. export)
Operation of facilities
Fuel supply (incl. ex-
port)
Total
EP EP EP EP
Geothermal electricity 0 0 0
Hydro power large (> 10 MW) 2,897 6,664 9,562
Hydro power small (<= 10 MW) 34 271 305
Solar thermal electricity 0 0 0
Photovoltaics 611 1 612
Wind - Offshore 0 0 0
Wind - Onshore 63 81 144
Biogas (incl. CHP) 0 12 0 12
Biomass small scale (incl. CHP) 0 20 15 35
Biomass large scale (incl. CHP) 0 52 26 78
Biomass co-firing (incl. CHP) 0 9 2 12
Biowaste (incl. CHP) 12 6 0 18
Total 3,619 7,116 43 10,778
Source: Calculation Rütter+Partner
IEA-RETD EMPLOY EID 49
Table 9-3: Indirect RE-related employment in Norway
RE technologies Installation of new facilities (incl. export)
Operation of facilities
Fuel supply (incl. ex-
port)
Total
EP EP EP EP
Geothermal electricity 0 0 0
Hydro power large (> 10 MW) 3,303 2,590 5,893
Hydro power small (<= 10 MW) 34 132 166
Solar thermal electricity 0 0 0
Photovoltaics 1,314 1 1,314
Wind - Offshore 0 0 0
Wind - Onshore 56 33 89
Biogas (incl. CHP) 0 5 0 5
Biomass small scale (incl. CHP) 0 5 7 12
Biomass large scale (incl. CHP) 0 7 12 19
Biomass co-firing (incl. CHP) 0 1 2 3
Biowaste (incl. CHP) 11 1 0 12
Total 4,719 2,774 20 7,513
Source: Calculation Rütter+Partner
Table 9-4: Total RE-related employment in Norway
RE technologies Installation of new facilities (incl. export)
Operation of facilities
Fuel supply (incl. ex-
port)
Total
EP EP EP EP
Geothermal electricity 0 0 0 0
Hydro power large (> 10 MW) 6,201 9,254 0 15,455
Hydro power small (<= 10 MW) 68 403 0 471
Solar thermal electricity 0 0 0 0
Photovoltaics 1,925 1 0 1,926
Wind - Offshore 0 0 0 0
Wind - Onshore 119 114 0 233
Biogas (incl. CHP) 0 17 0 17
Biomass small scale (incl. CHP) 1 26 21 48
Biomass large scale (incl. CHP) 1 59 38 98
Biomass co-firing (incl. CHP) 0 10 4 14
Biowaste (incl. CHP) 23 7 0 30
50 IEA-RETD EMPLOY EID
Total 8,338 9,890 63 18,291
Source: Calculation Rütter+Partner
Figure 9-1: Direct employment in the RE-E industry by technology
0 10'000 20'000
Geothermal electricity
Hydropower large
Hydropower small
Solar thermal electricity
Photovoltaics
Tidal and wave electricity
Wind - Offshore
Wind - Onshore
Biogas (incl. CHP)
Biomass small scale (incl. CHP)
Biomass large scale (incl. CHP)
Biomass co-firing (incl. CHP)
Biowaste (incl. CHP)
Installation of new facilities Operation of facilities Fuels
Employed persons
IEA-RETD EMPLOY EID 51
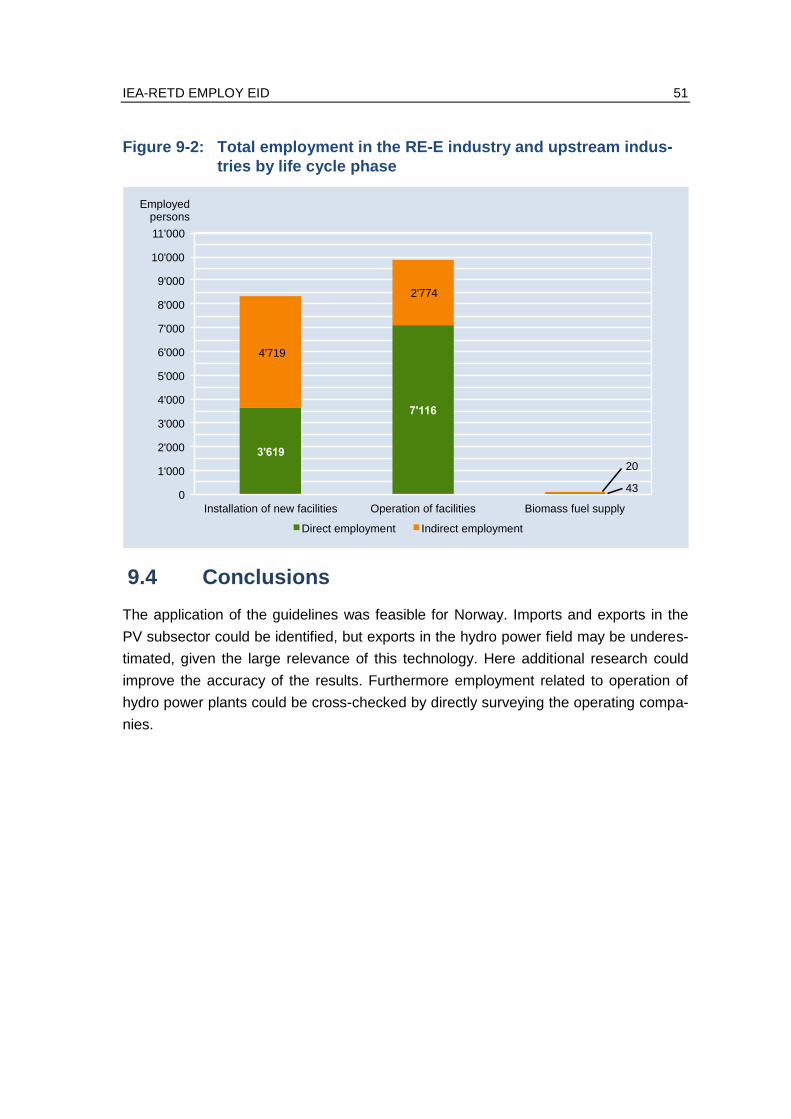
Figure 9-2: Total employment in the RE-E industry and upstream indus-
tries by life cycle phase
3'619
7'116
43
4'719
2'774
20
0
1'000
2'000
3'000
4'000
5'000
6'000
7'000
8'000
9'000
10'000
11'000
Installation of new facilities Operation of facilities Biomass fuel supply
Employed persons
Direct employment Indirect employment
9.4 Conclusions
The application of the guidelines was feasible for Norway. Imports and exports in the
PV subsector could be identified, but exports in the hydro power field may be underes-
timated, given the large relevance of this technology. Here additional research could
improve the accuracy of the results. Furthermore employment related to operation of
hydro power plants could be cross-checked by directly surveying the operating compa-
nies.
52 IEA-RETD EMPLOY EID
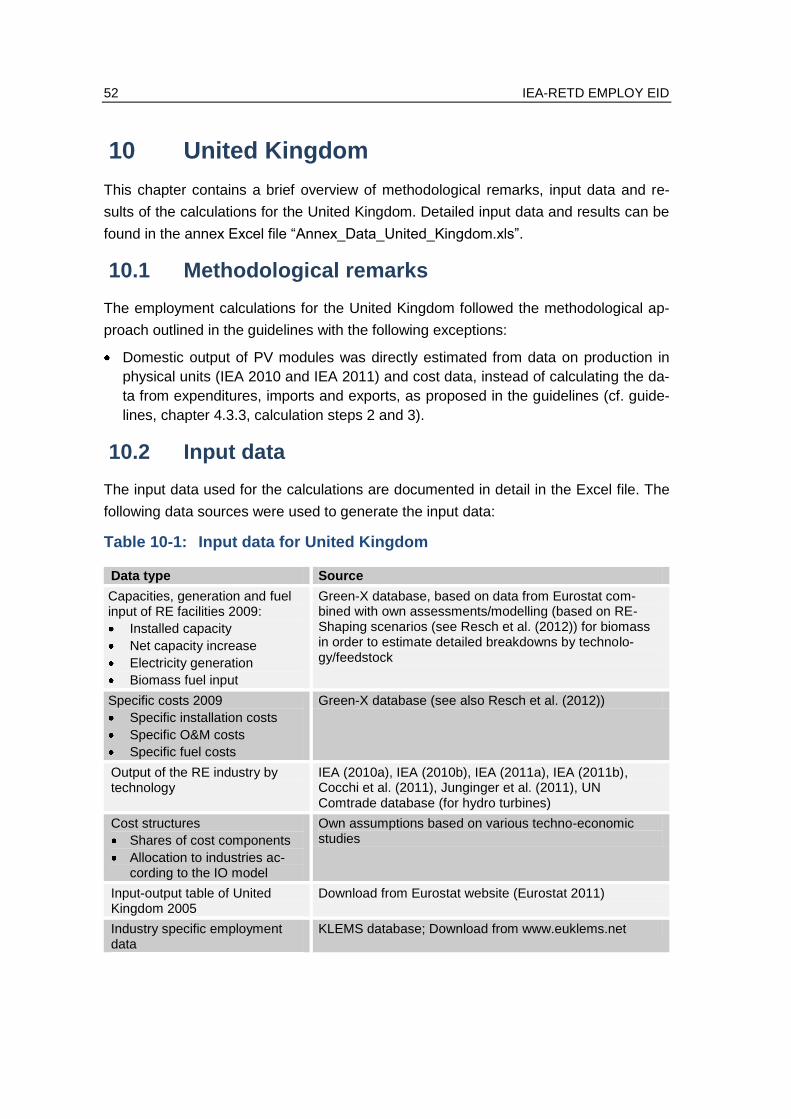
10 United Kingdom
This chapter contains a brief overview of methodological remarks, input data and re-
sults of the calculations for the United Kingdom. Detailed input data and results can be
found in the annex Excel file “Annex_Data_United_Kingdom.xls”.
10.1 Methodological remarks
The employment calculations for the United Kingdom followed the methodological ap-
proach outlined in the guidelines with the following exceptions:
Domestic output of PV modules was directly estimated from data on production in
physical units (IEA 2010 and IEA 2011) and cost data, instead of calculating the da-
ta from expenditures, imports and exports, as proposed in the guidelines (cf. guide-
lines, chapter 4.3.3, calculation steps 2 and 3).
10.2 Input data
The input data used for the calculations are documented in detail in the Excel file. The
following data sources were used to generate the input data:
Table 10-1: Input data for United Kingdom
Data type Source
Capacities, generation and fuel input of RE facilities 2009:
Installed capacity
Net capacity increase
Electricity generation
Biomass fuel input
Green-X database, based on data from Eurostat com-bined with own assessments/modelling (based on RE-Shaping scenarios (see Resch et al. (2012)) for biomass in order to estimate detailed breakdowns by technolo-gy/feedstock
Specific costs 2009
Specific installation costs
Specific O&M costs
Specific fuel costs
Green-X database (see also Resch et al. (2012))
Output of the RE industry by technology
IEA (2010a), IEA (2010b), IEA (2011a), IEA (2011b), Cocchi et al. (2011), Junginger et al. (2011), UN Comtrade database (for hydro turbines)
Cost structures
Shares of cost components
Allocation to industries ac-cording to the IO model
Own assumptions based on various techno-economic studies
Input-output table of United Kingdom 2005
Download from Eurostat website (Eurostat 2011)
Industry specific employment data
KLEMS database; Download from www.euklems.net
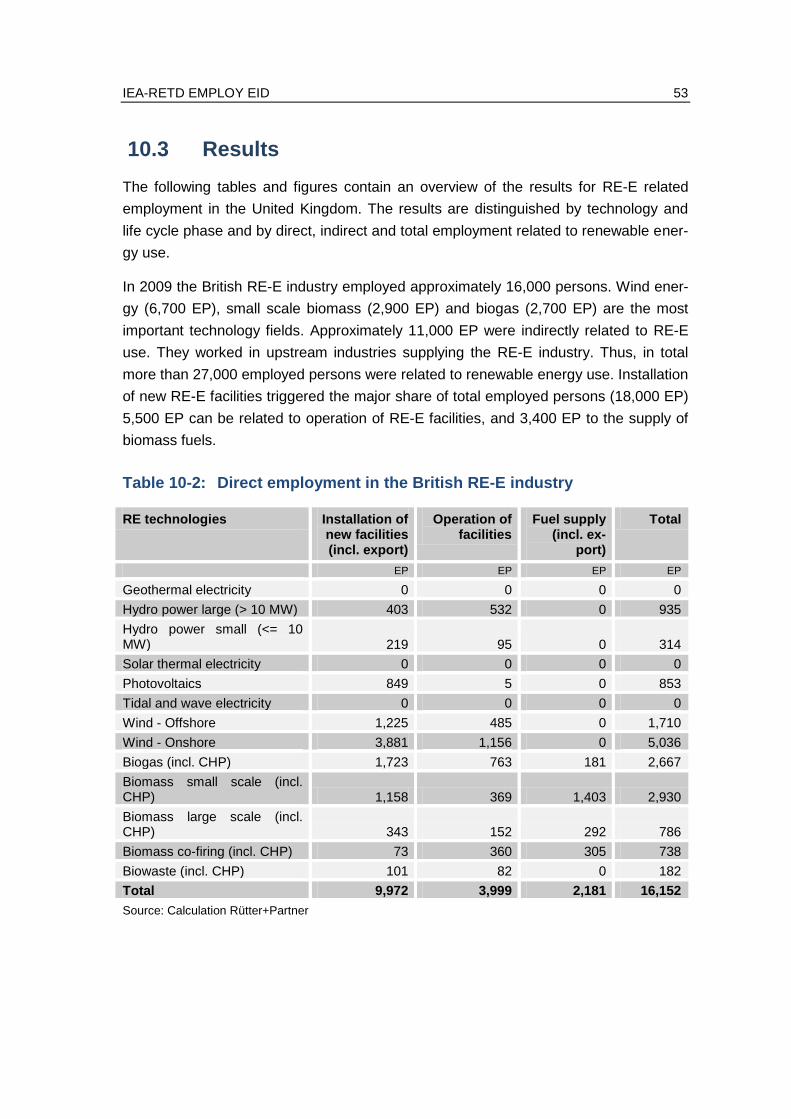
IEA-RETD EMPLOY EID 53
10.3 Results
The following tables and figures contain an overview of the results for RE-E related
employment in the United Kingdom. The results are distinguished by technology and
life cycle phase and by direct, indirect and total employment related to renewable ener-
gy use.
In 2009 the British RE-E industry employed approximately 16,000 persons. Wind ener-
gy (6,700 EP), small scale biomass (2,900 EP) and biogas (2,700 EP) are the most
important technology fields. Approximately 11,000 EP were indirectly related to RE-E
use. They worked in upstream industries supplying the RE-E industry. Thus, in total
more than 27,000 employed persons were related to renewable energy use. Installation
of new RE-E facilities triggered the major share of total employed persons (18,000 EP)
5,500 EP can be related to operation of RE-E facilities, and 3,400 EP to the supply of
biomass fuels.
Table 10-2: Direct employment in the British RE-E industry
RE technologies Installation of new facilities (incl. export)
Operation of facilities
Fuel supply (incl. ex-
port)
Total
EP EP EP EP
Geothermal electricity 0 0 0 0
Hydro power large (> 10 MW) 403 532 0 935
Hydro power small (<= 10 MW) 219 95 0 314
Solar thermal electricity 0 0 0 0
Photovoltaics 849 5 0 853
Tidal and wave electricity 0 0 0 0
Wind - Offshore 1,225 485 0 1,710
Wind - Onshore 3,881 1,156 0 5,036
Biogas (incl. CHP) 1,723 763 181 2,667
Biomass small scale (incl. CHP) 1,158 369 1,403 2,930
Biomass large scale (incl. CHP) 343 152 292 786
Biomass co-firing (incl. CHP) 73 360 305 738
Biowaste (incl. CHP) 101 82 0 182
Total 9,972 3,999 2,181 16,152
Source: Calculation Rütter+Partner
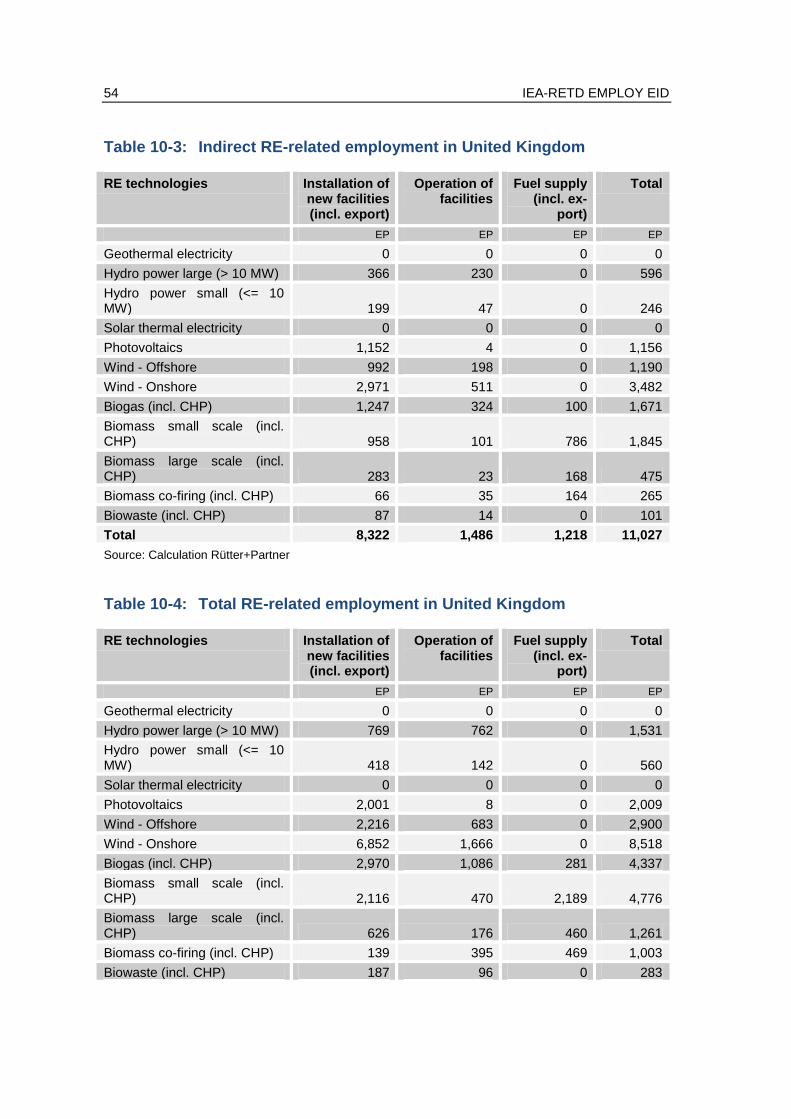
54 IEA-RETD EMPLOY EID
Table 10-3: Indirect RE-related employment in United Kingdom
RE technologies Installation of new facilities (incl. export)
Operation of facilities
Fuel supply (incl. ex-
port)
Total
EP EP EP EP
Geothermal electricity 0 0 0 0
Hydro power large (> 10 MW) 366 230 0 596
Hydro power small (<= 10 MW) 199 47 0 246
Solar thermal electricity 0 0 0 0
Photovoltaics 1,152 4 0 1,156
Wind - Offshore 992 198 0 1,190
Wind - Onshore 2,971 511 0 3,482
Biogas (incl. CHP) 1,247 324 100 1,671
Biomass small scale (incl. CHP) 958 101 786 1,845
Biomass large scale (incl. CHP) 283 23 168 475
Biomass co-firing (incl. CHP) 66 35 164 265
Biowaste (incl. CHP) 87 14 0 101
Total 8,322 1,486 1,218 11,027
Source: Calculation Rütter+Partner
Table 10-4: Total RE-related employment in United Kingdom
RE technologies Installation of new facilities (incl. export)
Operation of facilities
Fuel supply (incl. ex-
port)
Total
EP EP EP EP
Geothermal electricity 0 0 0 0
Hydro power large (> 10 MW) 769 762 0 1,531
Hydro power small (<= 10 MW) 418 142 0 560
Solar thermal electricity 0 0 0 0
Photovoltaics 2,001 8 0 2,009
Wind - Offshore 2,216 683 0 2,900
Wind - Onshore 6,852 1,666 0 8,518
Biogas (incl. CHP) 2,970 1,086 281 4,337
Biomass small scale (incl. CHP) 2,116 470 2,189 4,776
Biomass large scale (incl. CHP) 626 176 460 1,261
Biomass co-firing (incl. CHP) 139 395 469 1,003
Biowaste (incl. CHP) 187 96 0 283
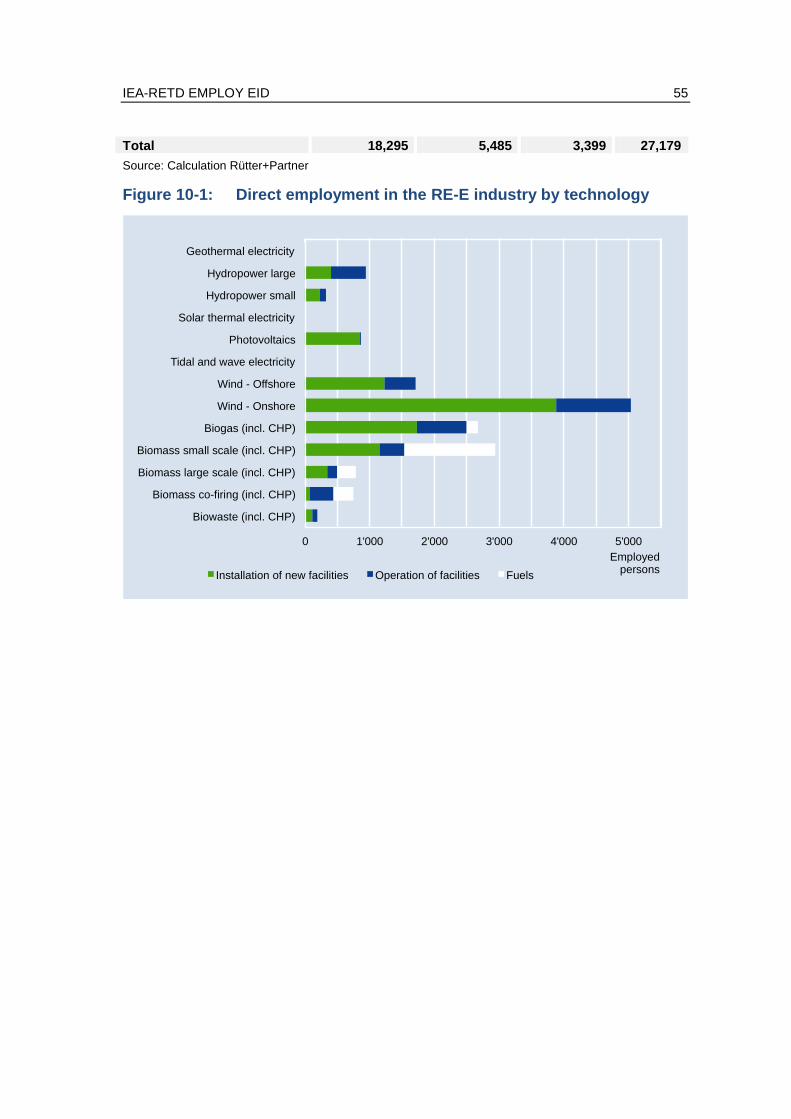
IEA-RETD EMPLOY EID 55
Total 18,295 5,485 3,399 27,179
Source: Calculation Rütter+Partner
Figure 10-1: Direct employment in the RE-E industry by technology
0 1'000 2'000 3'000 4'000 5'000
Geothermal electricity
Hydropower large
Hydropower small
Solar thermal electricity
Photovoltaics
Tidal and wave electricity
Wind - Offshore
Wind - Onshore
Biogas (incl. CHP)
Biomass small scale (incl. CHP)
Biomass large scale (incl. CHP)
Biomass co-firing (incl. CHP)
Biowaste (incl. CHP)
Installation of new facilities Operation of facilities Fuels
Employed persons
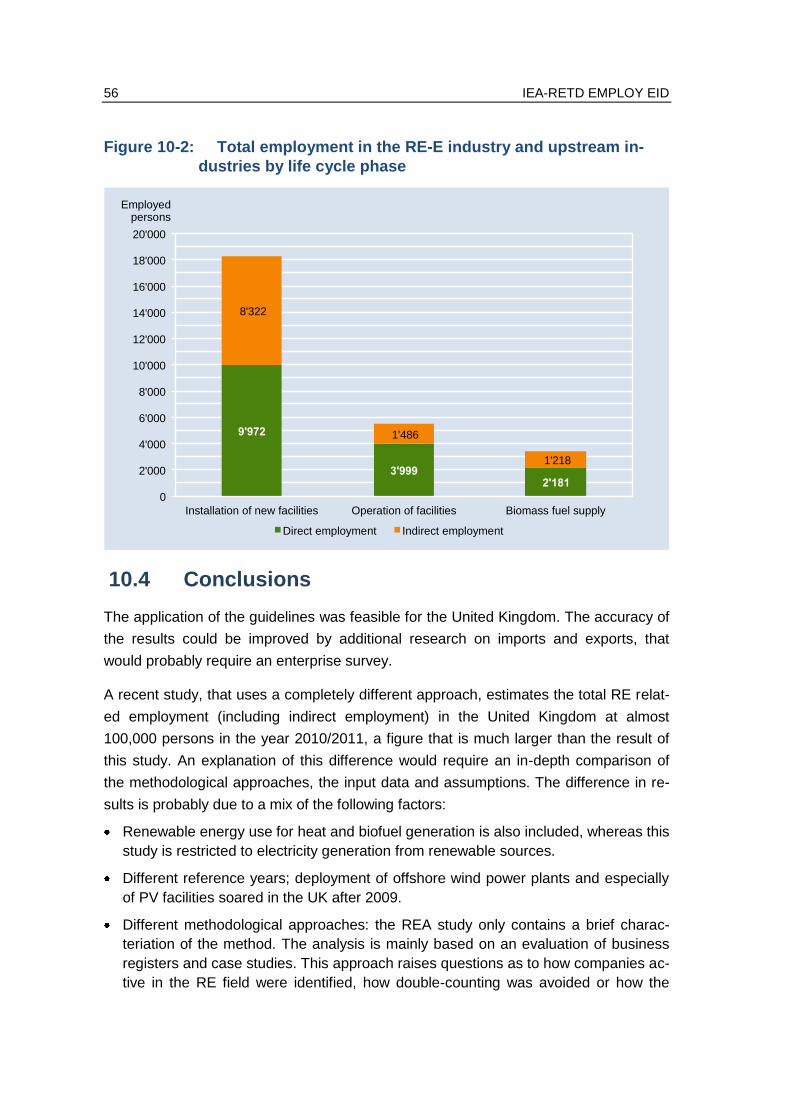
56 IEA-RETD EMPLOY EID
Figure 10-2: Total employment in the RE-E industry and upstream in-
dustries by life cycle phase
9'972
3'999 2'181
8'322
1'486
1'218
0
2'000
4'000
6'000
8'000
10'000
12'000
14'000
16'000
18'000
20'000
Installation of new facilities Operation of facilities Biomass fuel supply
Employed persons
Direct employment Indirect employment
10.4 Conclusions
The application of the guidelines was feasible for the United Kingdom. The accuracy of
the results could be improved by additional research on imports and exports, that
would probably require an enterprise survey.
A recent study, that uses a completely different approach, estimates the total RE relat-
ed employment (including indirect employment) in the United Kingdom at almost
100,000 persons in the year 2010/2011, a figure that is much larger than the result of
this study. An explanation of this difference would require an in-depth comparison of
the methodological approaches, the input data and assumptions. The difference in re-
sults is probably due to a mix of the following factors:
Renewable energy use for heat and biofuel generation is also included, whereas this
study is restricted to electricity generation from renewable sources.
Different reference years; deployment of offshore wind power plants and especially
of PV facilities soared in the UK after 2009.
Different methodological approaches: the REA study only contains a brief charac-
teriation of the method. The analysis is mainly based on an evaluation of business
registers and case studies. This approach raises questions as to how companies ac-
tive in the RE field were identified, how double-counting was avoided or how the

IEA-RETD EMPLOY EID 57
share of RE in turnover, exports and employment were estimated without surveying
the companies. Therefore the system boundaries of the RE industry are probably
different from those defined in this study. These methodological differences will
probably influence the results.
58 IEA-RETD EMPLOY EID
11 Tunisia
Author: Ulrike Lehr (GWS)
11.1 Acknowledgements
The following is an excerpt from the final report on “Renewable energy and energy effi-
ciency in Tunisia – employment, qualification and economic effects - past, present,
future” commissioned by GIZ on behalf of ANME (Agence Nationale pour la Maîtrise de
l'Energie, Tunis). The German Gesellschaft für Wirtschaftliche Strukturforschung
(GWS), Osnabrück, Germany led this project and Alcor, Tunis, Tunisia, a consultancy
worked as a sub-contractor.
11.2 Methodological approach
The analysis of employment effects from an increase in renewable energy and energy
efficiency in a developing country/emerging economy has not been treated in the litera-
ture until now. Studies and results can be found either for larger units, for instance for
certain world regions such as Africa, the Middle East, Latin America, Asia; or for much
smaller units with the analysis of single projects. The latter can be found on rural elec-
trification projects in Africa or India, but neither result can be easily transferred to esti-
mate the effects of RE deployment and energy efficiency measures in Tunisia.
The methodology follows the approach suggested in the EMPLOY guidelines, i.e. an
adjusted Input-Output (I/O) Analysis, with two important differences:
1. We have been modeling projections, i.e. future scenarios of RE deployment. For
past years two important factors forced us to deviate from the recommended
structure:
a. Very few data are available on investment and RE-deployment in the
past (in Tunisia),
b. In the past, very little RE-technologies have been produced in Tunisia
except for solar water heaters. Employment stems from installation and
services. Total employment since 2005 in RE and energy efficiency has
been calculated as 3503, plus roughly 2500 indirect jobs.
2. We directly use I/O vectors for the RE technologies from a study on the German
RE-industry (Lehr et al. 2012 and BMU 2011) and use Tunisian I/O tables for
second round and higher order effects. This means, we consider RE-technology

IEA-RETD EMPLOY EID 59
manufacturing as a new economic sector. Since this sector is fairly young, we
assume that the survey based I/O vectors hold true in each country in the world.
We apply the RE-technology-specific I/O vectors to model intermediary production
caused by the additional demand for RE-systems and by operation and maintenance.
For the calculation of indirect employment, labor-intensities from Tunisian statistics are
used and the calculation of second round effects is based on Tunisian I/O tables. Local
employment crucially depends on the share of imported goods and services and local
production. These shares are taken into consideration along the whole value chain.
They change over time; local production can replace imports as industrial development
takes place.
The results of these steps provide estimates of indirect employment. Indirect employ-
ment can grow faster in Tunisia than direct employment in production of RE-systems at
the beginning, because it can be directly developed from existing production structures,
while a new fabrication site for windmills or for PV systems takes longer to build. For
those technologies which are produced locally and installed locally or exported, how-
ever, direct employment has to be added. Direct employment can be derived from in-
ternational RE-specific labor intensities, because the Tunisian industry can be as inno-
vative and productive as its international competitors.
Learning curves for RE-technologies are embedded in the scenarios; investment per
MW installed follows the respective learning curve per technology. Exports increase
over time as the industry develops. Import shares decline over time as more and more
industrial integration takes place.
The following data was readily available: I/O Tables (19 sectors) for Tunisia exist for
2004-2008; I/O Tables for RE-Technologies (71 economic sectors) exist for 2007, both
being adjusted for future development, and the scenarios (capacities installed, invest-
ment, and electricity generation) have been developed in parallel and in close coopera-
tion with our work.

60 IEA-RETD EMPLOY EID
11.3 Model structure
[exports]
total use
breakdown by import quote[production quote by def]
production imports
breakdownin 71 products
imported final products
aggregationfrom 71 to 19 products
breakdown by value added [intermediate quota by def]
intermediate (dom. & imp.) value added
aggregationover 5 technologies
breakdown in 71 products by using ERIDE/ERMDE
intermediate import quotain 71 products
quotes of imported intermediate products
domestic intermediates
aggregationfrom 71 to 19 products
aggregationover 5 technologies
add on fbcfr
add on FBCFRaggregation
over 5 technologies
add on impsr
default:
default: total use = production
default: breakdown acc. to int. standard
default: no intermediate imports
default: only machinery is imported
export
breakdownin 71 products
aggregationfrom 71 to 19 products
aggregationover 5 technologies
add on expsr
[1] PRODUCTION [2] EXPORT
breakdown acc. to int. standard
add energy efficiency
default:no EFF
add energy efficiency
add energy efficiency
default:no EFF
total use
breakdown by import quote
production imports
breakdownin 71 products
breakdown by value added [intermediate
intermediate (dom. & imp.)
value added
intermediate import
add on FBCFR
add on impsr
default:
default: total
default:
default: no
default: only
export
add on expsr
[1] PRODUCTION
breakdown acc.
add energy efficiency
add energy efficiency
default:
imported final products
aggregationfrom 71 to 19 products
aggregationover 5 technologies
breakdown in 71 products by using ERIDE/ERMDE
aggregationover 5 technologies
breakdownin 71 products
aggregationfrom 71 to 19 products
aggregationover 5 technologies
11.4 Input data
The following input data were used for the calculations:
Table 11-1: Input data for Tunisia
Data type Source
Capacities, generation and fuel input of RE facilities 2012 - 2030:
Installed capacity
Net capacity increase
Electricity generation
The Tunisian Solar Plan (PST), on energy efficiency and renewable energy in electricity and heat
“Renewable energy production in Tunisia, perspectives and opportunities until 2030 (Production d’électricité renouvelable en Tunisie - Perspectives et opportunités a l’Horizon 2030) GIZ/ANME, October 2010
The strategic study on the energy mix for the electricity production in Tunisia, part 5” Models and scenarios”, Wuppertal Institute and Alcor, January 2012
Efficiency Plan Bleu (2008)
Own Calculation

IEA-RETD EMPLOY EID 61
Data type Source
Investment in
New capacities
O&M
Efficiency
The strategic study on the energy mix for the electricity production in Tunisia, part 5” Models and scenarios”, Wuppertal Institute and Alcor, January 2012
Plan Bleu (2008)
Own Calculation
Turnover of the RE industry by technology
Calculated from: Investment – import + export
Cost structures
Shares of cost components
Allocation to industries ac-cording to the IO model
From Lehr et al. 2011, 2012
Input-output table of Tunisia 2004-2008
Download from Tunisian National Institute of Statistics (INS, http://www.ins.nat.tn/ )
Industry specific employment data
Employment per unit of out-put
Compensation per employee
Download from Tunisian National Institute of Statistics (INS, http://www.ins.nat.tn/ )
Remarks:
Tunisia plans to install wind turbines (1570 MW), PV (1930 MW), CSP (595 MW) for
electricity generation, solar water heaters (700 MW) in the residential heat sector
and 50 MW biogas until 2030.
Assumptions on imports of complete systems and/or components and/or intermedi-
ary goods are crucial for the calculation of employment from renewable energy in
developing countries/ emerging economies
Installation and operation and maintenance lead to local employment early in the
process.
Permanent employment is created in operation and maintenance. In production of
RE-systems, it depends on industrial integration and export opportunities, because
otherwise employment is found in installation and parallels the building time of RE
projects.
Because one may expect newly rained experts and engineers in RE-production to
have higher wage demands, the local wage structure has to be adapted to new in-
dustries.
11.5 Results
The following table contains an overview of the main results for RE (and Energy Effi-
ciency) related employment in Tunisia by technology. It should be noted that assump-
tions on imports are conservative and sensitivities for higher integration rates of the
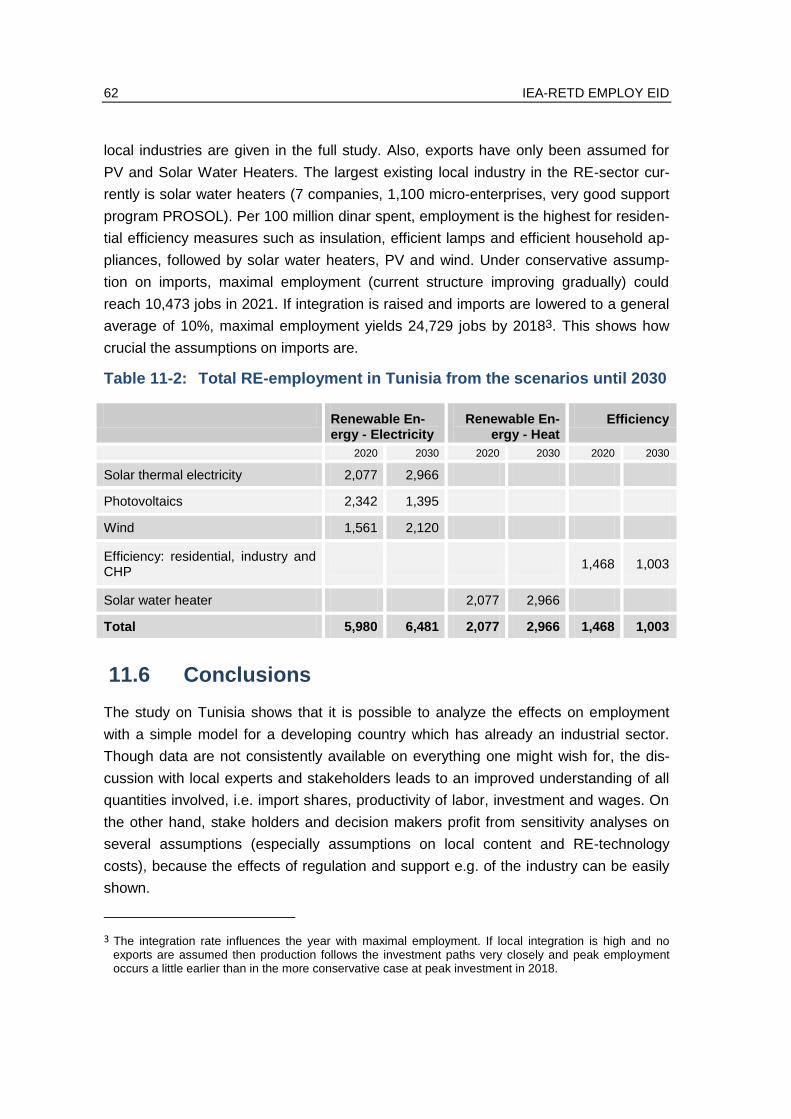
62 IEA-RETD EMPLOY EID
local industries are given in the full study. Also, exports have only been assumed for
PV and Solar Water Heaters. The largest existing local industry in the RE-sector cur-
rently is solar water heaters (7 companies, 1,100 micro-enterprises, very good support
program PROSOL). Per 100 million dinar spent, employment is the highest for residen-
tial efficiency measures such as insulation, efficient lamps and efficient household ap-
pliances, followed by solar water heaters, PV and wind. Under conservative assump-
tion on imports, maximal employment (current structure improving gradually) could
reach 10,473 jobs in 2021. If integration is raised and imports are lowered to a general
average of 10%, maximal employment yields 24,729 jobs by 20183. This shows how
crucial the assumptions on imports are.
Table 11-2: Total RE-employment in Tunisia from the scenarios until 2030
Renewable En-ergy - Electricity
Renewable En-ergy - Heat
Efficiency
2020 2030 2020 2030 2020 2030
Solar thermal electricity 2,077 2,966
Photovoltaics 2,342 1,395
Wind 1,561 2,120
Efficiency: residential, industry and CHP
1,468 1,003
Solar water heater 2,077 2,966
Total 5,980 6,481 2,077 2,966 1,468 1,003
11.6 Conclusions
The study on Tunisia shows that it is possible to analyze the effects on employment
with a simple model for a developing country which has already an industrial sector.
Though data are not consistently available on everything one might wish for, the dis-
cussion with local experts and stakeholders leads to an improved understanding of all
quantities involved, i.e. import shares, productivity of labor, investment and wages. On
the other hand, stake holders and decision makers profit from sensitivity analyses on
several assumptions (especially assumptions on local content and RE-technology
costs), because the effects of regulation and support e.g. of the industry can be easily
shown.
3 The integration rate influences the year with maximal employment. If local integration is high and no exports are assumed then production follows the investment paths very closely and peak employment occurs a little earlier than in the more conservative case at peak investment in 2018.
IEA-RETD EMPLOY EID 63
12 References
trise de l’Energie (ADEME, 2010): Marchés,
emplois et enjeu énergétique des activités liées à l’améloriation de l’efficacité
énergétique et aux énergies renouvelables: situation 2008-2009 – perspectives
2010. ADEME report no. 08 10C 0013, Angers.
Bradley, D., Thiffault, E. (2012): IEA Bioenergy Task 40 Country Report: Canada 2011.
IEA Bioenergy Task 40 - Sustainable Bioenergy Trade.
http://www.bioenergytrade.org.
BMU(2011) Renewably employed!
Download: http://www.erneuerbare-energien.de/files/english/pdf/application/pdf/
broschuere_erneuerbar_beschaeftigt_en_bf.pdf
BWE/VDMA (2011): Windindustrie in Deutschland – Inlandsmarkt und
Exportge ft. Download:
http://www.dewi.de/dewi/fileadmin/pdf/publications/Statistics%20Pressemitteilung
en/30.06.11/windindustrie-deutschland-inlandsmarkt-und-exportgeschaeft.pdf
Cocchi, M., Nikolaisen, L., Junginger, M., Chun, S. G., Heinimö, J., Bradley, D., Hess,
R., Jacobson, J, Ovard, L.P., Thrän, D., Hennig, C., Deutmeyer, M., Schouwen-
berg, P.P., Marchal, D. (2011): Global wood pellet industry: Market and trade
study. IEA Bioenergy Task 40 “Sustainable Bioenergy Trade”. Paris.
Danish Wind Industry Association (DWIA, 2010): Danish Wind Industry Annual Statis-
tics 2010.
Delphi (2007): Situational analysis of the Canadian renewable energy sector with a
focus on human resource issues. Final report prepared by the Delphi Group,
Ottawa.
Dettli, R., Steiner, P., Baur, M., Müller, M. (2004): Kosten und Entschädigung von
Strom aus Kehrichtverbrennungsanlagen. (engl.: Costs and compensation of
electricity from MSW incineration plants). Study for the Swiss Federal Office of
Energy, Ittigen.
Eurostat (2011): Download of input-output tables from
http://epp.eurostat.ec.europa.eu/portal/page/portal/esa95_supply_use_input_tabl
es/ introduction.
64 IEA-RETD EMPLOY EID
Gaudin, Th., Vésine, E. (2010): Marches, Emplois et Enjeu Energietique des Actictivi-
tés lieés à Amelioration de l’Efficacité Energétique et aux Energies Renouve-
lables: Situation 2008-2009 – Perspectives 2010. Agence de l’Environnement et
la Maîtrise de l’Energie, Direction Exécutive de la Stratégie et de la Recherche
Service Observation Economie et Evaluation, Direction Opérationnelle Déléguée.
Green-X database. Database on potentials and cost for RES in Europe. Accessible at
www.green-x.at.
IEA (2010a): Trends in photovoltaic applications: Survey report of selected IEA coun-
tries between 1992 and 2009. Photovoltaic power systems program. Report IEA-
PVPS T1-19:2010.
IEA (2010b): IEA wind energy: annual report 2009. Executive Committee for the Im-
plementing Agreement for Co-operation in the Research, Development, and De-
ployment of Wind Energy Systems of the International Energy Agency, Paris.
IEA (2011a): Trends in photovoltaic applications: Survey report of selected IEA coun-
tries between 1992 and 2010. Photovoltaic power systems program. Report IEA-
PVPS T1-20:2011.
IEA (2010b): IEA wind energy: annual report 2010. Executive Committee for the Im-
plementing Agreement for Co-operation in the Research, Development, and De-
ployment of Wind Energy Systems of the International Energy Agency, Paris.
Japanese Statistics Bureau (JSB, 2012): 2005 Input-output tables for Japan and sup-
plementary tables. Download from http://www.stat.go.jp/english/data/io/io05.htm.
Statistics Bureau, Director-General for Policy Planning (Statistical Standards) and
Statistical Research and Training Institute. Tokyo.
Junginger et al. (2011): Summary, synthesis and conclusions from IEA Bioenergy Task
40 country reports on international bioenergy trade
KLEMS (2011): Download of sector-specific data from the KLEMS website,
http://www.euklems.net.
Lako, P., Beurskens, L.W.M.: Socio-economic indicators of renewable energy in 2010.
Update of data of turnover and employment of renewable energy companies in
the Netherlands. Energy Research Centre of the Netherlands.
IEA-RETD EMPLOY EID 65
Lehr, U., C. Lutz, D. Edler, M. O’Sullivan, K. Nienhaus, S. Simon, J. Nitsch, B.
Breitschopf, P. Bickel, M. Ottmüller (2011): Kurz- und langfristige Auswirkungen
des Ausbaus der erneuerbaren Energien auf den deutschen Arbeitsmarkt. (Short
and long term effects of renewable energy deployment on the German labour
market). Study for the German ministry for the Environment. Osnabrück.
Lehr, U., Lutz, C., Edler, D. (2012), Green jobs? Economic impacts of renewable ener-
gy in Germany Journal of Energy Policy DOI:10.1016/j.enpol.2012.04.076.
Matsumoto, N., Hondo, H. (2010): Analysis on employment effects of the introduction
of renewable energy technologies using an extended input-output table (in Japa-
nese). In: Proceedings of the 26th Conference on Energy System, Economy and
Environment, January 26-27, 2010, Tokyo. Japan Society of Energy and
Resources.
Nitsch, J., Pregger, T., Scholz, Y., Naegler, T., Sterner, M., Gerhardt, N., von Oehsen,
A., Pape, C., Saint-Drenan, Y.-M., Wenzel, B. (2010): „Leitstudie 2010“:
Langfristszenarien und Strategien fuer den Ausbau der erneuerbaren Energien in
Deutschland bei Beruecksichtigung der Entwicklung in Europa und global.
Stuttgart, Kassel, Teltow.
Renewable Energy Association (REA, 2012): Renewable energy: made in Britain. Lon-
don.
Resch, G.; Panzer, C.; Ortner, A.; Busch, S.; Hoefnagels, R.; Junginger, M.; Ragwitz,
M.; Steinhilber, S.; Klessmann, C.; Faber, T. (2012): Renewable energies in Eu-
rope – Scenarios on future European policies for RES. Reshaping project report
D22, Vienna, 2012 – available at www.reshaping-res-policy.eu.