Embed Size (px)
Citation preview

Economic and Epidemiologic PolicyImplications of Alternative
Bovine Brucellosis Programs
Stephen H. Amosson, Raymond A. Dietrich,Hovav Talpaz and John A. Hopkin
This paper analyzes policy implications arising from the National Brucellosis TechnicalCommission Study. A systems simulation model was designed to estimate physical lossesresulting from alternative bovine brucellosis programs. Changes in benefits, costs, level ofinfection and net benefits were calculated by program alternatives for determining economicand epidemiologic implications. Results indicate all alternative programs considered yieldpositive net benefits and reduce the prevalence of the disease. The results imply a need forfurther research to determine a program that is both epidemiologically and economicallyoptimal.
Bovine brucellosis is a reproductive dis-ease that causes abortions, light weightcalves, extended calving intervals and re-duced milk production in beef and dairycows. In 1976, estimated losses from bovinebrucellosis exceeded 65 million pounds ofbeef and 35 million pounds of milk[Amosson, et al]. During that year 75 milliondollars were spent by producers, state andfederal authorities to control the spread ofbrucellosis. Thus, the selection of a govern-ment program to control and/or eradicatebovine brucellosis has a major economic im-pact on cattle producers, consumers and tax-payers.
This paper will analyze and present theeconomic and epidemiologic results of alter-native brucellosis programs developed by theNational Brucellosis Technical Commission.A systems simulation model was used to ana-lyze the effects of the alternative programs onthe spread of brucellosis and to estimate the
Stephen H. Amosson is Research Associate, Raymond A.Dietrich and Hovav Talpaz are Associate Professors andJohn A. Hopkin is Professor, all in the Department ofAgricultural Economics at Texas A&M University.This study was funded by USDA-APHIS.
associated physical losses of beef and milk.Physical losses will then be employed as shiftparameters for the respective supply curvesfrom which consequent changes in conspm-ers' and producers' surpluses will be cal-culated for each alternative program.
Methodology
This study is comprised of two primarycomponents. First, an epidemiologic modelwas designed to simulate the biological ef-fects of brucellosis through the cattle popula-tion and to calculate physical losses resultingfrom reductions in weaning weights and milkproduction for each program. Secondly, aneconometric model was employed to mea-sure the economic impacts of the changes inphysical losses to consumers and producers.
1 0n the recommendation of the U.S. Animal HealthAssociation (USAHA), the Animal and Plant HealthInspection Service (APHIS), U.S. Department of Ag-riculture (USDA) appointed a 5-member team, desig-nated as the National Brucellosis Technical Commission(NBTC) to make an impartial study of the nationalbrucellosis eradication program. The NBTC consistedof two epidemiologists, a medical doctor, an animalscientist and an economist.
43
Western Journal of Agricultural Economics
Epidemiological Model
A simulation model was designed to mea-sure the impact of various brucellosis policyalternatives upon the spread, control and/oreradication of brucellosis among beef anddairy herds in the United States over a 18-year time horizon. Development of the mod-el was based on earlier work by Beal andKryder.
In this epidemiologic model, the U.S. wasdivided into eight regions, (Figure 1) on thebasis of similarity with respect to such select-ed criteria relating to brucellosis as level ofinfection, herdsize distribution, method ofoperation, trading patterns, and effectivenessof brucellosis surveillance and control. Themodel was designed to determine simultane-ously the effect of various policy alternativesupon both the beef and dairy sectors. Thedisease could be transmitted, in the model,among and between beef and dairy herds inapproximately the same manner as occurredwithin the cattle industry. In addition, it wasdesigned such that infected and detectedherds could be placed in a "quarantined"status while undetected infected herds re-mained in a non-quarantined status. The sub-division of infected herds into quarantinedand non-quarantined herds has a major im-pact upon physical losses, disease spread,and clean-up rates in the model.
Benefits from investments in bovinebrucellosis control programs were based onreduction in physical losses caused by infec-tion. Physical losses due to infection are rep-resented by decreased production of meatand milk. Losses were estimated on a per-infected beef and dairy cow basis, and variedby region, year of infection (1 to 3 years),quarantine (identification) status and vaccina-tion status.
Methods of Disease Transmission
Brucellosis can be transmitted to cleanherds by purchasing an infected replacementor through contact with a neighboring infect-ed herd. A double binomial [Beal] was usedto simulate the spread of the disease through
44
the purchase of infected replacements. Dueto the nature of the cattle industry, param-ters p, s, q, m and n, defined below, werenecessary for calculating the double binomialwhich is defined as:
(1) 1 - [(q + ps")n]
where
Number of cows in infected herds in the region
Total number of cows in the region
Number of cows in brucellosis free herds in the regionq = Tl n r of cs i t
Total number of cows in the region
1s( Total number of infected cows in region )
Total number of cows in infected herds in region
n =Number of sources from which replacements were purchased
Number of replacements purchased annuallym
Number of sources
Parameters p, s, and q are dependent onthe number of undetected infected cows andherds in the region. Therefore, p, s, and qchange from year to year as the undetectedpopulation expands or contracts.
Parameters m and n are calculated in theinitial year of the model by region and herd-size group. M and n are held constant for therest of the years of the simulation.
The double binomial was modified to allowfor interregional movement of breedingstock. Each region has a certain probability ofpurchasing from within their own region andeach of the other regions. These probabilitiesalways sum to 1 for any given purchasingregion and are held constant throughout thesimulation (equation 2).
To arrive at the number of newly infectedherds, the probability of purchasing one ormore infected replacements by herdsize andregion is multiplied by the number of cleanherds in that herdsize group and region.
(2)
8 RegionalPPhij = I [(Purchase )hiLL
LL = 1 Probability
x (1 - ((q + PS") n)hij]
July 1981

Amosson, Dietrich, Talpaz and Hopkin
at
uj
I-
CD
W
ul
0
-J
z
0U0
-j
z0
w
<0
UJI
CL
0
uL
0ox
z
IiIiid
c
o2E
I'U0k.t<lcr
45
Bovine Brucellosis Analysis
I
o

Western Journal of Agricultural Economics
where
NI = number of newly infectedherds
PP = probability of purchasing oneor more infected replacements
NCLEAN = number of clean herds in theregion
h = 1,2 species
i
JLL
= 1,...,8 regions
= 1,... ,7 herdsizes
= probability of purchasing a re-placement from a given region
The second avenue in which a clean herdcould become infected is through contactwith a neighboring infected herd. A quaran-tined herd was assumed to have one-half thespread of a first year undetected infectedherd (equation 3). The adjusted newly unde-tected infected herds were then weighted bytheir year of infection and totaled over herd-size, year of infection and species for theregion (equation 4).
INFR = within herd infection rate
i = 1,...,4 regions
j = 1,.. .,7 herdsizes
k = 1,2,3 years of within herd infection
L = 1,2,3 years of quarantine
n = 1,2 species
Newly infected herds (INF) due to neigh-borhood spread were then calculated by mul-tiplying the weighted total infected herds (T)by the probability of a herd becoming infect-ed (NS) which varies by region and species.These newly infected herds are distributed tothe herdsize groups on the basis of theirweighted population proportions (WPP),where the weighted population proportionequals the number of herds by herdsizegroup, and species within the region dividedby total number of herds in the region.
(5) INFhijl = Ti x NShi x WPPhij
Disease Surveillance Programs
3 3(3) INFhijl= E E
L= 1 k = 1
2(4) Ti = I
h
7
=1 j =
(INFhijk X WINFhi
where
= undetected infected
= quarantined infecte
= total weighted infe
WINF = weighted infection
The two primary methods of disease sur-veillance are the market cattle identificationprogram (MCI) and the brucellosis ring test
QUARhijk1 (BRT). The MCI tests cattle moving throughmarketing channels and at the slaughter
3 level. The BRT analyzes milk from dairyE herds three to six times annually for possible
1 k = 1 brucellosis infection.The probability of undetected infected
herds being detected through the MCI sur-k) veillance system had to be estimated in order
to determine the number of newly quaran-tined herds in the beef population. The de-tection probabilities were calculated by anapproximation of a hypergeometric distribu-tion. (For detailed discussion of a hy-
d herds pergeometric distribution consult RegulatoryEd herds Statistics or Cochran, W. G.) Detection
cted herds probabilities varied by region, herdsize, yearof infection, cull rate cycle, MCI rate and
rate level of vaccination:
where WINFhk INFRhikINFRhi2
(6) DP = 1 -(A - I - S/2 +.5 )A- S/2 +.5
INF
QUART
46
July 1981

Amosson, Dietrich, Talpaz and Hopkin
where
DP = detection probability
A = number of cows culled
I = number of infected cows culled
S = number of cows culled under surveil-lance system
Detection probabilities were used in com-bination with the quality control factor andprogram test efficiency ratings for that regionin determining the number of newly quaran-tined herds each year.
The number of quarantined herds result-ing from the BRT is estimated in the equa-tion below. Due to the nature of the BRT, itwas assumed that the BRT surveillance sys-tem would quarantine a percentage of thetotal infected herds subjected to the BRT.The effectiveness of the BRT is dependent onfrequency of which milk samples are collect-ed and properly analyzed and can vary byregion.
(7) QUARijkl = BRT x INFijk
where
QUAR = quarantined herd
BRT = brucellosis ring test efficiencyrating
INF = undetected infected dairy herds
Economic Models
For purposes of economic analysis, costswere defined as those expenditures relatingto brucellosis incurred by federal and stategovernments plus estimates of costs incurredby private operators as a result of bovinebrucellosis. Producer costs could also be clas-sified as an indirect associated cost and nett-ed out of the benefit stream [Beattie, et al.].Since accounting procedures of some statesinclude part of producer costs in their statecosts, producer costs were considered as di-rect program costs. Total federal, state andproducer expenditures during 1976 totaledabout $75 million. Program costs for the vari-ous alternative programs analyzed varied an-
nually by type of program and were based oninformation supplied by APHIS, USDA anda cost-management questionnaire mailed to arandom sample of producers. APHIS esti-mates of program costs include all anticipatedindemnities to producers for reactor cattleand possible herd depopulations.
In estimating economic benefits for alter-native programs, differences in annual physi-cal losses associated with each program alter-native were measured from levels of lossesprojected for the base program. These annualdifferences in losses were then used to repre-sent changes in the total supply of beef andmilk in calculating new equilibrium prices.This was accomplished with a modified ver-sion of the USDA "Cross-Class-CommodityFeed Grain-Livestock-Wheat Model"[Teigen and Carman]. This is an econometricmodel with 165 endogenous variables repre-senting livestock sectors (beef, dairy, swine,chickens, turkeys and eggs), interrelatedwith the feed grain sectors (wheat, barley,oats, sorghum, corn and soybeans). There are120 exogenous variables representing de-mand and supply shifters. The equations inthe USDA model provide an impact responseas a function of supply and price of all theabove sectors and not only the correspondingsupply curves themselves.
Benefits from program alternatives weremeasured in terms of reduction in the physi-cal losses of meat and milk thus increasingtheir supply. Biological innovations tend tocreate divergent shifts in supply curves[Lindner and Jarrett]. In the case of brucel-losis it is assumed that the supply shift will bepivotal in nature i.e. control and/or eradica-tion of brucellosis will have a greater impacton the average cost structure of marginalproducers than inframarginal producers. Thisleads to the variation between S-S and S-S1 inFigure 2. For example, an increase in thesupply of beef changes the equilibrium priceand quantity bundle from E to E1 in Figure2. Assuming that the intercept (S) remainsunchanged for linear supply and demandcurves, producer and consumer benefits canbe readily calculated.
47
Bovine Brucellosis Analysis

Western Journal of Agricultural Economics
nrB
pP
S
S
S1
D
Figure 2. A Graphic Illustration of Consumers' and Producers' Surplus.
Where:
DD: Demand curve for beef
SS: Supply curve for beef under "Base Program" for brucellosis control
SSi: Supply curve for beef under "Accelerated Brucellosis Eradication Program"The change in Consumer surplus = area PEEIPi.The change in Producer surplus = difference between areas PSE and P1SE 1.
The change in consumers' surplus (ACS) isgiven by the trapezoid PP 1EiE (Figure 2) andcalculated by equation 8 [Anderson].
(8) ACS = (P - PI) (Q + Q1)/2
48
The change in producers' surplus (APS) isgiven by the difference between the trianglesP1E1S and PES or
(9)APS = [(P1 - S)Q1/2] - [(P - S)Q/2]
July 1981

Amosson, Dietrich, Talpaz and Hopkin
Economic benefits were then calculated interms of benefit to society as a whole, includ-ing both consumer and producer surpluses.In order to place the benefits and costs on acommon time pattern, the projected annualdata were converted to present value using a4 percent real discount rate. 2
The program alternatives which weremodeled and some of the basic assumptionswere:
1. Base Model. The base model was de-signed to simulate existing conditions withinthe industry during 1975-1976. Included inthis model were 1975-76 levels of infection,surveillance efficiency rates, levels of vacci-nation, levels of management and prevailingUniform Methods and Rules (UMR). Theother program alternatives were then de-signed to measure single modifications fromthis base program.
2. Base Model Plus Accelerated Programs.This model was designed to simulate condi-tions which might prevail under the APHIS"10-year Accelerated Eradication Program."The accelerated program involved down-the-road or area testing of about one-third of theherds, and also first-point of concentration(FPC) testing in addition to the MCI andBRT surveillance systems. In those areas orregions where area testing and FPC testing isscheduled to take place, program efficiency(level of detection) is assumed to increasesharply and the level of infection is reduced.However, the level of program efficiencyafter area testing is affected by the durationof FPC testing and follow-up testing in thoseareas which were previously area tested.Consequently, two accelerated alternativeswere modeled. In accelerated program 1, itwas assumed that program quality would re-
2The NBTC used a 4 percent discount rate as a conserva-tive estimate of the real discount rate. The real discountrate in this study is the nominal interest rate for non-real estate loans (Melichar and Sayre) minus the con-sumer price index for all items (U.S. Department ofCommerce). Using this definition and the average ratecharged on non-real estate farm debt by banks, the realdiscount rate varied between -1.8 and 4.5 percentduring 1970-76.
main at the high level reached during areatesting and FPC testing for the duration ofthe program. Accelerated program 2 as-sumed that program efficiency would dropback after area testing to the same level thatprevailed in the region prior to area testing.
3. Base Model Plus Calfhood Vaccination.This model assumed that incentives would beestablished for increased calfhood vaccina-tion in Regions 3, 4, 5, 6 and 7 (South,Southeast and Plains states). It was assumedthat Regions 1, 2 and 8 were already pro-ceeding to local eradication within these re-gions. Three levels of calfhood vaccinationwere modeled: 90 percent or higher (high),60-89 percent (medium) and 20-59 percent(low).4. Base Model Plus Whole Herd Vaccination.This model was designed for use in highprevalence Regions 3, 4 and 5 (South andSoutheast). The base program was applied inall other areas. This program assumed thatpromising research in progress will demon-strate that adult cattle may be vaccinatedsuccessfully with reduced dosages and thatdistinction can be made between field strainand strain 19 titers. Vaccination could occurunder two plans: (1) herds known to be in-fected but reactors would be removed priorto vaccination, and (2) high risk, non-infectedherds - that is, no reactors revealed by acomplete herd test at the time of vaccinationand the herd has not been under quarantineduring the last 6 months. Whole herd vacci-nation levels were also programmed at 3levels: 90 percent or higher (high), 60-89percent (medium) and 20-59 percent (low).
Simulation Projections
Baseline projections reflect the belief ofthe NBTC epidemiologists that the govern-ment program in effect during 1975-76 washolding the disease in steady state to slightlydecreasing in incidence, Table 1. Majorvariances in statistics from year to year reflectchanges in the cattle cycle. Weaner calf loss-es range from 64 to 91 million pounds peryear, while the range on milk losses is 25.96to 29.5 million pounds. The number of
49
Bovine Brucellosis Analysis

Western Journal of Agricultural Economics
OD U) t 0 CV s CD CO 0C (D aw o tD 0)0 l OOW D O O V4 N _ ) w 0 w aw w-- w qq r m 4 m C*T r C C 0 C D C D cM o D M d t CD
CD CD CD N N 000) 0 N N 0O 0 N N N N N D
CD N O n O C COs ) L N t CMD 0 N LO CM ) C)O COo a) C (D6D 0 c) Lo Ca 0o O C0 c 00 O 0)
0 i0 C O C D 0CC) V M rs O S U00O C ) C J ) N C 0 00C\l CM C\lC CM Cm CM CM CM CM C\M CM CM C\l CM CCM CM
O C- OL m CMC rlCoC Lo c Co T0 c o 0 CM
O) CM O)O O Co t ) C O It O t C h (Dt coL U( t C r 0 00 N N ) N N N N 00 LO
CN C M CM CL C0 Ct) CO CCMTCO CT CO ) 0C Co Ct CT0 000 00 0 0 0000 0000 000
) N0 0Cf ) CD 0 1 C< O 2 0 C) VO CJ
^C0N CD0) O N Nr CD CD CD O 0) 00 CD '- C')
CD C a CD C N NoD C Co CD CD C C C) Ch CN OC) N 0) 0) 0 0 CD N C) N N _ 0- CD CD ) N_
N NN N r N 0 000000 00 0 N N N N
CD N 00)0- N C) o v C N C 0 N 0 Cm CN N N N_ CD 000000000000000 00) 0) 0 )0) 0) 0) ) 0) 0) 0) ) 0) 0) 0) 0) 0) 0) 0) 0) ) 0)
_ _ _ _ _ _ ~r~
L-t5aC)
a)
m
(I)-0)
oa)0C1)
a)
C)
cogc
t5 a,2
-oas
C
U)
C.-0
-iCD
CO)
0l) -l
CO
Uc,
cc$
a)
0)
Cua)
~a
004)
m
c
<0u5L.
C)
a
-a
o
a)
co
.. l
0
O)
0,
-I-0._
o111a)
(Co
C-a)
50
July 1981
Amosson, Dietrich, Talpaz and Hopkin
quarantined and undetected infected herdsremained relatively stable.
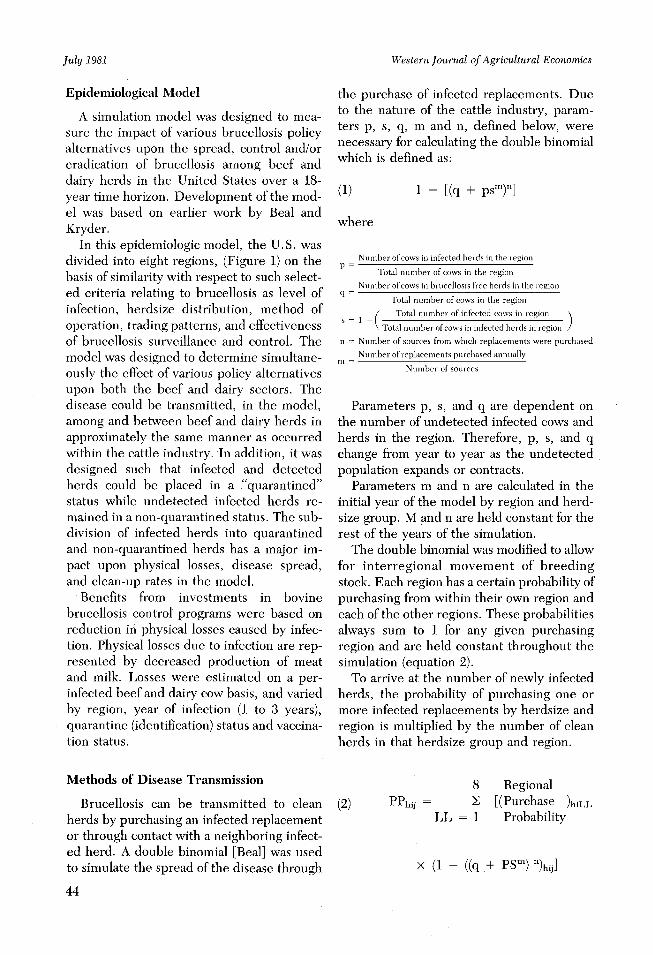
Comparing model estimates of totalquarantined herds with data obtained fromAPHIS, USDA forms 433 and 435 yieldedresults given in Table 2. The simulation mod-el underestimated the total number ofquarantined herds in both 1976 and 1978 by8.6 and 2.9 percent, respectively, when com-pared to APHIS form 433 totals. The APHISform 435 yielded 20.18 and 18.65 percentless quarantined herds during 1976 and 1978.Data availability and implementation of por-tions of the accelerated and vaccination pro-grams in 1979 make further validation dif-ficult.
Comparison of alternative programs to thebaseline projections yielded consistent re-sults, Table 3. All alternative programs leadto a reduction in weaner calf losses, milklosses, quarantined herds and undetected in-fected herds. The accelerated programsshowed a greater decrease in undetected in-fected herds than did the vaccination pro-grams. This reflects the results of down-the-road testing and higher within-herd infec-tion. Down-the-road testing in the adult vac-cination programs led to fewer undetectedinfected herds than did the calfhood vaccina-tion programs. The vaccination programsshowed their greatest strength in reducingthe magnitude of weaner calf and milk lossesvia reduction in the number of infected ani-mals and loss per animal.
The decrease in physical losses caused byall the alternative program caused minimalsupply shifts. The supply shifts for both beef
and milk production were less than 0.4 per-cent of total production in any one year and/or program. The supply changes resulted in amaximum decrease in price of beef of 40cents per hundredweight and a maximumincrease of 8 cents per hundredweight forany given year of the analysis. Further, theretail price of beef varied only 2 cents perpound between the alternative programs andthe baseline. The price of milk per hun-dredweight varied less than a penny a hun-dredweight among programs primarily dueto the small magnitude of the shift and thegovernment price support system for milk.
Results3
Table 4 provides a ranking of the variousprogram alternatives according to fourcriteria: (1) the present value of the programcosts, (2) the present value of net benefits, (3)reduction in infection and (4) change in bene-fits (total welfare).
When programs were ranked according toprogram costs, the high-level calfhood vacci-nation program ranked lowest with the high-est total cost. The second highest programcost was medium-level calfhood vaccinationfollowed by accelerated-1 and accelerated-2programs, since whole-herd vaccination pro-grams were applied to only 3 regions com-pared to 5 regions for the calfhood programs.
3The extreme differences in the definitions of alternativeprograms and underlying assumptions make compari-sons of the NBTC study with the preceding APHISstudy by Beal and Kryder and consequent economicanalysis by Liu of questionable value.
TABLE 2. Total and Change in Total Quarantined Herds Between Simulation Model andPublished Sources, United States, 1976 and 1978.
Change in Total Change in TotalQuarantined Quarantined Quarantined Quarantined
Herds in 1976 Herds in 1976 Herds in 1978 Herds in 1978(herds) (percentage) (herds) (percentage)
APHIS 433 17,036 +8.63 14,808 + 2.92APHIS 435 12,518 -20.18 13,143 -8.65Model 15,682 -- 14,388 --
51
Bovine Brucellosis Analysis

Western Journal of Agricultural Economics
TABLE 3. Changes in Weaner Calf Losses, Milk Losses, Quarantined Herds and UndetectedInfected Herds From Baseline Projections to Alternative Programs, United States,1980, 1985 and 1990.
Change In Change In Change InWeaner Calf Change In Quarantined Undetected
Program/Year/ Losses Milk Losses Herds Infected HerdsUnit (mil. Ibs.) (mil. Ibs.) (Percentage) (Percentage)
Accelerated-11980 -23.39 -3.03 -14.19 -41.021985 -53.89 -12.57 -59.26 -67.581990 -63.26 -17.48 - 76.63 -81.64
Accelerated-21980 -23.39 -3.03 -14.19 -41.021985 -54.36 -12.57 -63.69 -62.591990 -49.42 -14.85 -63.17 -62.29
CalfhoodVaccination-Low
1980 -38.01 -13.23 -39.29 -3.991985 -47.74 -17.31 -50.02 -19.101990 -52.37 -18.11 -58.89 -32.10
CalfhoodVaccination-Medium
1980 -60.17 -19.08 -71.05 -3.361985 -67.10 -23.27 -76.68 -5.091990 -66.93 -22.87 - 79.34 -14.70
CalfhoodVaccination-High
1980 -66.08 -19.83 -81.11 14.661985 -74.26 -24.36 -84.71 4.521990 -72.47 -23.84 -87.40 -3.13
Whole HerdVaccination-Low
1980 -44.98 -13.98 -50.23 -22.091985 -52.45 -17.93 -57.91 -33.911990 -55.94 -18.62 -65.16 -44.41
Whole HerdVaccination-Medium
1980 -58.78 -17.71 -70.02 -23.851985 -64.65 -21.77 - 75.29 -36.671990 -64.58 -21.72 - 78.17 -42.98
Whole HerdVaccination-High
1980 -64.98 -18.97 - 76.96 -28.221985 -70.63 -23.12 -81.91 -37.401990 -69.67 -22.90 -85.11 -43.81
In terms of net benefits whole herd vacci- vaccination at the medium, high and lownation at the medium level ranked the high- levels ranked fourth through sixth,est with 768.9 million followed by whole- respectively. The accelerated 1 and 2 pro-herd at the high and low levels. Calfhood grams ranked lowest but still yielded positive
52
July 1981

Amosson, Dietrich, Talpaz and Hopkin
r,
a)
Cv)
LO
c0LO
00
0)
CO
a)OO0>ND
Cc6I,,
C1O 06 6
co cO (D CDC) C) L 2
CO) CO cO cO^
1: 1: 1: 1
CM(60)
CM
(D
Cj0)0)
1dC4
0
0)COO
co
01-
O CM C?6 c\iCO O COCD 0G oO
CM
I(0I
LO
0)I,
I I II I I
co ._o .o .Co .o
0I 0 0 Li > O > > >
j= 1 > o > 5 1>1 =,Om 48 ;f S ~crco~~ o :.B
CODCN o0
t,0
C' C
CD (DLn uO^
Co0)
00
I1.
CO
co
(0
r_
ci
o
LO
cs
CD
C,LOC)
cOCO
CO
0
I
c 20SZ 3
a-
0
a) S
mg
a)
c
L.
0)
(n
I
.2
(0
E
L.
o
0)
0
0'-
lB
0
I)
iC
4..~
O (D 00) ) T-LC) L LO
t 00 0a
r-CY) (0CI I ICD 1) CD
10T CO
a)
._
(
C6 cu
CD) 0
oN8 E oE E
c o
Q 0 O (0
0) 1 *1-
cE ' =
° -° E - ° E
0 0) 3E
0E a) a)
N CD
) a) 2
0 0. > E
E 0) 0 c
o 0 C C
0)a, a
o E-t
53
Bovine Brucellosis Analysis
Western Journal of Agricultural Economics
net benefits of 374.0 and 294.9 million, re-spectively.
Ranking among programs on the criteria ofreduction in infection showed that calfhoodvaccination at the high level ranked first fol-lowed by whole-herd vaccination-high level,calfhood vaccination-medium level, whole-herd vaccination-low level, calfhood vaccina-tion-low level and accelerated program op-tion 2.
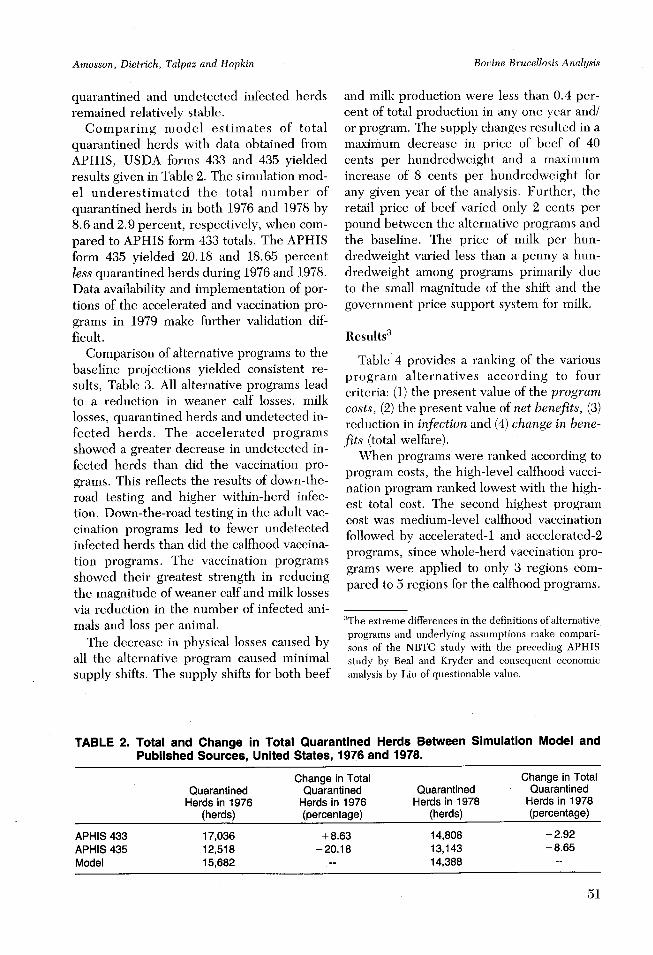
Total welfare equals the summation of thechange in consumer surplus and producersurplus [Chavas and Collins or Just andHueth] for the program alternative con-sidered (change in benefits column 2, Table1). All programs had positive changes in totalwelfare with calfhood vaccination and thehigh and medium levels showing the greatestincreases. Changes in producers' and con-sumers' surplus resulting from the im-plementation of alternative programs arepresented in Table 5.4
Implications
Program alternatives analyzed suggest thatinvestment of funds in epidemiologicallysound modifications of the present program
4The production of meat and milk can be classified asintermediate goods. "Consumer surplus" in this contextalso includes intermediate processing, handling, etc.This surplus would be shared by these producers andthe ultimate consumers.
which are specifically targeted to varying re-quirements of herds, states and regions willproduce a favorable return. Further, resultsrevealed that vaccination programs, bothcalfhood and whole-herd, would be highlyeffective in reducing infection in the highprevalence regions. Some specific implica-tions are as follows:
1. Whole-herd vaccination shows promiseas a tool to combat brucellosis in high preva-lence regions. Whole-herd vaccinations atthe three vaccination levels analyzed, re-vealed the highest net benefits and werelowest in program costs of all alternativeprograms evaluated. However, whole-herdvaccinations programs in the model wereimplemented only in the three highest pre-valence regions while calfhood vaccinationprograms were implemented in five regions.Whole-herd vaccination at the high levelranked no lower than third on any one deci-sion criteria. While whole-herd vaccinationlooks promising, it is not an epidemiologi-cally accepted program practice presentlydue to problems with false positive reactors(Anderson, et al.).
2. If eradication is the prime criterion, thehigh calfhood vaccination level reduced in-fection more than any other program alterna-tive, but ranked lowest and highest in totalprogram costs. This program cost was influ-enced by higher producer costs associatedwith additional round-ups, cattle handlingcosts, and vaccination expenditures.
TABLE 5. Impact of Alternative Programs on Producers and Consumers.
Discounted Change in Economic SurplusOver 19 Year Planning Horizon
(Million Dollars)
Program Consumers Producers
Accelerated 1 1,418.7 -803.3Accelerated 2 1,249.0 -713.1Calfhood Vaccination - Low 1,476.6 -824.7Calfhood Vaccination - Medium 2,159.7 -1,179.5Calfhood Vaccination - High 2,353.1 -1,288.9Wholeherd Vaccination - Low 1,583.4 -947.4Wholeherd Vaccination - Medium 1,974.1 -1,171.9Wholeherd Vaccination - High 2,170.9 -1,276.6
54
July 1981

Amosson, Dietrich, Talpaz and Hopkin
3. The MCI and FPC as defined in theAPHIS "10-year eradication program" andrepresented by the accelerated 1 and 2 pro-grams in this study, are not sufficient tools toachieve eradication. The accelerated pro-grams did not attain eradication within themodel planning horizon and rated fourth orlower among the various decision criteria.
4. Vaccination is effective in reducing in-fection and individual producer losses butwill not eradicate the disease. Vaccinationhas a "masking effect" on brucellosis detec-tion. That is, as the vaccination level in-creases, the number of infected animalsculled decreases, lowering the probability ofthe infected herd being detected through theMCI system.
5. An increase in expenditures on controland/or eradication of bovine brucellosis isjustified. All alternative programs which in-creased program activity yielded positive netbenefits.
6. Effective control leading to local eradi-cation of bovine brucellosis is biologicallyfeasible. However, eradication on a nationalbasis will be considerably more difficult toobtain in the absence of increased researchefforts and increased incentives for producercooperation. For example, in 1975 federalexpenditures on brucellosis research wasequivalent to .8 percent of the total federalbrucellosis program expenditures. Programgoals will be difficult to accomplish in theabsence of substantial increases in researcheffort and expenditures in such areas as theeffect of the cattle cycle on surveillance sys-tems, producer management strategies forcombating brucellosis, movement and mar-keting patterns, and other economic andepidemiologic factors which influence dis-ease control. Such research must be used tosystematically review brucellosis programpolicy, its implementation and evaluation.
References
Amosson, Stephen H., Raymond A. Dietrich, John A.Hopkin, Report-National Brucellosis Technical Com-mission, Appendix B, Benefit-Cost Analysis Preparedfor APHIS, USDA, 1978.
Anderson, J. E., "A Note on Welfare Surplus and Gainsfrom Trade in General Equilibrium." American Eco-nomic Review, 64(1974):758-762.
Anderson, Robert K., David T. Berman, W. T. Berry,John A. Hopkin and Robert Wise, (1968). Report-National Brucellosis Technical Commission, preparedfor APHIS, USDA.
Beal, Victor J., "The Use of the Double Binomial inAnimal Disease Work," APHIS Working Paper, U.S.Department of Agriculture, October, 1971.
Beal, Victor and Harvey Kryder, (1977). BrucellosisProgram Analysis, APHIS, USDA, Hyattesville,Maryland.
Beattie, B. R., E. N. Castle, W. G. Brown and W. Grif-fin, Economic Consequences of Interbasin WaterTransfer. Ag. Exp. Sta., Tech. Bull. 116, OregonState University, pp. 63-66, June 1971.
Chavas, J-P and Glenn S. Collins, "Multimarket WelfareImplications at a Non-Price Distortion." Mimeograph.College Station, Tx., Texas A&M Univerity, 1979.
Cochran, W. G. (1963). Sampling Techniques, 2nd edi-tion, John Wiley & Sons, Inc., New York, pp. 55-57.
Just, Richard E. and D. L. Hueth, "Welfare Measures inMulti-Market Framework." American Economic Re-view, 69(1979):947-54.
Lindner, R. K., and F. G. Jarrett, "Supply Shifts and theSize of Reseach Benefits." American Journal of Ag-ricultural Economics, 60(1978):48-58.
Liu, Chun-Ian, "An Economic Impact Evaluation ofGovernment Programs: The Case of Brucellosis Con-trol in the United States." Southern Journal of Ag-ricultural Economics, 11(July, 1979):163-168.
Melichar, Emanual and Marian Sayre. Agricultural Fi-nance Databook Annual Series. Board of Gover-nors of the Federal Reserve System, Division of Re-search and Statistics, Washington, D.C., November,1977.
Regulatory Statistics, 5th edition, APHIS VeterinaryServices, Animal Science Dept. of Agriculture, June,1975, Part III.
55
Bovine Brucellosis Analysis

Western Journal of Agricultural Economics
Teigen, L. D., and L. M. Carman. "The 10-Year Brucel-losis Eradication Program: A Short-Term Analysis."CED/Forecast Support Group, USDA Working Pa-per, 1978.
U.S. Department of Commerce. Bureau of The Census,Statistical Abstract of the United States, 100th edition,Washington, D.C., 1979.
56
July 1981