Embed Size (px)
Citation preview

Economic Analysis FrameworkTest Application
Draft Results
Economic Analysis ForumBBC Research & Consulting
December 16, 2004

Presentation Overview
• Background
• Project participants
• Strategy definitions
• Emission reductions
• Visibility improvements
• Economic benefits
• Strategy costs
• Benefit-cost comparison
• Economic impacts and distributional implications
• Next steps

Background
• WRAP Economic Analysis Framework– Provides common regional approach– Supports policy decisions and strategy choices– Incorporates sound economic principles and best available
data
• Purpose of test application– Demonstrate capabilities of framework and economic
analysis in general– Refine framework where appropriate– Identify required resources

Project Participants
• Data sources• Review, guidance
States and Tribes
• Lead consultants• Research, analysis, reporting• Integration
BBC Research /Dr. Michael Mueller
• Strategy design• Cost information• Emission reductions
Emissions Advantage
• Project design• Review, oversight
Economic Analysis Forum
• Analysis of air quality benefits
Air Quality Modeling Forum
• Baseline emissions
Emissions Forum
• Further analysis
Mobile Sources Forum

Areas Included in Test Application

Strategy Definition
• Address existing off-road mobile source emissions– Agricultural engines > 175 hp
– Construction engines > 75 hp
• Rely solely on today’s diesel oxidation catalysts– Proven technolgy, no O&M, no fuel requirements
– 35% PM reduction, 60% VOC and CO reduction
– $1,000 to $2,500 per vehicle
• Apply statewide, except tribes
• Will include spillover effects to tribes

Strategy Definition
• Two alternative scenarios– Mandatory
In effect by 2010
80% compliance
128,000 engines comprising 62% of emissions
– Incentive
Implemented over 8-year period (2010-17)
Grants of $1 million per state per year

Annual Emission Reductions
Arizona Montana North Dakota
Mandatory Strategy
PM Reduction (tons/yr) 290 290 650 % of Baseline* 25% 20% 21%
VOC Reduction (tons/yr) 550 460 1,020 % of Baseline* 44% 36% 37%
CO Reduction (tons/yr) 3,200 2,400 5,400 % of Baseline* 44% 33% 34%
Incentive Strategy
PM Reduction (tons/yr) 80 55 55 % of Baseline* 7% 4% 2%
VOC Reduction (tons/yr) 150 95 100 % of Baseline* 12% 7% 4%
CO Reduction (tons/yr) 970 560 580 % of Baseline* 13% 8% 4%
*Percent of projected 2010 baseline emissions from agricultural and construction engines.

Visibility Improvementsof the Mandatory Strategy(average for entire month of July)
Change in Deciviews
-0.150 to -0.117
-0.116 to -0.083
-0.082 to -0.049
-0.048 to -0.015
No change

Visibility Improvementsof the Mandatory Strategy
(average for entire month of February)Change in Deciviews
-0.150 to -0.117
-0.116 to -0.083
-0.082 to -0.049
-0.048 to -0.015
No change
Arizona Economic Benefits 2010-2019*(Mandatory Strategy)
*Net present value of benefits to in-state residents in millions of 2004 dollars. Substantial visibility benefits also accrue to residents outside of Arizona. Ranges reflect alternative discount rates from 2% to 7%.
Area
Metropolitan Region $4.9 - $7.9 $149 - $239
NW Region $0.9 - $1.5 $10 - $16
SE Region $0.2 - $0.4 $2 - $4
Arizona State Total $6.1 - $9.7 $161 - $259
Visibility Health
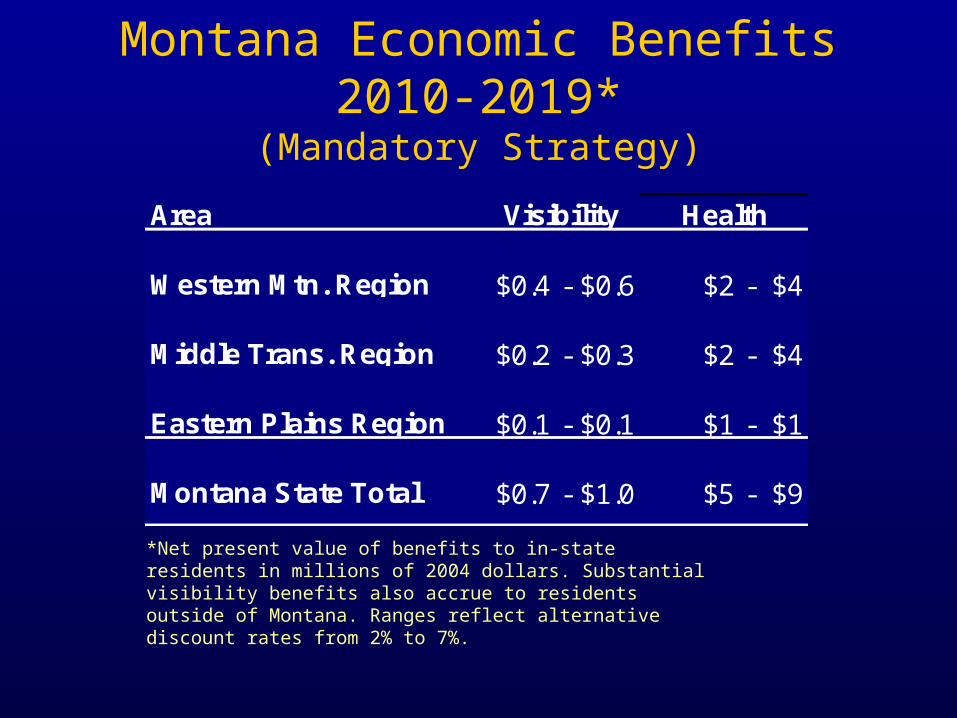
Montana Economic Benefits 2010-2019*(Mandatory Strategy)
*Net present value of benefits to in-state residents in millions of 2004 dollars. Substantial visibility benefits also accrue to residents outside of Montana. Ranges reflect alternative discount rates from 2% to 7%.
Area
Western Mtn. Region $0.4 - $0.6 $2 - $4
Middle Trans. Region $0.2 - $0.3 $2 - $4
Eastern Plains Region $0.1 - $0.1 $1 - $1
Montana State Total $0.7 - $1.0 $5 - $9
Visibility Health

North Dakota Economic Benefits 2010-2019*(Mandatory Strategy)
*Net present value of benefits to in-state residents in millions of 2004 dollars. Substantial visibility benefits also accrue to residents outside of North Dakota. Ranges reflect alternative discount rates from 2% to 7%.
Area
West Region $0.0 - $0.1 $1 - $1
East Region $0.2 - $0.3 $12 - $19
Central Region $0.2 - $0.4 $7 - $11
North Dakota Total $0.5 - $0.8 $20 - $31
Visibility Health

Compliance Costs for Arizona (excluding administration)
Estimated Costs by Program and Region in Arizona 2010 – 2019
Co
sts
($s
in M
illio
ns)
Private Sector100%
Who Bears Cost ofMandatory Program?
Public Sector89%
PrivateSector11%
Who Bears Cost ofIncentive Program?
$0
$5
$10
$15
$20
$25
$30
$35
$40
$45
$39.8
$7.7$8.9
$1.3 $1.2$0.2
Mandatory
Incentive
MetropolitanRegion
North & WestRegion
South & EastRegion
Construction87%
Agriculture13%
Cost Share by Industryfor Mandatory Program
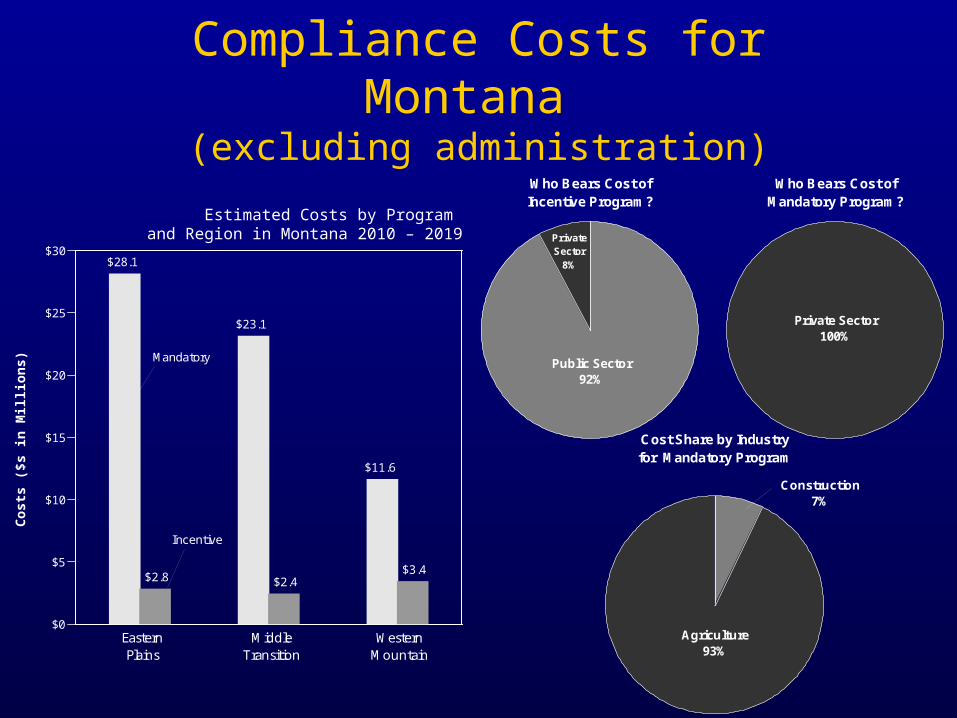
Compliance Costs for Montana (excluding administration)
Estimated Costs by Program and Region in Montana 2010 – 2019
Co
sts
($s
in M
illio
ns)
Construction7%
Agriculture93%
Cost Share by Industryfor Mandatory Program
Private Sector100%
Who Bears Cost ofMandatory Program?
Public Sector92%
PrivateSector
8%
Who Bears Cost ofIncentive Program?
$0
$5
$10
$15
$20
$25
$30$28.1
$2.8
$23.1
$2.4
$11.6
$3.4
Mandatory
Incentive
EasternPlains
MiddleTransition
WesternMountain

Compliance Costs for North Dakota(excluding administration)
Estimated Costs by Program and Region in North Dakota 2010 – 2019
Co
sts
($s
in M
illio
ns)
Private Sector100%
Who Bears Cost ofMandatory Program?
Public Sector92%
PrivateSector
8%
Who Bears Cost ofIncentive Program?
Construction4%
Agriculture96%
Cost Share by Industryfor Mandatory Program
$0
$10
$20
$30
$40
$50
$60
$70
$80
$90$84.0
$5.2
$41.0
$2.3
$18.4
$1.2
Mandatory
Incentive
CentralRegion
EastRegion
WestRegion

Arizona Annual Benefit-Cost Comparison 2010-2019 (Millions)*
*Excludes benefits accruing to residents outside of Arizona.
Benefit/Cost Mandatory Incentive
Visibility $1.2 $0.2$0.0Health $31.6 $5.8Total Benefits $32.8 $6.1
Cost $6.3 $0.9
Net Benefit $26.5 $5.2

Montana Annual Benefit-Cost Comparison 2010-2019 (Millions)*
*Excludes benefits accruing to residents outside of Montana.
Benefit/Cost Mandatory Incentive
Visibility $0.1 $0.02Health $1.1 $0.15Total Benefits $1.2 $0.17
Cost $8.0 $0.86
Net Benefit -$6.7 -$0.69
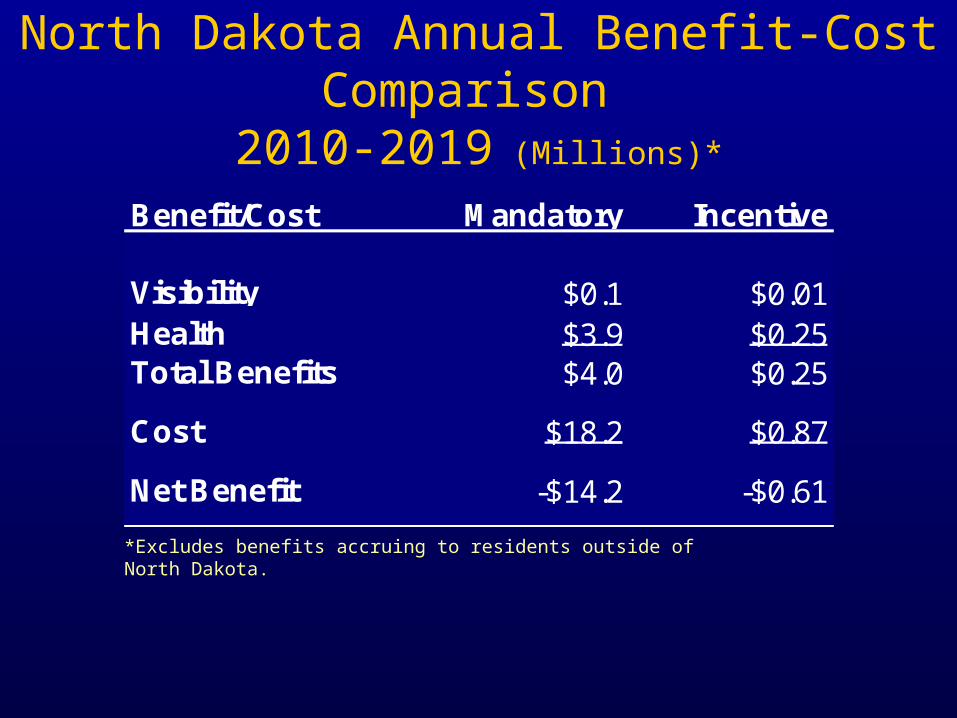
North Dakota Annual Benefit-Cost Comparison 2010-2019 (Millions)*
*Excludes benefits accruing to residents outside of North Dakota.
Benefit/Cost Mandatory Incentive
Visibility $0.1 $0.01Health $3.9 $0.25Total Benefits $4.0 $0.25
Cost $18.2 $0.87
Net Benefit -$14.2 -$0.61

Mandatory Incentive
Public sector costs (annual) * $1 M
Construction sector cost (annual) $5-$6 M $0.1 M
Increased cost of services < 0.01% *
Reduced net income 0.01% - 0.02% *
Total job loss 40 – 120 *
Agriculture sector costs (annual) <$1 M *
Increased cost of product < 0.01% *
Reduced net income 0.01% - 0.02% *
Total job loss <5 *
Arizona Economic Impacts/Distributional Implications(Mandatory Strategy)
* No significant impacts
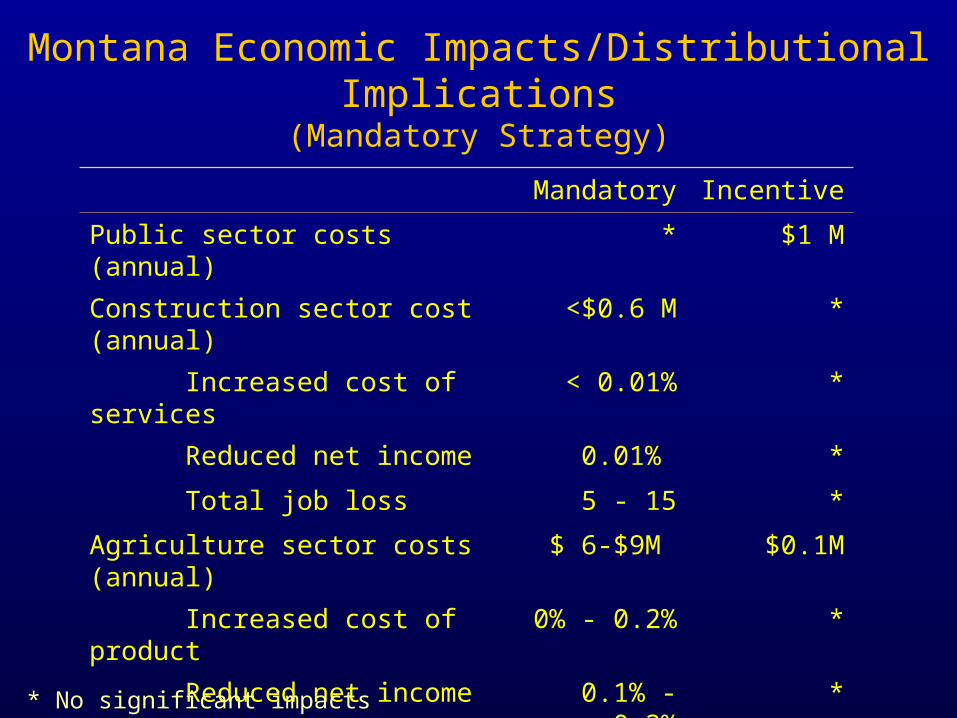
Mandatory Incentive
Public sector costs (annual) * $1 M
Construction sector cost (annual) <$0.6 M *
Increased cost of services < 0.01% *
Reduced net income 0.01% *
Total job loss 5 - 15 *
Agriculture sector costs (annual) $ 6-$9M $0.1M
Increased cost of product 0% - 0.2% *
Reduced net income 0.1% - 0.3% *
Total job loss 20 – 65 *
Montana Economic Impacts/Distributional Implications(Mandatory Strategy)
* No significant impacts

Mandatory Incentive
Public sector costs (annual) * $1 M
Construction sector cost (annual) <$0.9 M *
Increased cost of services < 0.02% *
Reduced net income 0.01% - 0.03% *
Total job loss 6 - 16 *
Agriculture sector costs (annual) $15-$20 M $0.1M
Increased cost of services 0% - 0.2% *
Reduced net income 0.1% - 0.4% *
Total job loss 30 –95 *
North Dakota Economic Impacts/Distributional Implications(Mandatory Strategy)
* No significant impacts

Why Do the Results Differ So Much Among the States?
• Large population in Arizona = bigger benefits
• Little air quality change in Montana
• Large agricultural sectors in Montana and North Dakota = higher costs
• Annual benefit per resident: AZ=$5 MT=$1 ND=$6
• Annual cost per resident: AZ=$1 MT=$8 ND=$27

Potential Sources of Uncertainty in the Results
• Air quality modeling
• Concentration response functions (health benefits) and visibility willingness-to-pay estimates
• Market acceptance of incentive-based approach
• Market response to compliance costs
• Potential for technology cost reduction over time
Next Steps
• Revise based on state and tribal feedback
• Incorporate analysis of spillover effects to tribes (if possible)
• Produce final report
• Refine Framework document where appropriate