Embed Size (px)
Citation preview

Ecommerce Quarterly
EQ3 2014:Gone in 60 Minutes
3
a publication from
About the EQ . . . . . . . . . . . . . . . . . . . . . . . . . . . . . . . . . . . . . . . . . . . . . . . . 2
Gone in 60 Minutes . . . . . . . . . . . . . . . . . . . . . . . . . . . . . . . . . . . . . . . . . . 3
Minute 0 . . . . . . . . . . . . . . . . . . . . . . . . . . . . . . . . . . . . . . . . . . . . . 4
The First 15 . . . . . . . . . . . . . . . . . . . . . . . . . . . . . . . . . . . . . . . . . . . 5
The Middle 30 . . . . . . . . . . . . . . . . . . . . . . . . . . . . . . . . . . . . . . . . 6
The Final 15 . . . . . . . . . . . . . . . . . . . . . . . . . . . . . . . . . . . . . . . . . . . 7 Benchmarks . . . . . . . . . . . . . . . . . . . . . . . . . . . . . . . . . . . . . . . . . . . . . . . . . 8
About Monetate . . . . . . . . . . . . . . . . . . . . . . . . . . . . . . . . . . . . . . . . . . . . 20
EQ3 2014

About the EQAs ecommerce companies look for ways to increase customer
engagement and sales in a highly competitive online environment, they’re
faced with challenges centered on massive amounts of data. This big data
conundrum goes beyond the collection and storage of information about
customers and prospects.
Using a combination of historical and real-time data allows ecommerce
marketers to glean meaningful insights that result in more relevant
shopping experiences that drive loyal customers who share their
experiences with others. Ecommerce businesses that tackle big data head-
on focus their attention on different customer segments that continue to
be explored in every release of the Ecommerce Quarterly (EQ):
• Predefined: New versus returning; referring traffic sources; technographics; geography.
• Custom or Proprietary: Demographics; proximity to location.
• On-Site Behavior: Shopping cart activity; brand or category affinity.
• Behaviors Across the Web: Browsing and purchase patterns demonstrated on third-party websites.
The EQ also includes Takeaways, ideas and best practices used by leading
ecommerce websites, based on insights gained from the more than
seven billion online shopping sessions that contribute to the analysis and
benchmark reports found in every release.
EQ3 2014
a monetate publication | 2

Gone in 60 MinutesYou have 60 minutes to capture your website visitor’s attention.
Within that timeframe, nearly 75% of your customers will visit your site,
make a decision on what to buy, and complete the checkout process. If they
don’t, chances are, they’ll move on.
Regardless of the device a customer uses or the channel from which a
customer is referred, nearly 75% of all purchases will be made in that window.
And you’ll end up learning whether your customer acquisition and retention
costs were worth it.
Given the enormity of this statistic, we’re taking an in-depth look at that first
hour in this EQ: what happens when, how customers behave, and what you
should be doing to convert the most customers possible.
Some Highlights:• When measured by sheer volume, the most popular time for a purchase
to occur is between the fifth and eighth minutes of a customer’s session.
• When measured against time-specific traffic levels, more people are adding products to their cart in the final five minutes of that hour-long window.
• Relative to traffic, purchase activity peaks during minutes 35 through 50.
• From minute 61 forward, each key metric—product pageviews, add-to-cart rates, conversions—goes into a steady decline.
Though plenty of this data can be classified as simply “interesting,” it’s also
actionable. Knowing how much on-site time, exactly, it takes a customer to
convert opens up a whole playbook for improving their experience.
a monetate publication | 3
EQ3 2014

Minute 0Before your stopwatch hits one minute, you’ve lost more than 30% of your
website’s visitors.
That’s because, according to our latest EQ data, all bounces occur within
“Minute 0,” the first minute a customer is on your site. And it’s such a
predominate behavior, nothing else comes close. To put it in perspective,
hardly anyone—less than 5% of all visitors—has even added an item to
their cart yet.
Much of the ecommerce industry focuses its attention on conversion
rates (and for good reason), but bounce rate might be worth even more
obsessive focus. If you can improve your performance there, you up your
chances of having those visitors find what they’re looking for.
TAKEAWAYMessage-to-Site Consistency
Your inbound marketing channels are huge parts of your business. Don’t leave those visitors who come to your site through these channels guessing where to turn next. Message-to-site consistency means using the same messages and products that got someone to click your CPC ad or email CTA on your website.
What Shoppers are Doing:
Product Discovery: 77.00%Product Detail Page: 18.89%Item in Cart: 4.10%Purchase Made: 0.01%
EQ3 2014
a monetate publication | 4

The First 15Though getting a visitor to “stick around” is one sure-fire way to increase
the possibility that you’ll be selling more goods, the truth is that most
shoppers who will convert on your site are laser-focused: Nearly 52% of all
purchases are made in the first 15 minutes of a shopping session—and, of
those, a majority occur between the fifth and eighth minutes.
Little, if anything, should be done to interfere with those customers who
have strong intents to buy. But much can be done to spur along your
remaining visitors—many of whom have yet to make it to a product detail
page, much less add an item to their cart or make a purchase.
Weighing where customers are during this 15-minute period against the
remaining hour, it’s clear that it takes those less-focused shoppers awhile
to figure out what they want and whether they actually want to buy it.
What Shoppers are Doing:
Product Discovery: 65.56%Product Detail Page: 26.53%Item in Cart: 7.69%Purchase Made: .22%
TAKEAWAYProduct Badging
Highlighting products, with a visual moniker, based on a particular attribute, like “New” or “Customer Favorite” can help your visitors distinguish between a wide variety of similar products. Helping your customers focus on a particular product or group of products will make them more likely to click and move on to a product detail page.
a monetate publication | 5
EQ3 2014

The Middle 30The 30 minutes in the middle of the hour-long window show one thing
clearly: a dwindling number of visitors.
In other words, by the time minute 16 in a session has rolled around, one
of three things has occurred: your visitor left your site, your visitor made a
purchase, or your visitor is a dedicated browser.
The bad news is that the first of those three is the most frequent. The
good news is that those who are left at the 30-minute mark convert into
customers at a higher rate.
Interestingly, more visitors are purchasing relative to the general visitor
population during this timeframe than at any other time window.
TAKEAWAYRetargeting & Email Marketing
You don’t want to rush to offer your abandoned-cart shoppers sales codes, but you do want to remind them to complete their purchase. Use retargeting tactics, such as display ads and triggered emails, to drive those individuals back to the site. If you dive into your site analytics, you’ll know how many days you have to make an impact this way. And you can always experiment with alternate values—free shipping, free returns, loyalty club points—to see what resonates with your close-to-converted customers.
What Shoppers are Doing:
Product Discovery: 61.71%Product Detail Page: 27.75%Item in Cart: 9.91%Purchase Made: .62%
(Minutes 16-30)
Product Discovery: 61.40%Product Detail Page: 27.64%Item in Cart: 10.31%Purchase Made: .66%
(Minutes 31-45)
EQ3 2014
a monetate publication | 6

The Final 15For the first five minutes of this quarter hour, customers are still converting
at that high rate we highlighted in the middle 30 minute section. After that,
though, the numbers start to decline.
And this time, there’s no turnaround.
Toward the end of the first hour of a shopper’s session with an ecommerce
site, motivation to buy begins to wane. Consider: From minute 61 through
minute 180 (a full, two-hour stretch), ecommerce companies earn just 14%
of their customers. And given the amount of time spent on the site, they’re
likely spending a lot of time, effort and money to attract those conversions.
At the 45-minute mark, by contrast, 68% of all purchases have been made.
Meanwhile, minutes 46 through 60 deliver another 6% of all converting
shoppers. It’s the final bulk before shopping tapers off.
What’s Happening:
Product Discovery: 61.18%Product Detail Page: 27.65%Item in Cart: 10.52%Purchase Made: .65%
TAKEAWAYCheckout Page Optimization
Because conversion performance continues to fall off after the 60-minute mark, you’ll want to plug holes on your checkout page. The key, of course, is keeping your visitor focused on the task at hand. That might mean hiding navigation bars, removing product recommendations and social sharing buttons, adding a thumbnail of the products being purchased… really, it could be any number of tactics. And you’ll always be tweaking to find the perfect combination.
a monetate publication | 7
EQ3 2014

Benchmark Reports
Website Visits by Device Q3 2013 Q4 2013 Q1 2014 Q2 2014 Q3 2014
Traditional 74.29% 71.54% 70.00% 66.81% 65.43%
Tablet 15.12% 16.59% 17.65% 16.68% 16.97%
Smartphone 10.59% 11.87% 12.35% 16.51% 17.60%
Traditional 73.16% 70.66% 69.43% 66.90% 65.67%
Tablet 15.32% 16.89% 17.89% 17.04% 17.37%
Smartphone 11.52% 12.44% 12.66% 16.05% 16.96%
Traditional 67.08% 64.02% 54.82% 48.03% 47.33%
Tablet 25.32% 26.63% 27.12% 25.00% 24.88%
Smartphone 7.60% 9.30% 18.04% 26.95% 27.79%
US
GLO
BAL
GB
EQ3 2014
a monetate publication | 8

GLO
BAL
Website Visits by Platform Q3 2013 Q4 2013 Q1 2014 Q2 2014 Q3 2014
Android Phone 3.70% 4.44% 4.76% 6.42% 7.00%
Android Tablet 13.05% 15.29% 19.63% 18.66% 19.51%
Chrome OS 0.17% 0.24% 0.29% 0.31% 0.37%
Kindle Fire 0.19% .29.% 0.22% 0.11% 0.38%
Linux 1.28% 1.01% 1.23% 1.22% 1.50%
Macintosh 15.03% 14.37% 14.27% 13.42% 13.65%
Windows 58.74% 57.18% 55.79% 53.45% 51.59%
Windows Phone 0.13% 0.15% 0.18% 0.22% 0.23%
iPad 12.59% 13.48% 13.81% 13.05% 12.89%
iPhone 6.69% 7.22% 7.34% 9.80% 10.29%
a monetate publication | 9
EQ3 2014

Conversion Rates by Device Q3 2013 Q4 2013 Q1 2014 Q2 2014 Q3 2014
Traditional 2.56% 3.29% 2.79% 2.87% 2.78
Tablet 2.14% 2.78% 2.33% 2.51% 2.42%
Smartphone 0.91% 1.23% 1.15% 0.90% 0.80%
Traditional 2.84% 3.66% 3.09% 3.24% 3.10%
Tablet 2.34% 3.02% 2.54% 2.79% 2.67%
Smartphone 0.93% 1.30% 1.22% 1.02% 0.88%
Traditional 1.22% 1.74% 1.72% 1.74% 1.73%
Tablet 1.12% 1.69% 1.67% 1.64% 1.69%
Smartphone 0.95% 1.21% 1.19% 0.85% 0.90%
TABL
ETSO
URC
EG
BG
LOBA
L
Conversion Rates Q3 2013 Q4 2013 Q1 2014 Q2 2014 Q3 2014
Global 2.32% 2.96% 2.51% 2.48% 2.37%
US 2.54% 3.26% 2.75% 2.81% 2.65%
GB 1.17% 1.68% 1.61% 1.47% 1.49%
EQ3 2014
a monetate publication | 10
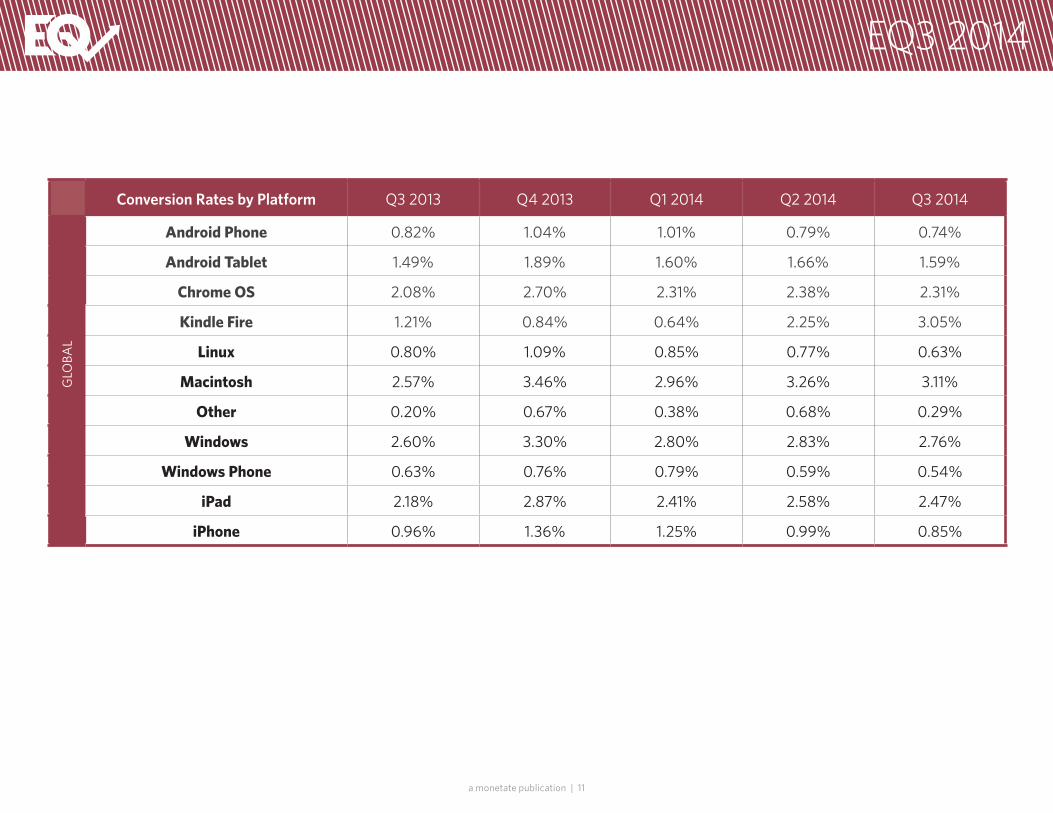
Conversion Rates by Platform Q3 2013 Q4 2013 Q1 2014 Q2 2014 Q3 2014
Android Phone 0.82% 1.04% 1.01% 0.79% 0.74%
Android Tablet 1.49% 1.89% 1.60% 1.66% 1.59%
Chrome OS 2.08% 2.70% 2.31% 2.38% 2.31%
Kindle Fire 1.21% 0.84% 0.64% 2.25% 3.05%
Linux 0.80% 1.09% 0.85% 0.77% 0.63%
Macintosh 2.57% 3.46% 2.96% 3.26% 3.11%
Other 0.20% 0.67% 0.38% 0.68% 0.29%
Windows 2.60% 3.30% 2.80% 2.83% 2.76%
Windows Phone 0.63% 0.76% 0.79% 0.59% 0.54%
iPad 2.18% 2.87% 2.41% 2.58% 2.47%
iPhone 0.96% 1.36% 1.25% 0.99% 0.85%
GLO
BAL
a monetate publication | 11
EQ3 2014

Add to Cart Rates by Device Q3 2013 Q4 2013 Q1 2014 Q2 2014 Q3 2014
Traditional 7.46% 9.19% 8.80% 8.67% 8.52%
Tablet 7.16% 8.96% 8.50% 8.70% 8.58%
Smartphone 5.14 6.40% 6.67% 5.38 4.70%
Traditional 7.96% 9.79% 9.43% 9.41% 9.16%
Tablet 7.47 9.35% 8.97% 9.23% 8.98%
Smartphone 5.13% 6.46% 6.81% 5.73% 4.75%
Traditional 4.45% 5.38% 4.98% 5.07% 5.61%
Tablet 5.12% 5.86% 5.21% 5.57% 6.91%
Smartphone 6.94% 7.42% 5.45% 4.20% 5.46%
OV
ERA
LL
Add to Cart Rates Q3 2013 Q4 2013 Q1 2014 Q2 2014 Q3 2014
Global 7.17% 8.82% 8.48% 8.13% 7.86%
US 7.56% 9.30% 9.02% 8.79% 8.38%
GB 4.81% 5.70% 5.13% 4.96% 5.89%
US
GLO
BAL
GB
EQ3 2014
a monetate publication | 12

Add to Cart Rates by Platform Q3 2013 Q4 2013 Q1 2014 Q2 2014 Q3 2014
Android Phone 4.81% 5.78% 6.04% 4.91% 4.43%
Android Tablet 5.16% 6.75% 6.54% 6.43% 6.30%
Chrome OS 7.12% 9.18% 9.23% 8.66% 8.91%
Kindle Fire 5.03% 4.24% 3.89% 6.66% 8,64%
Linux 7.96% 6.37% 5.67% 4.94% 3.41%
Macintosh 7.85% 10.18% 9.82% 10.31% 10.11%
Other 0.77 3.03% 1.98% 2.81% 1.52%
Windows 7.35 8.98% 8.58% 8.33% 8.25%
Windows Phone 3.27% 4.18% 4.52% 3.57% 3.65%
iPad 7.42% 9.39 8.95% 9.14% 8.99%
iPhone 5.36% 6.84% 7.16% 5.75% 4.94%
GLO
BAL
a monetate publication | 13
EQ3 2014

Average Page Views Q3 2013 Q4 2013 Q1 2014 Q2 2014 Q3 2014
Global 8.75 8.66 8.48 8.64 8.75
US 8.72 8.62 8.5 8.83 8.97
GB 8.25 7.27 6.86 6.75 6.6
Average Page Views by Device Q3 2013 Q4 2013 Q1 2014 Q2 2014 Q3 2014
Traditional 9.27 9.3 9.06 9.44 9.57
Tablet 8.87 8.64 8.65 9.26 9.66
Smartphone 4.89 4.77 4.96 4.79 4.9
Traditional 9.29 9.3 9.1 9.65 9.78
Tablet 8.76 8.58 8.63 9.31 9.76
Smartphone 4.97 4.81 5.01 4.86 4.99
Traditional 8.49 7.66 7.33 7.44 7.24
Tablet 9.16 7.84 7.61 8.02 7.92
Smartphone 3.01 2.98 4.28 4.3 4.32
US
GLO
BAL
GB
EQ3 2014
a monetate publication | 14

Average Page Views by Platform Q3 2013 Q4 2013 Q1 2014 Q2 2014 Q3 2014
Android Phone 5.6 5.31 5.54 5.17 5.36
Android Tablet 8.5 8.39 8.39 8.74 9.12
Chrome OS 9.45 10.55 9.81 10.18 10.55
Kindle Fire 7.14 4.97 4.75 7.97 11.32
Linux 4.93 5.79 5.05 5.23 5.74
Macintosh 9.13 9.41 9.36 10.12 10.22
Other 2.04 4.54 3.55 3.67 3.48
Windows 9.4 9.34 9.07 9.37 9.51
Windows Phone 5.63 5.49 5.61 5.23 5.23
iPad 8.94 8.71 8.72 9.32 9.68
iPhone 4.49 4.44 4.59 4.54 4.59
GLO
BAL
a monetate publication | 15
EQ3 2014

Average Order Value by Traffic Source Q3 2013 Q4 2013 Q1 2014 Q2 2014 Q3 2014
Advertising $123.62 $125.58 $120.36 $126.20 $121.07
Affiliate Sites $119.11 $116.12 $114.82 $131.56 $122.57
Search $127.05 $133.41 $125.48 $129.64 $125.12
Social $102.30 $118.59 $117.47 $120.27 $119.67
Email $103.37 $114.49 $105.27 $118.20 $113.73
Average Order Value by Device Q3 2013 Q4 2013 Q1 2014 Q2 2014 Q3 2014
Traditional $135.34 $143.06 $135.91 $140.80 $135.17
Tablet $127.58 $140.88 $127.16 $131.50 $121.30
Smartphone $107.93 $122.10 $113.09 $113.75 $100.27
iPad $127.87 $142.11 $127.81 $133.14 $123.29
Kindle Fire $90.07 $105.53 $94.17 $84.49 $77.27
Android $111.91 $122.20 $107.52 $104.76 $97.97
iPhone $108.61 $123.42 $115.58 $116.85 $101.99
Android $106.82 $97.73 $108.76 $108.33 $119.65
Windows $120.02 $145.80 $84.49 $122.20 $108.61
TABL
ETG
LOBA
LSO
URC
ESM
ART
PHO
NE
EQ3 2014
a monetate publication | 16

Average Order Value by Platform Q3 2013 Q4 2013 Q1 2014 Q2 2014 Q3 2014
Android Phone $106.82 $97.73 $108.76 $108.33 $119.65
Android Tablet $111.91 $122.20 $107.52 $104.76 $97.97
Chrome OS $125.26 $127.45 $120.71 $122.63 $119.72
Kindle Fire $90.07 $105.53 $94.17 $84.49 $77.27
Linux $143.93 $137.55 $132.99 $145.65 $141.04
Macintosh $149.07 $159.91 $150.40 $158.42 $152.32
Other $154.42 $133.06 $123.41 $116.75 $128.30
Windows $132.02 $138.85 $132.09 $135.91 $130.34
Windows Phone $120.02 $145.80 $84.49 $122.20 $108.61
iPad $127.87 $142.11 $127.81 $133.14 $123.29
iPhone $108.61 $123.42 $115.58 $116.85 $101.99
GLO
BAL
a monetate publication | 17
EQ3 2014

Browser Market Share Q3 2013 Q4 2013 Q1 2014 Q2 2014 Q3 2014
Internet Explorer 29.51% 28.54% 27.49% 25.37% 22.89%
Chrome 24.98% 25.84% 26.94% 28.64% 31.19%
Firefox 12.53% 11.61% 11.50% 10.99% 10.98%
Safari 31.02% 32.18% 32.52% 33.13% 32.90%
GLO
BAL
US
UK
EQ3 2014
a monetate publication | 18

Average Order Value by US State Q3 2014
Armed Forces - America $137.15
Armed Forces - Europe $172.08
Alaska $150.18
Alabama $122.82
Armed Forces - Pacific $174.04
Arkansas $124.07
Arizona $129.49
California $140.23
Colorado $138.17
Connecticut $131.04
District of Columbia $147.18
Delaware $150.12
Florida $132.59
Georgia $132.24
Hawaii $142.65
Iowa $124.99
Idaho $136.10
Illinois $129.92
Indiana $120.44
Kansas $121.87
Kentucky $121.07
Louisiana $123.32
Massachusetts $135.80
Maryland $128.64
Maine $118.50
Michigan $124.31
Minnesota $142.25
Average Order Value by US State Q3 2014
Missouri $123.49
Mississippi $124.04
Montana $133.76
North Carolina $123.61
North Dakota $138.82
Nebraska $124.80
New Hampshire $132.44
New Jersey $129.96
New Mexico $129.51
Nevada $135.80
New York $142.79
Ohio $120.98
Oklahoma $128.96
Oregon $141.72
Pennsylvania $112.80
Rhode Island $122.89
South Carolina $124.00
South Dakota $127.73
Tennessee $121.41
Texas $136.32
Utah $143.67
Virginia $127.13
Vermont $127.02
Washington $136.19
Wisconsin $128.20
West Virginia $110.06
Wyoming $130.40
a monetate publication | 19
EQ3 2014

About MonetateMonetate is the global leader in cloud-based testing, email optimization
and in-the-moment personalization software that empowers marketers to
create, deliver and measure personalized marketing campaigns across all
touchpoints—at scale.
Customers use Monetate’s solutions to identify important customer
segments, target them with dynamic digital marketing campaigns, and
measure the results of those campaigns—in real time within a single easy-
to-use interface.
Monetate is used by the world’s leading brands to grow revenue faster
by delivering better digital experiences for their customers around the
globe. Founded in 2008, Monetate influences billions of dollars in revenue
every year for world-class companies like Patagonia, Best Buy, National
Geographic, QVC, Celebrity Cruises, and hundreds of other market leaders.
EQ3 2014
a monetate publication | 20

For all media inquiries, questions, and feedback regarding the information in this report, or to obtain copies of previous releases of the EQ, contact:
Matt Helmke Sr. Director of Branding & Buzz
(215) 987-4441 [email protected]
a monetate publication | 21
EQ3 2014

Expert Optimization ResourcesValuable case studies, eBooks, white papers, webinars & infographics
monetate.com/resources
Request a DemoCall 877-MONETATE (US) | +44 207 099 2101 (EMEA) | 484-323-6313 (everywhere else)
demo.monetate.com
©2014 Monetate Inc. All Rights Reserved
US Sales & ServiceCall 877-MONETATE (US)
EMEA Sales & Service+44 207 099 2101
monetate.com monetate.com/twitter monetate.com/linkedinmonetate.com/facebook