Embed Size (px)
Citation preview

Ecological Context of Climate Impacts on Fire:
Wildland Fire Area Burned in the Western U.S. 1916-2003
Jeremy Littell
with Don McKenzie and Dave Peterson

“Actually, the Forest Service where I work has sort of changed its mind about forest fires, and so I don’t say, ‘Only you can prevent forest fires’ anymore.”
“We’re more of a faith-based Forest Service now. So we feel that if there is a forest fire, maybe there was supposed to be one. Maybe we should pray for it to stop. It’s not up to us to play fire fighter.”
-Smokey the Bear, Prairie home Companion, 16 April 2005
95-97% of the area burned is burned by 3-5% of the fires, right?

Context: 20th Century Area Burned
• Wildland-fire area burned: policy and resource management metric
• WFAB ecologically imperfect
• Are there useful, ecologically interesting relationships between climate and this data?
Total Wildfire Area Burned 1916-2002USFS, NPS, BLM, BIA Lands
1920 1930 1940 1950 1960 1970 1980 1990 20000
1x10⁶
2x10⁶
3x10⁶
4x10⁶
5x10⁶
WA, OR, ID Wildfire Area Burned 1916-2002USFS, NPS, BLM, BIA Lands
1920 1930 1940 1950 1960 1970 1980 1990 20000
500x103
1x10⁶
2x10⁶
2x10⁶
3x10⁶
3x10⁶
Data compiled from multiple sources (NIFMID)

20th C. Fire and Climate in the West
McKenzie et al. 2004. Conservation Biology
Mechanism response
Westerling et al. 2003. BAMS.
Statistical prediction

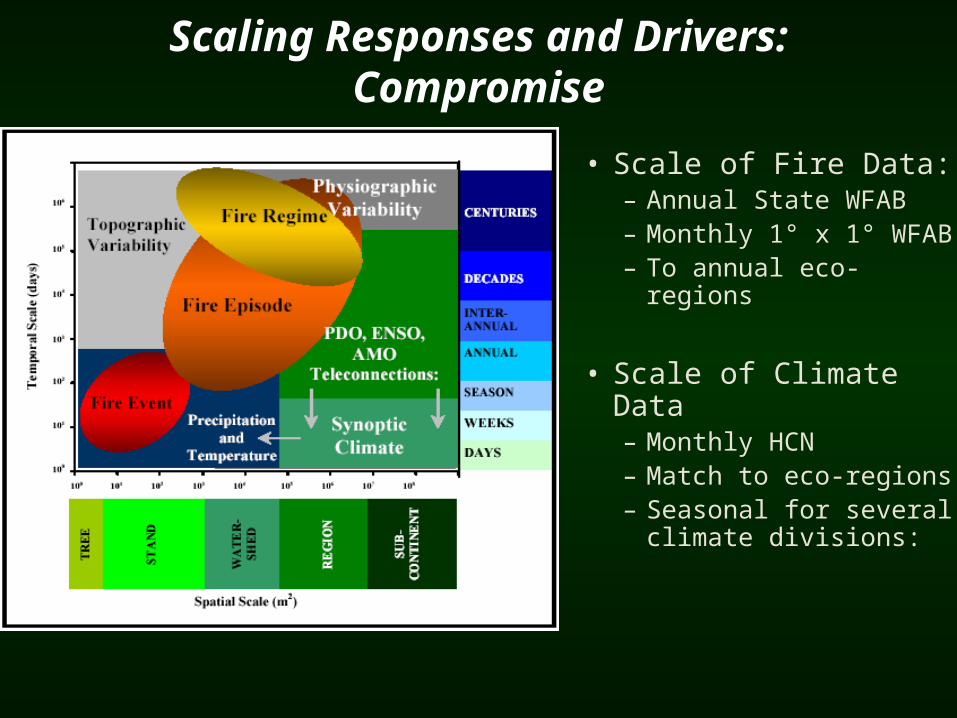
Scaling Responses and Drivers: Compromise
• Scale of Fire Data:– Annual State WFAB– Monthly 1° x 1°
WFAB– To annual eco-regions
• Scale of Climate Data– Monthly HCN– Match to eco-regions– Seasonal for several
climate divisions:

Objective: Ecologically-specific, Meso-scale Fire
Climatology• Goal: Develop ecosystem-specific diagnostic
climate-fire relationships for western U.S.
• Strategy: Reconstruct wildland fire area burned for as many western U.S. eco-provinces as possible.
• Method: Evaluate climate-fire relationships for reconstructed area-burned by eco-province.

Eco-provinces
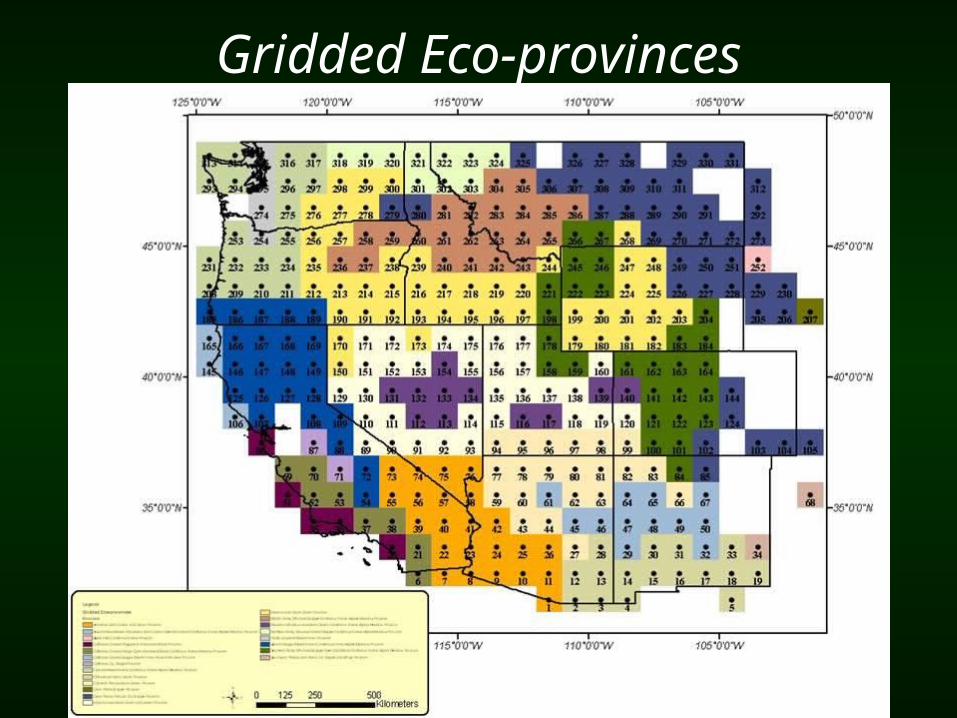
Gridded Eco-provinces

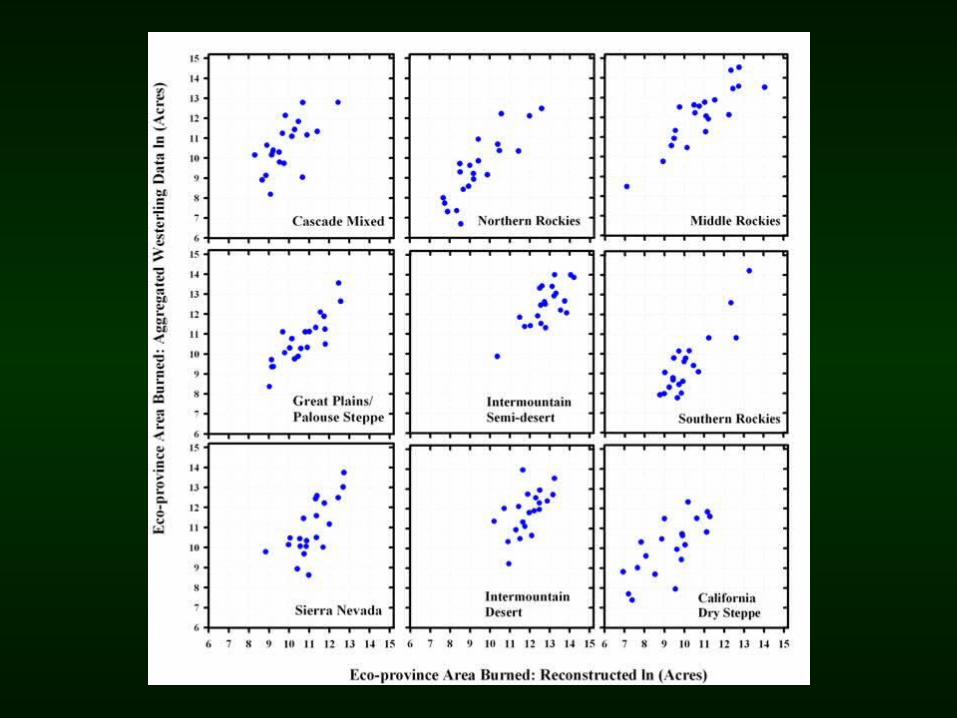
Reconstructing Eco-province Area Burned from State and
Grid Data• Scale fire datasets to compatible spatial and
temporal resolution.
• Logarithmic regression models, training period is 1980-2000:
Log (Cascade Mixed (gridcells))= log (WA + OR)
• Use modeled relationship to hind-cast Cascade Mixed for full 1916-2003 dataset.


Seasonal Climate: Aggregated HCN Climate
Divisions• Temperature, Precipitation,
PDSI– Annual
– Winter (ONDJFM)
– “Growing Season”: (AMJJAS)
– Summer: (JJAS)
• PCA Aggregation
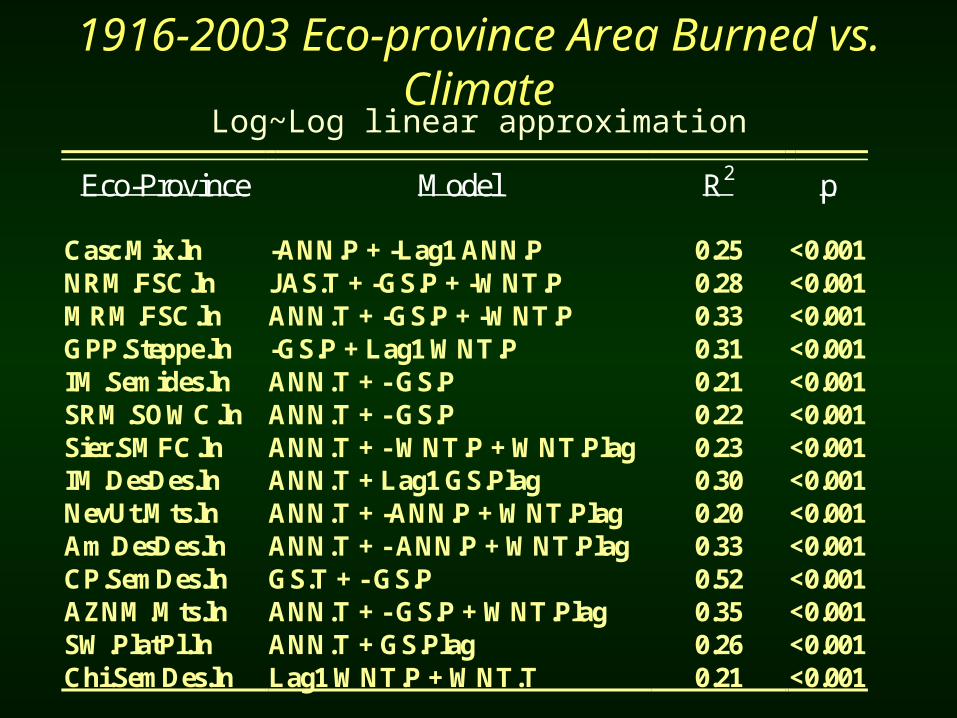
1916-2003 Eco-province Area Burned vs. Climate
Eco-Province Model R2 p Casc.Mix.ln -ANN.P + -Lag1 ANN.P 0.25 <0.001 NRM.FSC.ln JAS.T + -GS.P + -WNT.P 0.28 <0.001 MRM.FSC.ln ANN.T + -GS.P + -WNT.P 0.33 <0.001 GPP.Steppe.ln -GS.P + Lag1 WNT.P 0.31 <0.001 IM.Semides.ln ANN.T + - GS.P 0.21 <0.001 SRM.SOWC.ln ANN.T + - GS.P 0.22 <0.001 Sier.SMFC.ln ANN.T + - WNT.P + WNT.Plag 0.23 <0.001 IM.DesDes.ln ANN.T + Lag1 GS.Plag 0.30 <0.001 NevUt.Mts.ln ANN.T + -ANN.P + WNT.Plag 0.20 <0.001 Am.DesDes.ln ANN.T + - ANN.P + WNT.Plag 0.33 <0.001 CP.SemDes.ln GS.T + - GS.P 0.52 <0.001 AZNM.Mts.ln ANN.T + - GS.P + WNT.Plag 0.35 <0.001 SW.PlatPl.ln ANN.T + GS.Plag 0.26 <0.001 Chi.SemDes.ln Lag1 WNT.P + WNT.T 0.21 <0.001
Log~Log linear approximation

Log Models Produce Unacceptable Errors
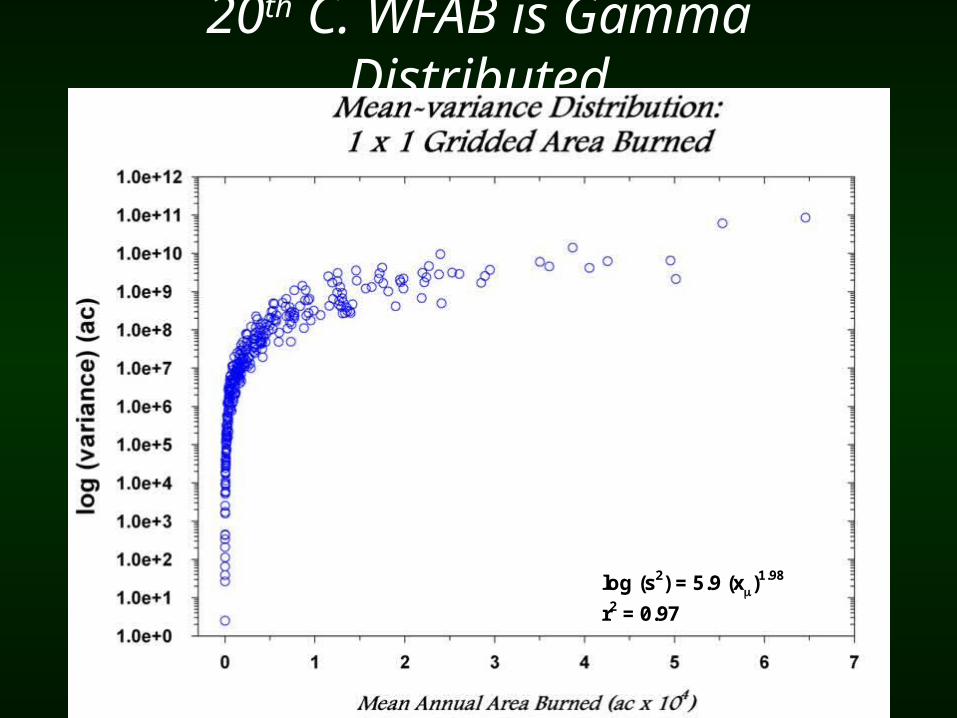
20th C. WFAB is Gamma Distributed
log (s2) = 5.9 (x)1.98
r2 = 0.97

State Data is Gamma Distributed

Aggregated Eco-provinces Retain Similar Distribution
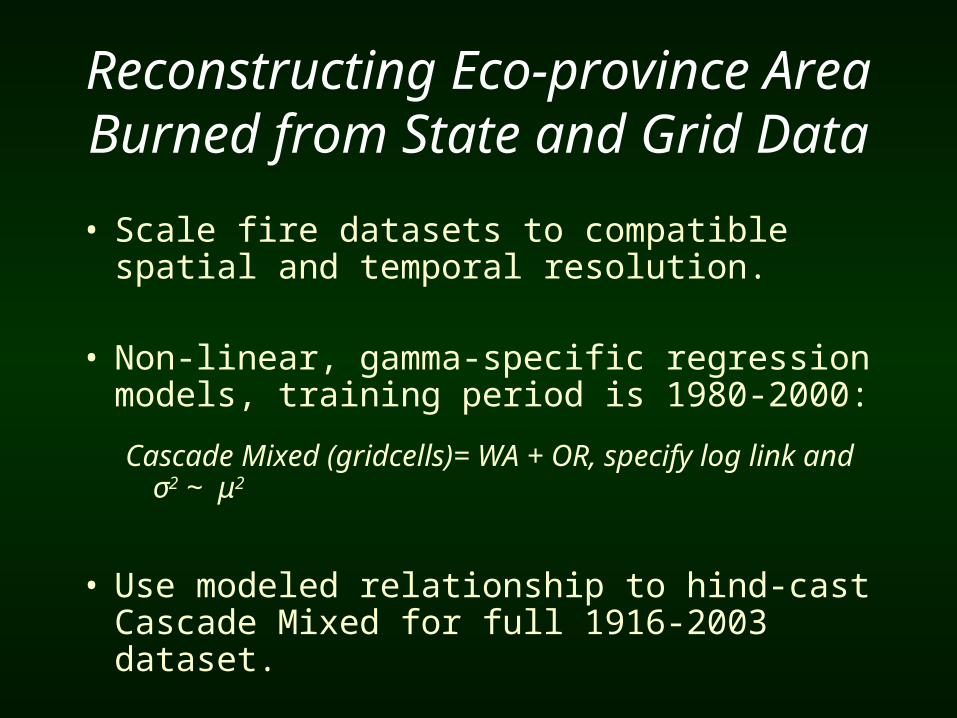
Reconstructing Eco-province Area Burned from State and
Grid Data• Scale fire datasets to compatible spatial and
temporal resolution.
• Non-linear, gamma-specific regression models, training period is 1980-2000:
Cascade Mixed (gridcells)= WA + OR, specify log link and σ2 ~ μ2
• Use modeled relationship to hind-cast Cascade Mixed for full 1916-2003 dataset.


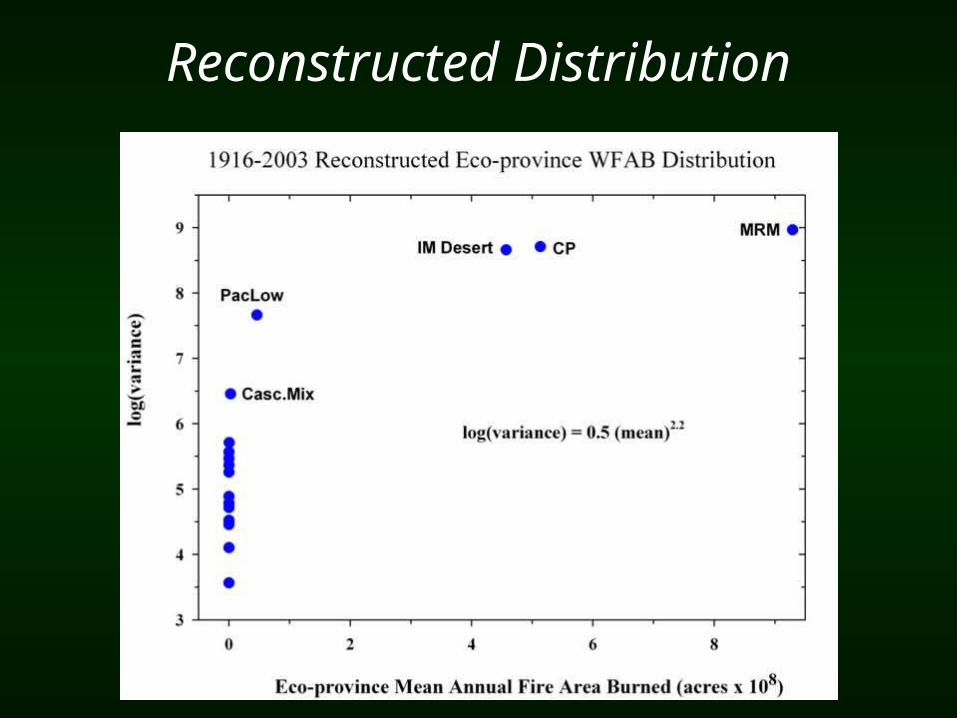
Reconstructed Distribution

Reconstruction Diagnostics
Eco-Province r
American Desert and Semi Desert 0.72Arizona / New Mexico Mts. 0.63California Dry Steppe 0.77California Coastal Chaparral 0.21California Coastal Woodland 0.51Cascade Mixed Forest 0.76Chihuahuan Semi Desert 0.80Colorado Plateau Semi Desert 0.81Great Plains / Palouse Steppe 0.76Intermountain Desert 0.70Intermountain Semi Desert 0.76Middle Rocky Mountains 0.78Nevada / Utah Mountains 0.78Northern Rocky Mountains 0.78Pacific Lowland 0.51Sierran Mixed forest 0.72Southern Rocky Mountains 0.90Southwestern Plateau 0.63
Mean 0.70

Observed vs. Predicted WFAB

Eco-province log model R^2
gamma model approx. R^2
American Desert and Semi Desert 0.36 0.58
Arizona / New Mexico Mts. 0.49 0.37
California Dry Steppe 0.41 0.69
California Coastal Chaparral poor none
California Coastal Woodland 0.33 0.30
Cascade Mixed Forest 0.58 0.65
Chihuahuan Semi Desert 0.70 0.65
Colorado Plateau Semi Desert 0.70 0.61
Great Plains / Palouse Steppe 0.81 0.61
Intermountain Desert 0.41 0.54
Intermountain Semi Desert 0.78 0.53
Middle Rocky Mountains 0.69 0.62
Nevada / Utah Mountains none 0.38
Northern Rocky Mountains 0.40 0.67
Pacific Lowland 0.78 0.60
Sierran Mixed forest 0.53 0.51
Southern Rocky Mountains 0.71 0.91Southwestern Plateau 0.67 0.18
Mean 0.58 0.55
*
* 1-(residual deviance/null deviance)

1980-2000 Reconstructions vs. Climate
Province Model R2
Arizona New Mexico Mts. GS.T + - Lag1JAS.T 0.66 Cascade Mixed - JAS.PDSI + -Lag1JAS.T 0.33 Middle Rocky Mts. -GS.P 0.54 Nevada Utah Mts. -GS.P + Lag1WNT.PDSI 0.46 Northern Rocky Mts. -GS.P + WNT.T + Lag1GS.T 0.74 Sierra Mixed -GS.P + Lag1GS.PDSI 0.33 Southern Rocky Mts. -GS.P 0.46
Reconstructed Forest-Dominated Ecoprovince Fire Time Series vs. climate variables
Antecedent precipitation seems to be more important than temperature in forested systems during the model calibration period.

1916-2003 Reconstructions vs. Climate
Province Model R2
Arizona New Mexico Mts. GS.T + Lag1WNT.PDSI 0.29 Cascade Mixed -JAS.PDSI + -Lag1 ANN.P 0.39 Middle Rocky Mts. -ANN.PDSI + -Lag1 WNT.P 0.17 Nevada Utah Mts. -ANN.P 0.09 Northern Rocky Mts. -JAS.PDSI 0.26 Sierra Mixed -GS.P+-WNT.P 0.22 Southern Rocky Mts. -GS.PDSI 0.13
Reconstructed Forest-Dominated Ecoprovince Fire Time Series vs. climate variables

1980-2000 Reconstructions vs. Climate
Province Model R2 American Semidesert - GS.P + Lag1WNT.P 0.54 CA Dry Steppe - WNT.P + Lag1WNT.P 0.42 Chihuahuan Semidesert GS.T + -ANN.P+Lag1WNT.PDSI 0.55 Colorado Plateau ANN.T + - GS.P + Lag1WNT.PDSI 0.61 Great Plains/Palouse - JAS.P + Lag1WNT.T 0.59 Intermountain Desert -GS.P + -Lag1WNT.PDSI 0.70 Intermountain Semides -GS.P + - Lag1GS.T 0.61
Reconstructed Grassland/Shrubland/Desert Dominated Eco-province Fire Time Series vs. climate variables
As antecedent favor vegetation growth, fire area burned increases.This is consistent with fuel or fuel AND climate limited systems.

Province Model R2
American Semidesert ANN.T + Lag1 WNT.P 0.19 CA Dry Steppe ANN.T + -WNT.P + Lag1 JAS.PDSI 0.23 Chihuahuan Semidesert ANN.T + Lag1 WNT.P 0.28 Colorado Plateau GS.T + Lag1GS.T 0.21 Great Plains/Palouse -GS.P + GS.T+ Lag1 WNT.T 0.28 Intermountain Desert GS.T + -JAS.PDSI 0.19 Intermountain Semi-desert -GS.P 0.18
Reconstructed Grassland/Shrubland/Desert Dominated Eco-province Fire Time Series vs. climate variables
1916-2003 Reconstructions vs. Climate

Caveats
• Is the state-level data correctly normalized for reporting area in the early 20th century?
• Is the proportion of area burned attributable to climate (vs. land use, vegetation dynamics, or fire exclusion) reasonably stationary?

Summary
• Eco-province wildland fire area burned is strongly influenced by climate between 1980 and 2000.
• Reconstructions of 1916-2003 eco-province area burned indicate that similar but weaker relationships occur for the entire period.
• Climate has exerted a detectable influence on 20th century wildland fire regardless of other influences.
Conclusion
• Climate fire impacts are ecologically-dependent, and vary because of combined influences of seasonality, ecosystem vegetation, and climate regime.
• Meso-scale, mechanism response approaches are useful in evaluating these relationships.

Prospectus
• Cross-validation to improve confidence about uncertainty.
• Investigation of ocean/atmosphere controls on climate “supply” in extreme fire years.
• Attribution of unexplained residual deviance in eco-province/climate models
• Future extrapolation given future climate scenarios and constraints of eco-provinces

Acknowledgements• Tony Westerling and Tom Swetnam