Embed Size (px)
Citation preview

1
Ecological and public perception economic valuations of different coastal sand dune states and
their impact on nature conservation decisions
Nir Becker
Department of Economics and management
Tel-Hai College
Upper Galilee 12210, Israel
E-mail: nbecker@telhaiacil
Pua Bar and Meira Segev
Department of Geography and Environmental Development
University of Ben-Gurion
Beer-Sheva 84115, Israel

2
Ecological and public perception economic valuations of different coastal sand dune states and
their impact on nature conservation decisions
Abstract
Mobile coastal dunes are of significant ecological importance both globally and at the local scale.
However, a large portion of these dunes are disappearing due to encroachment of local shrubs and
exotic plants, resulting in changes of floristic and faunal composition, and an overall decrease in
biodiversity of coastal systems. Active management is therefore required to maintain mobile dune
presence.
This study focuses on economic valuation of coastal dunes in Israel, based on public and professional
ecological perspectives. This comparison allows reflection on the suitability of a Contingent Valuation
Method (CVM) to assess ecological restoration and conservation projects. The CVM was applied in
Nizzanim LTER nature reserve in Israel, and concurrently, data of plant species composition on
stabilized and mobile dunes were used to calculate the Ecological Value Index (EVI) of the different
dune states. These two values were then compared and used to estimate the expected change in
economic value resulting from a state shift from mobile to stabilized dunes.
According to the CVM the total value of the Nizzanim coastal dunes would drop from 344 to 197
million Israeli Shekels (NIS) (1 Shekel = $0.39) if active management does not take place; a reduction
of 42% in value. However, results from the EVI only indicate a 33% decrease in ecological value (in
monetary terms) in the absence of active management. We suggest that in this case general public
perception is strong enough to justify conservation decisions, although they are not professional
ecologists. However, we still recommend the use of both measures for land use decision making.
JEL Code: Q5.
Key Words: Economic Valuation, Ecological Value, Contingent Valuation Method, Dune
stabilization, Conservation, Management

3
Introduction
Land use changes are a pressing conservation issue. Understanding the causes and consequences of
these changes requires complex spatial and temporal models (Foley et al. 2005). Researchers are often
interested in explaining the causal relationships between individual choices and outcomes of land use
change, highlighting a need to integrate social and natural sciences in order to establish eco-social
economic models (Spurgeoon 1998, Irwin and Geoghegan 2001).
Some authors argue that ecosystems and their biodiversity cannot, or should not be valued in monetary
terms (e.g. Spash et al. 2005). However, it can also be argued that every decision involves value
judgment, and providing an estimate of the value of the contribution made by ecosystems allows
decisions to be made more rationally than by assigning a zero value, which is often implied when no
value is given. After all, “we cannot avoid the valuation issue because as long as we are forced to make
choices, we are doing valuation” (Costanza and Folke 1997, p50). Furthermore, avoiding explicit
valuation of ecosystems and biodiversity is not an option in the face of rapid global environmental
changes and ecosystem degradation and loss.
The situation becomes more complex when there is a difference in the way an ordinary citizen sees
land use changes compared to a professional ecologist, since the former viewpoint is biased more
towards landscape texture and charismatic flora and fauna, while the latter mainly values ecological
function or importance. It is our intention in this paper to test the divergence in public and professional
opinions regarding the value of coastal landscapes, in order to inform decision making processes for
management of a coastal dune reserve.
Coastal areas in general and sand dunes in particular, are considered to be land types with the highest
levels of development and human impact (Drees 1997; Holdgate 1993; van der Meulen and Salman
1996). In Europe alone, a net loss of 25% of coastal dunes has been reported since 1900 and some 55%
of the remaining coastal dune area has lost its natural character (Delbaere 1998). It has been estimated
that roughly 85% of the present area is under threat (European Environmental Agency 1999).
The situation regarding coastal sand dunes in Israel is not different from other regions. Approximately
70% of Israel's population resides within a 1-3km strip along the 190 km Mediterranean coast line.
Consequently, coastal dunes that were previously maintained in a mobile state by traditional grazing
and cutting, are now either built up areas (approximately two thirds of the dune area) or are stabilizing
4
due to encroachment of local shrubs and invasion by species such as Acacia saligna (Tsoar and
Blumberg 2002; Kutiel et al. 2000; Kutiel 2001; Kutiel et al. 2004 and Levin and Ben-Dor 2004).
Despite limited coastal dune areas remaining, their ecological and conservation importance is
significant (Koniak et al. 2009; Kutiel 2001). The xeric conditions of the sand, together with the
continuous connection to the dunes of the Negev and northern Sinai desert, create unique assemblages
of desert and Mediterranean species within the region (Kutiel 2001; Kutiel et al. 2004). Twenty-six
percent of Israel’s endemic plant species are concentrated in this dune complex, the highest rate of
endemism in any habitat in the country. Likewise, 22 of the arthropod species found in Israel only
occur in coastal dunes (Bar (Kutiel) 2013). These species characterize different habitats within the dune
system, and some of them are of biogeographic importance.
Mobile coastal dunes are also important from a hydrological point of view because they are the main
sink for water supply that supports the aquifer and the coastal ecosystem as a whole. About 45% of the
annual rainfall is lost in stabilized dunes as a result of rain interception by the shrubs,
evapotranspiration and hydrophobic processes (unpublished data). In addition, more than a third of
Israel's irrigation water is wastewater that has been filtered in the coastal dunes as part of its tertiary
treatment (Silberman et al. 1992). Finally, mobile sand dunes are also a tourist attraction and are highly
desirable to visitors (e.g., Font 2000).
Complete stabilization of the dune complex would result in loss of these important mobile dunes, their
characteristic species assemblages, and corresponding ecological value. To conserve the heterogeneity
and overall biodiversity of the nature reserve, active management is needed in the form of perennial
vegetation removal from several stabilized and semi-stabilized dunes, to encourage the re-
establishment of psammophilic (sand-loving) species (Kutiel et al. 2000; Bar (Kutiel) 2013). This
active management is non-self sustaining and costly, thus to decide whether stabilized and/or mobile
dunes are preferable, we need to estimate the perceived costs and benefits of maintaining each dune
type. The current study tries to estimate the benefits of the two dune types by employing two
approaches: (1) A Contingent Valuation Method (CVM) study of the preferred landscape management
based on public perception and only a general background in ecology, and (2) Attaching values using
an Ecological Value Index (EVI) based on professional knowledge and data gathered from the studied
site.

5
Contrary to more conventional case studies that evaluate a non-market good (landscape), we use two
valuation approaches to compare the value given by a representative sample of the general population,
and the one derived by a more professional ecological assessment. This is important especially in order
to understand if the two values are similar in size and if not, what the magnitude of difference and to
which direction is.
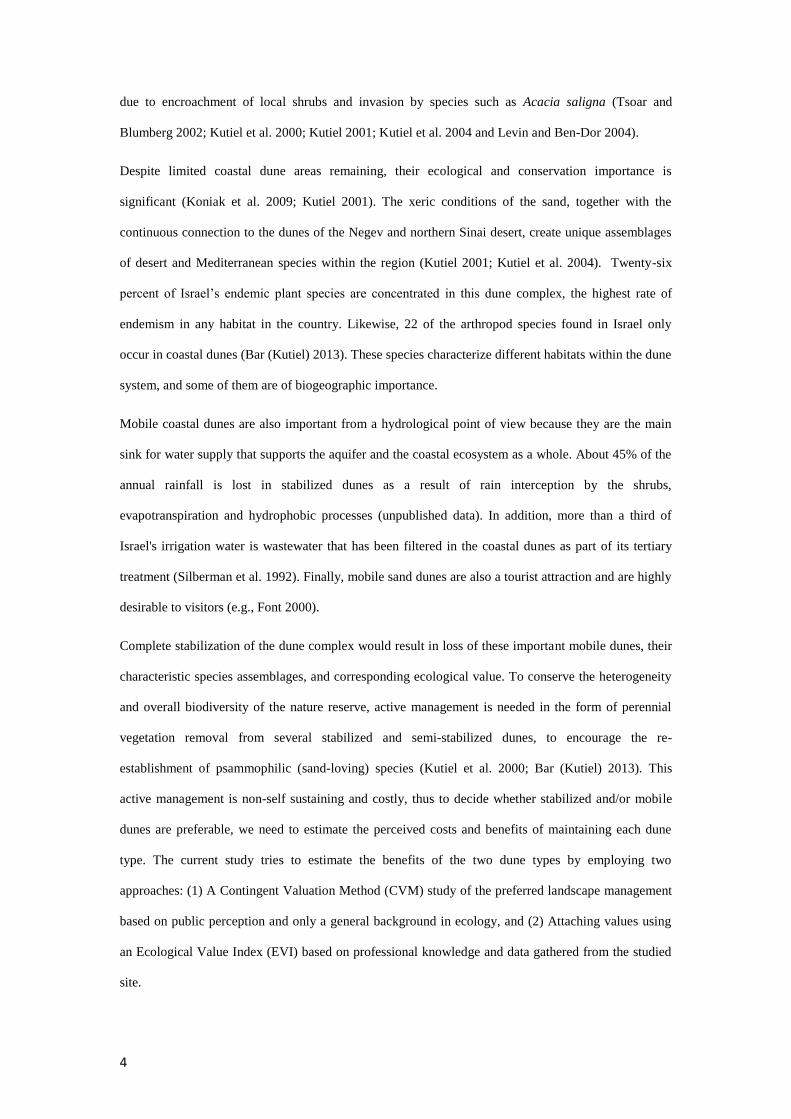
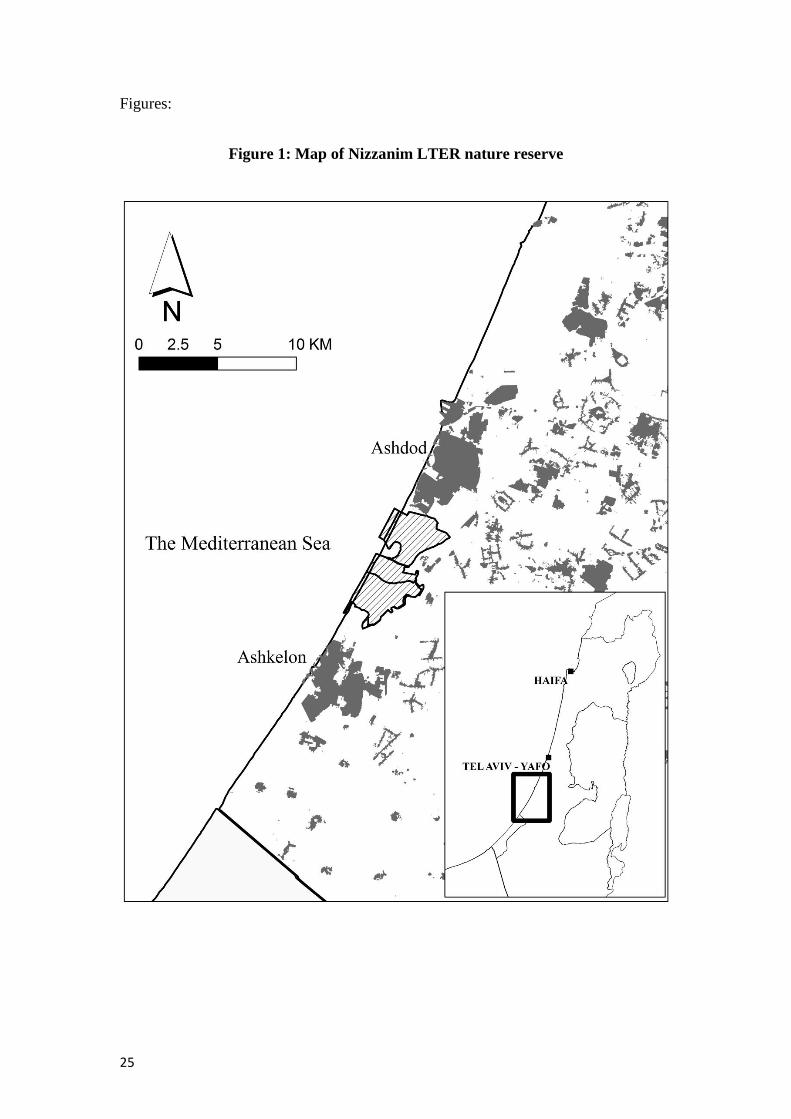
Study site
The Nizzanim LTER nature reserve is located in the south-western part of the Israeli Mediterranean
coast (31°42'-31°44'N, 34°35'-34°36'E) (Fig 1). The nature reserve covers an area of 20 square km with
a Mediterranean climate and a mean annual rainfall of 450 mm, falling between October and March.
Nizzanim is the only large nature reserve along the Mediterranean coast in Israel that still contains
dunes with multiple levels of stabilization (Kutiel 2001). About 60% of the dunes are currently in a
semi-stabilized state, 20% are stabilized and only 20% are mobile (Rubinstein et al. 2013). Vegetation
associations change with increasing dune stability from Ammophilia arenaria associations in mobile
dunes, characterized by Sharo-Arabian psammophilic species, to Artemisia monosperma and Retama
raetam associations in the stabilized dunes, characterized by a higher number of Mediterranean species
(Kutiel 1998; Kutiel and Danin 1987; Rubinstein et al. 2013)/ Since 2005, the Israel Nature and Parks
Authority has invested a large amount of money and effort to prevent the semi-stabilized dunes from
further stabilization, and in the short-term to restore some of the stabilized dunes to a mobile dune state
by mechanical perennial vegetation removal, in order to expand and encourage the re-establishment of
psammophile flora and fauna.
Figure 1 about here
Methods
Dichotomous choice
In this CVM study, the dichotomous choice (DC) method is used to investigate people’s willingness to
pay (WTP). The DC method was first used by Bishop and Heberlein (1979), and Hanemann (1984)
developed the conceptual and theoretical arguments. The key feature of this method is that individuals
are asked whether they would pay a suggested price in a hypothetical market situation. The possible

6
answers are usually ‘yes’ or ‘no’. Respondents find it easier to answer DC questions than open-ended
questions because most people are familiar with discrete choices in a real market situation (Hanemann
1994). For this reason, the DC format was proposed by the US National Oceanic and Atmospheric
Administration (NOAA) Panel on Contingent Valuation (Arrow et al. 1993). For the DC elicitation
format, the mean WTP can be estimated based on Hanemann’s random utility maximize model
(Hanemann 1984). The binary logit approach gives the basic relationship:
(1) 𝑃(𝑌) = 1 − {1 + exp[𝐵0 + 𝐵1(𝑋)]}−1
Where B’s are coefficients and X is the bid amount that the house-hold is asked to pay From the above
equation, Hanemann (1989) provides a formula to calculate the mean WTP as:
(2) Mean WTP = −(B0/B1)
where B1 is the coefficient estimate on the bid amount; B0 is either the estimated constant (if no other
independent variables are included), or the grand constant, calculated as the sum of the estimated
constant, plus the product of the coefficient estimates of the other independent variables, each one
multiplied by its respective means. The total benefits can then be estimated by aggregating the mean
WTP values to obtain a total WTP amount.
The NOAA panel's decision for use of the Dichotomous Choice (DC) design for CVM, stems from two
features of the design; first, it is purported to be incentive compatible, and second, the decision
framework it imposes (take-it-or-leave-it) at a given price is more akin to normal market transactions.
Survey description and administration
Our analysis included responses from 300 respondents. All respondents were over 18 and if possible,
were a head of household. The survey was in the form of personal interviews, primarily because of the
proven effectiveness of this approach, especially in cases where a relatively complex set of
environmental goods is entailed. A manual was prepared for the interviewers, who were mostly
graduate students involved in the project The manual contained a general explanation of the CV
method, an instruction section describing interviewing methods, and the questionnaire itself containing
three sub-sections with additional explanations for each question. All interviewers received at least a
half-day or full-day training, during which time every interviewer had to conduct an internal test
interview.
7
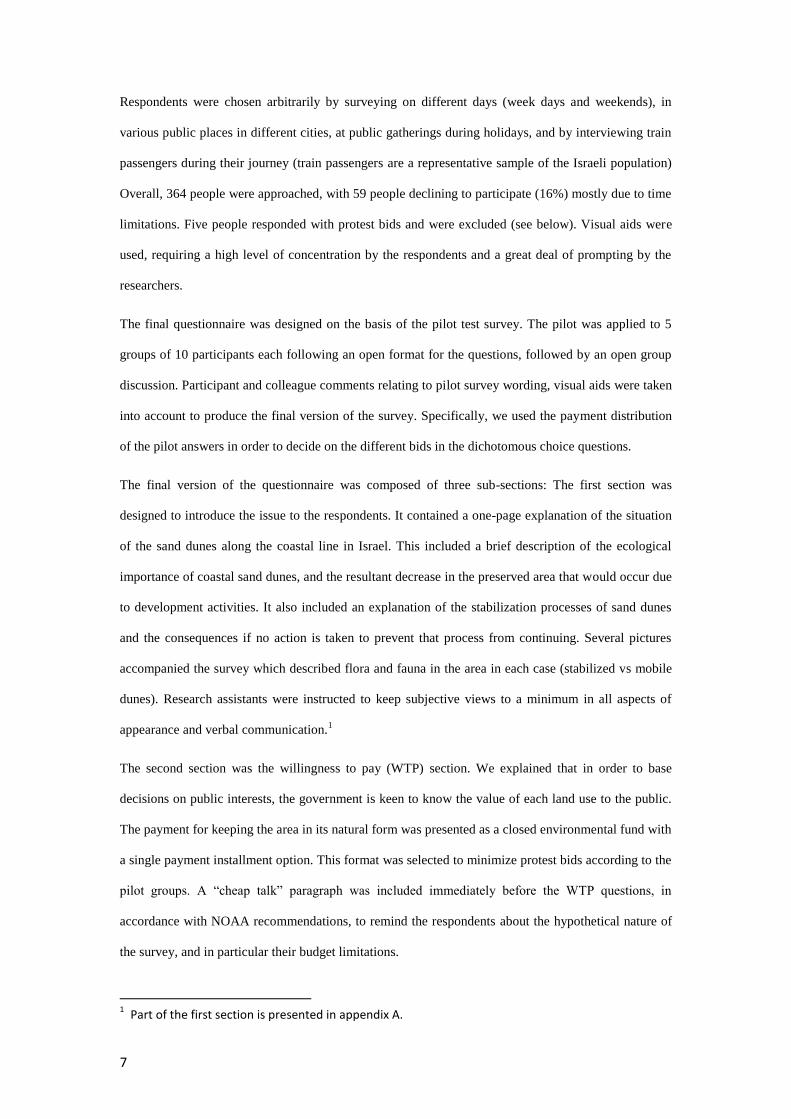
Respondents were chosen arbitrarily by surveying on different days (week days and weekends), in
various public places in different cities, at public gatherings during holidays, and by interviewing train
passengers during their journey (train passengers are a representative sample of the Israeli population)
Overall, 364 people were approached, with 59 people declining to participate (16%) mostly due to time
limitations. Five people responded with protest bids and were excluded (see below). Visual aids were
used, requiring a high level of concentration by the respondents and a great deal of prompting by the
researchers.
The final questionnaire was designed on the basis of the pilot test survey. The pilot was applied to 5
groups of 10 participants each following an open format for the questions, followed by an open group
discussion. Participant and colleague comments relating to pilot survey wording, visual aids were taken
into account to produce the final version of the survey. Specifically, we used the payment distribution
of the pilot answers in order to decide on the different bids in the dichotomous choice questions.
The final version of the questionnaire was composed of three sub-sections: The first section was
designed to introduce the issue to the respondents. It contained a one-page explanation of the situation
of the sand dunes along the coastal line in Israel. This included a brief description of the ecological
importance of coastal sand dunes, and the resultant decrease in the preserved area that would occur due
to development activities. It also included an explanation of the stabilization processes of sand dunes
and the consequences if no action is taken to prevent that process from continuing. Several pictures
accompanied the survey which described flora and fauna in the area in each case (stabilized vs mobile
dunes). Research assistants were instructed to keep subjective views to a minimum in all aspects of
appearance and verbal communication.1
The second section was the willingness to pay (WTP) section. We explained that in order to base
decisions on public interests, the government is keen to know the value of each land use to the public.
The payment for keeping the area in its natural form was presented as a closed environmental fund with
a single payment installment option. This format was selected to minimize protest bids according to the
pilot groups. A “cheap talk” paragraph was included immediately before the WTP questions, in
accordance with NOAA recommendations, to remind the respondents about the hypothetical nature of
the survey, and in particular their budget limitations.
1 Part of the first section is presented in appendix A.

8
Respondents were assigned to one of four bid groups A to D. They were first asked to circle their
preferred landscape of the two dune types. Their WTP statement was thus related to the type of dune
structure they prefer. They were offered one of four initial payment bids, with a follow-up question
dependent on the answer to the first question. The different bid cards given to different groups were
(values in NIS): A (50, 75, 25), B (100, 150, 75), C (200, 300, 150) and D (400, 600, 300), where the
first number indicates the first bid, the second number indicates the follow-up question if the
respondent answers positively to the first question, and the third number is the follow-up bid in case
they answered negatively to the first bid. (i.e. Group A were asked if they were willing to pay 50 NIS,
if ‘Yes’ so were they willing to pay 75NIS, if ‘No’, would they be willing to pay 25NIS).
After answering the WTP questions, the respondent was given the chance to revise their answers. This
is sometimes necessary if the respondent misunderstood something. Each respondent was asked to
confirm that they understood they would only have to pay a one-time contribution, and that they would
only have to pay for one of the bids.
The third section was devoted to elicit motivations and to spot protest bids. Motivations included use,
bequest, option and existence while protest bids were detected by a zero WTP, followed by circling the
option that it is not their duty to finance such preservation plans.
The last section was intended to explore socio-demographic characteristics of the respondents. This
included: gender, age, origin, and number of children, education, income, visit frequency, membership
in an environmental NGO, general knowledge of nature conservation, and specific knowledge about
sand dune stabilization processes.
Ecological measure
The stabilization process in sand dunes results in changes in plant composition, from psammophilic
species to more general and opportunist species. In order to estimate the specific value that is lost
during stabilization, we used the Ecological Value Index (EVI) developed by Cohen and Bar (Kutiel)
(2005) to index each species by its uniqueness and importance for nature conservation. Positive ranked
numbers (1 to 8) were given to important species (psammophilic, protected, endemic, rare, very rare
and endangered) and negative numbers (-1 to -4) were given to non-endemic, opportunistic and
invasive species. The higher the value, the more important the species is for nature conservation.
The total ecological value for a given sand dune is given by equation (3)

9
(3) )(C
cVDEV i
i
where:
DEV = Total Ecological value of a sand dune
Vi = Ecological value of species i
Ci = Land cover of species i
C = Total land cover of all vegetation on the given sand dune type
Species data for each dune type were collected from four dune samples. During the stabilization
process, changes occur in plant assemblages, thus it should be expected that the EVI of individual
species and the ecosystem as a whole would change as well, reflecting the total ecological value of the
specific dune type.
Results
Descriptive statistics
Descriptive statistics are shown in Table 4.1 below.
Table 4.1 about here
As can be seen from the table, 48.67% of respondents preferred mobile dunes, while the small majority
preferred stabilized dunes (51.33 %). 57% of respondents were female, and only 7% of all respondents
belong to an NGO. The mean respondent visited the reserve 0.98 times yearly, and the mean level of
education and income were 3.03 and 2.57 on a 1-5 and 1-4 scale, respectively. Average number of
children was 1.4 per household (about 1 child less than the national average but consistent with the age
profile of visitors). Seventy seven percent of the respondents were natives of Israel while 23% were
new immigrants. Finally, respondents presented 1.6 and 1.5 knowledge about sand dunes in general
and stabilization processes, respectively, on a 1-3 scale.
The willingness to pay distributions is shown in Tables 4.2 and 4.3, and figure 2. Table 4.2 shows the
distribution of those answering “yes” to the first question in different bid groups, while table 4.3
presents the overall distribution of the follow-up question as well. Protest bids were identified as those

10
who circled only the protest motive and were not willing to pay any positive amount. Five respondents
were classified as such and were excluded from the survey, while replacing them with other
respondents to maintain a sample of 300 responses.
Figure 2 about here
Table 4.2 about here
Table 4.3 about here
Protest bids were identified as those who circled only the protest motive and were not willing to pay
any positive amount. Five respondents were classified as such and were excluded from the survey,
while replacing them with other respondents to maintain a sample of 300 responses.
As expected, the percentage of "yes" saying drops down when the bid rises. This is true for the first as
well the follow up question.
Use versus Non-use value: We calculated the specific values by identifying which motive the
respondent circled. For each value component, the respondent had a 5 units Likert scale to express their
agreement with the statement. This enabled us to allocate a relative amount that could be associated to
a specific value. We summed the specific values of the entire sample population and divided by 300 to
get an average WTP value per respondent for each value type. The relative shares were 0.21, 0.26, 0.24
and 0.29 for use, option, bequest and existence values, respectively Thus, existence value was the
biggest value and the difference between total non-use values and use values given by respondents was
3.7.
Econometric estimation
We present both Logit and Probit results for the sample (Table 4.4).
Table 4.4 about here
According to our estimation results, table 44 shows the model specification that best fits the data. The
coefficients in table 4.4 can be interpreted as follows: a positive coefficient means a positive influence
of the variable on the WTP.
From the table it can be seen that not all the coefficients are significant. The ones which turned out to
be significant and positively correlated with the WTP were education, income, knowledge about sand

11
dunes stabilization (knowledge 2) and active landscape management (dummy on those who preferred
active management). On the contrary, coefficients that turned out to be significant and negatively
correlated were age and bid. Variables that were not found to be significant were gender, origin,
number of children, membership in NGOs, visits at such sites and general knowledge about
environmental issues. The coefficient of value for general knowledge may be low due to the inclusion
of landscape management. Visit frequency may be explained due to the relative low share of use value
from its total value, 21% (thus, a high relative share of non-use value, 79%). The negative coefficient
found for Membership in an NGO is surprising and not easily explained unless one notes the relative
low share of members in the sample.
Estimation of the various sand dunes types benefits
In order to estimate the benefit per household we use equation (2) where only significant variables (at
least at the 90% level) are considered. To measure the landscape preference for mobile dunes we used
the dummy variable coefficient of the active management and added that to the grand constant as well.
Public decision differed according to the criterion used. If public decision is accepted by a majority
than a passive management regime should be chosen (more voters voted for passive management).
However, if efficiency dictates the outcome, then active management should rule because the total
benefit is significantly larger compared to the one derived for passive management. Total benefit is
calculated as mean WTP for a dune type times the number of household voted for that regime.
In order to aggregate for the entire Israeli population we add to the mean WTP calculated in the
previous sentence also partial value for that dune of the rest of the population. The reason is that the
benefit does not go to zero for those whose dune type was not elected. For example, if 48% chose a
preferred dune type, say mobile dune, the benefit for the rest 52% will not be zero if mobile dunes will
be the preferred option. This was done by comparing the ratio between the 1st and 2
nd dune choice and
scaling down the benefit by the same ratio (Table 4.5).
Table 4.5 about here
If we take the arithmetic mean of the values derived from the logit and probit estimations, we see that a
mobile dune increases the benefit per household from 146 to 252 NIS. The derived national value for
active management is thus 344m NIS vs 197m NIS if passive management continues. Thus, the benefit
from stabilization is the difference (146.5m NIS). Using amortization to find the yearly value in 5%

12
discount factor, the annual increase in welfare by moving into active management would be 7.325m
NIS.
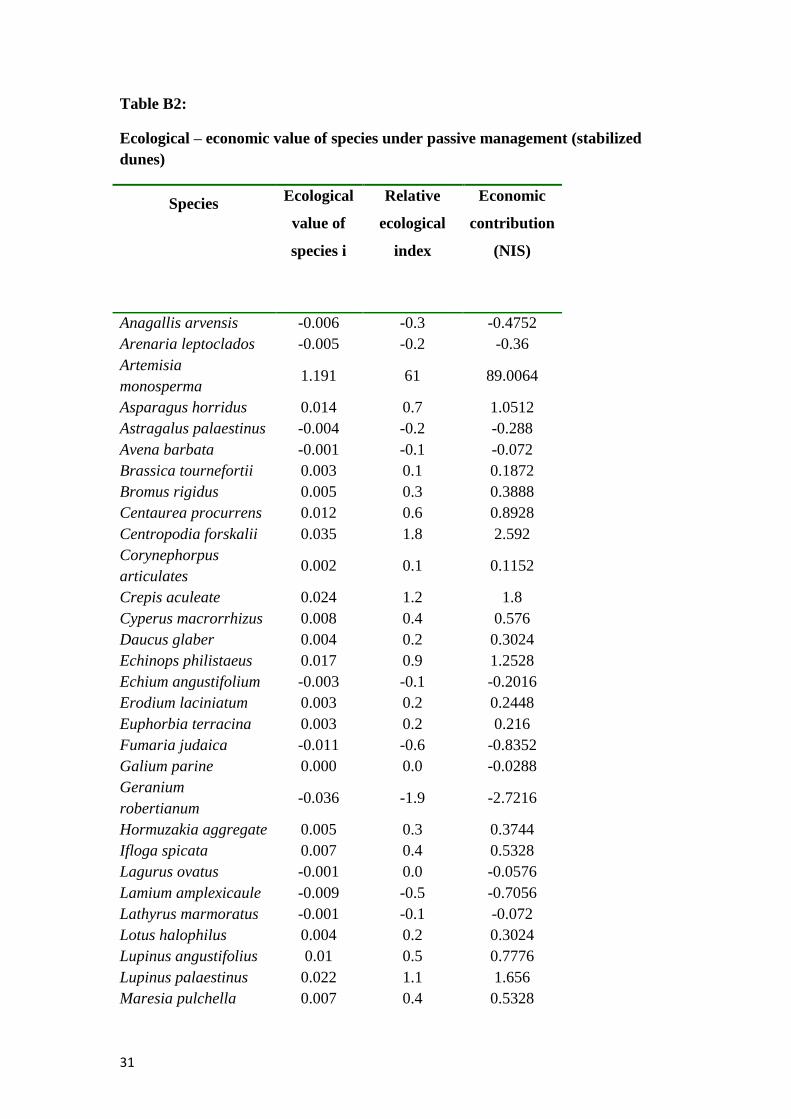
Ecological value measured in monetary terms
The average total ecological index for mobile and stabilized sand dunes was 2.70 and 1.95,
respectively. The relative economic value of each species was calculated by multiplying its relative
ecological contribution by the total value per household for that specific sand dune type. This is shown
in Tables B1 and B2 in appendix B for active management (remobilization of stabilized dunes) and
without (passive) management of sand dunes, respectively. If we remove the endemic species that
would disappear with stabilization, we reduce the value of the dune. Endemic species are marked * in
Table A1. Subtracting their relative value reduces the value of each dune type to 170.75 NIS, 67% of
its previous value. From Table 4.3 we see that the stabilized dunes were given only 58% of the mobile
dune value (146 vs 252 NIS for stabilized dunes vs mobile dunes2).
Cost-benefit analysis
The total value of the sand dunes was found to be 189m and 298m NIS for passive and active
managements, respectively (Table 4.5). A 5% amortization brings the value to 9.45m and 14.9m NIS
annually for the two dune types, respectively, with 21% derived from use-values and 79% from non-
use values.
Based on personal communication with local managers of the Israel Nature and Parks Authority (NPA)
responsible for the restoration management project, it was found that the annual cost of active
management lies between 245-305 thousand NIS annually. These costs include perennial vegetation
removal (amortized capital cost and variable expenses), an ongoing monitoring process to measure the
impact of the vegetation removal on various taxonomic units and the labor cost of the inspector,
biologist and other indirect professional personnel as necessary. Taking the average (275K NIS) and
comparing it to the annual loss of stabilization process calculated earlier (7.325m NIS), we find a
benefit cost ratio of 26.6, which clearly justifies such an investment, both from a pure ecological
assessment (EVI) as well as from the general public point perception (CVM).
2 As a referee noted, a monetary assessment is not necessary be presented in monetary terms It is
enough to compare the EVI between the two dune types But it may not be subjected to a Cost Benefit Analysis since costs are given in monetary terms

13
Our results are based on management regimes for dune types that have fixed characteristics.
Nevertheless, using the EVI or any other similar index (e.g., Rubinstein et al. 2013) could also be a
useful tool to estimate the efficiency of programs targeting specific species rather than habitats,
especially if there is a budget limitation. We did not apply our methods to such an example, because
specific information would be needed regarding the costs of managing a given species, but identifying
these costs is possible and may be used in a future study.
Discussion and conclusions
Landscape valuation is not an easy task for ecologists and even more complicated for the general
public. The attitude to the landscape value can take different forms as well. It can be based on
esthetical grounds (texture, colors etc), on social grounds such as recreation, or on cultural grounds. In
all these cases the attitude is based on subjective valuations made by the individual (Briggs and France
1980). In contrast, landscape change valuation can be based on its ecological components which can be
studied for long periods and quantified (indices, models etc) by professional ecologists. This type of
valuation is generally considered as a more objective assessment when it comes to conservation and/or
restoration decisions, since it is not dependent on any particular individual and in fact does not even
necessarily require actual visits to the site (Blackmore et al. 2014).
Studies that have used the CVM method alone have showed that the attitude of the public to the
landscape and especially to ecological component, such as biodiversity, is very low in resolution (eg,
Dachary-Bernard and Rambonilaza, 2012, Irwin and Geoghegan, 2001). Thus, the concern is that
respondents state their WTP without regard for the true scope of the environmental goods. This issue of
scope continues to concern WTP conclusions derived from CVM studies (Gren, 2010, Pocewicz et al. ,
2008).
One of our previous studies in which only the CVM was used in order to find the WTP for eradication
of an invasive species versus WTP for the preservation of the current situation, showed that the WTP
for both cases was almost the same and non-significant (Lehrer et al. 2011). Another study of
biodiversity valuation in Sweden by Boman et al. (2008) found that higher levels of biodiversity did
not necessarily elicit a higher WTP.
In our present study, we used two approaches to evaluate mobile coastal dunes and the active
management aimed at destabilizing stabilized dunes. Results show that if active management does not

14
take place and the stabilization process continues, sand dunes will lose 33% of their ecological value
due to the loss of the characteristic endemic and psammophilic species. However, the public appeared
to attach a further value reduction of 9% to mobile dune loss, probably due to landscape structure,
social and cultural motives. We cannot estimate what share of the value reduction based on the
subjective assessment is due to each source of motive. We presented the respondents with both texture
and general ecological background differences between the two types of sand dunes, and they may
have taken into account the ecological component or disregarded it and concentrated mainly on texture
and landscape. In general, it is expected that an ordinary citizen (respondent) is less likely to pay
attention and value complex ecological issues than a more objective ecological index.
It is reassuring that the public is willing to pay even more than the apparent ecological value lost, so
using public surveys is further justified for cost-benefit analyses. However, usually the outcome is
reversed and we cannot suggest that this form of cost benefit calculations alone would be justified for
restoration decision making. EVI is higher resolution and answers more functional rather than
perceived values, nevertheless CVM is useful, particularly when knowledge, time or money for an in
depth ecological assessment is lacking.
It was found from the CVM study that the yearly value of the sand dunes in Nizzanim LTER nature
reserve may increase from 9.45m to 14.9m NIS annually if active management to destabilize the sand
dune has already started to take place. This increase of 5.45m NIS per year is composed of both use
and non-use values (21% and 79%, respectively). Based on the total value of the two sand dune types,
the annual loss in value under passive management would be 42%. The EVI calculated loss due to
passive management was only 33% of the total value of the sand dune complex. Contrary to the
intuitive belief that non-experts cannot judge the full value or consequences of loss caused by non-
optimal landscape use policy, the value stated by non-professionals in this case appears sufficient to
justify a conservation decision for active management.
Another reason for optimism is the findings in the CVM survey. The WTP for active management
depends positively on education, income and information. While it is impossible to directly affect the
first two, information can be relatively easy to be changed through campaigns and a more close
knowledge with coastal sand dunes. This can also solve the minority issue related to active
management scenario.

15
Of course, this finding may be location specific. Basing decisions of land use on the bounded
rationality of uninformed citizens can fail to identify key ecological functions and factors that are
important for human and natural health. Nevertheless, in our study determining the value of a
landscape based solely on the apparent ecological value, failed to capture the social, culture and/or
ecological value assigned to this coastal system by the public. Public opinion can be equally important
since planning management actions often require community participation or public support to be
successful. We suggest that contrasting the two perspectives can provide new insights and give policy
makers another tool for justification of landscape conservation.
We recognize other decision making criterions may be used in land use policy. Jones et al. (2014) used
local community perceptions as the basis for coastal land use management. This approach may be less
relevant when the land type in question includes assets that have a national and even global ecological
or other importance that needs to be considered.
Finally as Liu and Opdam (2014) assert, planning and valuation should incorporate one into the other.
We do not think that one method outweighed the other in our study. Rather, we highlight that both
value assessments should be presented to decision makers. Their task could be made much easier if a
CBA based on the two methods has a clear message one way or the other, or indeed draws attention to
opposing viewpoints and values. The final outcome would be far more likely to harness public support
and ecological success, if tax money is spent wisely on effectively valued land management decisions.

16
References
Achiron-Frumkin, T, Frumkin, R, Rodich, R (2003) Conserving the coastal sands A policy report submitted to
the Ministry of Environment (Hebrew)
Arrow, KJ, Solow, R, Portney, PR, Leamer, EE, Radner, R, Schuman, EH (1993) Report of the NOAA panel on
contingent valuation Fed Reg 58: 4602–4614
Arrow, K, Cropper, M, Eads, G, Hahn, R, Lave, L, Noll, R, Portney, P, Russell, M, Schmalensee, R, Smith, K,
Stavins, R (1996) Is there a role for benefit–cost analysis in environmental, health, and safety
regulation? Science 272: 221–222
Bar (Kutiel), P (2013) Restoration of coastal sand dunes for conservation of biodiversity – the Israeli experience
In: Martínez, ML, Gallego-Fernández JB & Hesp, PA (eds) Restoration of Coastal Dunes, Springer
Series on Environmental Management pp 173-186
Bishop, R and Heberlein, A (1979) Measuring values of extra market goods: Are indirect measures biased? Am
J Agric Econ 61: 926–930
Blackmore L, Doole G, Scilizzi, S (2014) Practitioner versus participant perspectives on conservation tenders
Biodivers Conserv 23: 2033-2052
Boman, M, Norman J, Kindstrand, C, and Mattsson L (2008) On the budget for national objectives and
willingness to pay for protection of forest land Can J For Res 38: 40-51
Briggs, DJ France, J (1980) Landscape Evaluation: a Comparative Study Env Manag 10: 263–275
Chang-Qing K, Dong Z, Fu-Qiang, W, Shu-Xing, C, Christance, S, Wolfgang-Martin, B and Wang, H (2010)
Analyzing coastal wetland change in the Yancheng National Nature Reserve, Chine Reg Env Chang
11: 161-173
Cohen O, Bar (Kutiel) P (2005) Effect of invasive alien plant – Acacia saligna – on natural vegetation of coastal
sand ecosystems J For Woodl Env 7: 11-17 (Hebrew, with an English abstract
Costanza, R and Folke, C (1997) Valuing ecosystem services with efficiency, fairness and sustainability as goals
In: Daily, G (ed) Nature’s Services: Societal Dependence on Natural Ecosystems, Island Press,
Washington DC pp 49-70
Dachary-Bernard, J and Rambonilaza, T (2012) Choice experiment, multiple programs contingent valuation and
landscape preferences: How can we support the land use decision making process? Land Use Policy
29: 846-854

17
Delbaere BCW (1998) Facts and figures on European biodiversity; state and trends 1998–1999 European Centre
for Nature Conservation, Tilburg, the Netherlands
Drees, JM (ed) (1997) Coastal dunes, recreation and planning Proceedings of European Seminar, Castricum,
November 1995 Publ EUUC Service, the Netherland 111 p
European Environmental Agency (1999) Coastal and marine zones: environment at the turn of the century Chap
3/14, Copenhagen
Foley, JA, DeFries, R, Asner, GP et al. . (2005) Global Consequences of Land Use Science 309 (5734): 570-574
Gren, IM, Svensson, L, Carlsson, M and Bishop, K (2010) Policy design for a multifunctional landscape Reg
Env Chang 10: 339-348
Hanemann, WM (1984) Welfare evaluations in contingent valuation experi-ments with discrete responses Am J
Agric Econ 66: 332–341
Hanemann, M (1994) Valuing the environment through contingent valuation J Econ Perspect 8: 19–43
Harris, LD (1984) The Fragmented Forest Univ Chicago Press, Chicago
Heslenfeld, P, Jungerius, PD, Klijn, JA (2004) Coastal Dunes: Ecological Values, Threats, Opportunities and
Policy Development Chapter 20 in Martínez, ML and Psuty, Norbert P (eds) Coastal Dunes: Ecology
and Conservation Springer publishing
Holdgate, MW (1993) The sustainable use of tourism - a key conservation issue Ambio 22: 481-482
Irwin, EG, Geoghegan, J (2001) Theory, data, and methods: developing spatially explicit economic models of
land use change Agric Ecosys Env 85: 7–23
Jin, J, Zhishi, W, Xuemin, L (2008) Valuing black-faced spoonbill conservation in Macao: A policy and
contingent valuation study Ecol Econ 68: 328–335
Jin, J, Chong ,J and Lun, LI (2013) The economic valuation of cultivated land protection: A contingent
valuation study in Wenling City, China Landsc Urban Plan 119: 158-164
Jones, N, Koukoulas, S, Clark, JRA, Evangelinos, KI, Dimitrakopoulos, PG, Eftihidou, MO, Koliou, A,
Mpalaska, M, Papanikolaou, S, Stathi, G and Tsaliki, P (2013) Social capital and citizen perceptions of
coastal management for tackling climate change impacts in Greece Reg Env Chang 14: 1083-1093
Kareiva, P, Watts, S, McDonald, R and Boucher, T (2007) Domesticated nature: shaping landscapes and
ecosystems for human welfare Science 316: 1866–1869
Koniak G, Noy-Meir E, Perevolotsky A (2009) Estimating multiple benefits from vegetation
in Mediterranean ecosystems Biodivers Conserv 18:3483-3501

18
Kutiel, P (1998) Annual vegetation of the coastal sand dunes, Israel Is J Plant Sci 46: 287-298
Kutiel, P (2001) Conservation and Management of the Mediterranean Coastal Sand Dunes in Israel J of Coast
Conserv 7: 183-192
Kutiel P and Danin, A (1987) Annual species diversity and above-ground phytomass in relation to some soil
properties in a sandy area in the northern Sharon plains Plant Ecol 70: 45-49
Kutiel, P, Peled, Y and Geffen, E (2000) The effect of removing shrub cover on annual plants and small
mammals in a coastal sand dune ecosystem Biol Conserv 94: 235-242
Kutiel, P, Cohen, O, Shoshany, M, Shub, M (2004) Vegetation Establishment on the Southern Israeli Coastal
Sand Dunes between the Years 1965 – 1999. Landsc Urban Plan 67: 141-156
Lehrer, D, N Becker and P Bar (Kutiel) 2011 The economic impact of the invasion of Acacia Saligna in Israel
and the optimal management strategy. Sustain Dev World Ecol 18: 118–127
Levin, N, Ben–Dor, E (2004) Monitoring Sand Dune Stabilization along the Coastal Dunes of Ashdod -
Nizanim, Israel, 1945-1999. J Arid Env 58: 335-355
Liu, J, Opdam, P (2014) Valuing ecosystem services in community-based landscape planning: introducing a
wellbeing-based approach. Landsc Ecol. DOI 101007/s10980-014-0045-8
O’Neill, J, Walsh, M (2000) Landscape conflicts: preferences, identities and rights. Landsc Ecol 15: 281–289
Pickett, ST, White, PS (eds) (1985) The Ecology of Natural Disturbance and Patch Dynamics. Academic Press,
New York
Pocewicz, A, Nielsen-Pincus, M, Goldberg, C, Johnson, MH, Morgan, P Force, JE, Waits, LP and Vierling, L
(2008) Predicting land use change: comparison of models based on landowner surveys and historical
land cover trends. Landsc Ecol 23:195–210
Reyers, B, O’Farrell, PJ, Cowling, RM, Egoh, BN, Maitre, L, Jan, DC, Vlok, HJ (2009) Ecosystem Services,
Land-Cover Change, and Stakeholders: Finding a Sustainable Foothold for a Semiarid Biodiversity
Hotspot. Ecol Soc 14(1): 38-47
Silberman, J, Gerlowski, DA and Williams, NA (1992) Estimating Existence Value for Users and Nonusers of
New Jersey Beaches. Land Econ 68: 225-236
Spash, C, Stagl, S and Getzner, M (2005) Exploring Alternatives for Environmental Valuation. Routledge, Oxon
Spurgeoon, J (1998) The Socio-Economic Costs and Benefits of Coastal Habitat Rehabilitation and Creation.
Marin Pollut Bull 37: 373-382

19
Tsoar, H and Blumberg, D (2002) Formation of Parabolic Dunes from Barchan and Transverse Dunes along
Israel's Mediterranean Coast. Earth Surf Process Landf 27: 1147–1161
Turner, BL, Lambin, EF and Reenberg, A (2007) The Emergence of Land Change Science for Global
Environmental Change and Sustainability. Proc Nat Acad Sci 104(52): 20666-20671
Van der Meulen, F and Salman, AHPM (1996) Management of Mediterranean coastal dunes. Ocean Coast
Man 30: 177-195

20
Appendix A*: Introductory explanation regarding stabilization of dunes (translated from Hebrew)
* Pictures of both dunes landscape texture are provided as well as pictures of endemic flora and fauna.
The sands of the coastal plain are undergoing a natural process of stabilization. The sand
dunes are becoming covered with vegetation, which gradually makes them become
stable dunes - without sand movements. Contrary to the conventional view, mobile
sand is not a bad thing, rather creates a unique ecological system.
What do we lose when the sand dunes are stabilized?
Landscape changes - the landscape of mobile dunes, which invites the visitor to
enjoy them, a view that was once common in the entire coastal plain and is now
disappearing
The sand dunes are the only place where some special species of plants and
animals can exist – their numbers are decreases, and they may become extinct.
Plants and animals from other places have begun to take over the sands and compete negatively with the local plants and animals
Water filtration services are partially lost.
Researchers were uncertain about whether intervention and treatment to preserve the landscapes, and the flora and fauna typical of the shifting sands, is necessary, and if it is - how to do it effectively. They found that it is possible to remove some of the existing vegetation in a controlled manner in order to restore the mobile sands system.
A partial removal of the vegetation will preserve the landscape with a combination of dune types (there will be mobile dunes as well as stabilized ones) and also a variety of plants and animals kinds, typical of the mobile sands (see in accompanied pictures). Without intervention, conservation will be passive - the dunes will be stabilized, and dense vegetation will cover them. The dunes’ landscape will change, and it will be similar to vistas from other places.

21
Tables
Table 1: Descriptive statistics
Variable Mean SD CI (95%)
Landscape preference
(1=mobile dunes preference)
0.487 0.500 ±0.001
Gender (1=female) 0.567 0.065 ±0.129
Age (5 decedaes) 2.667 0.169 ±0.339
Origin (1=Native) 0.767 0.055 ±0.110
Children 1.400 0.192 ±0.384
Green (member=1) 0.067 0.032 ±0.065
Education (1-5) 3.033 0.119 ±0.238
Income (1-4) 2.567 0.110 ±0.220
Visits (yearly frequency) 0.980 0.359 ±0.717
Knowledge 1 (1-3) 1.600 0.104 ±0.208
Knowledge 2 (1-3) 1.483 0.096 ±0.192
N=300

22
Table 2: WTP distribution for the first question
Bid group
(NIS)
Number of
Yes saying
Number of No
saying
Total % Yes
A (50) 60 29 89 67
B (100) 49 33 82 60
C (200) 20 58 78 26
D (400) 11 40 51 22
Table 3: WTP for the first and second questions
Bid group (NIS) YY YN NY NN TOTAL
A (50, 75, 25) 33 27 9 20 89
B (100, 150, 75) 24 25 8 25 82
C (200, 300, 150) 7 13 16 42 78
D (400, 600, 300) 3 8 6 34 51

23
Table 4: Regression estimates for landscape valuation
Variable
Logit Probit
Value S.E. Value S.E.
Constant 0.84 0.60 0.45 0.36
Active Landscape
management***
0.893 0.264 0.507 0.156
Bid*** -0.008 0.001 -0.005 0.001
Gender -0.103 0.186 -0.061 0.113
Age* -0.174 0.098 -0.107 0.059
Origin -0.219 0.215 -0.131 -0.130
Children 0.016 0.102 0.012 0.061
Green 0.169 0.279 0.091 0.168
Education** 0.235 0.104 0.143 0.063
Income*** 0.307 0.111 0.189 0.067
Visits 0.031 0.030 0.161 0.181
Knowledge 1 0.215 0.140 0.131 0.085
Knowledge 2*** 0.381 0.128 0.237 0.077
LL=-341.84
LR χ2=86.43
Prob > χ2=0.0000
Pseudo R2=0.1067
LL=-362.462
LR χ2 = 85.19
Prob > χ2 =0.0000
Pseudo R2=0.1052
*90% significant, **95% significant, *** 99% significant.

24
Table 5: Benefit estimation (passive=stabilized dunes; active=mobile dunes)
Value Landscape
management
Logit Probit Arithmetic
mean
Value per
household
(NIS)
Passive 127.0 164.7 145.85
Active 238.6 266.1 252.35
National value
(M. NIS)
Passive 188.8 205.9 197.35
Active 298.2 389.5 343.85
25
Figures:
Figure 1: Map of Nizzanim LTER nature reserve

26
Figure 2: % of “yes” saying for different bids (Bids on the horizontal x’s and the
percent to answer “yes” is on the vertical x’s.)

27
Appendix A: Ecological-economic characteristics of the two sand dunes types
Table A1: Ecological – economic value of species under active management
(mobile dunes)
Species Ecological
value of
species i
Relative
ecological index
Economic
contribution
Value of
dune
without the
species
Ammophila arenaria* 0.340 12.6 31.74418 220.60582
Artemisia
monosperma
0.845 31.3 78.91806 173.43194
Asparagus horridus 0.004 0.1 0.3237 252.0263
Atractylis carduus* 0.005 0.2 0.49634 251.85366
Centropodia forskalii 0.273 10.1 25.50756 226.84244
Corynephorus
articulatus
0.004 0.1 0.36686 251.98314
Cutandia memphitica* 0.010 0.4 0.94952 251.40048
Cyperus macrorrhizus 0.006 0.2 0.56108 251.78892
Echinops philistaeus 0.003 0.1 0.25896 252.09104
Echium angustifolium -0.002 -0.1 -0.17264 252.52264
Hormuzakia
aggregate
0.011 0.4 1.01426 251.33574
Ifloga spicata 0.014 0.5 1.25164 251.09836
Launaea fragilis* 0.011 0.4 1.079 251.271
Maresia pulchella 0.018 0.7 1.64008 250.70992
Polycarpon
succulentum
0.006 0.2 0.58266 251.76734
Polygonum
palaestinum*
0.265 9.8 24.77384 227.57616
Retama raetam 0.106 3.9 9.9268 242.4232
Rumex pictus 0.121 4.5 11.3295 241.0205
Scrophularia
hypericifolia*
0.271 10.0 25.33492 227.01508
Senecio joppensis 0.374 13.9 34.9596 217.3904
Senecio
leucanthemifolius*
-0.008 -0.3 -0.7553 253.1053
Silene succulenta * 0.005 0.2 0.49634 251.85366
Sonchus oleraceus -0.002 -0.1 -0.17264 252.52264
Stipagrostis lanata 0.006 0.2 0.60424 251.74576
Tolpis virgata -0.001 0.0 -0.06474 252.41474
Trisetaria linearis 0.014 0.5 1.27322 251.07678
Vulpia fasciculate* 0.000 0.0 0 252.35
*Endemic species

28
Table A2: Ecological – economic value of species under no management
(stabilized dunes)
Species Ecological
value of
species i
Relative
ecological
index
Economic
contribution
Value of
dune
without
the species
Anagallis arvensis -0.006 -0.3 -0.4752 146.4752
Arenaria leptoclados -0.005 -0.2 -0.36 146.36
Artemisia
monosperma 1.191 61 89.0064 56.9936
Asparagus horridus 0.014 0.7 1.0512 144.9488
Astragalus palaestinus -0.004 -0.2 -0.288 146.288
Avena barbata -0.001 -0.1 -0.072 146.072
Brassica tournefortii 0.003 0.1 0.1872 145.8128
Bromus rigidus 0.005 0.3 0.3888 145.6112
Centaurea procurrens 0.012 0.6 0.8928 145.1072
Centropodia forskalii 0.035 1.8 2.592 143.408
Corynephorpus
articulates 0.002 0.1 0.1152 145.8848
Crepis aculeate 0.024 1.2 1.8 144.2
Cyperus macrorrhizus 0.008 0.4 0.576 145.424
Daucus glaber 0.004 0.2 0.3024 145.6976
Echinops philistaeus 0.017 0.9 1.2528 144.7472
Echium angustifolium -0.003 -0.1 -0.2016 146.2016
Erodium laciniatum 0.003 0.2 0.2448 145.7552
Euphorbia terracina 0.003 0.2 0.216 145.784
Fumaria judaica -0.011 -0.6 -0.8352 146.8352
Galium parine 0.000 0.0 -0.0288 146.0288
Geranium
robertianum -0.036 -1.9 -2.7216 148.7216
Hormuzakia aggregate 0.005 0.3 0.3744 145.6256
Ifloga spicata 0.007 0.4 0.5328 145.4672
Lagurus ovatus -0.001 0.0 -0.0576 146.0576
Lamium amplexicaule -0.009 -0.5 -0.7056 146.7056
Lathyrus marmoratus -0.001 -0.1 -0.072 146.072
Lotus halophilus 0.004 0.2 0.3024 145.6976
Lupinus angustifolius 0.01 0.5 0.7776 145.2224
Lupinus palaestinus 0.022 1.1 1.656 144.344
Maresia pulchella 0.007 0.4 0.5328 145.4672
Neurada procumbens 0.000 0.0 0.0144 145.9856
Pancratium 0.012 0.6 0.8928 145.1072

29
maritimum
Plantago sarcophylla 0.000 0 0.0144 145.9856
Polycarpon
succulentum 0.002 0.1 0.1728 145.8272
Prasium majus -0.002 -0.1 -0.1872 146.1872
Retama raetam 0.32 16.4 23.9472 122.0528
Rumex
bucephalophorus 0.051 2.6 3.7728 142.2272
Rumex pictus 0.122 6.3 9.1296 136.8704
Senecio joppensis 0.131 6.7 9.8208 136.1792
Sonchus oleraceus -0.004 -0.2 -0.3024 146.3024
Stipagrostis lanata 0.022 1.1 1.6272 144.3728
Tolpis virgata -0.007 -0.3 -0.504 146.504
Trifolium tomentosum 0.000 0.0 -0.0144 146.0144
Trisetaria linearis 0.004 0.2 0.288 145.712
Urospermum picroides 0.003 0.2 0.2304 145.7696

30
Appendix B: Ecological-economic characteristics of the two sand dunes types
Table B1:
Ecological – economic value of species under active management (mobile dunes)
Species Ecological
value of
species i
Relative
ecological
index
Economic
contribution
(NIS)
Ammophila arenaria* 0.340 12.6 31.74418
Artemisia
monosperma
0.845 31.3 78.91806
Asparagus horridus 0.004 0.1 0.3237
Atractylis carduus* 0.005 0.2 0.49634
Centropodia forskalii 0.273 10.1 25.50756
Corynephorus
articulatus
0.004 0.1 0.36686
Cutandia
memphitica*
0.010 0.4 0.94952
Cyperus
macrorrhizus
0.006 0.2 0.56108
Echinops philistaeus 0.003 0.1 0.25896
Echium angustifolium -0.002 -0.1 -0.17264
Hormuzakia
aggregate
0.011 0.4 1.01426
Ifloga spicata 0.014 0.5 1.25164
Launaea fragilis* 0.011 0.4 1.079
Maresia pulchella 0.018 0.7 1.64008
Polycarpon
succulentum
0.006 0.2 0.58266
Polygonum
palaestinum*
0.265 9.8 24.77384
Retama raetam 0.106 3.9 9.9268
Rumex pictus 0.121 4.5 11.3295
Scrophularia
hypericifolia*
0.271 10.0 25.33492
Senecio joppensis 0.374 13.9 34.9596
Senecio
leucanthemifolius*
-0.008 -0.3 -0.7553
Silene succulenta * 0.005 0.2 0.49634
Sonchus oleraceus -0.002 -0.1 -0.17264
Stipagrostis lanata 0.006 0.2 0.60424
Tolpis virgata -0.001 0.0 -0.06474
Trisetaria linearis 0.014 0.5 1.27322
Vulpia fasciculate* 0.000 0.0 0
*Endemic species
31
Table B2:
Ecological – economic value of species under passive management (stabilized
dunes)
Species Ecological
value of
species i
Relative
ecological
index
Economic
contribution
(NIS)
Anagallis arvensis -0.006 -0.3 -0.4752
Arenaria leptoclados -0.005 -0.2 -0.36
Artemisia
monosperma 1.191 61 89.0064
Asparagus horridus 0.014 0.7 1.0512
Astragalus palaestinus -0.004 -0.2 -0.288
Avena barbata -0.001 -0.1 -0.072
Brassica tournefortii 0.003 0.1 0.1872
Bromus rigidus 0.005 0.3 0.3888
Centaurea procurrens 0.012 0.6 0.8928
Centropodia forskalii 0.035 1.8 2.592
Corynephorpus
articulates 0.002 0.1 0.1152
Crepis aculeate 0.024 1.2 1.8
Cyperus macrorrhizus 0.008 0.4 0.576
Daucus glaber 0.004 0.2 0.3024
Echinops philistaeus 0.017 0.9 1.2528
Echium angustifolium -0.003 -0.1 -0.2016
Erodium laciniatum 0.003 0.2 0.2448
Euphorbia terracina 0.003 0.2 0.216
Fumaria judaica -0.011 -0.6 -0.8352
Galium parine 0.000 0.0 -0.0288
Geranium
robertianum -0.036 -1.9 -2.7216
Hormuzakia aggregate 0.005 0.3 0.3744
Ifloga spicata 0.007 0.4 0.5328
Lagurus ovatus -0.001 0.0 -0.0576
Lamium amplexicaule -0.009 -0.5 -0.7056
Lathyrus marmoratus -0.001 -0.1 -0.072
Lotus halophilus 0.004 0.2 0.3024
Lupinus angustifolius 0.01 0.5 0.7776
Lupinus palaestinus 0.022 1.1 1.656
Maresia pulchella 0.007 0.4 0.5328

32
Neurada procumbens 0.000 0.0 0.0144
Pancratium
maritimum 0.012 0.6 0.8928
Plantago sarcophylla 0.000 0 0.0144
Polycarpon
succulentum 0.002 0.1 0.1728
Prasium majus -0.002 -0.1 -0.1872
Retama raetam 0.32 16.4 23.9472
Rumex
bucephalophorus 0.051 2.6 3.7728
Rumex pictus 0.122 6.3 9.1296
Senecio joppensis 0.131 6.7 9.8208
Sonchus oleraceus -0.004 -0.2 -0.3024
Stipagrostis lanata 0.022 1.1 1.6272
Tolpis virgata -0.007 -0.3 -0.504
Trifolium tomentosum 0.000 0.0 -0.0144
Trisetaria linearis 0.004 0.2 0.288
Urospermum picroides 0.003 0.2 0.2304