Embed Size (px)
DESCRIPTION
Eco- Friendly Integrated Multienterprises Model For Livelihood Security In Small Farm Holidings, CSSRI
Citation preview

Central Soil Salinity Research InstituteKARNAL-132 001 INDIA
Eco-friendly Integrated Multienterprise Model for Livelihood Security in
Small Farm Holdings
Technical Bulletin : CSSRI/Karnal/2009/05
20091969
C
S R
I
S
N.S. SirohiSurinder MohanDilbag SinghKailash
Gurbachan SinghH.S. JatAshok KumarKapila Sekhawat
N.P.S. YaduvanshiR.S. TripathiLalita BatraR.S. Pandey
P.C. SharmaS.K. ChaudhariS.K. SinghS.S. Kundu
The Multi-disciplinary Research Team

Citation :
Published by:
Front Cover Page Photo:
Technical Editing:
Designed & Printed at :
Tripathi, R.S., Batra, Lalita, Pandey, R.S., Sharma, P.C., Chaudhari, S.K., Singh, S.K., Kundu, S.S., Sirohi, N.S., Mohan, Surinder, Singh, Dilbag and Kailash. Eco-friendly Integrated Multienterprise Model for Livelihood Security in Small Farm Holdings. Central Soil Salinity Research Institute, Karnal-132001 (Haryana), India. Technical Bulletin : CSSRI/Karnal/2009/05, pp28.
Director, Central Soil Salinity Research Institute, Zarifa Farm, Kachhwa Road, Karnal-132001 (Haryana), IndiaTelephone: +91-184-2290501; Fax: +91-184-2290480, 2292489E-mail : [email protected]; [email protected] : www.cssri.org
Components of Integrated Multienterprise Model at the CSSRI experimental farm, Karnal
Randhir Singh
Azad Hind Stores (P) Ltd.SCO 34, Above VanHeusen, Sector 17-E, ChandigarhTel.: +91-172-2704511-514, Telefax : +91-172-2704513Email : [email protected]
Singh, Gurbachan, Jat, H.S., Kumar, Ashok, Sekhawat, Kapila, Yaduvanshi, N.P.S.,

2009
Central Soil Salinity Research Institute KARNAL-132 001 INDIA
Technical Bulletin : CSSRI/Karnal/2009/05
ICARHkkd̀vauqi
Eco-friendly Integrated Multienterprise Model for Livelihood Security in Small Farm Holdings
Gurbachan Singh
H.S. Jat
Ashok Kumar
Kapila Sekhawat
N.P.S. Yaduvanshi
R.S. Tripathi
Lalita Batra
R.S. Pandey
P.C. Sharma
S.K. Chaudhari
S.K. Singh
S.S. Kundu
N.S. Sirohi
Surinder Mohan
Dilbag Singh
Kailash
: Director and Team Leader
: Agronomist
: Agronomist
: Agronomist
: Soil Scientist
: Agriculture Economist
: Microbiologist
: Soil Water Conservation Engineer
: Plant Physiologist
: Soil Physicist
: Fisheries Scientist
: Animal Nutritionist
: Senior Veterinary Officer
: Farm Manager
: Farm Assistant
: Lab Assistant
The Multi-disciplinary Research Team
1969
C
S R
I
S

1. Executive Summary 1
2. Introduction 2
3. Multienterprise Model 3
4. Multienterprise Components 4
4.1 Dairy component 7
4.2 Vegetables and fruits production on the dykes of the pond 9
4.3 Poultry production 10
4.4 Rearing of ducks 11
4.5 Mushroom production 11
4.6 Fish production 12
4.7 Bee-keeping 13
4.8 Productivity and economics of the cropping systems 13
5. Recycling of Resources 16
5.1 Recycling of FYM within the system 17
6. Quality of the Soil on Pond Dykes 18
7. Soil Health and Quality 19
7.1 Soil physical quality 19
7.2 Soil chemical quality 19
7.3 Soil biological quality 21
8. Water Quality in the Pond 22
8.1 Use of fish pond water for crop production 24
9. Water Balance of the Pond 25
10. Resource and Energy Conservation for Environmental Quality 25
11. Up-scaling Multienterprise Model for Enhanced Productivity 26
CONTENTSPage

ECO-FRIENDLY INTEGRATED MULTIENTERPRISE MODEL FOR LIVELIHOOD SECURITY IN SMALL FARM HOLDINGS
1. Executive Summary
Nearly 65 percent of the Indian population is dependent upon agriculture to earn livelihood and
employment. More than 50 percent of the farmers in India cultivate less than one ha (2.5 acre) land holding.
To earn reasonable livelihood from such a small land holding for a family of 5-6 persons and an equal
number of cattle is a debatable issue. Further, in the present scenario of increasing human and livestock
populations; decreasing land to man ratio; conversion of productive agricultural lands for non-
agricultural use; deteriorating natural resources (soil, water, climate and biodiversity) and decreasing
total factor productivity (in single crop, commodity and enterprise based farming), a new research and
development strategy is called upon to restore livelihoods of small and marginal farmers. Concerns of
quality conscious society with increased demand for organic food, increasing indebtedness of farmers and
associated suicides; WTO agreement and climate change trigged frequent occurrences of natural
calamities like droughts and floods, heat and cold waves are other compelling reasons of a paradigm shift
in our approach from single crop, commodity and enterprise based farming to multienterprise
agriculture. In the past, vast synergies available with different farm enterprises remained largely under-
exploited due to crop or commodity driven policies. Changing consumption and demand patterns and
emerging marketing and trade opportunities are offering ample opportunities for greater diversification
of agriculture systems to suit to the declining size of land holdings in India. The potential of integration of
dairy, poultry, piggery, duckery, fishery, beekeeping, vermin-composting and horticulture with
dominant crops/cropping systems needs to be exploited to make judicious use of farm inputs, resource
management, regular income and year round employment generation on the small land holding. A
comprehensive information about the multienterprise agriculture model developed at the Central Soil
Salinity Research Institute (CSSRI), Karnal to improve water, nutrient and energy use efficiency in
reclaimed/salt stressed environment is reported in this bulletin. Three and half years results indicated that
a total gross income of Rs. 400-700/day and net income of Rs. 250-500/day can be generated from about 1.0
hectare land area when fisheries, dairy, horticulture, poultry, duckery and mushroom cultivation are
integrated and byproducts of these enterprises are recycled within the system. Cultivation of vegetables
on the dykes of the fish pond yielded about Rs. 100-400/week throughout the year. The model revealed
that animal dung from the dairy component can be used as feed for fish, to generate biogas and electricity
and to make compost to practice organic agriculture. The compost generated through decomposition of
crop residues with cow dung in a series of compost pits was sufficient to meet nutritional requirement of
fruit trees and vegetables planted on the dykes of the fish pond. Since no chemicals (fertilizers and
pesticides) were used to grow vegetables and fruits during the study period the produce can be graded as
organically produced. The experiences reveal that large scale adoption of such multienterprise agriculture
will require an effective network of marketing, post harvest processing, value addition, cold chain,
specialized handling and transport system, marketing intelligence, price support and export
opportunities. Required research, development and policy initiatives to up-scale this kind of
diversification in small farm holdings are also suggested.
Eco-friendly Integrated Multienterprise Model for Livelihood Security in Small Farm Holdings
1

2. Introduction
Continuous cultivation of rice-wheat cropping system for over four decades in Indo-gangetic alluvial
plains has set in the processes of degradation in the natural resources of water, soil, climate and
biodiversity. Depletion of under ground water, declining fertility status associated with multiple nutrient
deficiencies, increased concentration of green house gases in the atmosphere owing to large scale burning
of rice and wheat residues are some of the end results of this farming system. Most of shallow cavity tube
wells (centrifugal pumps) in the Punjab and Haryana states have gone out of use consequently these being
replaced with deep bore wells (submersible pumps) which cost now more than one lac rupees, which a
small farmer is unable afford. Apart from these, the average land holdings continues to shrink, making
profits from these crops to decrease and thus causing unsustainability and migration of farmers to urban
areas and also selling of agriculture lands. Nearly 50 percent of the farmers in India cultivate less than one
ha land holding. A farmer with a family of 5-6 persons and almost equal number of cattle is unable to coup-
up with his daily expenditure from rice-wheat rotation. The recent National Sample Survey figures
indicated that 40% farmers in India intend to quit farming. Scientific efforts made in the past to improve
soil and water quality and to moderate green house gas emissions through better management of inputs
and practices have not yielded tangible results to hault this degradation trend. Rice-wheat cropping
system provides income to farmers only twice a year when the crops are harvested during early summer or
early winter but a farmer needs regular income to meet out his day-to-day needs. This, therefore, calls for
an urgent need to reorient the present ways of doing agriculture to those that can improve water
productivity, increase use efficiency of nutrients and energy as well as provide regular income to meet
farmers daily needs. There is also a need to reverse the natural resource degradation trend and restore the
farmers' confidence in agriculture. Increasing income of the farmer per unit land and water by shifting
from a crop, commodity and enterprise based agriculture to integrated multienterprise system is called
for. The hypothesized mixed farming systems will also provide much needed proofing for climate change
related aberrations such as drought, floods, heat and cold waves etc. Integrated farming system with
multienterprise may pave the way for realizing increased productivity and profitability through
integrated use of water, nutrient and energy in small farms. Multienterprise agriculture may also has the
potential to decrease cultivation cost by synergetic recycling of bi-products/residues of various
components within the system and also a regular source of income and employment. Keeping this in view,
a multienterprise agriculture project was initiated at the experimental farm of Central Soil Salinity
Research Institute, Karnal in 2006 as a model for 2.0 ha land with interdisciplinary approach. Main theme
of this project was to develop farming options/capsules, which the small farmers can adopt to earn
livelihood from his one or two ha reclaimed alkali land holding and also the adopted practices contribute
to the reversion in degradation of natural resources. The philosophy behind multienterprise agriculture is
that a farmer can adopt enterprises such as dairying, horticulture, floriculture, bee keeping, vegetable,
poultry, duckery, piggery, mushroom, fisheries, gobar gas plant and solar heater etc. depending upon his
resources, marketing and processing options to improve his family income and generate employment for
the family at farm level.
Objectives
vComparative evaluation of crop, commodity and enterprise diversification options in the
reclaimed sodic land under small farm holding
vTo increase water, nutrient and energy use efficiency through diversified agriculture systems
thereby contributing to moderate predicted climate changes
TECHNICAL BULLETIN : CSSRI/KARNAL/2009/05 2
ECO-FRIENDLY INTEGRATED MULTIENTERPRISE MODEL FOR LIVELIHOOD SECURITY IN SMALL FARM HOLDINGS
To increase farmer income by reducing cost of cultivation through recycling and better use of
residues within the system
vQuantification of chemical, physical and biological changes in soil under different land-use
options for improved soil health and quality
vTo identify profitable, sustainable and eco-friendly agriculture model for one and two hectare
reclaimed land holdings to provide livelihood security to small and marginal farmers
A farming system model has been developed for 2 ha land holding with the following enterprises;
i) Agricultural crop production and horticulture on about 1.0 ha (rice-wheat, maize-wheat-
moong, winter maize-soybean, pigeonpea-mustard-fodder maize) and fruits/vegetables/
floriculture.
ii) Fisheries, dairy, fruits, vegetables (on dykes of the pond), fodder, poultry, duckery, mushroom,
gobar gas plant and solar heater in an area of about 1.0 ha.
Before the start of the experiment, benchmark information on initial chemical, physical and biological
properties of the soil was generated from different components of the model. On an average, the initial pH 2
of the cropped area was 8.1 in the upper 60 cm layer and was more than 8.5 in lower layers. The soil was
low in available N, but high in P and K in all the systems. The concentrations of DTPA extractable Zn, Fe, -1Mn and Cu ranged from 0.85 to 2.41; 7.51 to 18.56; 5.56 to 8.40 and 0.81 to 2.18 mg kg , respectively. The soil
-1on the dykes of the pond towards west was highly alkaline with pH 10.25 and EC 4.0 dSm , while in east 2
-1direction the pH was 8.3 and EC 1.65 dSm , respectively. The surface soil layers were sandy loam in
texture and in the deeper layers clay content ranged from 19-25% throughout the depth. The surface bulk -3density varied from 1.5 to 1.6 g cm . Overall, these soils are well drained with infiltration rate ranging
between 5-10 mm day. Being low in organic carbon, they however, are vulnerable to dispersion and
crusting especially after rain storm and are thus prone to water stagnation at times. The initial microbial -1biomass carbon varied from 180 to 281.1 mg C kg soil. Soil respiration varied from 46.6 to 63.2 mg CO 2
-1evolved g dry soil and specific metabolic quotient 1.9 to 3.3. Microbial nitrogen and phosphorous flush -1varied from 44.5 to 72.3 and 0.6 to 2.6 mg kg , respectively. Dehydrogenase activity was in the range of 42.6
-1 -1to 172.4 Mg TPFg dry soil. Similarly, acid phosphatases varied from 23.3 to 52.4 Mg PNPg dry soil.
Tentative area under pond and other components is given below :
Fish Pond 0.2 ha; animal shed 15 m x 21 m; poultry shed 7.2 x 3.7 m; duckery 3 m x 6 m; mushroom 3.5 x 6 m;
gobar gas plant 7m x 6m and compost pits (4) 8.8 m x 2.1 m; 6.6 x 2.9 m; 4.5 m x 3.0 m and 2.4 m x 1.5 m
Hundred plants of banana, 28 of guava, 30 of karaunda and 30 of aonla were planted on the dykes during
July-August, 2006. Inter-spaces between fruit trees on the dykes were used for raising seasonal vegetables
in rotations. Almost all kharif and rabi vegetables were cultivated on the dykes during the study period. No
chemical fertilizers and pesticides were used to grow fruits and vegetables throughout the study period.
The compost prepared in the compost pits was enough to meet nutritional requirement of plants. The
additional FYM/compost was sold at the existing market rates.
A multi-disciplinary research team representing the disciplines of agronomy, soil chemistry, soil physics,
soil microbiology, soil water conservation engineering, plant physiology, animal sciences, fisheries and
v
3. Multienterprise Model
3

TECHNICAL BULLETIN : CSSRI/KARNAL/2009/05
agricultural economics was involved in the in-depth analysis of respective components. The ultimate goal
is to work out water, salt, energy, nutrient and gas exchange balance in the individual components and
total system for modelling and up-scaling.
Various components are the integrated parts of multienterprise agriculture model since its inception. The
animals not only provide milk but they also provide dung, which is used for composting and biogas
generation. The compost prepared from dung was used for improving the soil health of the pond dykes,
which was used for cultivation of fruits and vegetables. Biogas generated from the dung is used for
cooking and lighting. Total revenue generated, expenditure and net income from the animal products
(milk+compost+biogas), fruit and vegetable on dykes, fish, poultry, ducks and mushroom on yearly and
per day basis are presented in Tables 1 and 2. The revenue generation from animal products
(milk+compost+biogas), fruit and vegetable on dykes, fish, poultry ducks and mushroom was Rs. 115824,
210132 and 204970 for the years 2007, 2008 and 2009, respectively. The net income from the different
components was Rs. 75390, 150844 and 141196 for the last three years, respectively.
4. Multienterprise Components
Per day revenue generation from animal products (milk+compost+biogas), fruits and vegetables on
dykes, fish, poultry, ducks and mushroom was Rs. 386, 700 and 683 for the years 2007, 2008 and 2009,
respectively, while the per day expenditure was Rs. 135, 198 and 213, respectively. The per day net income
from different components was Rs. 251, 503 and 471 for the last three years, respectively.
Total and per day average revenue generation, expenditure and net income over the last three years (April
2007 to October 2009) from the animal products (milk+compost+biogas), fruits and vegetables on dykes,
fish, poultry, ducks and mushroom is presented in Table 3. Average revenue generation, expenditure and
net income from the different components were Rs. 176975, 54499 and 122477, respectively. However, per
day revenue generation, expenditure and net income from the respective components was Rs. 590, 182 and
Components Revenue generation (Rs.) Expenditure (Rs.) Net income (Rs.)
April-Dec, 07
Jan.-Dec, 08
Jan.-
Oct, 09 April-
Dec, 07
Jan.-Dec, 08
Jan.-
Oct, 09 April
Dec, 07 Jan.-
Dec, 08
Jan.-
Oct, 09
Milk +
Compost +
Biogas 104281 163748 150436 38560 47388 42454 65721 116360 107982
Fruits and
vegetables on pond
dykes
5923 17388 25868 - - - 5923 17388 25868
Fish 5620 23521 13239 1874 4390 1500 3746 19131 11739
Poultry & Ducks
- 1500 13657 - 5510 17820 - -4010 -4163
Mushroom
-
3975
1770
-
2000
2000
-
1975
-230
Total
115824
210132
204970
40434
59288
63774
75390
150844
141196
Table 1 : Year-wise revenue generation, expenditure and net income by different components
4

ECO-FRIENDLY INTEGRATED MULTIENTERPRISE MODEL FOR LIVELIHOOD SECURITY IN SMALL FARM HOLDINGS
Table 2 : Year-wise per day revenue generation, expenditure and net income in different multienterprise components
Table 3 : Average and per day revenue generation, expenditure and net income over three years from
April 2007 to October 2009
Multienterprise Components
Revenue generation (Rs.) Expenditure (Rs.) Net income (Rs.)
Total Per day Total Per day Total Per day
Milk + Compost + Biogas 139488.30
464.96
42800.67
142.67
96687.67
322.29
Fruits and vegetables on dykes of pond
16393.00 54.64 00.00 00.00 16393.00 54.64
Fish
14126.67
47.09
2588.00
8.63
11538.67 38.46
Poultry & Ducks
5052.33
16.84
7776.67
25.92 -2724.33
-9.08
Mushroom
1915.00
6.38
1333.33
4.44
581.67
1.94
Total 176975.30 589.92 54498.67 181.66 122476.7 408.26
408. Poultry and duckery components did not prove profitable. Per day loss was worked out to the tune of
Rs 9. The net income from the mushroom component was also not encouraging.
Components Per day revenue generation (Rs.)
Per day expenditure (Rs.)
Per day net income (Rs.)
April-
Dec, 07
Jan.–
Dec, 08
Jan.- Oct, 09
April-
Dec, 07
Jan.–
Dec, 08
Jan.- Oct, 09
April– Dec, 07
Jan. – Dec, 08
Jan. – Oct, 09
Milk + Compost +
Biogas 347.60 545.83 501.45 128.53 157.96 141.51 219.07 387.87 359.94
Fruits and
vegetables on pond
dykes
19.74 57.96 86.23 - - - 19.74 57.96 86.23
Fish 18.73 78.40 44.13 6.25 14.63 5.00 12.49 63.77 39.13
Poultry &
Ducks - 5.00 45.52 - 18.37 59.40 - -13.37 -13.89
Mushroom - 13.25 5.90 - 6.67 6.67 - 6.58 -0.77
Total 386.08 700.44 683.23 134.78 197.63 212.58 251.30 502.81 470.65
Per day returns were worked out for the months April 2007 to October 2009, about 3 years after
establishment of the model. During the month, per day income came from the sale of animal products
(milk+biogas+compost), vegetables grown on the dykes of the pond, fish, poultry and mushroom. The
revenue generated/day from animals (milk+biogas+compost), vegetables, fishes, poultry and mushroom
was around Rs.465, 55, 47, 17 and 6 respectively. The net income generated/day from animals
5

TECHNICAL BULLETIN : CSSRI/KARNAL/2009/05
Fig 1 : Average and per day revenue generation, expenditure and net income from different components
(milk+biogas+compost), vegetable, fish and mushroom was around Rs.322, 55, 38, and 2, respectively.
This income is likely to increase with the passage of time when other components like fruits, poultry,
mushroom and duckery will also start yielding revenue with full potential. In addition, daily requirement
of energy for cooking and electricity generation is met without incurring any additional expenditure. The
Average and per day revenue generation, expenditure and net income from different components are
depicted in Fig. 1.
-100
0
100
200
300
400
500
600
700
Per
da
yre
ven
ue,
ex
pe
nd
itu
rean
dn
et
inc
om
e
Per day Revenue
Per day Expenditure
Per day Net income
Milk
+Com
post+B
ioga
s
Fruits
& V
eget
ables
Fish
Poultr
y & D
ucks
Mus
hroo
m
All Com
pone
nts
-200000
20000400006000080000
100000120000140000160000180000200000
Avera
ge
rev
en
ue
,e
xp
en
dit
ure
an
dn
et
inco
me
Revenue
Expenditure
net income
Milk
+Com
post+B
ioga
s
Fruits
& V
eget
ables
Fish
Poultr
y & D
ucks
Mus
hroo
m
All Com
pone
nts
6
ECO-FRIENDLY INTEGRATED MULTIENTERPRISE MODEL FOR LIVELIHOOD SECURITY IN SMALL FARM HOLDINGS
Healthy buffaloes of multienterprise Model
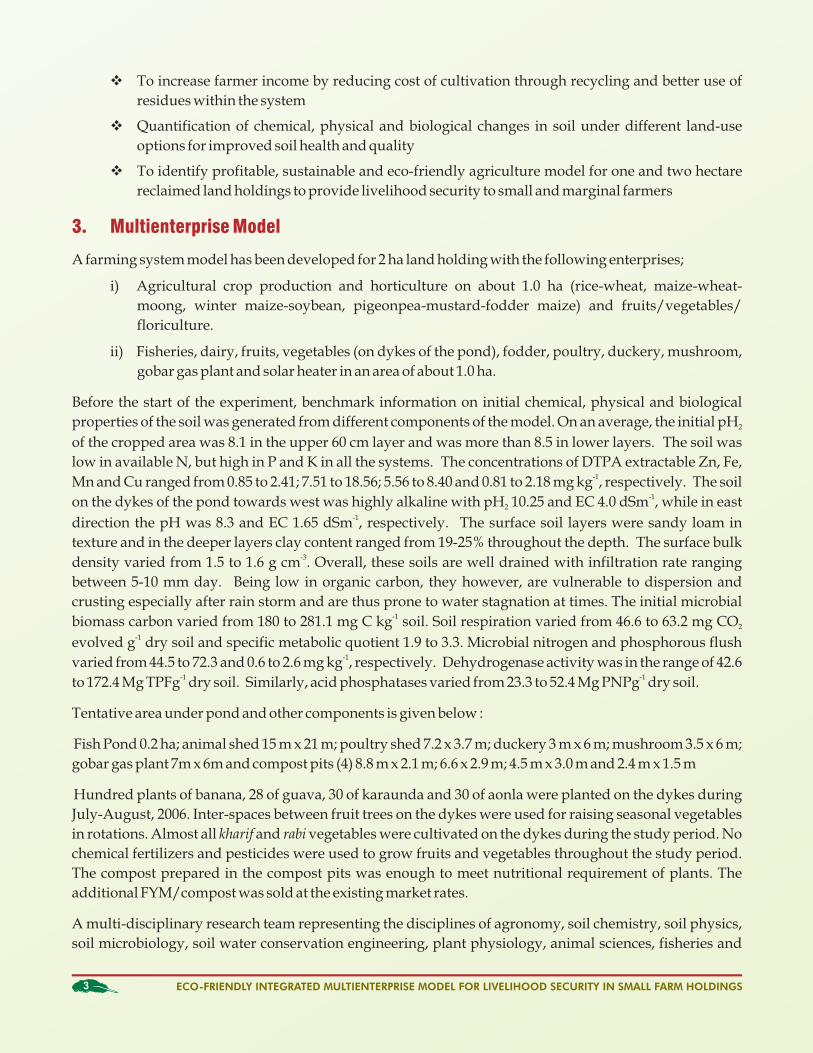
4.1 Dairy component
Four buffaloes were purchased from National Dairy Research Institute (NDRI), Karnal on book value on
April 24, 2007 for a total cost of Rs.66500/-. The total milk production from buffaloes between April 24 and
May 17, 2008 was 6263.25 litres. The total income from the sale of this milk was Rs. 112834. Three cows
were purchased from NDRI on October of 2007 on book value for Rs. 41943. Between October 6, 2007 to
May 17, 2008, 4835 litres of milk was obtained, which was sold for Rs. 63610. Milk obtained from buffaloes
and cows was sold to the staff members of CSSRI, Karnal on a concessional rate. The total revenue
generation, expenditure and net income from the milk production during the study period (April 2007 to
October 2009) is given in Tables 5-7. During this period one buffalo and 4 heifers were sold for Rs. 32000.
Between April 2007 and October 2009, the annual average revenue generation from the milk was Rs.
132655 (Table 4). The highest revenue was generated during the year 2008. Higher monthly revenue
generation (About Rs. 18000) was observed in the month of January, February and March as compared to
other months. The green fodder supply to the animals was ensured from 0.4 hectare land area marked for
fodder production in which mostly berseem and oat during winter and sorghum, maize and bajra during
summer were grown. The expenditure incurred on purchasing of feed, wheat straw and medicine is
presented in Table 5. The average expenditure over the years was Rs. 40301. The highest expenditure was
made in the months of January, February, April and June The monthly net income from the dairy
component is presented in Table 6. Per day average net income from the milk production was Rs. 248
during the three years. These studies revealed that the milk production unit can be considered as 'core unit'
of multienterprise, which gives regular income and employment to the farmer's family.
7

TECHNICAL BULLETIN : CSSRI/KARNAL/2009/05
Year 2007 (Rs.)
Year 2008 (Rs.)
Year 2009 (Rs.)
Total (Rs.)
Average (Rs.)
-
18959
20466
39425.0
19712.50 -
17622
18332
35954.0
17977.00
-
16120
20732
36852.0
18426.00 1079.5
11499
17040
29618.5
9872.83
7153.0
10073
14326
31552.0
10517.33 11772.5
5635
12222
29629.5
9876.50
10195.8
3637
10090
23922.8
7974.25 10042.8
6330
7632
24004.8
8001.58
7777.5
15248
6843
29868.5
9956.17 18434.0
17328
6753
42515.0
14171.67
19459.0
18232
-
37691.0
9116.00 17617.0
19315
-
36932.0
9657.50
103531.0
159998
134436
397965.0
132655.00
Months
Jannuary
February March
April May
June July August
September October
November December Total
Table 4 : Monthly revenue generation (Rs.) from the sale of milk production over the years
Average (Rs.)
5003.50
4693.50
4978.00
3893.33
5118.00
3280.67
2925.00
2578.00
3485.00
5000.00
5810.00
4296.00
43300.67
Total (Rs.)
10007
9387
9956
11680
15354
9842
8775
7734
10455
15000
11620
8592
129902
Year 2009 (Rs.)
4737
4587
5480
6525
7589
4507
3965
594
1950
2520
-
-
43954
Year 2008 (Rs.)
5270
4800
4476
4275
3750
2285
1880
3620
4240
4480
4920
3392
47388
Year 2007 (Rs.)
-
-
-
880
4015
3050
2930
3520
4265
8000
6700
5200
38560
Months
Jannuary
February
March
April
May
June
July
August
September
October
November
December
Total
Table 5 : Monthly expenditure (Rs.) from the sale of milk production over the years
Table 6 : Monthly net income (Rs.) from the sale of milk production over the years
Year 2007 (Rs.)
Year 2008 (Rs.)
Year 2009 (Rs.)
Total (Rs.)
Average (Rs.)
Per day Average (Rs.)
- 13689 15729 29418.00 14709.00 490.30
- 12822 13745 26567.00 13283.50 442.78
- 11644 15252 26896.00 13448.00 448.27
199.50 7224 10515 17938.50 5979.50 199.32
3138.00 6323 6737 16198.00 5399.33 179.98
8722.50 3350 7715 19787.50 6595.83 219.86
7265.75 1757 6125 15147.75 5049.25 168.31
6522.75 2710 7038 16270.75 5423.58 180.79
3512.50 11008 4893 19413.50 6471.17 215.71
10434.00 12848 4233 27515.00 9171.67 305.72
12759.00 13312 - 26071.00 3306.00 110.20
12417.00 15923 - 28340.00 5361.50 178.72
64971.00 112610 90482 268063.00 89354.33 248.21
Months
Jannuary
February
March
April
May
June
July
August
September
October
November
December
Total
8
ECO-FRIENDLY INTEGRATED MULTIENTERPRISE MODEL FOR LIVELIHOOD SECURITY IN SMALL FARM HOLDINGS
0
5000
10000
15000
20000
25000Ja
nnua
ryFeb
ruar
yM
arch
Apr
ilM
ayJu
ne July
Aug
ust
Sep
tem
ber
Oct
ober
Nov
embe
rD
ecem
ber
Inco
me
(R
s.)
revenue
expenditure
net income
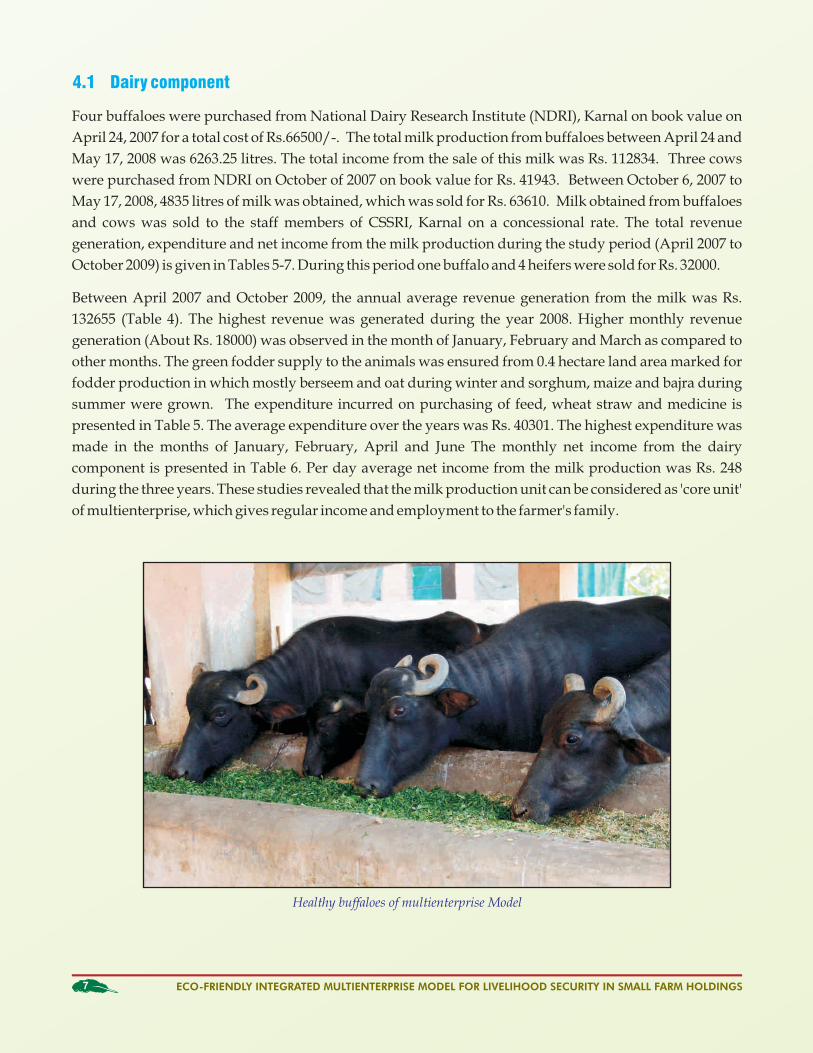
Fig 2 : Average monthly revenue generated, expenditure and net income from the milk production over the years
Average monthly revenue generation, expenditure and net income are presented in Fig 2. The highest net
income was recorded from January to March and after that it started decreasing till August. The net income
is governed by the lactation period of the animals
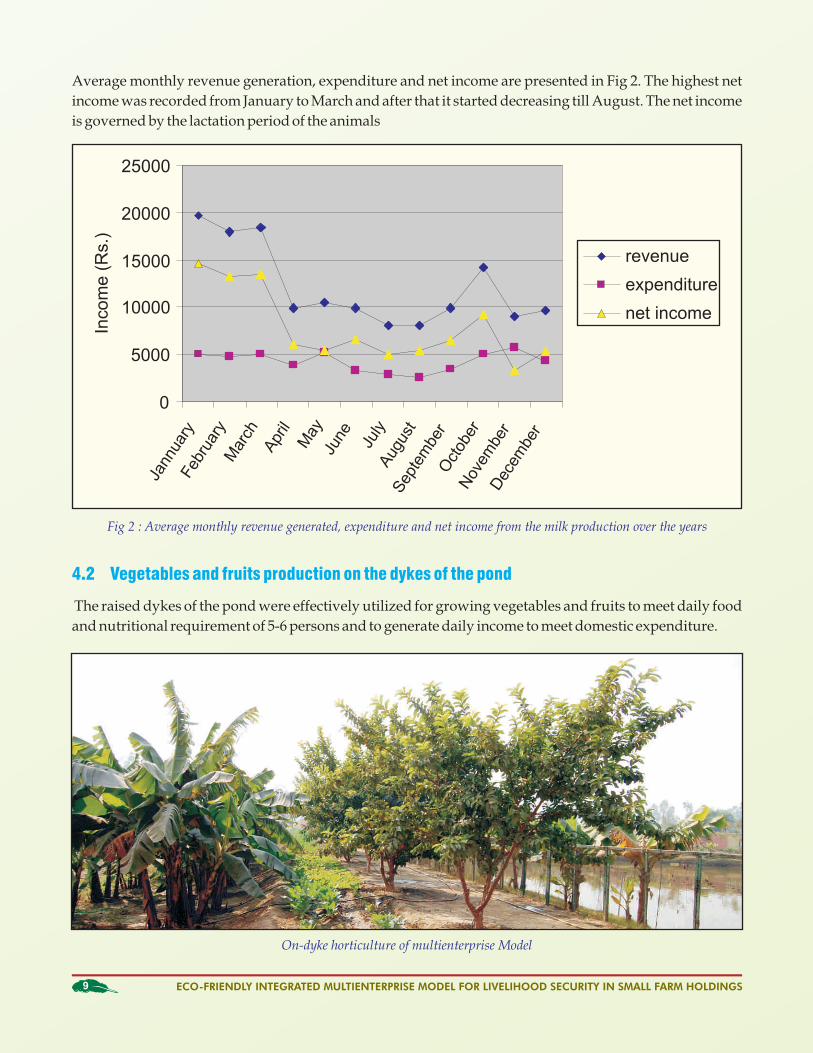
On-dyke horticulture of multienterprise Model
4.2 Vegetables and fruits production on the dykes of the pond
The raised dykes of the pond were effectively utilized for growing vegetables and fruits to meet daily food
and nutritional requirement of 5-6 persons and to generate daily income to meet domestic expenditure.
9

TECHNICAL BULLETIN : CSSRI/KARNAL/2009/05
Table 7 : Monthly revenue generation (Rs.) from fruits and vegetables grown on the dykes of the pond
during 2007-2009
Year 2007 (Rs.)
Year 2008 (Rs.)
Year 2009 (Rs.)
Total
(Rs.)
Average
(Rs.)
- 951 1626 2577 859.00
- 786 1423 2209 736.33
- 603 1756 2359 786.33
- 1167 1587 2754 918.00
105 1391 2770 4266 1422.00
206 2524 3047 5777 1925.67
822 2545 3697 7064 2354.67
654 2614 5011 8279 2759.67
680 1080 2515 4275 1425.00
1353 1057 2436 4846 1615.33
1144 1763 - 2907 969.00
959 907 - 1866 622.00
5923 17388 25868 49179 16393.00
Months
January
February
March
April
May
June
July
August
September
October
November
December
Total
Fruit plants grown on dykes of the pond vegetable component are irrigated by the pond water using drip
system run on solar-panel operated 1 HP pump. Per month income generated throughout the study period
varied from Rs. 105 to 5011. The monthly average varied from Rs. 622 to 2760 over the years. Month-wise
variations in income during 2006-07, 2007-08 and 2008-09 are given in Table 7. The fruit crops planted on
the dykes started bearing fruits in 2008 (about 2 years after planting). Between August 2006 and December
2008, 252 kg of banana, 82.5 kg of guava and 7.5 kg of karaunda was produced. The average net income
was Rs. 16393 over the years and it varied from Rs. 5923 to 25868. The income from fruits is likely to
increase several fold during the coming years.
4.3 Poultry production
The poultry component was introduced in the last
week of August 2008. The chicks numbering 120
of desi mixed breed were purchased for Rs.3000.
In a period of first three months, about 91 chicks
died because of some feed based infections
confirmed by the poultry expert. One of the hens
out of the remaining birds started laying eggs in
last week of December 2008.
During this period, about 80 kg litter from the
bedding material comprised of rice husk and
excreta of poultry birds were added into the
compost pit. In the year 2008, expenditure on the Healthy poultry birds feeding in the multienterprise Model
10

ECO-FRIENDLY INTEGRATED MULTIENTERPRISE MODEL FOR LIVELIHOOD SECURITY IN SMALL FARM HOLDINGS
Table 8 : Economics of poultry production
Poultry production Year 2008 Year 2009 Average
Total cost (Rs.) 5510 17820 11715.0
Gross income (Rs.)
1500
13657
7578.5
Net income (Rs.)
-4010
-4163
-4086.5
B:C ratio -0.73 -0.23 -0.5
purchase of chicks and poultry feed was Rs.5510. The gross income was only Rs. 1500. This component
incurred in a net loss of Rs. 4010. Almost similar trend was reported in the year 2009. Through poultry
production the model lost Rs 4086.50 every year instead of gaining profit. In 2009, an amount of Rs. 1500/-
was spent on the medicines for the poultry. Probably lack of technical expertise about the poultry
production with the team resulted in poor management of poultry. The B:C ratio was always negative in
poultry rearing. The economics of poultry production is presented in Table 8.
The component of duckery was introduced from September 2008. Hundred ducks were imported from
Bhubaneswar centre of the Central Avian Research Institute. Because of some feed based infection, 89
ducks died between September and November 2008.
At present 11 healthy ducks are remaining and started laying eggs. Rs.200 was spent on the medicines for
ducks. During the day time, the ducks swim in the fish pond, which facilitate aeration and increase oxygen
availability for fish. After the introduction of ducks, the mortality of fish in the pond has considerably
decreased.
The culture for raising mushroom as a part of the multienterprise agricultural system was prepared during
October-November 2008 using wheat straw and compost. Ten kg mushroom seeds were imported from
National Research Centre on Mushroom, Solan and sown in different trays. The trays were subsequently
placed in environmental controlled green house made from the local materials in the farm e.g. residues of
the crops, bamboo sticks etc.
4.4 Rearing of ducks
4.5 Mushroom production
11
Rearing of ducks in the fish pond has multiple benefits
TECHNICAL BULLETIN : CSSRI/KARNAL/2009/05
Table 9 : Productivity and profitability of mushroom production
Fishery adds multifold productivity to the Model
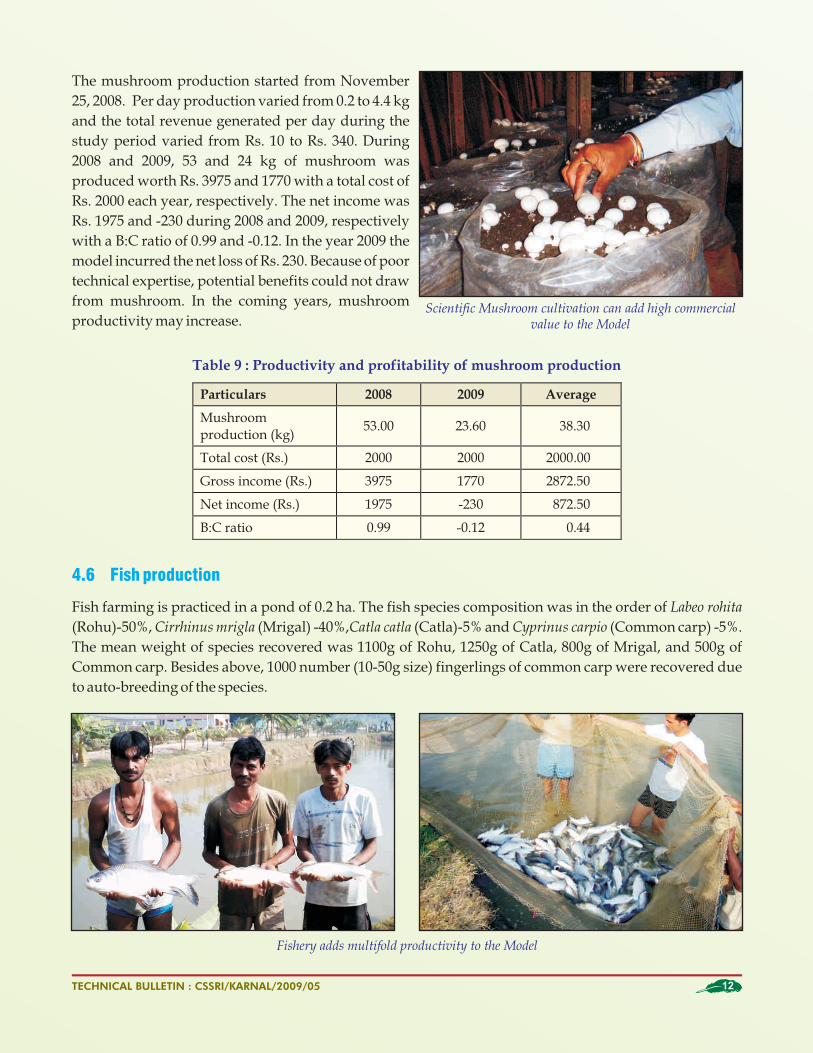
The mushroom production started from November
25, 2008. Per day production varied from 0.2 to 4.4 kg
and the total revenue generated per day during the
study period varied from Rs. 10 to Rs. 340. During
2008 and 2009, 53 and 24 kg of mushroom was
produced worth Rs. 3975 and 1770 with a total cost of
Rs. 2000 each year, respectively. The net income was
Rs. 1975 and -230 during 2008 and 2009, respectively
with a B:C ratio of 0.99 and -0.12. In the year 2009 the
model incurred the net loss of Rs. 230. Because of poor
technical expertise, potential benefits could not draw
from mushroom. In the coming years, mushroom
productivity may increase.
4.6 Fish production
Fish farming is practiced in a pond of 0.2 ha. The fish species composition was in the order of Labeo rohita
(Rohu)-50%, Cirrhinus mrigla (Mrigal) -40%,Catla catla (Catla)-5% and Cyprinus carpio (Common carp) -5%.
The mean weight of species recovered was 1100g of Rohu, 1250g of Catla, 800g of Mrigal, and 500g of
Common carp. Besides above, 1000 number (10-50g size) fingerlings of common carp were recovered due
to auto-breeding of the species.
Particulars 2008 2009 Average
Mushroom
production (kg)
53.00 23.60 38.30
Total cost (Rs.)
2000
2000
2000.00
Gross income (Rs.)
3975
1770
2872.50 Net income (Rs.)
1975
-230
872.50
B:C ratio 0.99 -0.12 0.44
12
Scientific Mushroom cultivation can add high commercial value to the Model

ECO-FRIENDLY INTEGRATED MULTIENTERPRISE MODEL FOR LIVELIHOOD SECURITY IN SMALL FARM HOLDINGS
Table 10 : Economics of fish production over the years in multienterprise agriculture model.
2006-07 2007-08 2008-09 Average
112.40 392.00 203.70 236.00
5620.00 23521.00 13239.00 14126.67
1874.00 4390.00 1500.00 2588.00
3746.00 19131.00 11739.00 11538.67
2.00 4.36 7.83 4.73
Particulars
Fish production (kg)
Revenue generation (Rs.)
Expenditure (Rs.)
Net income (Rs.)
B:C ratio
The partial harvesting of fingerlings was done to avoid growth competition with future stock. To increase
the productivity of pond, fresh stocking of different types of advance fish fingerling was done at the rate of
10,000/ha in the month of March 2009. After eight months, the fishes had to the size of 358.0mm/700g
(Catla), 376.0mm/600g (Rohu), 397.0mm/600g (Mrigal), 412.0mm/800g (Grass carp) and 286.0mm/600g
(Common carp). Mean weight of fishes was around 640g. Year-wise fish production economics is
presented in Table 10. The average net income and B:C ration of fish production was Rs. 11539 and 4.73
respectively. The average productivity of 0.2 ha fish pond was 236 kg/ year from.
2006-07 2007-08 2008-09 Average
343.00 106.00 53.50 167.50
24165.00 9228.00 2934.00 12109.00
41160.00 12660.00 8560.00 20793.33
16995.00 3432.00 5626.00 8684.33
0.70 0.37 1.92 0.72
Particulars
Honey production (kg)
Total cost (Rs.)
Gross income (Rs.)
Net income (Rs.)
B:C ratio
Table 11 : Economics of honey production
4.7 Bee-keeping
Bee-keeping is an economical enterprise that
requires less investment and space. Investment is
required only in the first year when system is
established. As a component of the system, 25 boxes
were placed in the farming system model area. The
average honey production was 167.50 kg over the
years. Gross income of Rs. 20793 was generated and
the total cost of Rs. 12109 was incurred in production
of honey. The net income of Rs. 8684 was obtained
with a B:C ratio of 0.72 from the bee keeping. The
comparative economics of this enterprise is
presented in Table 11.
4.8 Productivity and economics of the cropping systems
Economics of various components across the enterprises was computed using standard methodology, the
labour component was discounted. This is mainly because the model is developed for small and marginal
Beekeeping is the least investment component of the Model
13
TECHNICAL BULLETIN : CSSRI/KARNAL/2009/05
Table 12 : Average value of economics of crops grown during 2007-08 and 2008-09 (Rs./ha) in
multienterprise model
Operational Cost
(Rs./ha)
Gross income
(Rs./ha)
Net income
(Rs./ha)
B:C Ratio
20623.63 50825.00 30201.38 2.51
15485.48 58150.00 42664.53 3.38
15884.75 32345.00 16460.25 1.66
10290.13 14897.50 4607.38 0.95
14166.30 15632.00 1465.70 0.64
11270.35 750.00 -10520.35 0.07
8106.30 14598.25 6491.95 1.40
19869.90 49975.39 30105.48 2.01
11881.25 20392.50 8511.25 1.44
20749.63 33500.00 12750.38 1.26
6826.00
10000.00
3174.00
1.46
33643.63
79577.50
45933.88
2.35
42085.00
59080.77
16995.77
0.91
14556.09
26446.15
11890.07
1.22
7317.00
45900.00
38583.00
5.89
8400.50
35000.00
26599.50
4.17
9707.13
24000.00
14292.88
2.19
10351.50
22500.00
12148.50
2.17
8889.95
24000.00
15110.05
2.30
Crops
Rice
Wheat
Winter Maize
Green gram
Soybean
Pigeonpea*
Mustard
Baby corn
Cabbage
Cauliflower
Chillies*
Bottle gourd
Gladiolus
Marigold
Berseem
Oat*
Maize fodder
Maize+ Cowpea (Fodder)*
Sorghum+ Cowpea (Fodder)*
* Based on 2007-08 data
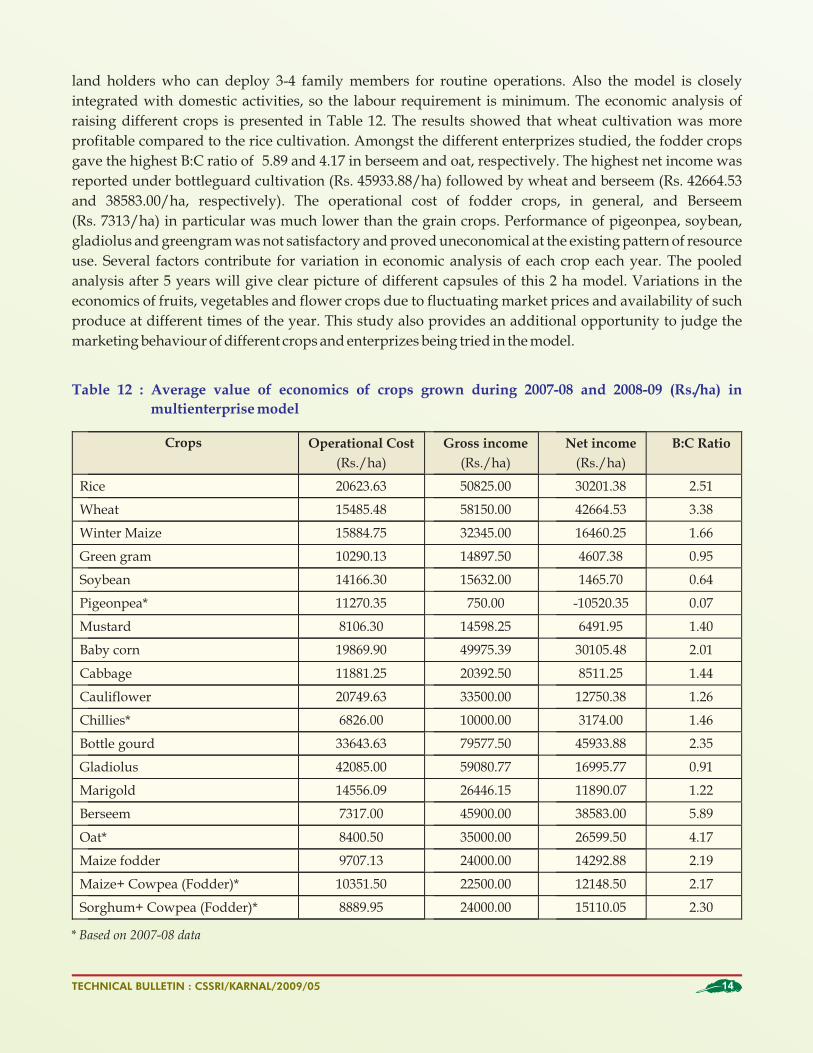
land holders who can deploy 3-4 family members for routine operations. Also the model is closely
integrated with domestic activities, so the labour requirement is minimum. The economic analysis of
raising different crops is presented in Table 12. The results showed that wheat cultivation was more
profitable compared to the rice cultivation. Amongst the different enterprizes studied, the fodder crops
gave the highest B:C ratio of 5.89 and 4.17 in berseem and oat, respectively. The highest net income was
reported under bottleguard cultivation (Rs. 45933.88/ha) followed by wheat and berseem (Rs. 42664.53
and 38583.00/ha, respectively). The operational cost of fodder crops, in general, and Berseem
(Rs. 7313/ha) in particular was much lower than the grain crops. Performance of pigeonpea, soybean,
gladiolus and greengram was not satisfactory and proved uneconomical at the existing pattern of resource
use. Several factors contribute for variation in economic analysis of each crop each year. The pooled
analysis after 5 years will give clear picture of different capsules of this 2 ha model. Variations in the
economics of fruits, vegetables and flower crops due to fluctuating market prices and availability of such
produce at different times of the year. This study also provides an additional opportunity to judge the
marketing behaviour of different crops and enterprizes being tried in the model.
14

ECO-FRIENDLY INTEGRATED MULTIENTERPRISE MODEL FOR LIVELIHOOD SECURITY IN SMALL FARM HOLDINGS
Rice-wheat is a grainery source for the small and marginal farmers of the Model
Flower and vegetable components ensure regular income to the farmers
The productivity in different cropping systems was worked out keeping in view the quantity of
marketable produce from 2007-08 and 2008-09. The productivity in the case of fodder crops represents the
green fodder yield, in grain crops it is the grain yield and in the case of vegetables and fruits it was the green
vegetable and fresh fruit production. In the case of fodder production, the highest system productivity was
recorded with maize-oat-berseem (170.86 t/ha), followed by sorghum-berseem (147.50 t/ha) cropping
system. Under crop production components, rice-wheat cropping system registered the highest system
productivity (10.98 t/ha) in terms of grain production in comparison to other cropping systems. In other
cropping systems some crops were used as green manuring and some as fodder, so comparison between
system productivity was not possible among the cropping systems. Under flower production system, 2.34
t/ha productivity of baby corn was recorded, besides 5484 sticks of gladiolus and 1.13 t/ha flowers of
marigold. The average sunflower yield for two years was 1.91 t/ha during both the years. Two systems of
the vegetable production i.e. Ladies finger/cabbage-tomato-tomato/cucumber and Ladies finger-
cauliflower-bottleguard were raised in the field. In these two systems, the highest productivity was in
Ladies finger-cauliflower-bottle guard (9.04 t/ha), considerably higher in comparison to Ladies finger/
cabbage-tomato-tomato/ cucumber (8.86 t/ha).
15

TECHNICAL BULLETIN : CSSRI/KARNAL/2009/05
5. Recycling of Resources
The resources were recycled within the system to increase water, nutrient and energy use efficiency
through diversified agriculture options. The animal, fishery, poultry and duckery components are getting
the feed and fodder from the crop components. Whatever dung is produced by the animals is used in
different ways. Major part of it goes for composting and used for application in fruits and vegetables being
cultivated on pond dykes. Some part of it is used for biogas generation to meet the daily energy
requirement of kitchen for an average family and remaining part of it goes in fish pond as 'feed' for fishes.
Nutrient rich pond water is used for irrigating the crops around the pond and in the crop field during
summers. Banana leaves, over matured fruits and vegetables are also used as fish feed. All the resources
are being recycled within the system. Feed Concentrates for the animals also come from the crop
component. Animal feed is prepared at site to reduce the cost of inputs and to ensure the quality of the feed.
Fruit crops and associated intercrops provide insurance cover to the Model
Table 13 : Economics of different cropping systems during 2008-09
Operational cost (Rs/ha)
Gross income (Rs/ha)
Net income (Rs/ha)
B:C ratio
11337.25 67300.00 55962.75 4.93
29210.67 97518.00 68307.33 2.36
28558.70 82673.47 55114.77 1.99
20836.25 128896.30 108060.00 5.19
18840.75 53888.75 35048.00 1.86
Components
Fodder production
Grain production
Floriculture production
Horticulture based system
Vegetable production
Land-scape of different crop components laid for the Model
The economics of the different cropping systems was calculated for the year 2008-09 in the multienterprise
agriculture model (Table 13). The highest net income (Rs. 108060/ha) was observed with horticulture
based production system with a B:C ratio of 5.19 followed by fodder production system (4.93) and grain
production (2.36) systems. In floriculture and vegetable production, more or less same B:C ratio was
obtained. Horticulture based system in which the vegetable crops were cultivated with the fruit plants of
guava and papaya, proved to be economic and highly beneficial to the farmers.
16
ECO-FRIENDLY INTEGRATED MULTIENTERPRISE MODEL FOR LIVELIHOOD SECURITY IN SMALL FARM HOLDINGS
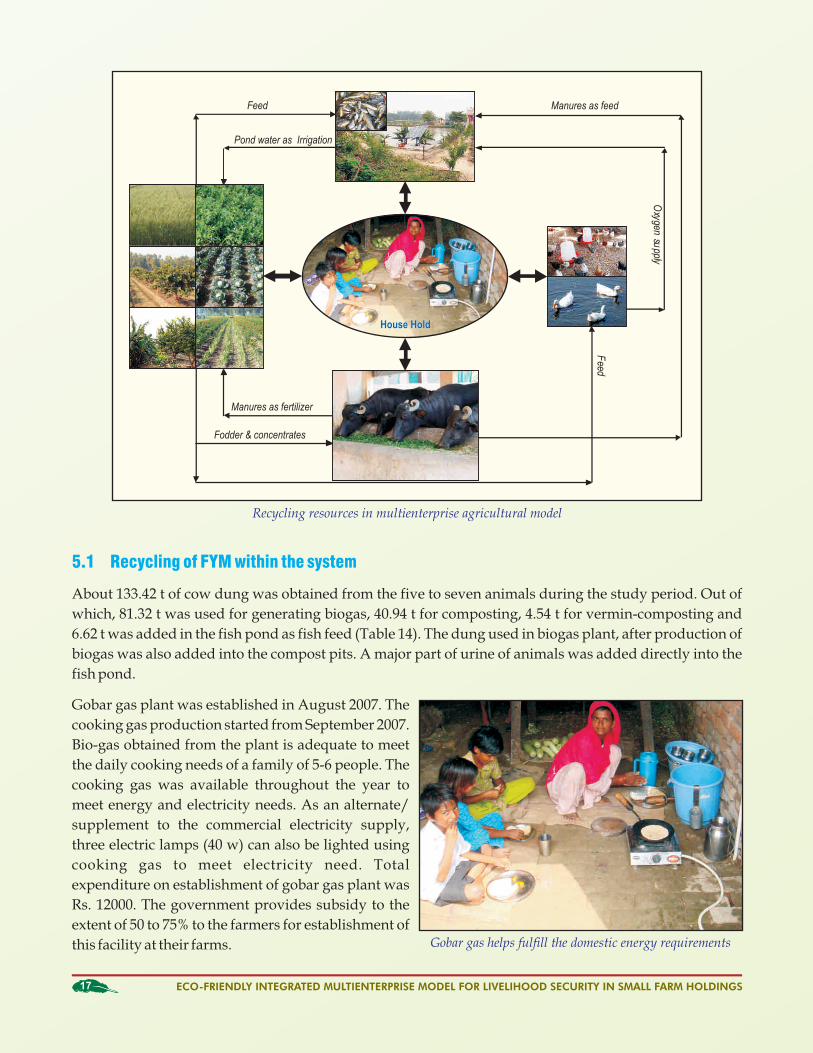
Recycling resources in multienterprise agricultural model
5.1 Recycling of FYM within the system
About 133.42 t of cow dung was obtained from the five to seven animals during the study period. Out of
which, 81.32 t was used for generating biogas, 40.94 t for composting, 4.54 t for vermin-composting and
6.62 t was added in the fish pond as fish feed (Table 14). The dung used in biogas plant, after production of
biogas was also added into the compost pits. A major part of urine of animals was added directly into the
fish pond.
Gobar gas plant was established in August 2007. The
cooking gas production started from September 2007.
Bio-gas obtained from the plant is adequate to meet
the daily cooking needs of a family of 5-6 people. The
cooking gas was available throughout the year to
meet energy and electricity needs. As an alternate/
supplement to the commercial electricity supply,
three electric lamps (40 w) can also be lighted using
cooking gas to meet electricity need. Total
expenditure on establishment of gobar gas plant was
Rs. 12000. The government provides subsidy to the
extent of 50 to 75% to the farmers for establishment of
this facility at their farms. Gobar gas helps fulfill the domestic energy requirements
17
Manures as fertilizer
Manures as feed
Fodder & concentrates
Feed
Oxygen
supply
Pond water as Irrigation
Feed
House HoldHouse Hold

TECHNICAL BULLETIN : CSSRI/KARNAL/2009/05
Gobar gas plant (t)
Compost pits (t)
Vermi-
compost (t) Pond (t) Total (t)
0.50 - - - 0.50
2.20 - - - 2.20
2.80 - - - 2.80
2.70 - - - 2.70
2.80 - - - 2.80
2.70 - - - 2.70
4.80 - - - 4.80
5.60
-
-
-
5.60
6.00
-
-
-
6.00
2.20
1.80
-
2.20
6.20
2.10
1.50
-
2.30
5.90
3.50
1.40
0.41
0.40
5.71
2.50
1.90
-
-
4.40
1.30
1.30
0.16
0.16
2.92
2.10
0.40
0.46
0.25
3.21
1.60
1.20
-
0.01
2.81
1.70
1.00
-
-
2.70
3.20
2.00
0.69
-
5.89
4.00
2.50
-
0.12
6.62
2.60
2.30
-
0.30
5.20
2.10
2.18
0.435
0.20
4.91
2.36
2.10
-
-
4.40
2.10
1.94
-
0.16
4.19
2.10
1.98
0.81
-
4.89
2.13
2.41
-
0.05
4.59
2.22
1.62
0.445
0.30
4.58
2.10
2.36
-
-
4.42
2.26
2.40
-
-
4.66
2.28
1.68
0.76
-
4.72
2.45
2.28
-
0.18
4.91
2.38
2.75
0.37
-
5.49
81.32
40.94
4.54
6.62
133.42
Month
April 2007
May
June
July
August
September
October
November
December
January
2008
February
March
April
May
June
July
August
September
October
November
December
January 2009
February
March
April
May
June
July
August
September
October
Total
Table 14 : Monthly dung production (tonnes) and its recycling in the system during 2007-09
6. Quality of the Soil on Pond Dykes
Soil quality parameters are regularly studied since the beginning of the model establishment. Average soil
quality parameters (0-120 cm depth) after three years of model establishment are compared with their
initial values in Table 15. Soil used to raise the pond dykes is being used for cultivation of fruits and
vegetables. In the beginning available sodic soil (pH 10.25 and EC 4.0 dS/m) was used for dyking the pond.
18

ECO-FRIENDLY INTEGRATED MULTIENTERPRISE MODEL FOR LIVELIHOOD SECURITY IN SMALL FARM HOLDINGS
Table 15 : Average values (0-120 cm depth) of soil quality parameters
pH
EC (dS/m)
OC (%)
N P K
10.25 4.00 0.14 55.25 15.00 213.54
9.56 1.19 0.19 59.28 15.13 238.13
Soil
In the beginning (2006)
After three year (2009)
Available nutrients (kg/ha)
The soil was poor in organic carbon (0.14 %) and available nutrients (55.25 kg N, 15.00 kg P and 213.54 kg K)
due to high pH. High pH induced dispersion of soil particles made it difficult to establish the dykes. The
dykes were continuously subjected to vegetation that tolerate sodicity and help stabilize the dykes. Fruit
trees and vegetables were preferred so that the regular income can be earned besides stabilizing the pond
dykes. Though the yields of these crops on dykes were low in the beginning, the major benefit was
achieved in terms of stable pond dykes and improved soil quality. At present (after three years) the pH and
EC of the soil on pond dykes reduced considerably and improvement has been observed in organic carbon
and available nutrient status. Though the soil quality at present is not very good, yet there is overall
improvement in quality parameters. Continuation of the model will bring significant improvement in soil
quality parameters in future.
Depth-wise soil samples were collected to study important soil physical properties in October 2009.
Samples were collected from 0-15, 15-30 and 30-60 cm soil layers. Bulk density was determined by core
method. Undisturbed soil cores were collected for determining saturated hydraulic conductivity in the
laboratory by constant head method. Water retention at 33 and 1500 kPa was studied by a pressure plate -3apparatus. Soil bulk density ranged between 1.41 and 1.44 Mg m in various depths across the production
components (Table 16). In general, bulk density was higher in the deeper layers as compared to the surface.
Though the variation in bulk density values was not considerable, yet the fodder production component
recorded lower bulk density values as compared with the other components in all the depths. Saturated -1
hydraulic conductivity varied between 1.4 and 2.0 cm h among the depths across the production -1
components. Fodder plots recorded 2.0 and 1.8 cm h saturated hydraulic conductivity values,
numerically higher than all the other production components. Because of the higher clay content and bulk
density, the saturated hydraulic conductivity values in lower layers were lower than the surface layer.
Water retained at 33 and 1500 kPa soil-water suction also iterated the same trend as that of bulk density and
hydraulic conductivity. Fodder production components had higher available water as compared to the
other production components in all the depths. This indicates that the fodder production component is
highly efficient in storing moisture and its availability for the plant growth.
Net increase in available nitrogen and phosphorus was observed in all the cropping systems (Table 17).
Regular nitrogen build-up was the result of integrated nutrient management in all the cropping systems.
Higher nitrogen build-up in fodder production system as compared to others was the result of irrigation
with pond water. Nutrient balance in most of the cropping systems was positive, more so in the case of N,
P and micronutrients. Recycling of farm wastes and use of pond water helped improving the soil chemical
health. The improvement seems to be slow but steady.
7. Soil Health and Quality
7.1 Soil physical quality
7.2 Soil chemical quality
19

TECHNICAL BULLETIN : CSSRI/KARNAL/2009/05
Table 16 : Important soil physical properties under different production components
Production components
Fodder
Production
Grain Production
Floriculture Production
Horticulture Production
Vegetable Production
Soil depth (cm)
Bulk density
(Mg m-3)
Sat. Hydr. Cond.
(cm h-1)
Water retention
(cm3
cm-3) at
Available water
(cm3
cm-3)
33 kPa
1500 kPa
00-15
1.39
2.0
0.30
0.17
0.13
15-30
1.41
1.8
0.29
0.17
0.12
30-60
1.41
--
0.30
0.16
0.14
00-15
1.42
1.8
0.24
0.15
0.09
15-30
1.43
1.4
0.25
0.14
0.11
30-60
1.44
--
0.24
0.14
0.10 00-15
1.42
1.7
0.25
0.14
0.11
15-30
1.43
1.5
0.23
0.14
0.09
30-60
1.43
--
0.22
0.14
0.08
00-15
1.43
1.7
0.25
0.14
0.11
15-30
1.43
1.8
0.24
0.14
0.10
30-60
1.43
--
0.22
0.13
0.09
00-15
1.41
1.8
0.25
0.16
0.09
15-30
1.43
1.6
0.24
0.15
0.09
30-60 1.44 -- 0.23 0.15 0.08
Table 17 : Fertility status of different cropping system under multi enterprise agriculture
Cropping systems
Year pH EC (dS/m)
N (kg/ha)
P (kg/ha)
K (kg/ha)
Zn (ppm)
Fe (ppm)
Mn (ppm)
Cu (ppm)
Fodder
production Initial 8.18 0.35 103.50 26.75 301.50 1.90 13.35 6.15 1.64
1st yr 8.17 0.37 129.00 27.00 288.00 1.74 11.85 6.45 1.58
2nd yr 7.91 0.30 216.50 28.90 291.50 1.80 10.44 10.03 1.55
Grain production
Initial 8.32 0.28 106.00 24.83 300.00 1.65 14.05 5.88 1.36
1st yr 8.27 0.28 128.25 24.70 286.25 1.59 12.35 6.07 1.45
2nd yr 8.05 0.25 180.75 26.38 267.00 1.69 13.43 7.57 1.46
Floriculture production
Initial 8.29 0.25 108.00 23.50 388.50 1.78 13.25 6.61 0.81
1st yr 8.16 0.29 136.50 23.80 377.50 1.79 12.40 6.69 0.84
2nd yr 8.10 0.29 183.50 27.10 321.00 2.63 10.05 8.12 0.71
Horticulture based
production
Initial 7.70 0.46 123.00 24.20 409.00 2.41 17.80 8.40 7.70
1st yr 7.74 0.46 131.00 25.10 364.00 1.91 17.50 8.10 7.74
2nd yr 7.44 0.32 205.00 30.40 345.00 1.21 12.78 11.04 7.44
Vegetable production
Initial 7.70 0.46 123.00 24.20 409.00 2.41 17.80 8.40 2.18
1st yr 7.57 0.31 144.00 30.40 381.00 1.95 15.20 8.31 1.94
2nd yr 7.44 0.28 201.00 29.40 305.00 1.38 10.20 8.64 1.80
20

ECO-FRIENDLY INTEGRATED MULTIENTERPRISE MODEL FOR LIVELIHOOD SECURITY IN SMALL FARM HOLDINGS
Table 18 : Mean initial values of microbiological properties and values after two years of
experimentation in multienterprise project.
Microbial biomass carbon
(mg kg-1)
Microbial nitrogen flush
(mg kg-1)
Dehydrogease activity
(µg TPF g-1 soil)
Acid phoaphatase activity
(µg PNP g-1 soil)
Grain production
255.6 ± 40.6(227.3 ± 36.3)
18.5 ± 3.2 (17.7 ± 5.0)
24.6 + 3.2 (58.6 + 11.1)
184.5 + 12.5 (379 + 13.1)
168.7 ± 10.2 (194.5 ± 30.9)
19.8 ± 2.5 (20.5 ± 1.1)
16.8 + 2.9 (124.0 + 17.8)
103.5 + 18.7 (329.2 + 21.1)
281.1 ± 45.6 (255.2 ± 41.5)
16.3 ± 3.1 (26.9 ± 1.5)
58.9 + 4.3 (55.8 + 10.1)
150.2 + 16.1 (312.8 + 21.3)
187.1 ± 19.2
(287.3 ± 35.2) 16.5 ± 2.5
(29.8 ± 2.4) 45.4 + 8.9
(74.7 ± 17.2) 219.5 + 17.7
(337.0 + 19.9)
268.6 ± 23.5
(269.3 ± 28.6) 19.6 ± 3.6
(38.5 ± 5.8) 59.9 + 6.0
(145.2 ± 20.3) 91.3 + 7.7
(350.0 ± 14.9)
Fruits + vegetables
180.2 ± 15.6
(152.2 ± 23.4) 18.9 ± 2.2
(20.8 ± 3.8) 21.9 + 2.4
(67.7 + 5.2) 121.6 + 16.2
(260.2 + 20.3)
179.5 ± 25.2
(185.2 ± 19.5) 17.6 ± 3.9
(22.2 ± 4.2) 24.6 + 3.5
(77.3 + 6.2) 105.7 + 15.4
(355.7 + 18.2)
194.8 ± 19.1
(142.5 ± 25.3) 16.5 ± 1.9
(15.6 ± 2.1) 21.2 + 2.6
(66.5 + 9.8) 134.4 + 9.2
(257.9 + 15.7)
Cropping systems
Rice-wheat
Moong-maize-wheat
Soyabean-winter maize
Fodder maize -
pigeonpea–mustard
Fodder production
Sorghum-berseem
(Guava + papaya +
tomato + ladies finger)
Vegetables
(Bottle guard-
Cauliflower/Cabbage
Floriculture
(Baby corn-marigold
– gladiolus
* The values after two years are presented in parenthesis
7.3 Soil biological quality
The microbial properties like microbial biomass carbon, microbial nitrogen, dehydrogenase activity and
acid phosphatase activity were determined initially and after two years of experimentation using standard
methods under different cropping systems to study the effect of different cropping systems on
microbiological properties of semi- reclaimed alkali soil.
-1After 2 years of cropping greater microbial biomass carbon (mg kg ) was observed under fodder maize-
pigeonpea-mustard (287.3/187.1); sorghum-berseem (269.3/248.6); soyabean-winter maize (255.2/231.1); -1moong-maize-wheat (194.5/168.7and vegetables only (185.2/179.5) mg kg . In rice-wheat (227.3/ 255.6)
and fruits + vegetables (152.2/180.2) cropping systems lower MBC was recorded whereas, least MBC was
recorded in floriculture system (142.5/194.8). Similarly trend was observed under microbial nitrogen
flush except Fruit + vegetable system (Table 18). The highest was observed under fodder production -1 -1(58.5/39.6 mg kg ), whereas the lowest was under floriculture (15.6/16.5 mg kg ) system.
The mean dehydrogenase activity was greater under legume crops except winter maize-soyabean system. -1The maximum DHA was observed under sorghum–berseem (145.2/59.9 µg TPF g soil) followed by
-1Moong-maize-wheat (124/16.8 µg TPF g soil). The activity was comparatively greater under vegetable
21

TECHNICAL BULLETIN : CSSRI/KARNAL/2009/05
Table 19 : Microbial count and C:N ratio in a pit at different intervals
Bacteria Actinomycetes Fungi C:N ratio
16.1 x (108) + 1.3 7.85 x (106) +2.63 11.6 x (105) +2.14 15.94
17.7 x (108) + 0.58 6.6 x (106) +1.22 10.2 x (105) + 1.04 14.97
19.9 x (106) + 3.73 10.3 x (104) + 2.76 10.5 x (104) + 0.25 12.37
4.5 x (106) + 1.04 11.0 x (104) + 3.03 5.4 x (103) + 1.25 11.61
2.1 x (106) + 0.46 4.7 x (103) + 2.08 2.5 (101) + 0.5 10.32
2.0 x (106) + 0.53 2.7 x (101) + 0.62 1.3 x (101) + 0.05 10.47
Sampling days
15
30
45
60
75
90
alone system compared to Fruits + vegetables and floriculture system which may be because, vermin-
compost is continuously being added in the vegetable crops. Rice- wheat and winter maize-soyabean
showed the minimum dehydrogenase activity. After 2 years, acid phosphatase activity was almost similar
under all the cropping systems except fruits + vegetable and floriculture system which showed minimum
activity. After 2 years the results showed that fruits + vegetables and floriculture system had lower
microbial properties. However, to come out with definite trend of cropping systems on microbial
properties, more observations are to be needed in the coming years when the cropping systems get
stabilized.
Microbial quality of the compost
Total number of bacteria, actinomycetes and fungi were determined after every 15 days interval from 15 to
90 days in a compost pit of size (8 x 5 m and ½ m deep). The pit was mixed with cow dung, biogas slurry and
vegetables wastes and fallen leaves. The total microbial count and C:N ratio of the compost at different
intervals shown in Table 19.
The results thus showed that the number of bacteria after 15 days of composting were 16.1 x 10⁸ which
reduced to the level of 2.0x 10⁶ after 90 days of composting. Numbers of actinomycetes were 7.85 x 10⁶ and
reduced to the level of 2.7 x 101 and number of fungi which were 11.6 x 10⁵ after 15 days and after 90 days it
was decreased to 1.3 x 101. All the microorganisms decreased with the passage of time may be because of
very high temperature (60-650C) when the compost is finally prepared which might have killed the
microorganisms. The maximum survival was of bacteria might be due to development of thermophilic in
nature. Similarly C:N ratio also decreased from 15.94 at 15 days to 10.47 after 90 days of composting when
the compost was almost ready to use in the field.
8. Water Quality in the Pond
The monthly variations in pH2, EC and salinity of water in the fish pond were monitored during the study
period. The pH2 ranged from 7.6 to 8.3; EC from 0.6 to 0.8 dS/m and total dissolved salts from 380 to 520
me/L. These values were well within the prescribed safe limits for fish culture in ponds (Fig. 3). Water
quality parameters studied from the pond are presented in Table 20. These water quality parameters are
very crucial for fish growth and productivity. Water quality parameters observed in the pond are in the
safe limits for the fish health and production.
22

ECO-FRIENDLY INTEGRATED MULTIENTERPRISE MODEL FOR LIVELIHOOD SECURITY IN SMALL FARM HOLDINGS
7
7.25
7.5
7.75
8
8.25
8.5
Febru
ary
Mar
chApril
May
June
July
August
Septe
mber
Oct
ober
Nove
mber
Dec
ember
Months
pH
pH 2007 pH 2008
0.5
0.6
0.7
0.8
0.9
1
Febru
ary
Mar
chApril
May
June
July
August
Septe
mber
Oct
ober
Nove
mber
Dec
ember
Months
-1S
ali
nit
y (
dS
m)
-1Salinity (dSm ) 2007-1Salinity (dSm ) 2008
300
350
400
450
500
550
Febru
ary
Mar
chApril
May
June
July
August
Septe
mber
Oct
ober
Nove
mber
Dec
ember
Months
-1T
DS
(m
eL
)
-1TDS (meL ) 2007 -1TDS (meL ) 2008
Fig. 3 : Monthly variations in pH, EC and salinity of the water in fish pond during 2007 and 2008
23

TECHNICAL BULLETIN : CSSRI/KARNAL/2009/05
Fish pond : The most important component of the Model
Table 20 : Water quality parameters of the fish pond
Parameters Values
Pond water area (ha)
0.20
Mean water depth (m)
1.25 (Range-0.90-1.50)
Water transparency (cm)
10-15
Water pH 7.50-8.90
EC(dS/m) 0.65-0.82
Water temperature ( oc -max. range only) 27-41
Planktonic productivity(ml)/100-L water 0.50-1.50
Characteristics
pH EC -1(dSm )
NH 4 -N (mg L-1)
NO 2 -N (mg L-1)
NO –N3
(mg L-1) P
(mg L-1)
K (mg L-1)
Zn (mg L-1)
Fe (mg L-1)
Mn (mg L-1)
Cu (mg L-1)
Values 8.1 0.72 0.82 0.28 1.98 0.25 0.62 0.11 0.15 0.12 0.03
Table 21 : Chemical composition of fish pond water
8.1 Use of fish pond water for crop production
The fish pond water gets enriched in nutrients and its quality can be rated as very good. This water was
used in cropping system component. Besides a source of irrigation it helps in improving soil fertility. The
chemical composition of fish pond water is presented in Table 21.
24

ECO-FRIENDLY INTEGRATED MULTIENTERPRISE MODEL FOR LIVELIHOOD SECURITY IN SMALL FARM HOLDINGS
Loss of water due to seepage Water loss due to evaporation
Rain fall
Water storage of pond
Water added by the tube well
3329 M3 2254 M3
1604 M3
2621
M3
6900 M3
Table 22 : Yearly water balance of the pond in the year 2008
Table 23 : Monthly water balance of the pond for enhanced water productivity
9. Water Balance of the Pond
Comprehensive information on the pond water balance is monitored since inception of the model. Water
balance studies were carried out in the fish pond to enhance the water productivity (Tables 22 and 23).
Evaporated water is actually lost, while seepage loss could be recovered and for this only pumping cost is
required. The seepage rate varied with the depth of water in pond. Actual effective loss of water was
mainly through evaporation and this varied with the months. Higher productivity of pond could be
achieved when depth of pond varied between 1 to 1.5 m.
Rainfall (mm)
Pan evaporation (mm)
Actual pond evaporation*
20.00
35.65
28.52
15.80
56.84
45.47
42.63
104.47
83.57
11.71
198.00
158.40
22.15
255.75
204.60
75.78
212.10
169.68
265.45
143.22
114.57
196.40
121.52
97.21
65.46
102.90
83.32
13.81
76.57
61.25
10.87 65.70 52.56
13.73 41.85 33.48
Month
January February
March
April
May
June
July
August
September
October
November
December
*Considering pan coefficient as 0.80
10. Resource and Energy Conservation for Environmental Quality
Besides a source of regular income to the small and marginal farmers, the multienterprise model acts
as the most vital technology in conserving farm resources and energy. Recycling of farm wastes and other
byproducts of the components ensures environmental quality. Intensive observations are being recorded
25

TECHNICAL BULLETIN : CSSRI/KARNAL/2009/05
on the components of water balance in and around the pond as well as irrigation command of the pond.
Water balance components will provide precise information on the water requirement of the individual
enterprise as well as the components. Future water management strategies will be based on the judicious
use of available water resources in the model at farm-level. Gobar gas plant is an integral component of the
model and the most important energy resource for domestic uses. Information on energy fluxes for
cooking and electricity generation is being gathered to estimate energy budgets to fully or partly fulfill the
farm energy requirements. Electricity generation by harnessing the solar energy is also practised in the
Model. At present the fruit crops grown on the dykes and vegetables grown in the vegetable component
are irrigated by drip irrigation system. The drip irrigation system is run on solar energy system. Resource
recycling and physico-chemical transformations involve gas exchange within and across the
multienterprise components. Precise observations are being recorded to compute the gaseous fluxes
across the model components. The above information will provide deep insight into energy balance at
farm-level. Conservation and judicious use of farm resources in multienterprise model will ensure
environmental quality and help restore the ecosystem sustainability. Intense and perennial vegetation on
and around the pond dykes as well as different crop components of the model help in sequestration of
considerable carbon pools.
Success of a technology depends on its adoption by the end-users. Multienterprise model of CSSRI has a
great potential for up-scaling and commercialization because of its suitability to small and marginal land
holders. As a first step, efforts are being made to demonstrate the model on farmers' fields. Presently the
model is demonstrated on six locations in different agro-climatic regions. Beginning of the demonstrations
is highly encouraging. Government of India is already providing subsidy on the most of the components of
the model, which attracts the attention of resource poor small and marginal farmers. The model can be up-
scaled and commercialized by its integration with many of the governmental scheme e.g. NREGA, RKVY,
IRDA, Food Security Mission etc. Besides rural developmental schemes, other governmental programmes
related to fisheries, poultry, non-conventional energy, rural electrification, rural sanitation etc. can be
easily linked with the model. Options and provisions for value addition, processing facilities, good
marketing network and integration with other rural enterprises can help attract the attention of rural
youth. Special training programmes for skill upgradation among the rural masses in general; and youth
and women entrepreneurs in particular can help in rapid up-scaling of the model. CSSRI Karnal can act as
a nodal institution for conducting such trainings. Formation of user groups, self-help groups and
involvement of non-governmental organization may help in commercialization of the model in target
areas. In its present form, the model has full potential to earn regular livelihood for small and marginal
farmers by ensuring food and nutritional security besides its socio-economic and ecological benefits.
However, continued research efforts will lead to further improvement of the model, and subsistence
farming of today will become prestigious farming of the future.
11. Up-scaling and Commercialization of Multienterprise Model for Enhanced
Productivity
26

Central Soil Salinity Research InstituteKarnal - 132 001 India
Tel. : +91-184-2290501; Gram : Salinity; Fax : +91-184-2290480E-mail : [email protected]; Website : www.cssri.org