Embed Size (px)
Citation preview

Efficient Blacklisting and Pollution-LevelEstimation in P2P File-Sharing Systems
Jian Liang, Naoum Naoumov, and Keith W. Ross
Department of Computer and Information Science,Polytechnic University, Brooklyn NY 11201, USA
{[email protected], [email protected], [email protected]}
Abstract. P2P file-sharing systems are susceptible to pollution attacks,whereby corrupted copies of content are aggressively introduced into thesystem. Recent research indicates that pollution is extensive in severalfile sharing systems. In this paper we propose an efficient measurementmethodology for identifying the sources of pollution and estimating thelevels of polluted content. The methodology can be used to efficientlyblacklist polluters, evaluate the success of a pollution campaign, to reducewasted bandwidth due to the transmission of polluted content, and toremove the noise from content measurement data. The proposed method-ology is efficient in that it does not involve the downloading and analy-sis of binary content, which would be expensive in bandwidth and incomputation/human resources. The methodology is based on harvestingmetadata from the file sharing system and then processing off-line theharvested meta-data. We apply the technique to the FastTrack/Kazaafile-sharing network. Analyzing the false positives and false negatives, weconclude that the methodology is efficient and accurate.
1 Introduction
By many measures, P2P file sharing is the most important application in the In-ternet today. There are more than 8 million concurrent users that are connectedto either FastTrack/Kazaa, eDonkey and eMule. These users share terabytes ofcontent. In the days of Napster (circa 2000), most of the shared files were MP3files. Today the content includes MP3 songs, entire albums, television shows,entire movies, documents, images, software, and games. P2P traffic accounts formore than 60% of tier-1 ISP traffic in the USA and more than 80% of tier-1traffic in Asia [1].
Because of the their decentralized and non-authenticated nature, P2P filesharing systems are highly susceptible to “pollution attacks”. In a pollutionattack, a polluter first tampers with targeted content, rendering the contentunusable. It then deposits the tampered content, or only the metadata for thatcontent, in large volumes in the P2P file sharing system. Unable to distinguishpolluted files from unpolluted files, unsuspecting users download the files intotheir own file-sharing folders, from which other users may then later downloadthe polluted files. In this manner, the polluted copies of a title spread through thefile-sharing system, and the number copies of the polluted title may eventually

2
exceed the number of clean copies. The goal of the polluter is to trick users intorepeatedly downloading polluted copies of the targeted title; users may thenbecome frustrated and abandon trying to obtain the title from the file-sharingsystem. As a side effect, however, the polluted content becomes a persistent”noise” in the P2P system that interferes with research measurement work.Pollution is currently highly prevalent in file-sharing systems, with as many as50% to 80% of the copies of popular titles being polluted [2].
In this paper we study mechanisms to measure the effectiveness of a pollutionattack. We emphasize, however, that we do not take a side in the P2P file-sharing debate, neither condoning nor condemning the pollution attacks thatare commissioned by the music, television and film industries. But given thatP2P file sharing traffic is currently the dominant traffic type in the Internet, andthat the files being transferred are frequently polluted, a significant fraction ofInternet bandwidth is clearly being wasted by transporting large, corrupted files.It is therefore important to gain a deep understanding of the pollution attackand develop effective mechanisms to measure it.
In this paper we explore two techniques for countering the pollution attack:
– Identifying pollution source IP ranges: The goal is to identify IP ad-dress ranges that are broad and complete enough to cover the hosts providingpolluted content, yet narrow enough to exclude the vast majority of ordinaryusers.
– Identifying the pollution level of titles: With knowledge of which titlesare being polluted and to what extent users and researchers can use the filesharing system accordingly.
In developing methodologies we have not only aimed for accuracy but also forefficiency. For source identification, one approach would be to download copiesof titles from a vast number of IP addresses and then manually check the copiesfor pollution; the IP addresses that consistently supply polluted content couldthen be marked. Such an approach would be highly inefficient, requiring enor-mous bandwidth, computing and human resources, and would also introducesignificant “probing” traffic into the Internet.
Our methodologies do not involve the downloading of any files. Instead, theyidentify polluting IP address ranges and targeted titles by collecting and an-alyzing metadata from the file sharing system. The metadata is harvested bycrawling the nodes in the P2P system and sending tailored queries to each ofthe crawled nodes. The harvested metadata can then be analyzed to obtain de-tailed information about the numbers of versions and copies, and the IP subnetscontaining the versions and copies, for a large number of investigated titles. Fromthis detailed information, our methodology constructs the blacklisted IP rangesand the estimated pollution levels for the targeted titles. The methodology isefficient in that it collects metadata (text) rather than content (which is typi-cally 3MB to several GB per file for music and video) and that a large numberof titles and virtually all the file-sharing nodes can be investigated in one crawl.
Our contribution is as follows:

3
– We developed a methodology for creating a blacklist set. The methodologyis based on identifying high-density prefixes, which are prefixes in whichthe nodes that have a copy of a particular title have, on average, a largenumber of copies. We provide a heuristic for separating the low densityprefixes from the high density prefixes, and a mechanism to merge prefixesthat are topologically close. The set of resulting merged prefixes constitutesthe pollution source set. We then developed several metrics for measuring theaccuracy of the set. The two principal metrics are probability of false positiveand false negative. We also examine secondary metrics, including comparingthe download times and last-hop RTTs at nodes we have identified andregular nodes.
– We developed a methodology for estimating the pollution level of a title,which is defined as the ratio of polluted copies in the network to the totalnumber of copies in the network. This estimate does not involve the down-loading of any files and is solely based on the harvested metadata. We thenevaluate our estimate by measuring the actual pollution levels of selectedtitles.
– We crawled FastTrack for 170 titles, including songs and movies. We thenapplied the methodologies to the FastTrack metadata harvested during thecrawling procedure. Our resulting pollution source set contains 112 prefixes.Our evaluation metrics indicate that the set is accurate, with low probabili-ties of false positives and false negatives. We also find that the estimates forpollution levels in examined titles is accurate.
This paper is organized as follows. In Section 2 we describe the pollutionattack in detail and introduce important terminology. In Section 3 we describein detail the metholodogies and the evaluation procedures for creating the pol-lution source set and the pollution-level estimates. In Section 4 we describe theexperimental setup, including the crawler and PlanetLab experiments. Section5 provides the results of our experiment, including evaluation results for themethodologies. Section 6 describes previous work related to this paper. We con-clude in Section 7.
2 Overview of Pollution
2.1 File Sharing Terminology
We first provide an overview of a generic P2P file-sharing application. This willallow us to introduce some important terminology that is used throughout thepaper. In this paper we are primarily concerned with the sharing of music andvideo. We shall refer to a specific song or video as a title. A given title can havemany different versions (in fact, tens of thousands). These versions primarilyresult from a large number of rippers/compressors, each of which can produceslightly different files when created by different users. Modifications of metadatacan also create different versions. Users download different versions of titles fromeach other, thereby creating multiple copies of identical file versions in the P2P

4
file sharing system. At any given time, a P2P file-sharing system may makeavailable thousands of copies of the same version of a particular title.
A file in a P2P file sharing system typically has metadata associated withit. There are two types of metadata: metadata that is actually included in infile itself and is often created during the ripping process (e.g. ID3 Tags in mp3files); and metadata that is stored in the file-sharing system but not within theshared files themselves. This “outside-file” metadata may initially be derivedfrom the “inside-file” metadata, but is often modified by the users of the file-sharing systems. It is the outside-file metadata that is employed during P2Psearches. In this paper, when using the term metadata, we are referring to theoutside-file metadata. Because different copies of a version of a title may bestored on different user nodes, the different copies can actually have differentmetadata.
When a user wants to obtain a copy of a specific title, the user performsa keyword search, using keywords that relate to the title (for example, artistname and song title). The keywords are sent within a query into the file-sharingnetwork. The query will visit one or more nodes in the file sharing network, andthese nodes will respond if they know of files with metadata that match thekeywords. The response will include the metadata for the file, the IP address ofthe node that is sharing the file, and the username at that node. For many filesharing systems, the response will also include a hash, which is taken over theentire version. To download a copy of a version, one sends a request message(often within an HTTP request message) to the sharing user. In this requestmessage, the version is identified by its hash. Many file sharing systems employparallel downloading, in which case requests for different portions of the versionare sent to different users sharing that file.
Many nodes in P2P file sharing systems are behind Network Address Trans-lators (NATs). When crawling a NATed node’s private IP address and privateport number may be provided rather than its public IP address and public portnumber. Since the range of private IP address is relatively narrow, differentNATed users may have the same private IP address. Thus, from the crawlingdata, we cannot distinguish between different users solely by their IP addresses.In order to distinguish between different users, including NATed users, we definea user as the triple (IP address, port number, username).
2.2 Intentional Pollution
Naturally pollution occurs in P2P systems when users share corrupted versionsof some titles. However, the amount of such pollution is negligible. Other usersof the system, however, may intentionally introduce a large number of corruptedfiles. They create numerous versions of their targeted title by tampering with itin one or more ways with the binary content of the file. Then, they connect oneor more nodes to the P2P file-sharing system and places the tampered versionsinto its shared folders on these nodes. Users query for the title and learn aboutthe locations of versions of the title, including the polluted versions and down-load one or more polluted versions. The P2P software then automatically places
5
the file in the shared folders of those users and the pollutions spreads further.That kind of pollution is prevalent in modern P2P file sharing systems such asFastTrack/Kazaa [2]
Most of the pollution today emanates from “professional” polluters that workon the behalf of copyright owners, including the record labels and the motion-picture companies. From this economic context and from our own testing andusage experience, we conclude that the professional polluters tend to pollutepopular content, such as recently-released hit-songs and films. In [2] a randomsample of recent, popular songs were shown to be heavily polluted whereas arandom sample of songs for the 70s were shown to be mostly clean.
In order to facilitate the spread of the polluted content polluters have high-bandwidth Internet connections ,have high availability, and they are not behindfirewalls or NATed routers.
In our methodology for detecting polluted content and blacklisting polluters,we will make the following assumptions about polluters. Many of these assump-tions will be corroborated in Section 5, where our measurement results are pre-sented.
– Because polluters share popular titles at attractive file-transfer rates, thereis a high demand for their content from unsuspecting users. To meet thedemand, the polluter often uses a server farm at one or more polluter sites.The nodes in a server farm are concentrated in a narrow IP address range.
– Whereas regular P2P users run one client instance per host, polluters oftenrun many clients in each of their nodes, with each instance having a differentusername and sharing its own set of copies and versions for the targeted titles.This is done to improve placement of search results in the users’ GUIs.
– A polluter distributes multiple polluted versions of the same title. This alsoimproves the placement of search result in the users’ GUIs. As we will showin Section 5, an ordinary user typically has a small number of versions ofany title. To compete with all the clean versions in the display of the searchresults, a polluter needs to provide many different versions (each with adifferent hash) to increase the chances that its versions are selected from theusers’ GUIs.
3 Methodology
In this paper we develop methodologies for two tasks. The first task, whichwe refer to as blacklisting, is to find the IP address ranges that include thelarge majority of the polluters. The second task, referred to as pollution levelestimation, is to determine the extent of pollution for specified titles. For bothof these tasks, the first step is to crawl the file sharing system, as we now discuss.
3.1 Crawling
Crawling a P2P file sharing system is the process of visiting a large numberof nodes to gather information about the copies of files being shared in the

6
system. The crawler might gather, for example, the IP addresses and hashes ofall copies of files being shared in the network for a set of specific titles over a givenperiod of time. Several independent research groups have developed crawlers forP2P file sharing systems. A crawler for the original single-tier Gnutella systemis described in [3]. A crawler for the current two-tier Gnutella system (with“ultrapeers”) is described in [4]. A crawler for eDonkey is described in [15]. Acrawler for the FastTrack P2P file sharing is described in [2]. Since P2P networksare dynamic, with nodes frequently joining and leaving, a good crawler needs torapidly crawl the entire network to obtain an accurate snapshot.
The first step in our methodologies is to crawl the P2P file sharing systemand obtain the following information for each title of interest: the number ofversions in the file sharing system for the title; the hash values for each of theversions; the number of copies of each version available in the file sharing system;for each copy, the IP address of the node that is sharing it; the port number ofthe application instance at that node (many modern P2P systems vary the portnumber across nodes to bypass firewalls); the username at that node; and, foreach copy, some copy details (e.g., playtime, file size, description, etc). For eachtitle of interest, the crawler deposits this information in a crawling database,which can then be analyzed off-line. We will describe a crawler for the FastTracknetwork in Section 4.
3.2 Identifying pollution sources
Polluters typically control blocks of IP addresses and can easily move their nodesfrom one IP address to another within the block. Thus, rather than idnetifyingindividual IP addresses, we should find ranges or IP addresses that are likely toinclude the polluters in the near future as well as the present. Our methodologyhas the following steps:
1. Crawl the P2P file sharing system as described above.2. From the data in the crawling database, identify the /24 prefixes that are
likely operated by polluters.3. Merge groups of /24 prefixes that are topologically close and don’t cross
BGP prefixes. The set of merged prefixes becomes our blacklist set.
We now describe the second and third steps in more detail.The second step is to identify /24 prefixes that are likely operated by pol-
luters. A polluter typically leases from a data center a set of server nodes in anarrow IP address range. Data centers do not normally include ordinary P2Pusers, which typically access the Internet from residences and universities. A /24prefix is small enough so that both polluters and ordinary users do not operatefrom within the same prefix; and it is large enough to cover multiple pollutingservers in most subnets. In the third step, we search for larger subnets.
Let N denote the number of titles investigated and Tn denote the nth title.For each title Tn, we determine from the crawling database the /24 prefixes thatcontain at least one copy of title Tn. Suppose there are I(n) such /24 prefixes;denote the set of these prefixes by P(n) = {p(n)
1 , p(n)2 , . . . , p
(n)
I(n)}.

7
We now introduce the important concept of the “density of a prefix,” whichwill be used repeatedly in this paper. For each such prefix p
(n)i , define x
(n)i to
be the number of IP addresses in the prefix with at least one copy of the titleand y
(n)i to be the number of copies (included repeated copies across nodes)
of the title stored in the prefix. Finally, define the density of prefix p(n)i as
d(n)i = y
(n)i /x
(n)i .
From our assumptions about how polluters operate (see Section 2), we expectthe prefixes with high density values to be operated by polluters and prefixeswith low densities to contain only “innocent” users. We consider prefixes witha density higher than a threshold d
(n)thresh to be operated by polluters. There
are many possible heuristics that can be used to determine this threshold. Wenow describe a simple heuristic that gives good performance. It is based on themedian value of the distinct density values in {d(n)
1 , d(n)2 , . . . , dI(n)} denoted by
d(n)median. Of course, different prefixes have different numbers of users and different
densities, so in order to allow for a variance in user behavior we set a thresholdto a multiple of the median. Specifically, our heuristic sets the threshold to
d(n)thresh = kd
(n)median (1)
where k is an appropriately chosen scaling factor (see Section 5). We say that aprefix p
(n)i is a polluting prefix if d
(n)i ≥ d
(n)thresh. Let Q be the union of all the
polluting /24 prefixes over all N titles.A polluter may actually operate within a network that is larger than a /24
prefix. The third step of our methodology is to create larger prefixes whichencompass neighboring /24 prefixes in Q. For this, we merge adjacent prefixesin the IP space. We also merge some non-adjacent prefixes. To this end, weperform a traceroute from each of 20 PlanetLab nodes to one IP address in eachof the prefixes in Q. Prefixes which have the same last router become candidatesfor merging. In doing this we need to account for the possibility that some ofthe traceroutes passing through the same last router may actually pass throughthe router via different interfaces (and thus IP addresses) [9]. Suppose there areJ groups of prefixes, with each prefix in a group sharing the same last router.(Some groups may contain a single prefix.) Let Gj , j = 1, . . . , J , denote thegroups. For each group of prefixes Gj , denote pj as the longest prefix that coversall the prefixes in Gj . For each such pj we verify that it does not cross prefixesfound in a BGP table. If it does, we decompose pj back into its original /24prefixes. Let P be the resulting set of prefixes. P is our final pollutions sourceset, and consists of all the pj ’s that pass the BGP test and all of the decomposed/24 prefixes as just described.
Note that this methodology for creating a pollution source set does not in-volve the downloading of content. Indeed, any download-based methodologywould require the downloading of an excessively large number of files as wellas an automated procedure to determine whether a downloaded file is polluted.Our approach is instead based on the metadata that is gathered by the crawler.
8
This approach is efficient in that crawling a large-scale P2P file-sharing systemcan be quickly done with modest resources.
3.3 Evaluation Procedure for Pollution Source Sets
The pollution source set P may not be completely accurate in that it may notcontain all polluting nodes (false negatives) and it may contain some active nodesthat are innocent users (false positives). We evaluate a blacklisting methodologyby estimating the probability of false positives and false negatives.
To this end, we need a procedure to determine whether a downloaded versionof any given title is polluted. This can be done by downloading the version andmanually watching or listening to it. Such a manual procedure would requirean excessive amount of human resources. Instead we use a simple automatedprocedure which has been shown to give accurate results [2]. Specifically, wedownload the version into RAM and declare the version to be clean (unpolluted)if the following three criteria are met:
1. Rehashing the file results in the same hash value as the one that was usedto request the file;
2. The title is decodable according to the media format specifications; for ex-ample, an mp3 file fully decodes as a valid mp3 file [24].
3. The title’s playback duration is within 10% of the one specified in releaseinformation for that title.
In any one of the three criteria is violated, we consider the version to be polluted.We refer to this procedure as the automated version-checking procedure.
Having described our procedure to determine whether a downloaded versionis polluted, we can now state our false-negative and false-positive evaluationprocedure. To evaluate the false-negative probability, we randomly select 1,000users having IPs outside of P and having a copy of at least one of the investigatedtitles. For each randomly selected node, we randomly download 5 versions storedat that node. We declare a node to be a false negative if all of the followingconditions are satisfied: (i) it has at least 5 versions of any one of the investigatedtitles; (ii) its upload throughput is greater than a given threshold. (In Section4 we describe how we estimate a node’s upload throughput); (iii) its Last HopRTT is less than a threshold (we define Last Hop RTT in Section 4) ; and (iv) allof the randomly selected versions are polluted. Thus a randomly selected node isdeclared a false negative if that node has the main characteristics of a pollutingnode. (See Section 2.) The false-negative probability is simply the the numberof randomly selected nodes declared to be false negatives divided by the totalnumber of randomly selected nodes.
A false positive occurs when an “innocent” non-polluting node is blacklistedas a polluter by our methodology. This can happen when a /24 prefix is labelleda polluting prefix but contains non-polluting users, or when innocent users areadded to P during the merging process. To evaluate the false-positive probability,we randomly select 1,000 nodes in P containing a copy of at least one of the

9
titles. For each randomly selected node, we randomly download five versionsstored at that node. We declare a randomly selected node to be a false positiveif any of the following criteria are satisfied: (i) its throughput is smaller than thethreshold; (ii) its last hop RTT is larger than the threshold; and (iii) at leastone of the randomly selected versions is clean. The false-positive probability issimply the the number of randomly selected nodes declared to be false positivesdivided by the total number of randomly selected nodes.
3.4 Estimating Content Pollution Levels
In this subsection we provide our methodology for estimating the pollution levelof any arbitrary title Tn. The methodology builds on the blacklisting method-ology. We define the pollution level of a title as the fraction of copies of thetitle available in the P2P file sharing system that are polluted. The pollutionlevel of a title can be estimated by randomly selecting a large number of copiesof the title, downloading each of the copies, and then testing the copies for pol-lution (either by listening to them or through some automated procedure). Thisrequires an exorbitant amount of resources, particularly if we wish to accuratelydetermine the pollution levels of many titles. We instead estimate the pollutionlevels of titles directly from the metadata available in the crawling database. Tothis end, we make the following assumptions:
1. All copies of the title that are stored in a blacklisted node (that is, in a nodein P) are polluted.
2. For each node outside of P with at least one copy of Tn, all copies stored atthat node are polluted except for one copy.
With these assumptions, we now derive an expression for E(n), the estimatedpollution level of title Tn. For a title Recall that y(n) is the total number ofcopies of the title available in the crawling database. Also let z(n) be the numberof nodes outside of the blacklist set P that have at least one copy of Tn. Theabove two assumptions imply that the number of copies of Tn that are pollutedis y(n) − z(n); thus, our estimate of the pollution level for title Tn is
E(n) =y(n) − z(n)
y(n)(2)
3.5 Evaluation Procedure for Pollution-Level Estimation
E(n) is an estimate of the pollution level of title Tn, derived solely from themetadata in the crawling database. To evaluate the accuracy of this estimate,we compare it with a measured value, which is obtained by actually downloadingcontent. Specifically, for a given title Tn we do the following:
1. We download the most popular versions of the title. The number of versionsdownloaded is such that the downloaded versions covers at least 80% of allcopies of the title in the file-sharing system. For title Tn, let Jn be the numberof versions that meet this 80% criterion.

10
2. For each of these versions, we determine if the version is polluted or notusing the automated version checking procedure described in Section 3.3.Let δ
(n)i be equal to 1 if version i is determined polluted and be equal to 0
otherwise.3. The crawling database provides the number of copies that each version con-
tributes. Let c(n)i be the number of copies of version i in the database. We
calculate the fraction of polluted copies L(n) as
L(n) =∑Jn
i=1 c(n)i δ
(n)i∑Jn
i=1 c(n)i
(3)
We then define the error in the pollution-level estimate as:
Error =|E(n) − L(n)|
L(n)(4)
We present the resulting error and its implications in Section 5.
4 Experimental Setup
We evaluated our methodologies from data collected in the FastTrack file-sharingnetwork. We first briefly describe the FastTrack network and the FastTrackcrawler.
4.1 FastTrack Crawler
With more than two million simultaneous active nodes (in Nov 2004), FastTrackis one of the largest P2P file sharing systems. It has at least an order of magnitudemore users than Gnutella. It is used by several FastTrack clients including Kazaa,kazaa-lite, Grokster, and iMesh. It is also known to be the target of the pollutionattack. For these reasons, we chose to test our pollution source set and pollution-level methodologies on FastTrack.
In [2] we already described the FastTrack Network structure and a crawlingplatfrom that we developped for it. In thise paper we use our crawler to collectmetadata and analyse it.
4.2 PlanetLab Measurement
As part of our evaluation procedures, we also determine the download through-put and the last-hop Round Trip Time (RTT) at various nodes in the FastTracknetwork. We now describe how we measure those metrics. Download throughputand last-hop RTT depend on the measurement host from which the measure-ment is being initiated. To reduce the observer bias, we distributed our measuringhosts on a number of PlanetLab nodes.

11
Throughput We used 20 well connected PlanetLab hosts that downloaded datafrom each measured host. The measurement was performed in the following way.The PlanetLab nodes sequentially establish TCP connections to each measuredFastTrack node. For each connection, the PlanetLab host requests 500KB ofdata. If t denotes the time from when the PlanetLab host begins to receive the500KB until when it has received all of the 500 KB, then the throughput ofthe connection is defined to be (500KB)/t. The throughput of the node is thenobtained by averaging the throughput over all successful connections. A customprogram was developed to download and report those measurements from thedifferent nodes.
Estimated Last-Hop RTT To verify our blacklisting methodology, we alsomeasured the Last-Hop Round Trip Time (RTT). The last-hop RTT is the timeit takes a small packet to travel from this last router to the destination hostand back to the last router [22]. We can only estimate the last-hop RTT withindirect measurement from our sources, since we don’t have access to the routers.To estimate the last-hop RTT, we measure the minimum out of 3 RTTs from thesource to the destination from which we subtract the minimum RTT from thesource to the last router, as shown in Figure 1. For each PlanetLab source, wefound the difference of those values and took the minimum one as an estimateof the last-hop RTT for that target IP address.
src dstlast hop router
Fig. 1. Computing Estimated Last-Hop RTT: The estimated last-hop RTT (grey) isthe difference between the RTT times to the destination host and the last-hop router.
In both experiments we used 20 PlanetLab nodes and we selected them fromdifferent parts of North America, Europe, Asia and the Pacific.
5 Results
In this section we present the results of our experiments. We first describe the rawdata. We then provide the results pertaining to the blacklisting and pollution-level methodologies.

12
5.1 Raw Data
The crawling platform captured 124GB of metadata on the KaZaA network fromNov 21 to Nov 27. The crawler queried supernodes around the world for 170titles, consisting of 133 songs and 37 movies. We choose these title as follows.As discussed in Section 2, popular, newly released titles are often targets forpollution. Even though this paper mostly focuses on music, we include somemovie titles to illustrate that the technique is universal. Most of the chosensongs are new popular songs, with their titles obtained from the listing availableat itunes.com [6]. Some of the chosen songs are “oldies” obtained from about.com70s charts [7]. The remaining chosen content is newly released DVDs from thelist of top rentals at blockbuster.com [8]. This selection gave us a varied list ofpopular titles without particular taste or style preference bias in our results.
Table 1 includes some of the data that we gathered from the crawler for afew of the representative titles. The titles in this table are chosen to representa diversity of data distributions. The presented data includes the title numbers;the number of versions (hashes) of that title that were observed; the number ofusers who possess a copy of any version of title; the number of copies of the title;the total number IP addresses that were gathered (Because multiple FastTrackclients can be present on one IP address, one IP address can represent more thanone user.); and the number of public IP addresses.
Table 1. Raw Data for Representative Titles
title versions users copies total IPs Public IPs
040 225341 135102 2120160 8627 7577
008 155642 112542 1575686 6188 5298
060 91447 172879 300865 57681 52252
052 48607 126226 301075 46129 40419
097 9648 28583 37173 17468 15289
009 3795 41405 56215 24689 22388
111 5503 14519 17562 9801 8437
005 5856 56351 67945 37051 32162
5.2 Pollution Source Identification
We now present and analyze the results obtained from our blacklisting method-ology. We clustered all public IP addresses from our database into /24 prefixesand calculated the density of each prefix. Figures 2(a) and 2(b) show the densitydistribution for the title “Pain” by “Jimmy Eat World” (040). Figures 2(c) and2(d) show the same plots but for the title “Let’s Get It Started” by “Black EyedPeas” (005). For both titles, most of the prefixes have a density of 1. For “Pain”,there are 5,012 prefixes with density 1 and for “Let’s Get It Started”, there are28,506 such prefixes. It is clear from these figures that for some titles there are

13
prefixes with extremely high densities (there are prefixes with over density ofover 10,000 in title 040), while for other titles, all prefixes have low densities(allprefixes have density less than 15 in title 005). It is also clear from these figuresthat title 005 has not been targeted by the pollution attack whereas the title040 has.
1
10
100
1000
10000
1 2 4 6 8 13 17 24 33 182
5575
1003
4
2772
9
density
num
ber
of 24 p
refixes in log s
cale
(a) Number of /24 subnets per den-sity value of one title 040
(b) Density distributions of the /24subnets of the entire IPv4 range andblacklist threshold of title 040
1
10
100
1000
10000
100000
1 1.4 1.8 2.75 4 6.5 11
density
nu
mb
er
of /2
4 p
refixe
s in
lo
g s
ca
le
(c) Number of /24 subnets per den-sity value of title 005
(d) Density distributions of the /24subnets of the entire IPv4 range andblacklist threshold of title 005
We now turn our attention to determining the blacklist set using the black-listing methodology developed in Section 3. As defined in Equation 1, we use ablacklisting threshold of kd
(n)median. In that formula k is an experimental constant;
through many trials we found that k = 8 consistently achieves good separationof ordinary users and polluters. Figures 2(b) and 2(d) include the thresholdsfor the two titles. In the case of the polluted title “Pain,” with median of 17and resulting threshold of d
(040)thresh = 136, it successfully manages to separate the
majority users from the outstanding few with high density, while in the case ofthe clean song “Let’s Get It Started,” with median of 4 and theshold of 32, thethreshold is above all prefix densities and thus does not blacklist any prefix.
For the prefixes with densities larger than the threshold for each title, thereare 114 /24 prefixes, containing 1,218 IP address (with one of the titles), 70,224,279

14
title copies, and 10,518,683 versions of 154 of the 170 titles that we had in ourcrawling database. Note that a very small fraction of the /24 prefixes in Fast-Track are responsible for pollution.
The next step of our methodology is the merging of the prefixes that aretopologically close. Merging the consecutive /24 prefixes and those that havethe same last hop router resulted in decreasing the number of clusters to 101prefixes, with the masks ranging from /24 to /16. We then performed the BGPprefix verification. The BGP prefixes are from [10] obtained on 12/06/04. We hadinformation about 17,037,611 prefixes. Some of the prefixes that resulted frommerging were part of different BGP prefixes. Those merges had to be abandoned.After the BGP verification we had a final list of identified polluter IP ranges,details for which we present in Table 2. We see from the table that the resultingblacklist set P has 112 prefixes. These prefixes contain 1,218 IP addresses thatcontain at least one copy of one of the investigated titles. The table also showsthat the methodology does not blacklist the remaining 325,075 prefixes, whichcontain over 1.3 million IP addresses with the investigated content. To under-stand better the distribution of those prefixes we also determined the number ofBGP prefixes and ASs that the were supersets of the the blacklisted ranges. Wepresent those numbers also in Table 2. The 112 prefixes that we found are partsof 79 BGP prefixes, or 59 BGP ASs - a very limited set of prefixes compared tothe total number of prefixes and ASs found in the BGP tables.
Table 2. Pollution Source Results
Number of Number of Number of Number ofNodes IPs prefixes BGP prefixes BGP ASs
Blacklisted 1218 112 79 59
Non-Blacklisted 1,303,954 325,075 15,747 4,296
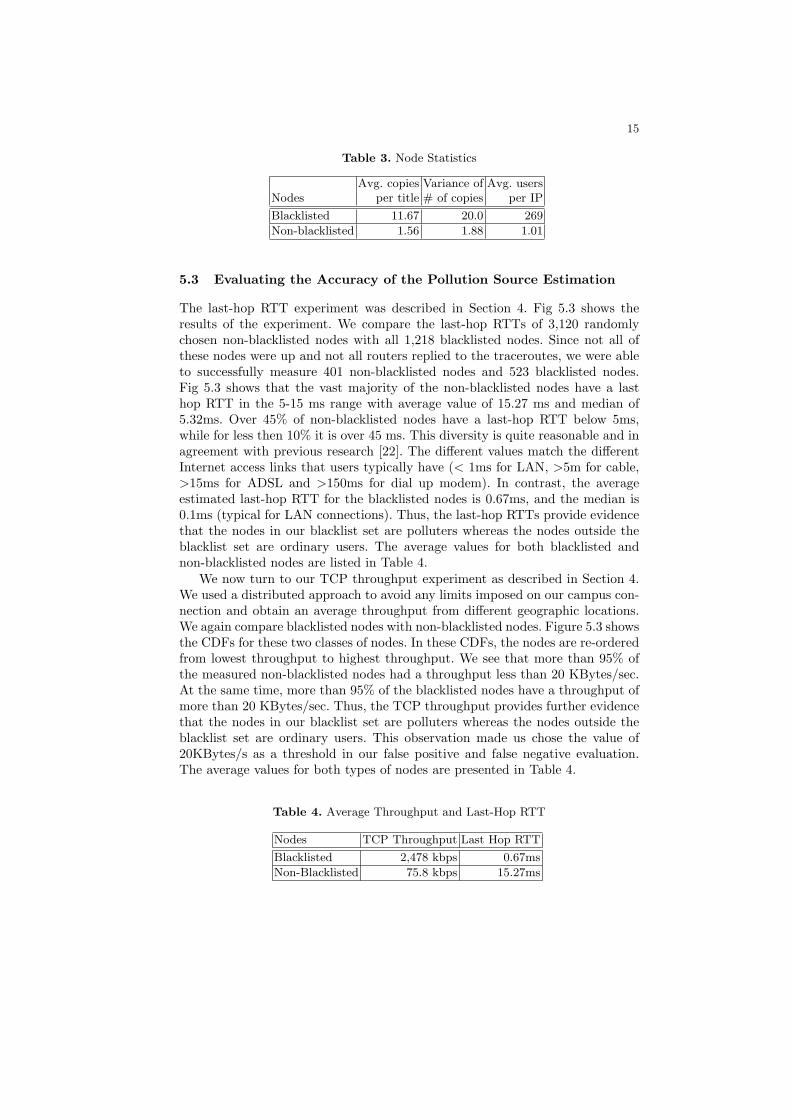
Table 3 provides important insights into the characteristics of the nodesblacklisted by the methodology. A non-blacklisted node, when it has at leastone copy of a particular title, has on average 1.56 copies of that title. On theother hand, a blacklisted node, when it has at least one copy of a particular title,has on average more than 11 copies of the title (each of a different version)! Thevariance of the number of copies per title is also reported in Table 3. Finally, thenumber of users (client instances) per node is also reported. It is interesting tonote that a blacklisted node has on average a remarkable 269 user instances perIP address. In contrast, non-blacklisted nodes have essentially just one instanceper IP. The exact value of 1.01 can be explained by the use of SOCKS proxiesthat allow different users to connect to the P2P network with the same publicIP address but different username and port number.
15
Table 3. Node Statistics
Avg. copies Variance of Avg. usersNodes per title # of copies per IP
Blacklisted 11.67 20.0 269
Non-blacklisted 1.56 1.88 1.01
5.3 Evaluating the Accuracy of the Pollution Source Estimation
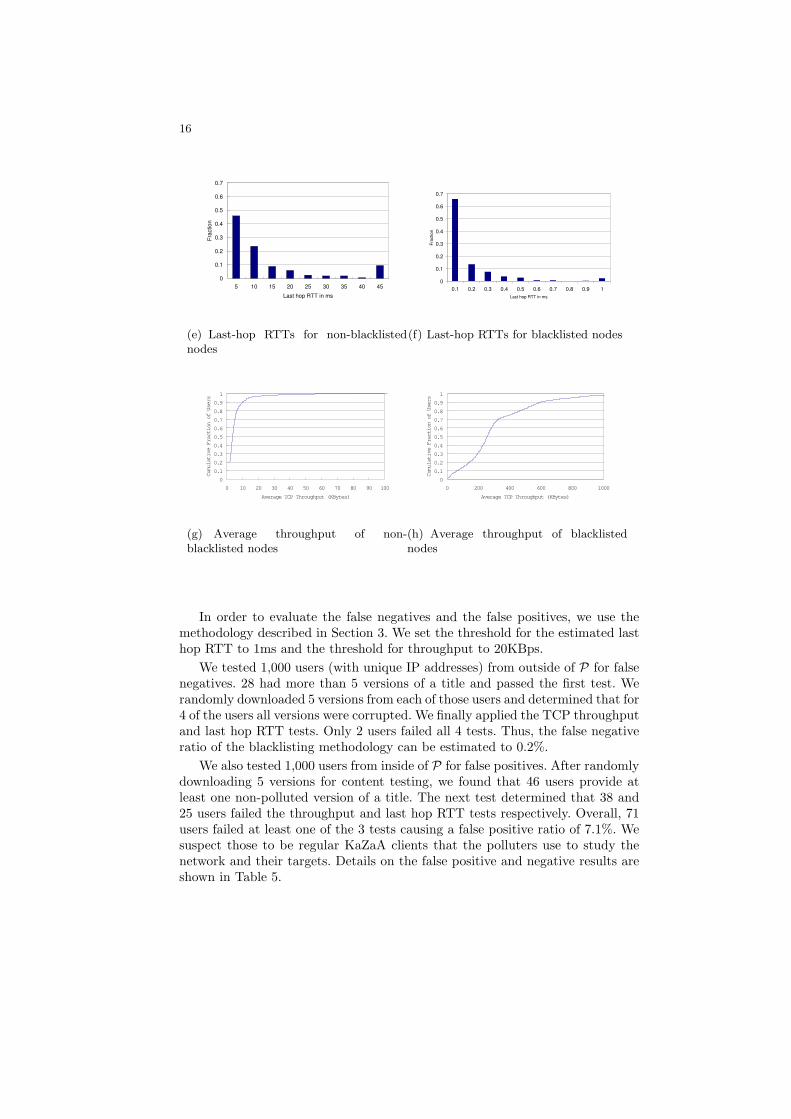
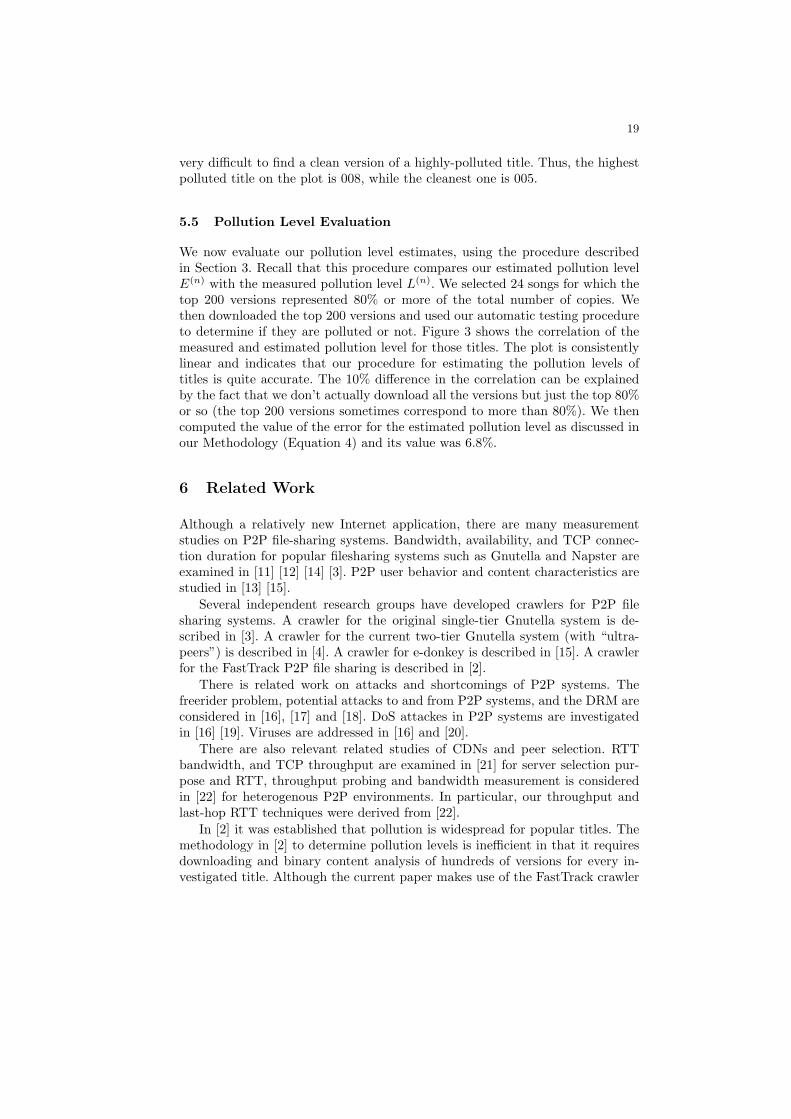
The last-hop RTT experiment was described in Section 4. Fig 5.3 shows theresults of the experiment. We compare the last-hop RTTs of 3,120 randomlychosen non-blacklisted nodes with all 1,218 blacklisted nodes. Since not all ofthese nodes were up and not all routers replied to the traceroutes, we were ableto successfully measure 401 non-blacklisted nodes and 523 blacklisted nodes.Fig 5.3 shows that the vast majority of the non-blacklisted nodes have a lasthop RTT in the 5-15 ms range with average value of 15.27 ms and median of5.32ms. Over 45% of non-blacklisted nodes have a last-hop RTT below 5ms,while for less then 10% it is over 45 ms. This diversity is quite reasonable and inagreement with previous research [22]. The different values match the differentInternet access links that users typically have (< 1ms for LAN, >5m for cable,>15ms for ADSL and >150ms for dial up modem). In contrast, the averageestimated last-hop RTT for the blacklisted nodes is 0.67ms, and the median is0.1ms (typical for LAN connections). Thus, the last-hop RTTs provide evidencethat the nodes in our blacklist set are polluters whereas the nodes outside theblacklist set are ordinary users. The average values for both blacklisted andnon-blacklisted nodes are listed in Table 4.
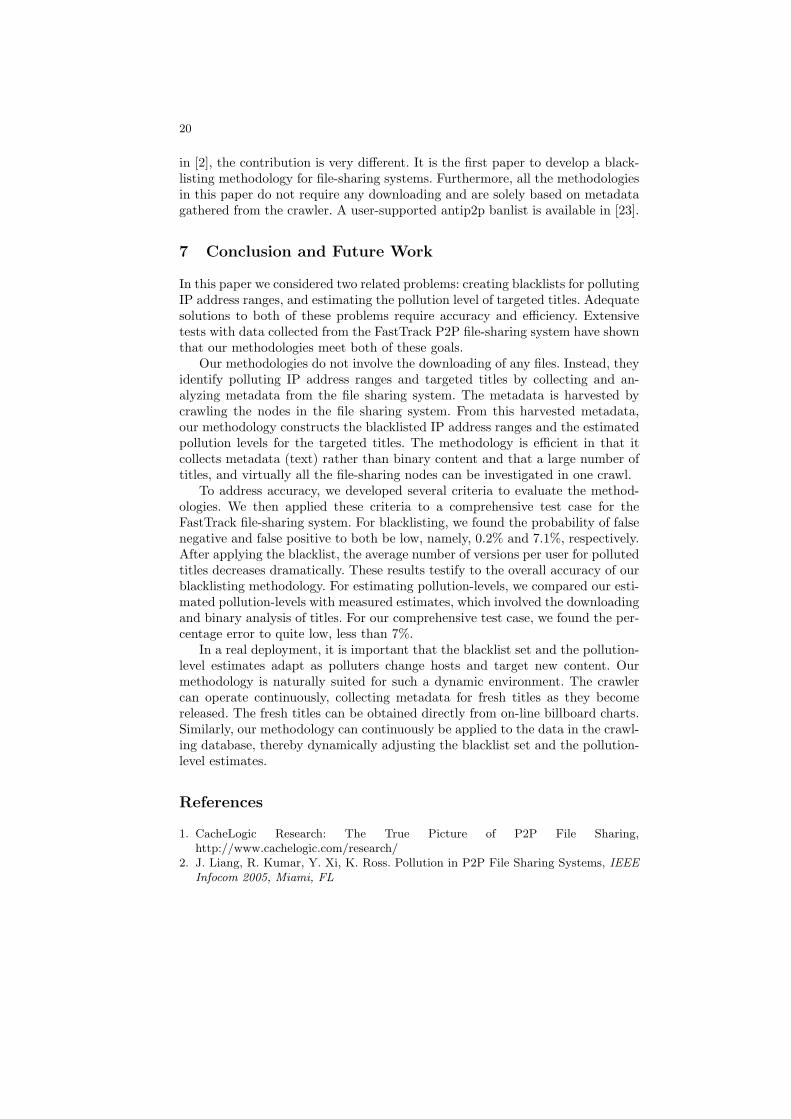
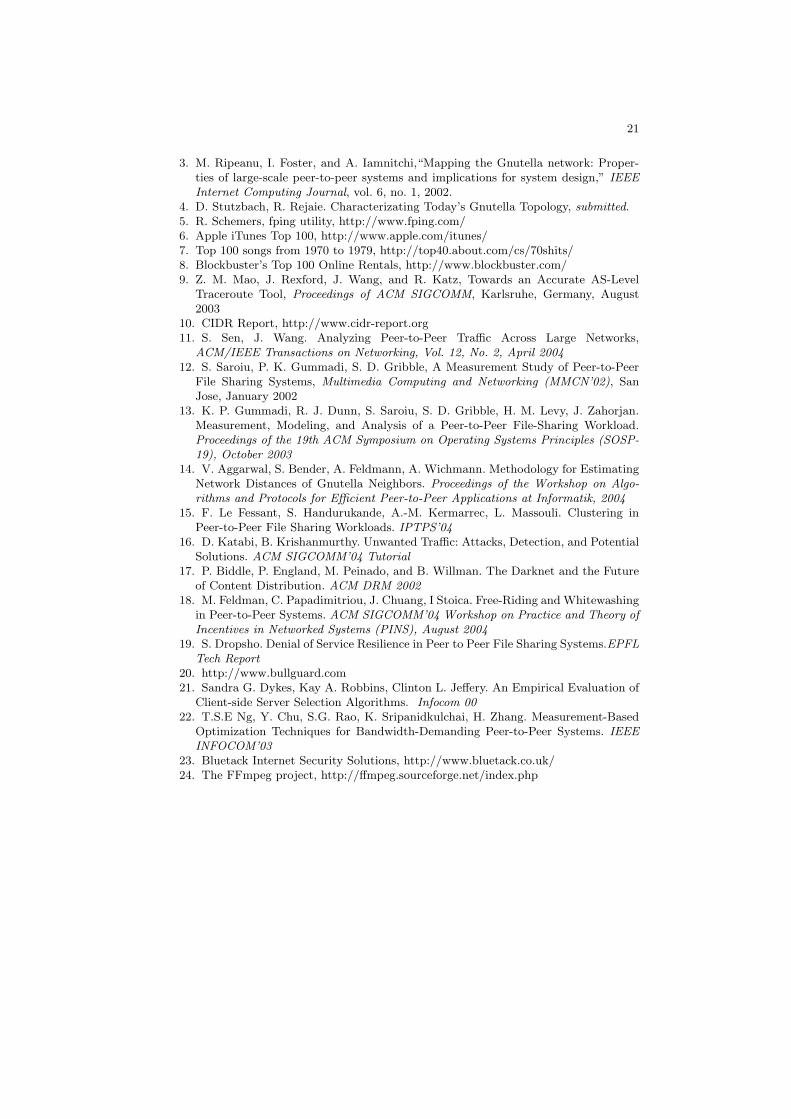
We now turn to our TCP throughput experiment as described in Section 4.We used a distributed approach to avoid any limits imposed on our campus con-nection and obtain an average throughput from different geographic locations.We again compare blacklisted nodes with non-blacklisted nodes. Figure 5.3 showsthe CDFs for these two classes of nodes. In these CDFs, the nodes are re-orderedfrom lowest throughput to highest throughput. We see that more than 95% ofthe measured non-blacklisted nodes had a throughput less than 20 KBytes/sec.At the same time, more than 95% of the blacklisted nodes have a throughput ofmore than 20 KBytes/sec. Thus, the TCP throughput provides further evidencethat the nodes in our blacklist set are polluters whereas the nodes outside theblacklist set are ordinary users. This observation made us chose the value of20KBytes/s as a threshold in our false positive and false negative evaluation.The average values for both types of nodes are presented in Table 4.
Table 4. Average Throughput and Last-Hop RTT
Nodes TCP Throughput Last Hop RTT
Blacklisted 2,478 kbps 0.67ms
Non-Blacklisted 75.8 kbps 15.27ms
16
0
0.1
0.2
0.3
0.4
0.5
0.6
0.7
5 10 15 20 25 30 35 40 45
Last hop RTT in ms
Fra
ction
(e) Last-hop RTTs for non-blacklistednodes
0
0.1
0.2
0.3
0.4
0.5
0.6
0.7
0.1 0.2 0.3 0.4 0.5 0.6 0.7 0.8 0.9 1
Last hop RTT in ms
Fra
ctio
n
(f) Last-hop RTTs for blacklisted nodes
0
0.1
0.2
0.3
0.4
0.5
0.6
0.7
0.8
0.9
1
0 10 20 30 40 50 60 70 80 90 100
Average TCP Throughput (KBytes)
Cumulative Fraction of Users
(g) Average throughput of non-blacklisted nodes
0
0.1
0.2
0.3
0.4
0.5
0.6
0.7
0.8
0.9
1
0 200 400 600 800 1000
Average TCP Throughput (KBytes)
Cumulative Fraction of Users
(h) Average throughput of blacklistednodes
In order to evaluate the false negatives and the false positives, we use themethodology described in Section 3. We set the threshold for the estimated lasthop RTT to 1ms and the threshold for throughput to 20KBps.
We tested 1,000 users (with unique IP addresses) from outside of P for falsenegatives. 28 had more than 5 versions of a title and passed the first test. Werandomly downloaded 5 versions from each of those users and determined that for4 of the users all versions were corrupted. We finally applied the TCP throughputand last hop RTT tests. Only 2 users failed all 4 tests. Thus, the false negativeratio of the blacklisting methodology can be estimated to 0.2%.
We also tested 1,000 users from inside of P for false positives. After randomlydownloading 5 versions for content testing, we found that 46 users provide atleast one non-polluted version of a title. The next test determined that 38 and25 users failed the throughput and last hop RTT tests respectively. Overall, 71users failed at least one of the 3 tests causing a false positive ratio of 7.1%. Wesuspect those to be regular KaZaA clients that the polluters use to study thenetwork and their targets. Details on the false positive and negative results areshown in Table 5.

17
Table 5. Pollution Source Evaluation Tests
Versions Polluted Throughput RTT Total
False neg 2.8% 0.40% 7.5% 12% 0.20%
False pos N/A 4.60% 3.8% 2.5% 7.10%
We also evaluate the effect of the blacklisting methodology by comparingthe average number of copies per user in FastTrack without blacklisting andwith blacklisting. Figure 2(i) shows a plot of the average number of copies andthe variance for the 122 titles that we analyzed when blacklisting is employed.Fig 2(j) shows the same graph without the blacklisting. Note that the scale ofthe graph changes by a factor of 20 and becomes much more uniform. Afterblacklisting, the average number of copies of a title dropped down to less than3 for all titles with a maximum variance of about 3.
0
10
20
30
40
50
60
70
80
1 6 11 16 21 26 31 36
Average copies
Variance o
f copie
s
(i) Before Blacklisting
0
1
2
3
4
1 1.5 2 2.5
Average copies
Variance o
f copie
s
(j) After Blacklisting
0
0.2
0.4
0.6
0.8
1
0 0.1 0.2 0.3 0.4 0.5
users fraction
cum
ula
tive c
opie
s fra
ction s005
s008
s009
s040
s052
s060
s097
s111
(k) Copies per user
0
0.1
0.2
0.3
0.4
0.5
0.6
0.7
0.8
0.9
1
0 100 200 300 400 500
versions
cu
mu
lative
co
pie
s fra
ctio
n
s005
s008
s009
s040
s052
s060
s097
s111
(l) Copies per version

18
5.4 Estimating Pollution Levels
We used our methodology described in Section 3 to determine the pollutionlevels of the 122 investigated titles.
We present the pollution levels, obtained by the formulas in Section 3, forall 122 titles. Since this would take up too much space, in Figure 2 we presenta bar graph showing the number of titles with their pollution level in differentintervals. The picture shows that 58 of the titles have estimated pollution level of90% or more, while 51 titles have pollution level of less than 50%. There are notitles with pollution level of 0% because every title has some number of pollutedversions out there.
0
1015 14
2 16 4
12
58
0
10
20
30
40
50
60
70
0-9%
10%
-19%
20%
-29%
30%
-39%
40%
-49%
50%
-59%
60%
-69%
70%
-79%
80%
-89%
90%
-100
%
Estimated pollution level
Nu
mb
er
of
title
s
Fig. 2. Estimated Pollution Level of all122 analized titles
0
0.2
0.4
0.6
0.8
1
0 0.2 0.4 0.6 0.8 1
Estimated pollution level
me
asu
red
po
llutio
n le
ve
l
Fig. 3. Measured vs. estimated pollu-tion levels for 24 titles
To give further insight into pollution levels, we plotted the CDFs of thefraction of copies versus the fraction of users for the titles under investigation.Due to space constraints, in Fig 2(k) we only show the plots for 8 representativetitles. For some titles the large percentage of all copies is concentrated within asmall number of users; those titles have a very skewed CDF. Other titles havea more uniform distribution for the number of versions per user. The CDF of atitle gives a visual representation of its pollution level. A very skewed CDF showsthat just a few users have copies of most of the versions of a title. A regular userdoes not normally have hundreds or thousands of versions of the same song; sothose users must be polluters and the title must be polluted.
Another interesting result that we present here is the distribution of thenumber of copies of a title and the number of versions. The CDFs for the 8representative titles are shown in Figure 2(l). The figure shows that for sometitles the top 100 versions account for 80% or more of the copies that are availableon the network. This result is indeed expected since clean songs usually have fewpopular versions. Other titles, however, are highly scattered, having as many asthe top 500 of their versions accounting for a less than 30% of the total numberof copies for that title. This also matches our expectations and explains why it is
19
very difficult to find a clean version of a highly-polluted title. Thus, the highestpolluted title on the plot is 008, while the cleanest one is 005.
5.5 Pollution Level Evaluation
We now evaluate our pollution level estimates, using the procedure describedin Section 3. Recall that this procedure compares our estimated pollution levelE(n) with the measured pollution level L(n). We selected 24 songs for which thetop 200 versions represented 80% or more of the total number of copies. Wethen downloaded the top 200 versions and used our automatic testing procedureto determine if they are polluted or not. Figure 3 shows the correlation of themeasured and estimated pollution level for those titles. The plot is consistentlylinear and indicates that our procedure for estimating the pollution levels oftitles is quite accurate. The 10% difference in the correlation can be explainedby the fact that we don’t actually download all the versions but just the top 80%or so (the top 200 versions sometimes correspond to more than 80%). We thencomputed the value of the error for the estimated pollution level as discussed inour Methodology (Equation 4) and its value was 6.8%.
6 Related Work
Although a relatively new Internet application, there are many measurementstudies on P2P file-sharing systems. Bandwidth, availability, and TCP connec-tion duration for popular filesharing systems such as Gnutella and Napster areexamined in [11] [12] [14] [3]. P2P user behavior and content characteristics arestudied in [13] [15].
Several independent research groups have developed crawlers for P2P filesharing systems. A crawler for the original single-tier Gnutella system is de-scribed in [3]. A crawler for the current two-tier Gnutella system (with “ultra-peers”) is described in [4]. A crawler for e-donkey is described in [15]. A crawlerfor the FastTrack P2P file sharing is described in [2].
There is related work on attacks and shortcomings of P2P systems. Thefreerider problem, potential attacks to and from P2P systems, and the DRM areconsidered in [16], [17] and [18]. DoS attackes in P2P systems are investigatedin [16] [19]. Viruses are addressed in [16] and [20].
There are also relevant related studies of CDNs and peer selection. RTTbandwidth, and TCP throughput are examined in [21] for server selection pur-pose and RTT, throughput probing and bandwidth measurement is consideredin [22] for heterogenous P2P environments. In particular, our throughput andlast-hop RTT techniques were derived from [22].
In [2] it was established that pollution is widespread for popular titles. Themethodology in [2] to determine pollution levels is inefficient in that it requiresdownloading and binary content analysis of hundreds of versions for every in-vestigated title. Although the current paper makes use of the FastTrack crawler
20
in [2], the contribution is very different. It is the first paper to develop a black-listing methodology for file-sharing systems. Furthermore, all the methodologiesin this paper do not require any downloading and are solely based on metadatagathered from the crawler. A user-supported antip2p banlist is available in [23].
7 Conclusion and Future Work
In this paper we considered two related problems: creating blacklists for pollutingIP address ranges, and estimating the pollution level of targeted titles. Adequatesolutions to both of these problems require accuracy and efficiency. Extensivetests with data collected from the FastTrack P2P file-sharing system have shownthat our methodologies meet both of these goals.
Our methodologies do not involve the downloading of any files. Instead, theyidentify polluting IP address ranges and targeted titles by collecting and an-alyzing metadata from the file sharing system. The metadata is harvested bycrawling the nodes in the file sharing system. From this harvested metadata,our methodology constructs the blacklisted IP address ranges and the estimatedpollution levels for the targeted titles. The methodology is efficient in that itcollects metadata (text) rather than binary content and that a large number oftitles, and virtually all the file-sharing nodes can be investigated in one crawl.
To address accuracy, we developed several criteria to evaluate the method-ologies. We then applied these criteria to a comprehensive test case for theFastTrack file-sharing system. For blacklisting, we found the probability of falsenegative and false positive to both be low, namely, 0.2% and 7.1%, respectively.After applying the blacklist, the average number of versions per user for pollutedtitles decreases dramatically. These results testify to the overall accuracy of ourblacklisting methodology. For estimating pollution-levels, we compared our esti-mated pollution-levels with measured estimates, which involved the downloadingand binary analysis of titles. For our comprehensive test case, we found the per-centage error to quite low, less than 7%.
In a real deployment, it is important that the blacklist set and the pollution-level estimates adapt as polluters change hosts and target new content. Ourmethodology is naturally suited for such a dynamic environment. The crawlercan operate continuously, collecting metadata for fresh titles as they becomereleased. The fresh titles can be obtained directly from on-line billboard charts.Similarly, our methodology can continuously be applied to the data in the crawl-ing database, thereby dynamically adjusting the blacklist set and the pollution-level estimates.
References
1. CacheLogic Research: The True Picture of P2P File Sharing,http://www.cachelogic.com/research/
2. J. Liang, R. Kumar, Y. Xi, K. Ross. Pollution in P2P File Sharing Systems, IEEEInfocom 2005, Miami, FL
21
3. M. Ripeanu, I. Foster, and A. Iamnitchi,“Mapping the Gnutella network: Proper-ties of large-scale peer-to-peer systems and implications for system design,” IEEEInternet Computing Journal, vol. 6, no. 1, 2002.
4. D. Stutzbach, R. Rejaie. Characterizating Today’s Gnutella Topology, submitted.5. R. Schemers, fping utility, http://www.fping.com/6. Apple iTunes Top 100, http://www.apple.com/itunes/7. Top 100 songs from 1970 to 1979, http://top40.about.com/cs/70shits/8. Blockbuster’s Top 100 Online Rentals, http://www.blockbuster.com/9. Z. M. Mao, J. Rexford, J. Wang, and R. Katz, Towards an Accurate AS-Level
Traceroute Tool, Proceedings of ACM SIGCOMM, Karlsruhe, Germany, August2003
10. CIDR Report, http://www.cidr-report.org11. S. Sen, J. Wang. Analyzing Peer-to-Peer Traffic Across Large Networks,
ACM/IEEE Transactions on Networking, Vol. 12, No. 2, April 200412. S. Saroiu, P. K. Gummadi, S. D. Gribble, A Measurement Study of Peer-to-Peer
File Sharing Systems, Multimedia Computing and Networking (MMCN’02), SanJose, January 2002
13. K. P. Gummadi, R. J. Dunn, S. Saroiu, S. D. Gribble, H. M. Levy, J. Zahorjan.Measurement, Modeling, and Analysis of a Peer-to-Peer File-Sharing Workload.Proceedings of the 19th ACM Symposium on Operating Systems Principles (SOSP-19), October 2003
14. V. Aggarwal, S. Bender, A. Feldmann, A. Wichmann. Methodology for EstimatingNetwork Distances of Gnutella Neighbors. Proceedings of the Workshop on Algo-rithms and Protocols for Efficient Peer-to-Peer Applications at Informatik, 2004
15. F. Le Fessant, S. Handurukande, A.-M. Kermarrec, L. Massouli. Clustering inPeer-to-Peer File Sharing Workloads. IPTPS’04
16. D. Katabi, B. Krishanmurthy. Unwanted Traffic: Attacks, Detection, and PotentialSolutions. ACM SIGCOMM’04 Tutorial
17. P. Biddle, P. England, M. Peinado, and B. Willman. The Darknet and the Futureof Content Distribution. ACM DRM 2002
18. M. Feldman, C. Papadimitriou, J. Chuang, I Stoica. Free-Riding and Whitewashingin Peer-to-Peer Systems. ACM SIGCOMM’04 Workshop on Practice and Theory ofIncentives in Networked Systems (PINS), August 2004
19. S. Dropsho. Denial of Service Resilience in Peer to Peer File Sharing Systems.EPFLTech Report
20. http://www.bullguard.com21. Sandra G. Dykes, Kay A. Robbins, Clinton L. Jeffery. An Empirical Evaluation of
Client-side Server Selection Algorithms. Infocom 0022. T.S.E Ng, Y. Chu, S.G. Rao, K. Sripanidkulchai, H. Zhang. Measurement-Based
Optimization Techniques for Bandwidth-Demanding Peer-to-Peer Systems. IEEEINFOCOM’03
23. Bluetack Internet Security Solutions, http://www.bluetack.co.uk/24. The FFmpeg project, http://ffmpeg.sourceforge.net/index.php