Embed Size (px)
Citation preview

Echolocation and flight strategies of Japanese house bats(Pipistrellus abramus) to attack a prey in the field
revealed by a microphone array
E. Fujiokaa, S. Mantania, M. Fukudaa, S. Hiryua, H. Riquimarouxa,b and Y.Watanabea
aFaculty of Engineering, Doshisha Univ., 1-3 Miyakodani Tatara, 610-0321 Kyotanabe, JapanbBio-navigation Research Ctr., Doshisha Univ., 1-3 Miyakodani Tatara, 610-0321 Kyotanabe,
Acoustics 08 Paris
5935

Bats are supposed to have effective strategies for achieving a good balance between echolocation and flight behaviors while capturing small moving insects in the field. To reveal their strategies for catching insects, we successfully reconstructed 3-D flight trajectories for the bat to forage in the field by a four-microphone array system, and conducted both acoustical and behavioral analyses for capturing behavior. Data show that the flying bats changed their flight direction flexibly, and sometime repeated capturing insects every two to three seconds. During the search phase, the bat moved 0.5-0.8 m during an interval between successive pulses (IPI) and then decreased that the moving distance during an IPI up to 0.1 m just before capturing a prey. Interestingly, we found that the bat tended to descend toward a prey from above when the approach phase started. This suggests that foraging bats may effectively utilize gravity for an easy acceleration toward the prey to concentrate on the complex echolocation for capturing moving insects.
1 Introduction
Echolocating bats can fly freely in complete darkness by using highly developed sonar system [1]. Since insectivorous bats capture a plenty of small airborne insects a day during flight, they are supposed to have effective strategies for achieving a good balance between echolocation and flight behaviours while they repeat capturing moving insects in the field. So far, many field recordings of echolocation sounds emitted by the bats have been conducted in various bat species [2-4]. However, precise simultaneous measurements of flight and echolocation have not been well conducted due to technological difficulty. In this study, we measured simultaneously echolocation sounds and 3-D position of Japanese house bats (Pipistrellus abramus) capturing prey in the field by using four-microphone array system. The main purpose of this study is to understand the relationship between flight path of the foraging bats and the acoustic parameters of their echolocation pulse. We investigated how P. abramus select their flight path for capturing small airborne insects effectively.
2 Materials and Methods
2.1 Subject
The Japanese house bats (P. abramus) were observed in this study. The body length of P. abramus is approximately 50 mm, the wingspread is 150 mm. The body mass ranges from 5 to 10 g. The bats are regularly seen above large rice field or waterfront for foraging during summer evenings. Figure 1 shows an example of an echolocation pulse emitted by P. abramus. The bats emit broadband frequency-modulated pulses through their mouth with harmonics. The fundamental component is downwardly modulated from 100 kHz to 40 kHz [4].
2.2 Recording procedure
Sound recordings were conducted for 4 days (22 July, 14 October, 25 October, 9 November 2006) during a 1–hour period before and after the sunset. The study site was the large open area over a riverside near the campus of
Doshisha University in southern Kyoto Prefecture, Japan. Echolocation pulses by foraging P. abramus were recorded with 4 condenser microphones (Knowles, FG-3329, Illinois, USA) positioned about 2 m above the ground (Fig. 2). Microphones were arranged in a symmetrical star-shaped hydrophone array constructed by Au and Herzing [5]. Echolocation sounds obtained by these microphones were band-pass filtered (10-250 kHz) and then digitized with 16 bit at a sampling rate of 500 kHz with a DAQ devise (NI, PXI-6250, Tokyo, Japan). The signals were stored in a personal computer. Acoustic parameters were analyzed by using a custom made program of MATLAB on a personal computer. The arrival time difference of signals between the microphones was computed by using cross-correlation functions (auto-correlation functions). We then calculated 3-D coordinates of the sound source by the equation (1).
0 5 10 15
200
150
100
50
0
Freq
uenc
y [K
Hz]
Time [ms]0 5 10 15
200
150
50
0-4
-2
0
2
4
Am
plitu
de [V
]
151050
Time [ms]
A B
Fig. 1 Typical echolocation pulse emitted by the Pipistrellus abramus during flight. (A) Temporal amplitude pattern. (B) Spectrogram.
(Sampling 500kHz) PC
: MICROPHONE
2.25 m
0.9 m
(Sampling 500kHz) PC
: MICROPHONE: MICROPHONE
2.25 m
0.9 m
A/D Converter(Sampling 500kHz) PC
: MICROPHONE: MICROPHONE
2.25 m
0.9 m
(Sampling 500kHz) PC
: MICROPHONE: MICROPHONE
2.25 m
0.9 m
A/D Converter
Fig. 2 Four-microphone array system. Arrows in the left picture indicate every microphone position.
0
1 2
3
Acoustics 08 Paris
5936

( )( )
( ) ( )
( ) ,
,2
2
,32
2
,2
3
21
222
2203
203
201
2202
20302
030201
203
202
201
22
yxz
y
x
SSRS
aacRcS
accccRS
ccaR
−−=
−+=
−+−=
++++−
=
ττ
ττττ
ττττττ
(1)
where R is the range from the center microphone to the sound source, c is the speed of the sound in air, a is the length between center microphone and the other microphones (0.9m), i0τ is the time of arrival difference between the center microphone and the ith microphone (i=1.2.3 in Fig. 2). Prior to recording, reconstructed 3-D position by the microphone array was calibrated using a loudspeaker (Pioneer, PT-R7, Tokyo, Japan). The position of the sound source was measured by using five pings at 40 kHz for target ranges between 5 m and zero by 1 m interval. Figure 3 shows that the maximum deviation of measured range was less than 3 %. Acoustic parameters of the echolocation pulse were analyzed from sonograms using the program of MATLAB. Pulse duration was determined from the sonogram at -25 dB relative to the peak intensity of the pulse. We measured inter-pulse interval (IPI) determined from the time interval between beginnings of emitted pulse, and the terminal frequency (Fmin). In addition, IPI was corrected by subtracting the arrival time from bats to the central microphone.
5
4
3
2
1
0
Mea
sure
d R
ange
[m]
543210
Actual Range [m]
10
8
6
4
2
0
Error [%]
'Correct Range' 'Measured Range' Error
Fig. 3 Calibration measurement for the microphone array. The maximum deviation of the acoustically measured range was less than 3 % within target range of 5 m. The calibration was conducted at 40 kHz.
3 Results
3.1 Acoustic parameter of echolocation sounds
Figure 4 shows an example of echolocation pulse train obtained by the central microphone when P. abramus captured a prey. Each number in this figure indicates the number of pulse before capturing. In the case, the bat emitted 35 pulses for approximately only 1 s before capturing an insect. Generally, the echolocation can be described with 3 particular patterns, those indicates search, approach, and terminal phases [2]. The flying P. abramus started the approach phase from averaged 0.6 s before the capturing. In the terminal phase, the bats emit pulses with approximately 200 times per second (buzz) which started from approximately 0.15 s before capturing (shown with solid bar in Fig.4). Flight trajectory with positions of pulse emission by the bat is illustrated in three-dimensional image in Fig. 5A. Figure 5B shows that changes in IPI, pulse duration, Fmin, moving distance during an IPI (IPD; inter-pulse distance), range resolution to the point where the bat captured. Each number indicates the number of pulse before capturing, which corresponded to the numbers in Fig. 4. Figure 5C shows that acoustic waveforms, sonograms and auto-correlation functions (ACRs) of the numbered pulses in Figs. 4, 5A and 5B. Range resolution was estimated by using half width of the ACR [6]. Within the distance of 3 m from capturing point (search phase), IPI was maintained at around 80 ±20 ms. After the approach phase started, the pulse duration decreased approximately from 8 ±3 ms to 0.2 ms, and IPI was decreased up to 5 ms just before the capturing. In addition, bats are described to obtain the target information such as range or shape by using cross-correlation between emitted pulse and the echo [7]. We found that the peak of the ACRs was sharpened as the target range, suggesting that P. abramus get high resolution performance by designing such echolocation pulse. In addition, the bat upgraded the resolution estimated by ACRs to approximately less than 10 mm just before capturing. In the terminal phase (shown with solid bar in Fig. 5A and Fig. 5B), the bat emitted buzz within 1 m from capturing point, decreasing Fmin from approximately 39-42 kHz to 21-24 kHz. We found that the flying bat sometime changed their flight direction at the phase transition from search to approach, emitting a long-duration pulse (30th pulse). Figure 5C indicates that long quasi-constant frequency portions were observed at the end of pulses (30th and 35th pulses in
3035 22
0
Ampl
itude
[V]
-1.0 -0.5 0.0 0.5
Am
plitu
de [a
.u.]
1
Capture
Time [s]
Fig. 4 Sequence of echolocation pulses emitted by P. abramusduring foraging in the field. Each number indicates the number of pulse before capturing.
Acoustics 08 Paris
5937

Fig. 5C) which corresponded to the phase transition from search to approach. In the case of Fig.5, the bat turned left and simultaneously started decreasing IPI and pulse duration.
3.2 Analysis for flight path
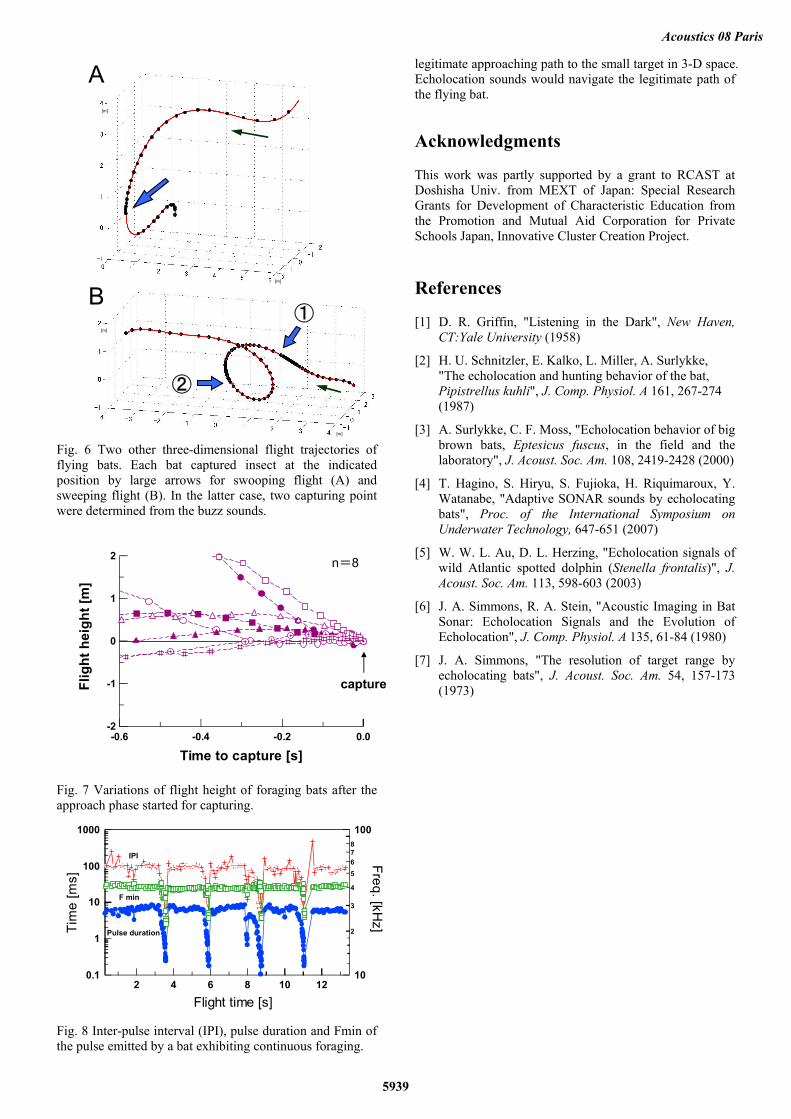
Figure 6 shows two other typical flight trajectories during foraging. Pipistrellus abramus was found to change their flight direction flexibly before capturing insect prey. One bat approached the target prey with a sudden descend (Fig. 6A) while the other was a sudden circulation (Fig. 6B). In the latter case, two capturing points were found from the buzz patterns during for only about 1 s. We examined that change in flight height of all trials before capturing insect (Fig. 7). Interestingly, we found that the bats do not ascend toward a prey from beneath, but tended to descend from above when the approach phase started.
4 Discussion
Figure 8 shows changes in IPI, pulse duration and Fmin while P. abramus was foraging in the field. The bat captures the insect prey with decreasing these parameters (see also Fig. 5B). Figure 8 also indicates that flying P. abramus is capable of capturing insects 4 times every 2-3 s. Therefore, the flight path to capture insects is supposed to be effectively designed by the flying bat for the next target. Our recording data show that P. abramus tended to select flight path to approach a target prey from above (see Fig. 6). This tendency suggests that foraging bats may utilize gravity for an easy acceleration toward the prey to concentrate on the complex echolocation for capturing moving insects. The bats may have optimized their strategy to effectively combine flight and echolocation through their evolutional history. Such field 3-D recordings of dynamic echolocation by bats will yield useful information to reveal
Capture
Flight direction
[m]
[m]30
35
26221
IPI
Pulse duration
IPD
Range resolution
3035 26 22 1140120100
80604020
0
IPI [
ms]
-5 -4 -3 -2 -1 0 1 2
Distance to capture [m]
0.6
0.4
0.2
0.0
IPD
[m]
108
642
0
Dur
atio
n [m
s]
50
40
30
20
Fmin
[kH
z]
5040
3020
100R
esol
utio
n [m
m]
Fmin
0
Am
plitu
de
-0.005 0.005
0
-0.005 0.005
0
-0.005 0.005
0
-0.005 0.005
0
Am
plitu
de
-0.005 0.005
0
-0.005 0.005
0
-0.005 0.005
0
-0.005 0.005
0
-5 5Time [ms]
0
-5 5Time [ms]
0
-5 5Time [ms]
3035 26 22
300
6090
120
Freq
. [kH
z]
0
AC
R
-5 5Time [ms]
0
AC
R
-5 5Time [ms]
AC
R
A
B
C
Fig. 5 (A) Three-dimensional flight trajectory of flying bat during foraging activity in the field. Positions of pulse emission were plotted along with the flight trajectory. (B) Changes in inter-pulse interval (IPI), pulse duration, Fmin, inter-pulse distance (IPD), range resolution during foraging behaviour from the distance of 5 m to capturing point. (C) Oscillograms, spectrograms and ACRs of the 35th, 30th, 26th and 22nd pulses in Figs. 4 and 5AB.
Acoustics 08 Paris
5938
[m]
[m]
[m]
[m]
[m]
[m]
[m]
[m]
①
②
Fig. 6 Two other three-dimensional flight trajectories of flying bats. Each bat captured insect at the indicated position by large arrows for swooping flight (A) and sweeping flight (B). In the latter case, two capturing point were determined from the buzz sounds.
-2
-1
0
1
2
Flig
ht h
eigh
t [m
]
-0.6 -0.4 -0.2 0.0
Time to capture [s]
n=8
capture
Fig. 7 Variations of flight height of foraging bats after the approach phase started for capturing.
0.1
1
10
100
1000
Tim
e [m
s]
12108642
Flight time [s]
10
2
3
4
5678
100
Freq. [kHz]
Pulse duration
IPI
F min
Fig. 8 Inter-pulse interval (IPI), pulse duration and Fmin of the pulse emitted by a bat exhibiting continuous foraging.
legitimate approaching path to the small target in 3-D space. Echolocation sounds would navigate the legitimate path of the flying bat.
Acknowledgments
This work was partly supported by a grant to RCAST at Doshisha Univ. from MEXT of Japan: Special Research Grants for Development of Characteristic Education from the Promotion and Mutual Aid Corporation for Private Schools Japan, Innovative Cluster Creation Project.
References
[1] D. R. Griffin, "Listening in the Dark", New Haven, CT:Yale University (1958)
[2] H. U. Schnitzler, E. Kalko, L. Miller, A. Surlykke, "The echolocation and hunting behavior of the bat, Pipistrellus kuhli", J. Comp. Physiol. A 161, 267-274 (1987)
[3] A. Surlykke, C. F. Moss, "Echolocation behavior of big brown bats, Eptesicus fuscus, in the field and the laboratory", J. Acoust. Soc. Am. 108, 2419-2428 (2000)
[4] T. Hagino, S. Hiryu, S. Fujioka, H. Riquimaroux, Y. Watanabe, "Adaptive SONAR sounds by echolocating bats", Proc. of the International Symposium on Underwater Technology, 647-651 (2007)
[5] W. W. L. Au, D. L. Herzing, "Echolocation signals of wild Atlantic spotted dolphin (Stenella frontalis)", J. Acoust. Soc. Am. 113, 598-603 (2003)
[6] J. A. Simmons, R. A. Stein, "Acoustic Imaging in Bat Sonar: Echolocation Signals and the Evolution of Echolocation", J. Comp. Physiol. A 135, 61-84 (1980)
[7] J. A. Simmons, "The resolution of target range by echolocating bats", J. Acoust. Soc. Am. 54, 157-173 (1973)
A
B
Acoustics 08 Paris
5939