Embed Size (px)
Citation preview
Trends in the use of echocardiography, 2007 to 2011
Echocardiography Trends Data Points #20
Heart disease is the leading cause of death for men and women in the United States.1 In 2010, heart disease caused more than one in four, or 27 percent, of deaths among individuals age 65 or older.1 Echocardiography is a noninvasive test that uses ultrasound waves to create pictures of the heart.2 An echocardiogram allows clinicians to see the structures of the heart and to see the motion of blood through the heart.3 It is often used by clinicians to assess,diagnose, and manage heart problems such as abnormal valves, atrial fibrillation, heart disease, heart murmurs, and other issues.2, 3
Use of echocardiography increased dramatically in the United States from the 1990s to early 2000s. This increase occurred at a higher rate than non-cardiac imaging services, and was greater than might be expected relative to the aging of the population.4,5
Between 2000 and 2010, the volume of imaging services increasedby 81 percent within Medicare.6 Also by 2010, echocardiography services made up 11 percent of Medicare spending on imaging services, accounting for approximately $1.2 billion in spending.6 The growth in use of echocardiography may have slowed in the late 2000s, but it remains an often used procedure.7,8
Efforts have been made to slow the increase in use of echocardiog-raphy through both payment and practice. The Deficit Reduction Act of 2005 reduced the Medicare payment for the technical com-ponent of echocardiography.9-11 In 2007, the Centers for Medicare & Medicaid Services (CMS) further reduced the amount paid for procedures beyond the index procedure on contiguous body parts during the same session.9 To address the possible overuse of echocardiography due to patterns of health care practice, a task force led by the American College of Cardiology Foundation (ACCF), American Society of Echocardiography (ASE), and specialty and subspecialty societies set out criteria for the appropriate use of echocardiography.12
Echocardiography is a widely used procedure among the Medicare-enrolled population. Each year approximately 20% of enrollees in the fee-for-service (FFS) system receive at least one cardiac echocardiogram.
The percentage of enrollees who receive echocardiography services varies widely by geography. Use of echocardiography rises with age until age 85, where it plateaus.
Allowed health care charges for echocardiog-raphy decreased from 2007 through 2011 while the number of procedures rose slightly and the average number of procedures per beneficiary per year remained stable.

Data Points • #20 • Echocardiography Trends
2
They concluded that “appropriate echo-cardiograms are those that are likely to contribute to improving patients’ clinical outcomes, and importantly, inappropriate use of echocardiography may be poten-tially harmful to patients and generate unwarranted costs to the health care system.”12 The criteria vary by previous service and clinical indication, but in gen-eral echocardiography testing is viewed as appropriate to assess conditions that have an indication of being cardiac in nature or to reassess diagnosed cardiac conditions when patients’ symptoms have changed. Retesting to monitor a condition is considered inappropriate when patients’ symptoms have not changed, there is no planned change in clinical management, and/or when fewer than one to three years have passed since the initial echocar-diogram.12 One study estimates that the Deficit Reduction Act and the implemen-tation of appropriateness criteria are two of multiple factors that have slowed the growth of echocardiography since 2005.8 However, the effect of these initiatives has not yet been quantified.
Understanding trends in the use of echo-cardiography remains complex (see Figures 1-3). It appears that the growth may be due to primary care providers who are increasingly ordering echocardiograms using equipment in their own offices rather than an increase in use by specialty providers such as cardiologists.6 The presence of testing equipment for echocardiography in primary care offices has been hypothesized to be a possible driver of this increase in use by primary care physicians. This relationship is still unclear - in the case of stress echo-cardiography, the relationship between the office location of testing material and increased cost of care after testing is modest.13 However, evidence indicates that physicians of various specialties tend to increase their use of tests when they are able to self-refer.14
Figure 1: Echocardiography services performed annually for the Medicare fee-for-service program, 2007-2011
2007 2008 2009 2010 2011
services (#) 6,816,517 6,918,949 6,951,249 7,054,577 7,077,554
6.0
6.5
7.0
7.5
8.0
Num
ber o
f ser
vices
(milli
ons)
Year
Figure 2: Eligible Medicare beneficiaries receiving one or more echocardiography services, by age, 2007-2011
0
5
10
15
20
25
30
2007 2008 2009 2010 2011
Perce
nt re
ceivi
ng ec
hoca
rdiog
raph
y ser
vices
Year
Total
65-69
70-74
75-79
80-84
85+

3
Echocardiography Trends • #20 • Data Points
Figure 3: Eligible Medicare beneficiaries receiving one or more echocardiography service, by age, 2011
13
19
2326 25
0
5
10
15
20
25
30
65-69 70-74 75-79 80-84 85+
Perce
nt
Age (years)
Table 1: Echocardiography service category codes
Service categories BETOS and HCPCS codes Code definitions
Base services BETOS code I3C Echocardiography-Heart
exclude HCPCS code 93299 Interrogation device evaluation
include HCPCS code 93350 Real-time transthoracic echocardiography with 2D image documentation
include HCPCS code 93662 Intracardiac echocardiography during therapeutic or diagnostic intervention
Add-on services
HCPCS code 92978 Intravascular ultrasound on initial vessel
HCPCS code 92979 Intravascular ultrasound on additional vessel
HCPCS code 93320 Complete Doppler echocardiography
HCPCS code 93321 Follow-up or limited Doppler echocardiography
HCPCS code 93325 Doppler echocardiography color flow velocity mapping
HCPCS code 93352 Use of echocardiographic contrast agent during stress echocardiography
HCPCS code 93571 Intravascular Doppler velocity and/or pressure derived coronary flow reserve measurement during coronary angiography on initial vessel
HCPCS code 93572 Intravascular Doppler during coronary angiography on additional vessel
Associated services*
HCPCS codes 93016-93016 Exercise portion of echocardiography stress test
HCPCS codes Q9955-Q9963 Echocardiography contrast agent
HCPCS codes 76376-76377 3D rendering of ultrasound on an independent work-station
*Associated services only included if present on the same day as their assosiated base service.
There is significant geographic variation in the use of echocardiography. Rates of echocardiography and noninvasive diagnostic imaging are lower in the Northern U.S. and higher in the South-eastern U.S.15, 16 Use of echocardiography is higher in urban areas than for patients in rural areas. This may be due to greater distance for those in rural areas to facili-ties offering echocardiography, suggesting that greater patient volume may be associ-ated with the decision to invest in echo-cardiography equipment.16-18 Variations in the prevalence of heart disease also appear to contribute to geographic variations in use of echocardiography.6 Among patients who receive echocardiography tests, most receive approximately one test a year.7, 18 Patients living in higher population areas are more likely to have a test repeated.18
This report examines trends in echocar-diography between 2007 and 2011. For these years, we describe trends in echocar-diography services (see Table 1 for service codes) by numbers of services performed, place of service, and popula-tion characteristics. We also describe geo-graphic variation in use of echocardiog-raphy. We would like to acknowledge the leadership of the DEcIDE Cardiovascular Consortium in establishing the scope and objectives of this report.
METHODSThe analysis was performed using Medi-care enrollment data and 100 percent fee-for-service (FFS) Parts A and B insti-tutional/noninstitutional claims data for years 2007 through 2011. The source of the claims and enrollment data was the CMS Chronic Conditions Warehouse (CCW).

Data Points • #20 • Echocardiography Trends
4
We identified Medicare beneficiaries age 65 or older who had Part A and Part B Medicare coverage with no Medicare Advantage (i.e., managed care enrollment) during their period of eligibility and who received echocardiography services dur-ing the reference year. Receipt of service was identified by Berenson-Eggers type of service (BETOS) code I3C, exclud-ing Health Care Common Procedure Coding System (HCPCS) code 93299, and including HCPCS codes 93350 and 93662.19 Multiple procedures for the same beneficiary in a day were coded as a single event.
We assessed trends in procedures across years and demographic factors, includ-ing age and gender (identified in the beneficiary summary file during the year the procedure took place), as well as race/ethnicity, region, and urbanicity as defined below (see Table 2).
Beneficiary demographic and geo-graphic characteristics
Race/ethnicity: Race and ethnicity were defined using the Research Triangle Insti-tute Race Code, which applies a surname algorithm to assign Hispanic ethnicity.20, 21
Age: The age categories were defined us-ing the age of the beneficiary at the end of each reference year.
Urban/Rural: We used the Core Based Statistical Area (CBSA) of the beneficiary to identify the urban region in which the beneficiary resides. Beneficiaries who do not reside in a CBSA are considered to be rural.22
Dual Status: CMS has an established algorithm for defining the annual dual eligibility status of each beneficiary using the monthly State Reported Dual Eligibil-ity Status Codes.
Table 2: Distribution of echocardiography services by population characteristics, 2011
Beneficiaries Beneficiaries Beneficiaries Total services eligible for with 1+ with 1+ performed
Variable service (#) service (#) service (%) (#)
Overall 27,573,766 5,532,382 20.1 7,077,554
Age 65-69 7,713,925 1,032,162 13.4 1,314,172
70-74 6,209,355 1,165,316 18.8 1,490,963
75-79 4,942,090 1,123,662 22.7 1,451,375
80-84 4,074,441 1,048,791 25.7 1,354,254
85+ 4,633,955 1,162,451 25.1 1,466,790
Race or ethnicity
Non-Hispanic White 22,979,360 4,589,608 20.0 5,844,857
African American 2,094,435 459,306 21.9 608,894
Hispanic 1,464,107 299,060 20.4 390,346
Asian or Pacific 652,955 122,650 18.8 154,283Islander
American Indian / 113,320 18,635 16.4 24,228Alaska Native
Other / Unknown 269,589 43,123 16.0 54,946
Gender Female 15,728,969 3,048,878 19.4 3,845,793
Male 11,844,797 2,483,504 21.0 3,231,761
Urbanicity Urban 24,794,198 5,061,675 20.4 6,469,682
Rural 2,700,357 465,500 17.2 601,408
Unknown 79,211 5,207 6.6 6,464
Medicare Full dual 3,054,680 761,650 23.9 1,018,969Status Nondual 23,146,402 4,566,276 19.7 5,771,201
Partial dual 483,067 109,052 22.6 143,341
QMB 454,752 103,624 22.8 136,002
QMB = qualified Medicare beneficiary.
The algorithm categorizes beneficiaries into four groups: Full Duals had full Medicare and Medicaid coverage (including prescription drugs) during the most recent month of dual eligibility for the reference year; QMB beneficiaries had Medicaid and participated in the Qualified Medicare Beneficiary Program during the most recent month of dual eligibility for the reference year; Other/Partial Duals had Medicaid and participated in the Specified Low-Income Medicare Beneficiary Pro-gram during the most recent month of dual eligibility for the reference year, the Qualifying Individual Program, or the Qualified Disabled and Working Individuals Program; and Nonduals had Medicare coverage only for the reference year.23

5
Echocardiography Trends • #20 • Data Points
Figure 4A: Eligible beneficiaries receiving echocardiography services, by State, 2011
Costs of echocardiography services were computed as Medicare allowed costs, which include the costs paid by Medicare and the beneficiary contribution, coinsurance, and deductible. Costs were split into several service categories defined below.
Service categories
Base, Add-on, and Associated Services: Service category codes and definitions are displayed in Table 1.
Physician Specialty: Part B institutional echocardiography services were classified Outpatient Facility specialty services.
For Part B noninstitutional echocardiography services, the specialty of the physician is identified on the service line item of the claim using HCFA specialty code. We classified the specialty as follows: Cardiol-ogy = 06; Internal Medicine = 11; General/family practice = 01 or 08; Diag-nostic Radiology = 30; Independent diagnostic testing facility = 47; and other for any other designation. Multiple physician specialties could be included for each echocardiography service.
Place of Service: The place of service is Outpatient and ER for Part B institutional echocardiography services. For Part B noninstitutional echocardiography services, the place of service is identified on the service line item of the claim using HCFA place of service code.
We classified the place of service as fol-lows: Inpatient = 21; Outpatient and ER = 22 or 23; Office and Independent Di-agnostic Testing Facility (IDTF) = 11, or if physician specialty = 47; and other for any other designation.24 Only one place of service is included per echocardiography service.
Although we examined data from 2007 to 2011, results from 2011 only are present-ed in the main body of this report. Results for earlier years appear in the Appendixes.
RESULTS
From 2007 through 2011, approximately 34 million echocardiography procedures were performed on Medicare beneficiaries. The number of beneficiaries receiving echocardiography procedures was rela-tively constant between 6.8 million in 2007 and 7 million in 2011 (Figure 1). Of all Medicare beneficiaries, about 20 percent received an echocardiography ser-vice in 2011 (Figure 2). This proportion remained fairly constant, increasing only slightly between 2007 and 2011 (from 19.7% in 2007 to 20.1% in 2011).
The proportion of beneficiaries receiving echocardiography services varied with age, increasing between ages 65 and 84 from 13.4 percent to 25.7 percent, and decreas-ing slightly at age 85 and older to 25.1 percent in 2011 (Figure 3).
In 2011, non-Hispanic White and His-panic populations both received echocar-diography services at a rate of about 20 percent (20.0% and 20.4%, respectively). Among African Americans the rate was slightly higher at about 21.9 percent, and Asians/Pacific Islander and American Indians/Alaska Natives had lower rates at 18.8 percent and 16.4 percent, respec-tively (Table 2).
Data Points • #20 • Echocardiography Trends
6
Females received echocardiography ser-vices at a lower rate than males (19.4% versus 21.0%). Full dual beneficiaries received a higher proportion of services (23.9%) than nonduals (19.7%), partial duals (22.6%), and QMBs (22.8%; Table 2).
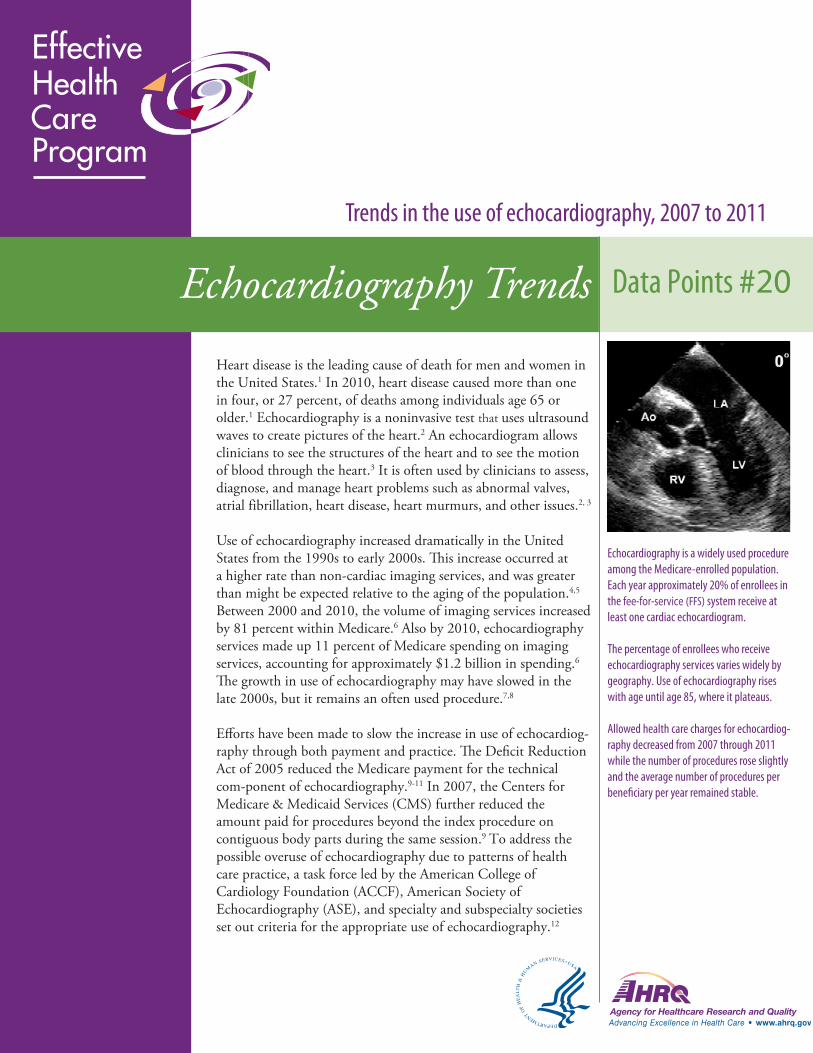
The rates of echocardiography services received vary by State. In 2011, New York and New Jersey had the highest proportion of beneficiaries receiving echocardiography at 27.3 percent and 26.5 percent, followed by Florida at 25.2 percent (Figure 4A). Idaho and Alaska had the lowest proportion at 12.7 percent and 13.1 percent. Geographic patterns are largely similar across states for urban and rural areas (Figures 4B-4C). Urban beneficiaries received echocardiography services at a higher rate (20.4%) than rural beneficiaries (17.2%, Table 2).
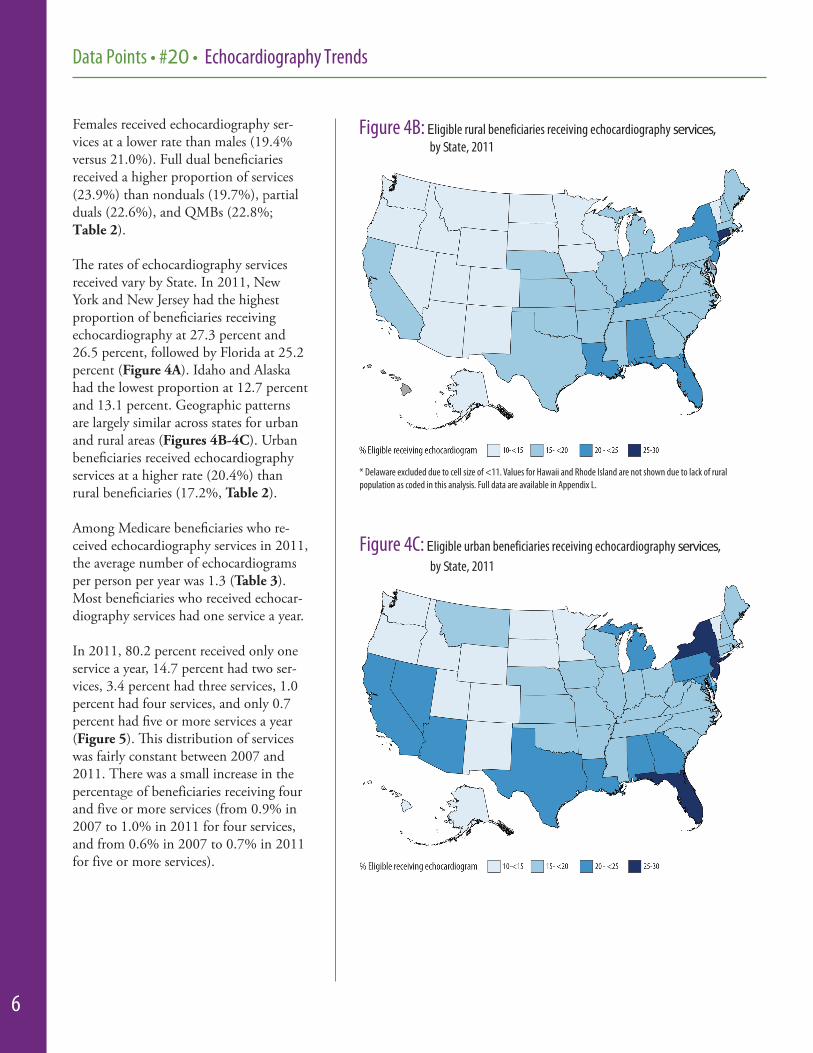
Among Medicare beneficiaries who re-ceived echocardiography services in 2011, the average number of echocardiograms per person per year was 1.3 (Table 3). Most beneficiaries who received echocar-diography services had one service a year.
In 2011, 80.2 percent received only one service a year, 14.7 percent had two ser-vices, 3.4 percent had three services, 1.0 percent had four services, and only 0.7 percent had five or more services a year (Figure 5). This distribution of services was fairly constant between 2007 and 2011. There was a small increase in the percentage of beneficiaries receiving four and five or more services (from 0.9% in 2007 to 1.0% in 2011 for four services, and from 0.6% in 2007 to 0.7% in 2011 for five or more services).
Figure 4B: Eligible rural beneficiaries receiving echocardiography services, by State, 2011
* Delaware excluded due to cell size of <11. Values for Hawaii and Rhode Island are not shown due to lack of rural population as coded in this analysis. Full data are available in Appendix L.
Figure 4C: Eligible urban beneficiaries receiving echocardiography services,by State, 2011

7
Echocardiography Trends • #20 • Data Points
Table 3: Echocardiography services among beneficiaries who received at least one echocardiography service by population characteristics, 2011
Variable
Beneficiaries with 1+ service
(#)Echo services
received (#)
Mean services received per
beneficiary (#)
Beneficiaries receiving 1 echo
# %
Beneficiaries receiving 2+ echos
# %
Overall 5,532,382 7,077,554 1.28 4,436,663 80.2 1,095,719 19.8
Age 65-69 1,032,162 1,314,172 1.27 839,076 81.3 193,086 18.7
70-74 1,165,316 1,490,963 1.28 939,231 80.6 226,085 19.4
75-79 1,123,662 1,451,375 1.29 894,790 79.6 228,872 20.4
80-84 1,048,791 1,354,254 1.29 830,629 79.2 218,162 20.8
85+ 1,162,451 1,466,790 1.26 932,937 80.3 229,514 19.7
Race or ethnicity
Non-Hispanic White
4,589,608 5,844,857 1.27 3,699,087 80.6 890,521 19.4
African Ameri-can
459,306 608,894 1.33 353,982 77.1 105,324 22.9
Hispanic 299,060 390,346 1.31 234,440 78.4 64,620 21.6
Asian or Pacific Islander
122,650 154,283 1.26 99,702 81.3 22,948 18.7
American Indian / Alaska Native
18,635 24,228 1.30 14,575 78.2 4,060 21.8
Other / Un-known
43,123 54,946 1.27 34,877 80.9 8,246 19.1
Gender Female 3,048,878 3,845,793 1.26 2,471,674 81.1 577,204 18.9
Male 2,483,504 3,231,761 1.30 1,964,989 79.1 518,515 20.9
Urbanicity Urban 5,061,675 6,469,682 1.28 4,063,875 80.3 997,800 19.7
Rural 465,500 601,408 1.29 368,486 79.2 97,014 20.8
Unknown 5,207 6,464 1.24 4,302 82.6 905 17.4
Medicare Status Full dual 760,274 1,018,261 1.34 577,732 76.0 182,542 24.0
Nondual 4,559,432 5,779,950 1.27 3,693,621 81.0 865,811 19.0
Partial dual 109,052 143,341 1.31 84,817 77.8 24,235 22.2
QMB 103,624 136,002 1.31 80,493 77.7 23,131 22.3
QMB = qualified Medicare beneficiary.
Among racial and ethnic groups, African Americans, Hispanics, and American Indians/Alaska Natives were slightly more likely to receive two or more echocardiography services a year than non-Hispanic Whites and Asians/Pacific Islanders in 2011 (Table 3).
Females were more likely to have only one echocardio-gram per year than males, with 81.1 percent of females receiving only one service while 79.1 percent of males received one service.
Full duals were more likely to have two or more echo-cardiography services than nonduals, partial duals, and QMBs (Table 3).
Across the different service settings where echocardiogra-phy was performed, the inpatient setting had the highest mean number of services (1.3 per beneficiary per year), followed by outpatient and emergency room (1.1), office and independent diagnostic testing facility (1.1), and all other settings (1.1; Appendix G).
Data Points • #20 • Echocardiography Trends
8
Figure 5: Eligible beneficiaries receiving echocardiography services, by number of services received, 2011
80
15
3 1 10
20
40
60
80
100
1 2 3 4 5+
Perce
nt re
ceivi
ng ec
hoca
rdiog
raph
y ser
vices
Number of echocardiography services
Figure 6: Total allowed charges for echocardiography by type of health care provider, 2007-2011
0
0.5
1
1.5
2
2007 2008 2009 2010 2011
$ Billi
on
Year
Total
Cardiology
Outpatientfacility
Internalmedicine
General / familypractice
IDTF
Diagnosticradiology
IDTF = Independent Diagnostic Testing Facility.
Total allowed health care charges for echo-cardiography were $1.6 billion in 2011, a de-crease from $1.85 billion in 2007 (Figure 6). Of practice specialties that performed echo-cardiography, cardiology had the highest allowed charges overall. However, the charges within cardiology decreased over time, from $1.14 billion in 2007 to $839 million in 2011 (Figure 6, Appendix H). Allowed charges in other specialties also decreased over time, with the exception of those for outpatient facilities, which increased from $404 million in 2007 to $604 million in 2011 (Figure 6, Appendix H).
DISCUSSION
Echocardiography is a widely used service within the Medicare program. Each year approximately 20 percent of beneficiaries in the fee-for-service (FFS) Medicare program received at least one procedure. Of this group, 20 to 30 percent received more than one echocardiography service.
While a variety of efforts were undertaken in an attempt to control rising costs for cardiac echocardiograms, their success was mod-est at best. Total allowed charges decreased from 2007 through 2011, while the number of procedures rose slightly and the average number of procedures per beneficiary per year remained essentially unchanged. Findings in-dicated a very small decrease in the percent-age of beneficiaries receiving echo procedures from 2009-2010 (20.4%) to 2011 (20.1%, Appendix K), but among those receiving services, the number of services received generally slightly increased. This suggests that, to date, changes in payments are not reducing use of the procedure.
This analysis identifies two dramatic trends. First, among age groups, the use of echocar-diography rose steeply until age 85, when it plateaued. This pattern suggests that use of echocardiography will continue to rise given the aging of the Medicare population.

9
Echocardiography Trends • #20 • Data Points
Second, tremendous geographic variation continues to exist in use of echocardiog-raphy. As shown in Figures 4A-4C and Appendices A-F, I, and L, State-to-State variability in echocardiography use was large, and is unlikely to be explained by differences in payment policy alone. Whe-ther measures of health care resources such as cardiologists or echocardiography facili-ties explain these patterns exceeds the scope of this report. Such questions deserve further exploration.
Further variations were evident among other characteristics, including by urban-icity, reinforcing earlier findings regarding lower rates of use among rural beneficia-ries. Variations in use within racial/ethnic groups also exist but appear to be stable over the period 2007-2011. Further work is needed to establish the degree to which these patterns represent intersections in health care access, groupwide differences in health status, or varying propensity for use or recommendation of use in these populations.
Over the study period, the Medicare pop-ulation increased more quickly in some racial/ethnic subgroups than others. Even if the percentage of Medicare beneficiaries receiving echocardiography services remains stable over time, population increases in these subgroups within Medicare may affect the total number of echocardiog-raphy services performed. This implies that efforts to decrease echocardiography use will not just need to be sensitive to overall population trends, but also take into account trends in use in racial/ethnic sub-groups within the Medicare population.
This report includes some limitations. First, we only counted one procedure per day. Thus, we may have slightly under-counted the total number of procedures if a significant number of beneficiaries had two or more procedures on the same day. However, these procedures would be captured in total allowed charges.
Second, claims data do not contain information about the indication for the procedure nor of the test result or action that may have been guided by the procedure. Thus, we cannot quantify whether the echo-cardiography use resulted in important information that was used to direct clinical care.
Third, we present unadjusted numbers only and do not conduct statistical testing of differences in proportions. Because our sample includes the entire Medicare FFS population for all study years, we are able to conduct analyses on the full population of interest rather than a sample. Statistical inference is needed only when evaluating the potential error of the sample, and thus is not necessary in this situa-tion.25 In addition, calculations of standard errors and standard statisti-cal tests commonly incorporate sample size. With the large size of the full Medicare FFS population, it is likely that even small, unimportant trends would be measured as being statistically different.26 Therefore, we chose to omit statistical testing and leave conclusions about the importance of patterns to the reader. In spite of these limitations, we believe that the results of this inquiry provide important insights about the use of echocardiography over time and across geographic and demographic groups.
CONCLUSION
Echocardiography is a widely used procedure among the Medicare-enrolled population. Each year approximately 20 percent of enrollees in the FFS system receive at least one cardiac echocardiogram. There is sizable geographic variation in use of echocardiography that deserves investigation. Recent changes in reimbursement policy appear to have reduced total allowed charges but have not led to shifts in the percent-age of enrollees receiving services nor in the average number of echocar-diography services per recipient.

Data Points • #20 • Echocardiography Trends
10
REFERENCES
1. Minino AM, Murphy SL. Death in the United States, 2010. Data Brief #99. Atlanta, GA: National Center for Health Statistics, Centers for Disease Control and Prevention; July 2012.
2. National Heart, Lung, and Blood Institute, National Institutes of Health. What is echocar-diography? 2011. Available at: http://www.nhlbi.nih.gov/health/health-topics/topics/echo/.Accessed October 25, 2012.
3. Medine Plus, National Institutes of Health. Echocardiogram. 2011. Available at: http://www.nlm.nih.gov/medlineplus/ency/article/003869.htm. Accessed October 25, 2012.
4. Pearlman AS, Ryan T, Picard M, Douglas PS. Evolving trends in the use of echocardiogra-phy: a study of Medicare beneficiaries. J Am Coll Cardiol 2007;49(23):2283-91.
5. Levin DC, Rao VM, Maitino AJ, et al. Comparative increases in utilization rates of ultra-sound examinations among radiologists, cardiologists, and other physicians from 1993 to2001. J Am Coll Radiol 2004;1(8):549-52.
6. Medicare Payment Advisory Commission. A data book: health care spending and the Medi-care program. Washington, DC: Medicare Payment Advisory Commission; 2012.
7. Okrah KM, Vaughan-Sarrazin M, Cram P. Trends in echocardiography utilization in the Veterans Administration healthcare system. Am Heart J 2010;159(3):477-83.
8. Levin DC, Rao VM, Parker L, et al. Bending the curve: the recent marked slowdown ingrowth of noninvasive diagnostic imaging. Am J Roentgenol 2011;196(1):W25-9.
9. Centers for Medicare & Medicaid Services Medicare Learning Network. Multiple procedure reduction on the technical component (TC) of certain diagnostic imaging procedures and cap on the TC of imaging procedures. MLN Matters #SE0665 Revised. Baltimore, MD: Centers for Medicare & Medicaid Services; March 11, 2011.
10. Wilson JJ. Deficit Reduction Act of 2005: summary of Medicaid/Medicare/health provisions. Washington, DC: National Conference of State Legislatures; February 3, 2006.
11. The Deficit Reduction Act of 2005. Public Law 109-171, Sec 5102. Washington, DC: 109th United States Congress; 2005.
12. American College of Cardiology Foundation Appropriate Use Criteria Task Force, et al.AACF/ASE/AHA/ASNC/HFSA/HRS/SCAI/SCCM/SCCT/SCMR 2011 appropriate usecriteria for echocardiography. J Am Coll Cardiol 2011;(24):229-67.
13. Chen J, Fazel R, Ross JS, et al. Do imaging studies performed in physician offices increasedownstream utilization?: an empiric analysis of cardiac stress testing with imaging. JACC Cardiovasc Imaging 2011;4(6):630-7.
14. Levin DC, Rao VM. The effect of self-referral on utilization of advanced diagnostic imaging.Am J Roentgenol 2011;196(4):848-52.
15. Parker L, Levin DC, Frangos A, et al. Geographic variation in the utilization of noninvasive diagnostic imaging: national Medicare data, 1998-2007. Am J Roentenol 2010;194(4):1034- 9.
16. Lucas FL, Wennberg DE, Malenka DJ. Variation in the use of echocardiography. Eff ClinPract 1999;2(2):71-5.
17. Okrah K, Vaughan-Sarrazin M, Kaboli P, et al. Echocardiogram utilization among rural and urban veterans. J Rural Health 2012;28(2):211-20.
18. Welch GH, Hayes KH, Frost C. Repeat testing among Medicare beneficiaries. Arch InternMed 2012;172(22):1745-51.
19. Centers for Medicare & Medicaid Services. Berenson-Eggers type of service (BETOS). Available at: https://www.cms.gov/Medicare/Coding/HCPCSReleaseCodeSets/BETOS.html. Accessed February 2, 2013.
20. Research Data Assistance Center. Research Triangle Institute (RTI) race code. Available at: http://www.resdac.org/cms-data/variables/Research-Triangle-Institute-RTI-Race-Code. Ac-cessed November 2, 2012.
21. Agency for Healthcare Research and Quality. Creation of new race-ethnicity codes and socio-economic status (SES) indicators for Medicare beneficiaries. Available at: http://www.ahrq.gov/qual/medicareindicators/medicareindicators2.htm. Accessed November 2, 2012.
22. United States Census Bureau. Metropolitan and micropolitan statistical areas main. Available at: http://www.census.gov/population/metro/. Accessed January 7, 2013.
23. Centers for Medicare & Medicaid Services. Medicare savings programs. Available at: http://www.medicare.gov/your-medicare-costs/help-paying-costs/medicare-savings-program/medi-care-savings-programs.html. Accessed November 2, 2012.
24. Centers for Medicare & Medicaid Services. Place of service codes for professional claims. Available at: http://www.cms.gov/Medicare/Medicare-Fee-for-Service-Payment/PhysicianFee-Sched/Downloads/Website_POS_database.pdf. Accessed November 2, 2012.
25. Feinstein AR. Clinical epidemiology: the architecture of clinical research. 1985, Philadel-phia PA:W.B. Saunders Company.
26. Snedecor GW, Cochran, WG. Statistical methods, 8th ed. Ames IA: Iowa State University Press; 1989.
AUTHORS
Beth A Virnig, PhD, MPH 1
Nathan D. Shippee, PhD 1
Brian O’Donnell, PhD 2
Jessica Zeglin, MPH 1
Shriram Parashuram, MPH 1
1 University of Minnesota School of Public Health, Division of Health Policy and Management, Min-neapolis, MN.
2 Buccaneer, A General Dynamics Information Technology Company, Des Moines, IA.
This project was funded under Contract No. HH-A29020100013I from the Agency for Healthcare Re-earch and Quality, U.S. Department of Health and uman Services as part of the Developing Evidence
o Inform Decisions about Effectiveness (DEcIDE) rogram. The authors of this report are responsible for ts content. Statements in the report should not be con-trued as endorsement by the Agency for Healthcare Re-earch and Quality or the U.S. Department of Health nd Human Services. This project has been approved y the University of Minnesota Institutional Review oard.
cknowledgments: The authors wish to thank the EcIDE Cardiovascular Consortium for their leadership
n establishing the scope and objectives of this report.
uggested Citation: Virnig BA, Shippee ND, O’Donnell , Zeglin J, Parashuram S. Trends in the Use of chocardiography, 2007 to 2011. Echocardiography rends. Data Points #20 (prepared by the University f Minnesota DEcIDE Center, under Contract No. HSA29020100013I ). Rockville, MD: Agency for ealthcare Research and Quality; May 2014. AHRQ ublication No. 14-EHC034-EF.
SsHtpissabB
ADi
SBEToHHP

11
Echocardiography Trends • #20 • Data Points
Appendix A: Echocardiography services performed, by State, 2011
Beneficiaries Beneficiaries eligible for Beneficiaries with Beneficiaries with Total services eligible for Beneficiaries with Beneficiaries with Total services
State service (#) 1+ service (#) 1+ service (%) performed (#) State service (#) 1+ service (#) 1+ service (%) performed (#)
AK 52,454 6,871 13.1 8,810 SC 525,538 100,428 19.1 126,748
AL 505,303 102,130 20.2 130,153 SD 104,675 14,612 14.0 18,314
AR 348,532 65,101 18.7 82,614 TN 614,245 110,196 17.9 139,972
AZ 485,314 100,220 20.7 128,095 TX 1,891,046 401,334 21.2 522,605
CA 2,230,097 472,433 21.2 615,128 UT 144,512 20,959 14.5 28,152
CO 328,316 46,929 14.3 59,061 VA 795,195 136,780 17.2 172,387
CT 363,565 71,440 19.7 89,631 VI 13,789 1,444 10.5 1,772
DC 46,497 10,620 22.8 14,241 VT 85,025 11,612 13.7 14,483
DE 120,051 23,398 19.5 29,053 WA 575,926 83,638 14.5 103,196
FL 1,934,926 487,053 25.2 608,466 WI 513,443 79,873 15.6 104,937
GA 744,747 148,972 20.0 189,598 WV 214,570 39,960 18.6 52,285
HI 89,059 12,630 14.2 15,420 WY 65,318 8,747 13.4 11,338
75,623
21,248
341,103
150,990
74,431
118,472
109,073
149,745
151,812
36,634
299,772
61,980
145,413
83,065
22,760
219,443
14,542
49,292
36,768
309,890
32,352
55,913
535,682
228,927
93,632
48,112
291,808
15,767
19,889
IA 382,744 60,107 15.7
ID 134,040 17,070 12.7
IL 1,361,154 261,929 19.2
IN 673,268 120,072 17.8
KS 318,583 56,628 17.8
KY 464,237 92,108 19.8
LA 388,219 86,344 22.2
MA 649,394 117,882 18.2
MD 579,806 117,269 20.2
ME 173,816 28,390 16.3
MI 986,346 230,663 23.4
MN 317,409 45,822 14.4
MO 602,310 113,844 18.9
MS 337,491 64,554 19.1
MT 122,098 18,314 15.0
NC 953,706 173,071 18.2
ND 82,523 11,952 14.5
NE 209,370 38,441 18.4
NH 167,368 28,402 17.0
NJ 932,941 246,913 26.5
NM 173,533 25,782 14.8
NV 193,673 43,310 22.4
NY 1,524,357 416,217 27.3
OH 956,047 178,781 18.7
OK 408,979 74,979 18.3
OR 288,370 37,910 13.2
PA 1,085,910 227,141 20.9
PR 70,153 13,539 19.3
RI 79,821 15,701 19.7

Data Points • # • Echocardiography Trends
12
Appendix B: Echocardiography services performed, by population characteristics, 2010
Beneficiaries Beneficiaries Beneficiaries Total services Beneficiaries Beneficiaries Beneficiaries Total services eligible for with 1+ with 1+ performed eligible for with 1+ with 1+ performed
Variable service (#) service (#) service (%) (#) Variable service (#) service (#) service (%) (#)
Overall 27,073,765 5,529,233 20.4 7,054,577 State MD 564,176 113,376 20.1 145,459(cont’d)Age 65-69 7,333,868 1,021,115 13.9 1,296,139 ME 171,849 28,236 16.4 36,594
70-74 6,079,102 1,158,197 19.1 1,478,879 MI 1,088,269 256,270 23.6 329,698
75-79 4,943,934 1,131,466 22.9 1,458,545 MN 330,835 48,512 14.7 64,722
80-84 4,136,721 1,070,602 25.9 1,378,020 MO 610,732 111,949 18.3 143,687
85+ 4,580,140 1,147,853 25.1 1,442,994 MS 329,496 63,834 19.4 81,669
Race or Non-Hispanic 22,651,929 4,600,895 20.3 5,840,744 MT 113,638 17,799 15.7 22,154ethnicity White NC 953,706 173,071 18.2 219,443
African American 2,042,391 452,770 22.2 600,533 ND 83,978 11,627 13.9 14,970Hispanic 1,419,366 298,691 21.0 389,721 NE 204,135 38,506 18.9 49,758Asian or Pacific 626,647 119,950 19.1 150,601 NH 159,323 27,617 17.3 35,907Islander
NJ 918,591 250,064 27.2 313,124American Indian / 109,991 18,217 16.6 23,607Alaska Native NM 170,756 25,702 15.1 32,116
Other / Unknown 223,441 38,710 17.3 49,371 NV 185,633 43,399 23.4 55,570
Gender Female 15,522,435 3,054,957 19.7 3,844,645 NY 1,514,814 419,247 27.7 538,582
Male 11,551,330 2,474,276 21.4 3,209,932 OH 946,802 180,518 19.1 230,363
Urbanicity Urban 24,320,726 5,059,361 20.8 6,448,865 OK 399,603 73,823 18.5 91,659
Rural 2,672,089 464,365 17.4 598,944 OR 270,336 35,861 13.3 45,532
Unknown 80,950 5,507 6.8 6,768 PA 1,063,986 226,764 21.3 290,473
Medicare Full dual 3,054,680 761,650 24.9 1,018,969 PR 76,515 14,602 19.1 16,924Status Nondual 23,146,402 4,566,276 19.7 5,771,201 RI 78,199 15,534 19.9 19,757
Partial dual 452,620 103,827 22.9 136,079 SC 505,238 99,133 19.6 124,629
QMB 420,063 97,480 23.2 128,328 SD 105,701 15,118 14.3 19,070
State AK 49,853 6,526 13.1 8,399 TN 599,359 108,749 18.1 136,683
AL 487,888 99,518 20.4 126,719 TX 1,891,046 401,334 21.2 522,605
AR 342,630 63,837 18.6 80,522 UT 140,795 20,930 14.9 27,688
AZ 464,529 97,653 21.0 125,374 VA 764,850 130,056 17.0 162,886
CA 2,167,494 466,229 21.5 606,022 VI 13,107 1,345 10.3 1,654
CO 312,252 46,931 15.0 59,313 VT 83,611 11,928 14.3 14,879
CT 363,144 73,098 20.1 91,811 WA 557,857 83,184 14.9 102,833
DC 45,700 10,397 22.7 13,883 WI 508,020 80,287 15.8 105,292
DE 116,646 22,295 19.1 27,502 WV 209,864 38,982 18.6 50,830
FL 1,919,716 497,403 25.9 619,044 WY 62,865 8,289 13.2 10,664
GA 723,319 146,756 20.3 186,326
HI 87,956 13,369 15.2 16,524
IA 375,488 59,928 16.0 74,734
ID 127,868 16,857 13.2 21,024
IL 1,323,692 258,756 19.6 336,407
IN 667,356 122,082 18.3 153,574
KS 314,554 57,432 18.3 75,568
KY 455,976 90,770 19.9 116,332
LA 378,972 85,536 22.6 108,069
MA 618,380 113,683 18.4 144,628

13
Echocardiography Trends • #20 • Data Points
Appendix C: Echocardiography services performed, by population characteristics, 2009
Beneficiaries Beneficiaries Beneficiaries Total services Beneficiaries Beneficiaries Beneficiaries Total services eligible for with 1+ with 1+ performed eligible for with 1+ with 1+ performed
Variable service (#) service (#) service (%) (#) Variable service (#) service (#) service (%) (#)
Overall 26,828,437 5,471,903 20.4 6,951,249 State MD 555,026 111,715 20.1 143,422(cont’d)Age 65-69 7,178,201 1,004,211 14.0 1,268,115 ME 173,394 28,530 16.4 36,755
70-74 6,024,406 1,143,243 19.0 1,449,991 MI 926,814 222,191 24.0 282,908
75-79 4,981,063 1,137,092 22.8 1,462,245 MN 360,443 51,786 14.4 68,992
80-84 4,157,162 1,068,915 25.7 1,370,300 MO 602,844 114,274 19.0 146,049
85+ 4,487,605 1,118,442 24.9 1,400,598 MS 323,191 62,547 19.4 79,906
Race or Non-Hispanic 22,550,084 4,571,325 20.3 5,777,095 MT 112,337 17,302 15.4 21,423ethnicity White NC 928,373 167,157 18.0 211,344
African American 1,992,097 440,190 22.1 582,155 ND 84,070 11,408 13.6 14,065Hispanic 1,378,603 291,778 21.2 379,053 NE 202,579 37,447 18.5 48,421Asian or Pacific 600,124 115,323 19.2 144,563 NH 157,327 27,540 17.5 35,707Islander
NJ 907,255 251,077 27.7 313,261American Indian / 106,644 17,448 16.4 22,710Alaska Native NM 167,207 24,539 14.7 31,645
Other / Unknown 200,885 35,839 17.8 45,673 NV 178,341 41,680 23.4 53,422
Gender Female 15,443,039 3,042,810 19.7 3,814,599 NY 1,526,148 419,633 27.5 537,745
Male 11,385,398 2,429,093 21.3 3,136,650 OH 1,059,145 202,468 19.1 255,598
Urbanicity Urban 24,088,521 5,007,741 20.8 6,357,597 OK 396,686 74,219 18.7 92,568
Rural 2,662,179 458,741 17.2 586,857 OR 262,711 34,289 13.1 42,391
Unknown 77,737 5,421 4.0 6,795 PA 1,051,567 225,492 21.4 287,256
Medicare Full dual 3,033,006 755,642 24.9 1,009,576 PR 82,469 16,042 19.5 18,737Status Nondual 22,977,963 4,526,258 19.7 5,693,447 RI 75,830 15,369 20.3 19,286
Partial dual 430,729 99,546 23.1 129,829 SC 494,877 97,182 19.6 122,101
QMB 386,739 90,457 23.4 118,397 SD 105,714 15,614 14.8 19,613
State AK 47,552 5,989 12.6 7,622 TN 596,261 108,376 18.2 135,515
AL 471,448 95,519 20.3 120,332 TX 1,863,060 394,553 21.2 507,485
AR 340,434 62,951 18.5 79,515 UT 141,487 20,638 14.6 27,152
AZ 443,653 93,684 21.1 119,838 VA 751,258 125,864 16.8 156,617
CA 2,134,931 457,158 21.4 592,631 VI 12,403 1,289 10.4 1,601
CO 302,594 45,268 15.0 57,254 VT 81,818 11,807 14.4 14,712
CT 365,058 74,103 20.3 92,838 WA 548,882 81,978 14.9 101,157
DC 44,777 9,996 22.3 13,260 WI 516,329 81,376 15.8 106,196
DE 111,970 21,031 18.8 25,781 WV 205,998 38,045 18.5 49,222
FL 1,913,328 497,380 26.0 616,112 WY 62,263 7,952 12.8 10,068
GA 768,685 152,335 19.8 192,294
HI 87,646 13,544 15.5 16,499
IA 374,055 59,389 15.9 73,808
ID 126,279 16,472 13.0 20,487
IL 1,302,362 252,199 19.4 327,114
IN 666,520 123,904 18.6 155,653
KS 312,165 56,409 18.1 73,900
KY 454,463 91,892 20.2 117,802
LA 378,742 85,411 22.6 107,937
MA 609,893 113,376 18.6 145,118

Data Points • #20 • Echocardiography Trends
14
Appendix D: Echocardiography services performed, by population characteristics, 2008
Beneficiaries Beneficiaries Beneficiaries Total services Beneficiaries Beneficiaries Beneficiaries Total services eligible for with 1+ with 1+ performed eligible for with 1+ with 1+ performed
Variable service (#) service (#) service (%) (#) Variable service (#) service (#) service (%) (#)
Overall 27,017,354 5,455,367 20.2 6,918,949 State MD 549,284 111,085 20.2 141,767(cont’d)Age 65-69 7,113,764 981,425 13.8 1,234,117 ME 182,982 29,710 16.2 38,288
70-74 6,078,691 1,134,214 18.7 1,436,822 MI 965,151 229,794 23.8 290,999
75-79 5,104,045 1,152,390 22.6 1,478,246 MN 376,639 53,591 14.2 71,817
80-84 4,274,722 1,085,782 25.4 1,390,695 MO 609,693 114,341 18.8 147,171
85+ 4,446,132 1,101,556 24.8 1,379,069 MS 321,976 59,808 18.6 75,990
Race or Non-Hispanic 22,819,154 4,586,260 20.1 5,791,497 MT 114,065 17,911 15.7 22,181ethnicity White NC 917,829 161,933 17.6 204,706
African American 1,969,333 425,943 21.6 560,100 ND 84,334 11,424 13.5 13,998Hispanic 1,355,144 282,400 20.8 364,907 NE 203,102 37,688 18.6 49,094Asian or Pacific 580,375 111,003 19.1 138,727 NH 157,744 27,340 17.3 35,410Islander
NJ 920,205 254,410 27.6 318,980American Indian / 104,707 16,461 15.7 21,384Alaska Native NM 167,367 24,185 14.5 31,009
Other / Unknown 188,641 33,300 17.7 42,334 NV 174,039 40,677 23.4 52,043
Gender Female 15,594,544 3,042,059 19.5 3,807,416 NY 1,549,308 420,843 27.2 536,338
Male 11,422,810 2,413,308 21.1 3,111,533 OH 1,075,199 206,469 19.2 260,930
Urbanicity Urban 24,255,594 4,994,523 20.6 6,329,588 OK 397,580 71,975 18.1 89,790
Rural 2,685,046 455,466 17.0 582,748 OR 263,907 34,006 12.9 41,875
Unknown 76,714 5,378 7.0 6,613 PA 1,086,940 231,482 21.3 295,185
Medicare Full dual 3,017,506 739,728 24.5 982,558 PR 96,604 18,052 18.7 20,573Status Nondual 23,210,226 4,535,201 19.5 5,701,268 RI 75,603 15,341 20.3 19,393
Partial dual 407,076 93,060 22.9 121,320 SC 488,180 95,185 19.5 119,083
QMB 382,546 87,378 22.8 113,803 SD 101,800 13,915 13.7 17,435
State AK 45,813 5,689 12.4 7,341 TN 602,933 107,016 17.7 134,563
AL 484,321 97,370 20.1 122,041 TX 1,850,884 384,808 20.8 493,541
AR 340,500 61,444 18.0 78,125 UT 147,612 20,970 14.2 27,453
AZ 435,937 91,502 21.0 117,436 VA 749,788 125,046 16.7 155,351
CA 2,109,297 446,097 21.1 573,609 VI 11,741 1,086 9.2 1,325
CO 299,036 44,354 14.8 55,985 VT 81,002 11,814 14.6 15,042
CT 374,748 75,052 20.0 94,401 WA 549,712 79,570 14.5 97,462
DC 44,509 9,881 22.2 13,139 WI 532,790 83,238 15.6 108,674
DE 110,317 21,456 19.4 26,935 WV 208,564 38,377 18.4 49,539
FL 1,929,741 495,383 25.7 612,071 WY 61,361 7,854 12.8 9,992
GA 764,735 148,681 19.4 188,274
HI 90,376 13,795 15.3 16,856
IA 377,774 60,487 16.0 75,412
ID 129,393 16,363 12.6 20,181
IL 1,300,249 249,542 19.2 322,490
IN 679,191 126,307 18.6 159,333
KS 316,121 57,208 18.1 74,676
KY 456,858 92,183 20.2 118,092
LA 384,869 85,360 22.2 107,033
MA 610,815 113,752 18.6 145,461

15
Echocardiography Trends • # 20 • Data Points
Appendix E: Echocardiography services performed, by population characteristics, 2007
Beneficiaries Beneficiaries Beneficiaries Total services Beneficiaries Beneficiaries Beneficiaries Total services eligible for with 1+ with 1+ performed eligible for with 1+ with 1+ performed
Variable service (#) service (#) service (%) (#) Variable service (#) service (#) service (%) (#)
Overall 27,461,960 5,400,626 19.7 6,816,517 State MD 546,051 106,285 19.5 135,753(cont’d)Age 65-69 7,129,449 961,295 13.5 1,202,741 ME 186,590 29,678 15.9 38,089
70-74 6,120,033 1,114,190 18.2 1,405,319 MI 1,043,116 244,036 23.4 307,874
75-79 5,358,238 1,179,322 22.0 1,505,529 MN 397,599 54,975 13.8 72,393
80-84 4,409,005 1,085,147 24.6 1,382,968 MO 616,147 112,555 18.3 143,971
85+ 4,445,235 1,060,672 23.9 1,319,960 MS 319,540 58,257 18.2 73,375
Race or Non-Hispanic 23,256,128 4,547,054 19.6 5,714,224 MT 115,605 17,825 15.4 22,019ethnicity White NC 916,899 160,195 17.5 202,280
African American 2,016,748 424,370 21.0 554,397 ND 84,489 11,318 13.4 14,028Hispanic 1,347,634 278,017 20.6 358,498 NE 205,534 36,575 17.8 47,522Asian or Pacific 558,620 104,375 18.7 129,831 NH 157,630 27,099 17.2 34,815Islander
NJ 924,872 248,979 26.9 312,005American Indian / 103,254 15,788 15.3 20,484Alaska Native NM 166,549 23,382 14.0 29,096
Other / Unknown 179,576 31,022 17.3 39,083 NV 169,724 38,607 22.7 48,613
Gender Female 15,910,097 3,025,762 19.0 3,770,207 NY 1,600,289 419,566 26.2 530,439
Male 11,551,863 2,374,864 20.6 3,046,310 OH 1,196,953 227,793 19.0 287,927
Urbanicity Urban 24,659,627 4,944,213 20.0 6,234,124 OK 399,320 70,688 17.7 87,985
Rural 2,726,689 451,234 16.5 575,969 OR 262,400 33,195 12.7 40,480
Unknown 75,644 5,179 6.8 6,424 PA 1,167,641 242,553 20.8 307,327
Medicare Full dual 3,081,855 736,700 23.9 973,092 PR 103,088 19,044 18.5 21,539Status Nondual 23,584,588 4,486,961 19.0 5,613,769 RI 76,392 15,148 19.8 19,085
Partial dual 418,234 92,812 22.2 120,180 SC 483,288 90,381 18.7 111,647
QMB 377,283 84,153 22.3 109,476 SD 103,487 13,922 13.5 17,425
State AK 43,802 5,448 12.4 6,966 TN 609,791 104,834 17.2 131,601
AL 503,406 97,105 19.3 120,956 TX 1,845,286 369,484 20.0 472,776
AR 339,253 58,811 17.3 74,488 UT 155,923 22,049 14.1 28,565
AZ 430,828 86,214 20.0 111,063 VA 752,968 121,855 16.2 150,892
CA 2,081,916 427,703 20.5 543,307 VI 11,094 1,027 9.3 1,220
CO 295,162 42,825 14.5 54,231 VT 80,686 11,260 14.0 14,242
CT 389,222 76,187 19.6 95,476 WA 550,387 78,285 14.2 95,114
DC 45,797 9,836 21.5 12,894 WI 559,100 85,440 15.3 110,939
DE 109,108 21,090 19.3 26,090 WV 213,386 38,248 17.9 48,735
FL 1,948,673 490,391 25.2 604,845 WY 60,624 7,545 12.4 9,539
GA 755,356 141,412 18.7 179,090
HI 90,643 13,087 14.4 15,792
IA 376,500 58,177 15.5 72,568
ID 132,521 16,121 12.2 19,568
IL 1,297,879 242,404 18.7 311,207
IN 691,325 124,940 18.1 156,000
KS 319,567 56,256 17.6 73,617
KY 461,926 90,246 19.5 115,599
LA 395,708 85,569 21.6 107,415
MA 614,508 112,194 18.3 142,916

Data Points • #20 • Echocardiography Trends
16
Appendix F. Number of annual echocardiography services among beneficiaries with at least one echocardiography service, by State, 2011
Mean Mean Beneficiaries Beneficiaries Beneficiaries Beneficiaries Echo services Echo services
receiving 1 receiving 2+ receiving 1 receiving 2+ services received per services received per echo echos echo echosBeneficiaries received beneficiary Beneficiaries received beneficiary
State (#) (#) (#) (#) (%) (#) (%) State (#) (#) (#) (#) (%) (#) (%)AK 6,871 8,810 1.28 5,558 80.9 1,313 19.1 RI 15,701 19,889 1.27 12,638 80.5 3,063 19.5
AL 102,130 130,153 1.27 81,515 79.8 20,615 20.2 SC 100,428 126,748 1.26 81,155 80.8 19,273 19.2
AR 65,101 82,614 1.27 52,187 80.2 12,914 19.8 SD 14,612 18,314 1.25 12,030 82.3 2,582 17.7
AZ 100,220 128,095 1.28 80,635 80.5 19,585 19.5 TN 110,196 139,972 1.27 88,483 80.3 21,713 19.7
CA 472,433 615,128 1.30 372,321 78.8 100,112 21.2 TX 408,363 532,606 1.30 320,581 78.5 87,782 21.5
CO 46,929 59,061 1.26 38,218 81.4 8,711 18.6 UT 20,959 28,152 1.34 16,375 78.1 4,584 21.9
CT 71,440 89,631 1.25 58,570 82.0 12,870 18.0 VA 136,780 172,387 1.26 111,470 81.5 25,310 18.5
DC 10,620 14,241 1.34 8,081 76.1 2,539 23.9 VI 1,444 1,772 1.23 1,201 83.2 243 16.8
DE 23,398 29,053 1.24 19,342 82.7 4,056 17.3 VT 11,612 14,483 1.25 9,551 82.3 2,061 17.8
FL 487,053 608,466 1.25 398,576 81.8 88,477 18.2 WA 83,638 103,196 1.23 69,520 83.1 14,118 16.9
GA 148,972 189,598 1.27 119,862 80.5 29,110 19.5 WI 79,873 104,937 1.31 62,306 78.0 17,567 22.0
HI 12,630 15,420 1.22 10,522 83.3 2,108 16.7 WV 39,960 52,285 1.31 31,289 78.3 8,671 21.7
IA 60,107 75,623 1.26 49,149 81.8 10,958 18.2 WY 8,747 11,338 1.30 6,940 79.3 1,807 20.7
ID 17,070 21,248 1.24 14,129 82.8 2,941 17.2
IL 261,929 341,103 1.30 206,820 79.0 55,109 21.0
IN 120,072 150,990 1.26 97,688 81.4 22,384 18.6
KS 56,628 74,431 1.31 43,698 77.2 12,930 22.8
KY 92,108 118,472 1.29 73,179 79.4 18,929 20.6
LA 86,344 109,073 1.26 70,108 81.2 16,236 18.8
MA 117,882 149,745 1.27 95,743 81.2 22,139 18.8
MD 117,269 151,812 1.29 93,635 79.8 23,634 20.2
ME 28,390 36,634 1.29 22,780 80.2 5,610 19.8
MI 230,663 299,772 1.30 181,246 78.6 49,417 21.4
MN 45,822 61,980 1.35 35,094 76.6 10,728 23.4
MO 111,949 143,687 1.28 89,286 79.8 22,663 20.2
MS 64,554 83,065 1.29 51,041 79.1 13,513 20.9
MT 18,314 22,760 1.24 15,167 82.8 3,147 17.2
NC 177,345 225,084 1.27 143,150 80.7 34,195 19.3
ND 11,952 14,542 1.22 10,086 84.4 1,866 15.6
NE 38,441 49,292 1.28 30,877 80.3 7,564 19.7
NH 28,402 36,768 1.29 22,732 80.0 5,670 20.0
NJ 246,913 309,890 1.26 202,576 82.0 44,337 18.0
NM 25,782 32,352 1.25 21,050 81.6 4,732 18.4
NV 43,310 55,913 1.29 34,725 80.2 8,585 19.8
NY 416,217 535,682 1.29 332,898 80.0 83,319 20.0
OH 178,781 228,927 1.28 143,000 80.0 35,781 20.0
OK 74,979 93,632 1.25 61,298 81.8 13,681 18.2
OR 37,910 48,112 1.27 30,694 81.0 7,216 19.0
PA 227,141 291,808 1.28 182,041 80.1 45,100 19.9
PR 13,539 15,767 1.16 11,806 87.2 1,733 12.8

17
Echocardiography Trends • #20 • Data Points
Appendix G. Echocardiography services performed, by site and type of service, 2007-2011
All Echocardiography Services Base Services Add-on Services Associated ServicesMean Mean Mean Mean
services services services services Ben- received Ben- received Ben- received Ben- received
Services eficiaries per Services eficiaries per Services eficiaries per Services eficiaries per
Variablereceived with 1+ beneficiary
(#) services (#) (#)received
(#)with 1+
services (#)beneficiary
(#)received with 1+ beneficiary
(#) services (#) (#)received with 1+ beneficiary
(#) services (#) (#)
Total 2011 7,077,554 5,532,382 1.28 7,019,351 5,514,853 1.27 516,041 462,081 1.12 198,967 192,669 1.03
2010 7,054,577 5,529,233 1.28 6,997,267 5,511,090 1.27 523,349 471,284 1.11 190,377 184,290 1.03
2009 6,951,249 5,471,903 1.27 6,898,789 5,455,124 1.26 593,684 539,884 1.10 179,913 174,510 1.03
2008 6,918,949 5,455,367 1.27 6,862,597 5,436,820 1.26 6,599,687 5,297,553 1.25 169,065 164,178 1.03
2007 6,816,517 5,400,626 1.26 6,762,239 5,381,879 1.26 6,483,873 5,230,268 1.24 176,065 171,260 1.03
Total 34,818,846 27,389,511 1.27 34,540,243 27,299,766 1.27 14,716,634 12,001,070 1.23 914,387 886,907 1.03
Inpatient 2011 2,444,146 1,936,816 1.26 2,417,293 1,923,691 1.26 188,118 167,544 1.12 25,075 24,678 1.02
2010 2,442,218 1,937,771 1.26 2,414,389 1,923,328 1.26 188,443 168,832 1.12 27,589 27,234 1.01
2009 2,428,626 1,926,228 1.26 2,400,794 1,911,314 1.26 196,717 177,241 1.11 28,568 28,187 1.01
2008 2,494,105 1,975,441 1.26 2,462,507 1,958,705 1.26 2,382,184 1,924,379 1.24 31,186 30,749 1.01
2007 2,473,342 1,964,976 1.26 2,441,742 1,947,717 1.25 2,357,959 1,910,967 1.23 34,249 33,871 1.01
Total 12,282,437 9,741,232 1.26 12,136,725 9,664,755 1.26 5,313,421 4,348,963 1.22 146,667 144,719 1.01
Outpa- 2011 1,513,258 1,329,610 1.14 1,482,362 1,305,942 1.14 182,347 170,954 1.07 132,614 129,385 1.02tient and
ER2010 1,278,120 1,130,033 1.13 1,249,504 1,107,313 1.13 171,064 161,097 1.06 119,257 116,535 1.02
2009 1,128,888 1,007,489 1.12 1,105,360 988,373 1.12 221,024 210,944 1.05 105,914 103,774 1.02
2008 1,070,251 957,812 1.12 1,050,684 942,214 1.12 989,914 894,376 1.11 103,898 101,748 1.02
2007 1,065,625 956,215 1.11 1,049,649 943,834 1.11 980,927 888,446 1.10 108,842 106,522 1.02
Total 6,056,142 5,381,159 1.13 5,937,559 5,287,676 1.12 2,545,276 2,325,817 1.09 570,525 557,964 1.02
Office and 2011 3,101,120 2,838,309 1.09 3,100,680 2,838,001 1.09 145,457 141,124 1.03 41,243 39,565 1.04IDTF 2010 3,317,268 3,032,933 1.09 3,316,437 3,032,398 1.09 163,521 158,347 1.03 43,484 41,460 1.05
2009 3,373,363 3,087,072 1.09 3,372,290 3,086,517 1.09 175,529 169,671 1.03 45,392 43,334 1.05
2008 3,331,861 3,055,641 1.09 3,326,741 3,053,055 1.09 3,205,296 2,968,430 1.08 33,939 32,415 1.05
2007 3,252,664 2,990,042 1.09 3,246,015 2,986,118 1.09 3,120,621 2,896,904 1.08 32,928 31,595 1.04
Total 16,376,276 15,003,997 1.09 16,362,163 14,996,089 1.09 6,810,424 6,334,476 1.08 196,986 188,369 1.05
Other 2011 19,030 17,960 1.06 19,016 17,946 1.06 119 119 1.00 35 35 1.00
2010 16,971 15,952 1.06 16,937 15,918 1.06 321 298 1.08 47 47 1.00
2009 20,372 19,260 1.06 20,345 19,234 1.06 414 395 1.05 39 39 1.00
2008 22,732 21,369 1.06 22,665 21,314 1.06 22,293 20,994 1.06 42 42 1.00
2007 24,886 23,314 1.07 24,833 23,267 1.07 24,366 22,842 1.07 46 46 1.00
Total 103,991 97,855 1.06 103,796 97,679 1.06 47,513 44,648 1.06 209 209 1.00

Data Points • #20 • Echocardiography Trends
18
Appendix H. Total allowed charges for echocardiography services, by specialty, 2007-2011
Percent of total Percent of total 5-year allowed 5-year allowed
Allowed charges charges per year Allowed charges charges per yearTotal 2011 $1,619,452,595 18.9 Diagnostic 2011 $7,410,844 18.5
Cardiology
Outpatient
2010
2009
2008
2007
Total
2011
2010
2009
2008
2007
Total
2011
$1,637,364,534
$1,613,483,353
$1,823,075,944
$1,858,228,298
$ 8,551,604,723
$839,052,343
$892,044,980
$942,660,093
$1,115,013,889
$1,142,265,893
$ 4,931,037,197
$604,043,330
19.2
18.9
21.3
21.7
100.0
17.0
18.1
19.1
22.6
23.2
100.0
24.9
radiology
Other
2010
2009
2008
2007
Total
2011
2010
2009
2008
2007
Total
$7,654,619
$7,391,033
$8,473,957
$9,143,776
$40,074,229
$25,678,307
$24,086,459
$27,467,684
$38,965,962
$33,573,958
$149,772,370
19.1
18.4
21.2
22.8
100.0
17.1
16.1
18.3
26.0
22.4
100.0
facility
Internal
2010
2009
2008
2007
Total
2011
$552,145,129
$451,741,464
$414,239,541
$404,925,688
$ 2,427,095,151
$104,992,715
22.8
18.6
17.1
16.7
100.0
14.4medicine
General / fam-
2010
2009
2008
2007
Total
2011
$118,209,255
$134,980,887
$178,172,312
$193,742,365
730,097,534
$21,163,269
16.2
18.5
24.4
26.5
100.0
13.3ily practice
Independent
2010
2009
2008
2007
Total
2011
$23,999,651
$28,553,150
$40,540,819
$44,500,641
158,757,530
$17,111,788
15.1
18.0
25.5
28.0
100.0
14.9Diagnostic Testing Facility (IDTF)
2010
2009
2008
2007
Total
$19,224,441
$20,689,041
$27,669,465
$30,075,977
114,770,712
16.8
18.0
24.1
26.2
100.0

19
Echocardiography Trends • #20 • Data Points
Appendix I. Eligible beneficiaries receiving one or more echocardiography services, by State, 2007-2010
Map I1. Eligible beneficiaries receiving one or more echocardiography services, by State, 2010
Map I2. Eligible beneficiaries receiving one or more echocardiography services, by State, 2009
Map I3. Eligible beneficiaries receiving one or more echocardiography services, by State, 2008
Map I4. Eligible beneficiaries receiving one or more echocardiography services, by State, 2007

Data Points • #20 • Echocardiography Trends
20
Appendix J. Number of all eligible Medicare beneficiaries with one or more echocardiography services, by age and total, 2007-2011
2007 2008 2009 2010 2011
Total 27,461,960 27,017,354 26,828,437 27,073,765 27,573,766
65-69 7,129,449 7,113,764 7,178,201 7,333,868 7,713,925
70-74 6,120,033 6,078,691 6,024,406 6,079,102 6,209,355
75-79 5,358,238 5,104,045 4,981,063 4,943,934 4,942,090
80-84 4,409,005 4,274,722 4,157,162 4,136,721 4,074,441
85+ 4,445,235 4,446,132 4,487,605 4,580,140 4,633,955
Appendix K. Percent of all eligible Medicare beneficiaries with one or more echocardiography service by age and total, 2007-2011
2007 2008 2009 2010 2011
Total 19.7 20.2 20.4 20.4 20.1
65-69 13.5 13.8 14.0 13.9 13.4
70-74 18.2 18.7 19.0 19.1 18.8
75-79 22.1 22.6 22.8 22.9 22.7
80-84 24.6 25.4 25.7 25.9 25.7
85+ 23.9 24.8 24.9 25.1 25.1

21
Echocardiography Trends • #20 • Data Points
Appendix L. Eligible urban and rural beneficiaries receiving one or more echocardiography services, by State, 2011
% of eligible Urban beneficiaries % of eligible Rural beneficiaries % of eligible Urban beneficiaries % of eligible Rural beneficiaries State with 1+ echo service with 1+ echo service State with 1+ echo service with 1+ echo serviceAK 13.6 11.9 RI 19.7 n/a
AL 20.2 20.3 SC 19.1 19.1
AR 18.7 18.5 SD 14.5 12.9
AZ 20.8 14.0 TN 17.7 19.6
CA 21.3 16.2 TX 21.1 19.2
CO 14.6 12.8 UT 14.9 11.0
CT 19.7 25.0 VA 17.2 17.0
DC 22.9 n/a VT 14.0 12.7
DE 19.5 50.0 WA 14.6 14.1
FL 25.3 20.5 WI 16.0 13.7
GA 20.1 19.1 WV 18.3 19.5
HI 14.2 n/a WY 13.8 12.7
14.8
12.4
16.9
16.6
16.7
20.4
20.3
15.6
16.0
15.8
19.2
13.5
17.7
17.7
14.1
16.4
14.3
17.4
16.3
23.1
13.6
14.3
20.5
18.1
18.6
12.2
19.7
14.1
IA 16.2
ID 12.8
IL 19.4
IN 17.9
KS 18.1
KY 19.6
LA 22.5
MA 18.2
MD 20.3
ME 16.6
MI 24.0
MN 14.7
MO 18.5
MS 19.6
MT 15.6
NC 18.1
ND 14.6
NE 18.8
NH 16.9
NJ 26.5
NM 15.0
NV 22.6
NY 27.5
OH 18.7
OK 18.3
OR 13.2
PA 21.0
PR 19.3