Embed Size (px)
Citation preview
ECHOCARDIOGRAPHIC EVALUATION OF CARDIAC FUNCTION IN
PATIENTS WITH NEWLY DETECTED TYPE 2 DIABETESMELLITUS
Dissertation Submitted to
THE TAMILNADU DR. M.G.R. MEDICAL UNIVERSITY
In partial fulfillment of the regulations
for the award of the degree of M.D. (GENERAL MEDICINE) BRANCH – I
GOVT. STANLEY MEDICAL COLLEGE & HOSPITAL
CHENNAI-1
THE TAMILNADU DR. M.G.R. MEDICAL UNIVERSITY
CHENNAI
APRIL 2011

CERTIFICATE
This is to certify that this dissertation entitled ―ECHOCARDIOGRAPHIC EVALUATION OF
CARDIAC FUNCTION IN PATIENTS WITH NEWLY DETECTED TYPE 2 DIABETES
MELLITUS ‖ submitted by Dr. S. SAMUTHIRAVEL, to the Tamil Nadu Dr. M.G.R. Medical
University Chennai is in partial fulfillment of the requirement for the award of M.D. DEGREE
BRANCH –I (General Medicine) and is a bonafide research work carried out by him under direct
supervision and guidance.
Prof. Dr. MAGESH KUMAR, M.D., Professor and Head, Dept. of Medicine,
Govt. Stanley Medical College and Hospital
Chennai-600001.
Prof. Dr. A GOWRISHANKAR M D.,
Chief UNIT III& Guide, Dept. of Medicine
Govt. Stanley Medical College and Hospital
Chennai-600001.
Prof. Dr. C.VAMSADHARA, M.D., Ph.D
The Dean Govt. Stanley Medical College & Hospital, Chennai – 600 001

DECLARATION
I solemnly declare that the dissertation entitled ―ECHOCARDIOGRAPHIC EVALUATION OF
CARDIAC FUNCTION IN PATIENTS WITH NEWLY DETECTED TYPE 2 DIABETES
MELLITUS ‖ was done by me at Stanley Medical College and Hospital during 2009-2010 under
the guidance and supervision of Prof. Dr. A. GOWRISHANKAR, M.D.
The dissertation is submitted to the Tamil Nadu Dr. M.G.R. Medical University towards the
partial fulfillment of requirement for the award of M.D.DEGREE (BRANCH-I) in General
Medicine.
Place : Chennai
Date : Dr. S. SAMUTHIRAVEL

ACKNOWLEDGEMENT
I owe my thanks to the Dean, Stanley Medical College and Hospital
Prof. Dr. C.VAMSADHARA, M.D., Ph.D., for allowing me to avail the facilities needed for
my dissertation work.
I am grateful to Prof. Dr. S. MAGESH KUMAR, M.D., professor and Head of the Department
of Medicine, Stanley Medical College for permitting me to do the Study and for his
encouragement.
I have great pleasure in expressing my deep sense of gratitude and respect for
Prof. Dr. A. GOWRISHANKAR. M D, Professor, Department of Medicine and Chief of
Medical Unit III for approving this study and giving suggestions and guidance in preparing this
dissertation.
I am extremely thankful to our unit assistant professors Dr. NALINI KUMARAVELU,M.D.,
Dr. S.CHANDRASEKAR, MD., and Dr. G.VASUMATHI, M.D., Registrar Department of
Medicine for their valuable guidance and constant encouragement.
I sincerely thank Prof. Dr. G. KARTHIKEYAN, D.M., Professor and Head of the Department
of Cardiology, Prof. Dr. D. MUTHUKUMAR, D M, Unit II Chief and other faculties of Dept.
of cardiology, Stanley Medical College and Hospital for their guidance.

I am thankful to Prof. R. MADHAVAN, M.D., Professor of Diabetology, and
Dr. C. HARIHARAN, M.D., Assistant Professor, Department of Diabetology, Govt. Stanley
Medical College & Hospital for their permission and support in doing this study.
Last but not least, I sincerely thank all my colleagues who shared their knowledge and helped me
and to the patients who co-operated in this study.

CONTENTS
S.NO TITLE PAGE NO.
1. INTRODUCTION 1
2. AIM OF STUDY 3
3. REVIEW OF LITERATURE 4
4. MATERIALS AND METHODS 32
5. OBSERVATION & RESULTS 37
6. DISCUSSION 51
7. CONCLUSIONS 57
ANNEXURE
I BIBLIOGRAPHY
II PROFORMA
III MASTER CHART
IV ABBREVIATIONS

INTRODUCTION
Diabetes mellitus which is now being termed as an epidemic is spiraling upwards at an alarming
rate, raising worldwide concern about its devastating effects on health and healthcare systems. It
is estimated that presently there are 200 million diabetics and it is expected to reach 360 million
by 2030 as per World Health Organization projections, with the largest number of cases going to
be seen in China, India and USA. More than 90% of these are likely to be type 2 diabetes (DM)
individuals.
In recent years with the explosion of knowledge and the sound pathophysiological basis, the
distinction between the type2 diabetes and the cardiovascular disease has been blurred, and the
central importance of Cardio Vascular Disease (CVD) prevention is becoming an integral part of
DM management.
T2DM carries an equivalent cardio vascular risk to that of non diabetic individual who already
experienced a coronary event (1)
. DECODE study (2)
has shown that even before diabetes is
detected, the person may be predisposed to CVD and these prediabetic levels of blood sugar
predict mortality.
A substantial body of evidence supports the concept that the increase risk of morbidity and
mortality due to CVD is associated with abnormalities in glucose metabolism across the entire
continuum of glucose tolerance ranging from normal to clinical diabetes (1,3)
Compared with
patients without diabetes, patients with DM have a 2-4 fold greater risk of death from MI or
stroke(3)
.

Diabetes mellitus is an established risk factor for congestive heart failure, but the knowledge of
the pathophysiology and treatment is limited. The Framingham Heart study has shown that the
incidence of congestive cardiac failure in diabetic patients occurs irrespective of coronary artery
disease or hypertension (3)
.
In overt heart failure, diastolic dysfunction often co-exists with systolic dysfunction as a
consequence of ischemic heart disease, but diastolic dysfunction is a frequent finding in type 2
diabetes mellitus without signs and symptoms of heart disease and is presumably due to diabetic
cardiomyopathy. Left ventricular diastolic function (LVDF) is affected earlier than systolic
function in the development of congestive cardiac failure (4)
.
Therefore left ventricular diastolic dysfunction may represent the first stage of diabetic
cardiomyopathy, thus an early examination of left ventricular diastolic function may help to
detect this condition in patients with diabetes, thereby allowing early intervention for a more
favorable outcome(5)
.
This study was done to understand the burden of left ventricular diastolic dysfunction (LVDD) in
patients with newly diagnosed type 2 diabetes and to assess the risk factors for the development
of diastolic dysfunction in such patients.

AIM OF THE STUDY
To assess the effect of isolated type 2 diabetes on left ventricular systolic and diastolic
functional reserve.
To assess the risk factor associated with heart failure in diabetic patients.
To compare this prevalence to that of age and sex matched asymptomatic control
population.

REVIEW OF LITERATURE
Diabetes Mellitus refers to a group of common metabolic disorders that share the phenotype of
hyperglycemia. Several distinct types of DM exist and are caused by a complex interaction of
genetics and environmental factors.
HISTORY
The first documented evidence of diabetes mellitus was reported in Egyptian papyrus, as a
polyuric state. In 1776 Mathew Dobson established the presence of sugar in blood and urine of
diabetic patients. Type 2 diabetes is the commonest form of diabetes in any country.
EPIDEMIOLOGY
The global evidence of diabetes is estimated to increase from 4% in 1995 to 5.4% by the year
2025. Considerable geographic variation is seen, with most of the cases from India, USA, and
Europe. India has the dubious distinction of having the highest number of diabetes in the
world.The prevalence in India varies from 1.7 to 9.6% in various studies. A multicenter study
done by India Council of Medical Research showed a prevalence rate of 1.73 percent in Indians
above 15 yrs of age. According to Prevalence Of Diabetes in India Study(PODIs) the prevalence
of type 2 diabetes in India is urban-9.6% rural-4.2% .

AETIOLOGY OF DIABETES MELLITUS
Type I diabetes mellitus
1. Genetics:
Genetic predisposition is possible permissive and not casual. Risk of diabetes is up to 5 times
higher when the father is diabetic rather than mother. This risk is limited to father carrying an
HLA DR4 susceptibility gene.
Risks for identical twin is 33%. Genetic loci - Chromosome 6
2. Viruses
20% of persons with congenital rubella develop IDDM. Cytomegalovirus is present in
genome of 20% patients. Others implicated are Coxsackie, Mumps and hepatitis.
3. Diet
Introduction of cow’s milk before the age of 2 – 3 months is associated with an increased
risk.
4. Pancreatic pathology
Insulitis
TYPE II DIABETES MELLITUS
Genetics :
Probably polygenic
The role of genetic factors in the etiology of type 2 DM has been appreciated ever since the
recognition of the disease. There is almost 100% concordance in monozygotic twins. Maturity
onset diabetes may be associated with a mutation of glucokinase gene.

Life style
Over eating; especially combined with obesity and under activity, leads to diabetes
mellitus.
Age
It is principally a disease of middle aged and elderly
Pregnancy
80% of women with gestational diabetes develop permanent diabetes requiring treatment
later in life.
Insulin resistance
There is increased hepatic glucose production and resistance to the action of insulin in
muscle.
ETIOLOGIC CLASSIFICATION OF DIABETES MELLITUS
1. Type 1 diabetes (β-cell destruction, usually leading to absolute insulin deficiency)
A. Immune – mediated
B. Idiopathic
2. Type 2 diabetes (may range from predominantly insulin resistance with relative insulin
deficiency to a predominantly insulin secretory defect with insulin resistance)
3. Other specific types of diabetes
A. Genetic defects of β-cell function characterized by mutations in:
a. Hepatocyte nuclear transcription factor (HNF) 4 α (MODY 1)
b. Glucokinase (MODY 2)
c. HNF – 1 α (MODY 3)

d. Insulin promoter factor (IPF) 1 (MODY 4)
e. HNF – 1 β (MODY 5)
f. Mitochondrial DNA
g. Proinsulin or insulin conversion
B. Genetic defects in insulin action
a. Type A insulin resistance
b. Leprechaunism
c. Rabson – Mendenhall syndrome
d. Lipoartrophic diabetes
C. Disease of the exocrine pancreas – pancreatitis, pancreatectomy, neoplasia,
cystic fibrosis, hemochromatosis, fibrocalculous pancreatopathy.
D. Endocrinopathies – acromegaly, Cushing’s syndrome, glucagonoma,
pheochromocytoma, hyperthyroidism, somatostatinoma, aldosteronoma.
E. Drug or chemical induced – Vacor, pentamidine,
nicotinic acid,glucocorticoids, thyroid hormone, diazoxide,
β-adrenergic agonists, thiazides,phenytoin, α- interferon,
protease inhibitors, clozapine, and beta-blockers.

F. Infections – congenital rubella, cytomegalovirus, Coxsackie
G. Uncommon forms of immune mediated diabetes –
―stiff-man‖ syndrome, antiinsulin receptor antibodies.
H. Other genetic syndromes sometimes associated with diabetes – Down’s
syndrome, Klinefelter’s syndrome, Turner’s syndrome, Wolfram’s syndrome,
Friedreich’s ataxia, Huntington chorea, Laurence – Moon –Biedl syndrome,
myotonic dystrophy, porphyria, Prader-Willi syndrome.
4. Gestational diabetes mellitus (GDM).
RISK FACTORS FOR TYPE 2 DIABETES MELLITUS
a. Family history of diabetes (i.e. parent or sibling with type 2 diabetes)
b. Obesity (i.e. > 20% desired body weight or BMI > 25 kg/m2)
c. Age > 45 years
d. Race/ethnicity (e.g. African, American, Hispanic American, Native American, Asian
American, Pacific Islander)
e. Previously identified IFG or IGT
f. History of GDM or delivery of baby over 9 pounds.
g. Hypertension (blood pressure > 140/90 mm Hg)
h. HDL cholesterol level < 0.90 mmol/L (35 mg/dL) and / or a triglyceride level 2.82
mmol/L (250 mg/dL)
i. Polycystic ovary syndrome

STAGES OF DIABETES
Stages of diabetes range from normal glucose tolerance, through IGT and IFG (impaired fasting
glucose), into frank diabetes mellitus, which may be non-insulin requiring, insulin requiring for
control and insulin requiring for survival.
Type 1 DM can be found across the whole spectrum. In the early stages of treatment there can be
a period of non-insulin requirement, but later followed by insulin requirement for survival. In
type 2 DM, insulin may be required during a period of ketoacidosis precipitated by severe stress
or infection.
Diabetes and heart
Patients with diabetes mellitus are at increased risk for cardiovascular diseases. Thus,
cardiovascular complications are the leading cause of diabetes-related morbidity and mortality(2)
.
The American Heart Association recently designed DM as a major risk factor for cardiovascular
disease (same category as smoking hypertension and hyperlipidaemia). Type 2 diabetic patient
without a prior M1 have a similar risk for coronary artery related events as non-diabetic
individuals who have had a prior myocardial infarction(3)
.
The main factor that contribute to the increased incidence of cardiovascular disease in diabetic
patients are
1. The acceleration of atherosclerotic process leading to macrovascular disease.
2. Development of specific cardiomyopathy.
3. Progressive microvascular disease.
4. Development of autonomic neuropathy.

Heart failure
Heart failure is a complex clinical syndrome manifesting as the inability of the heart to fill with
or eject blood due to any structural or functional cardiac conditions. Heart failure can be broadly
classified into Systolic Heart Failure or Heart Failure With Reduced Ejection Fraction (HFREF)
and Heart Failure with Normal Ejection Fraction (HFNEF) also earlier known as Diastolic Heart
Failure. There can also be a combination of both.
Systolic heart failure
Heart failure caused by systolic dysfunction is more readily recognized. It can be described as
impaired contractile or pump function of the heart. It is characterized by a decreased ejection
fraction (less than 45%). The strength of ventricular contraction is attenuated and inadequate for
creating an adequate stroke volume, resulting in inadequate cardiac output. In general, this is
caused by dysfunction or destruction of cardiac myocytes or their molecular components.
Diastolic heart failure
Diastolic heart failure, is defined as symptoms of heart failure in a patient with preserved left
ventricular function. It is characterized by a stiff left ventricle with decreased compliance and
impaired relaxation, which leads to increased end diastolic pressure. Signs and symptoms are
similar to those of heart failure with systolic dysfunction.
Pathophysiology of diastolic heart failure (7)
Diastole is the process by which the heart returns to its relaxed state; it is also the time for
cardiac perfusion. During diastole, drastic changes in cardiac pressure-volume relationships
occur. The relaxation process has four identifiable phases: isovolumetric relaxation from the time
of aortic valve closure to mitral valve opening; early rapid filling after mitral valve opening;

diastasis, a period of low flow during mid-diastole; and late filling of the ventricles from atrial
contraction ( Figure 1).
Figure 1.Cardiac cycle, showing changes in left atrial pressure, left ventricular pressure, aortic
pressure, and ventricular volume; the electrocardiogram (ECG); and the phonocardiogram.
In patients with isolated diastolic heart failure, the heart often is able to meet the body's
metabolic needs, but at higher diastolic pressures. The left ventricle is stiff, with decreased
compliance and impaired relaxation. Transmission of the higher end-diastolic left ventricular
pressure to the pulmonary circulation may lead to pulmonary congestion, dyspnea, and other
symptoms of heart failure.

Diastole is a complex process that is affected by a number of factors, including ischemia, heart
rate, velocity of relaxation, cardiac compliance (i.e., elastic recoil and stiffness), hypertrophy,
and segmental wall coordination of the heart muscle
Heart failure in diabetes
Diabetes accounted for a significant percentage of patients with a diagnosis of heart failure in
numerous epidemiologic studies. The Framingham Study,3 United Kingdom Prospective
Diabetes Study,8
Cardiovascular Health Study, and Euro Heart Failure Surveys all suggested that
the presence of diabetes may independently increase the risk of developing incident heart failure.
The etiology of this abnormality is probably multi factorial and includes factors such as
myocardial ischaemia from atherosclerosis, hypertension and myocardial dysfunction secondary
to chronic hyperglycemia.
The mechanisms of HF in diabetic patients
Figure 3 illustrates the varies mechanism of heart failure in diabetes mellitus. DM may be
causally related to HF development by at least 3 mechanisms:
1. Due to associated comorbidities,
2. By favoring the development of coronary atherosclerosis,
3. Through a specific diabetic cardiomyopathy.

Figure. 2 Potential mechanisms linking diabetes mellitus to heart failure.
Potential mechanisms linking diabetes mellitus to heart failure: Diabetes mellitus is associated with multiple
physiopathological changes in the cardiovascular system. Among these, endothelial dysfunction and hemostatic
disorders may at least in part account for the higher risk of coronary artery disease (CAD) while microangiopathy,
myocardial fibrosis, and abnormal myocardial metabolism have been implicated in the pathogenesis of a specific
diabetic cardiomyopathy.
When it occurs in diabetic patients, heart failure (HF) is, in most cases, a consequence of CAD; other possible
causes include the comorbidities frequently encountered in diabetic patients such as hypertension, or other causes of
nonischemic cardiomyopathy. The existence of a diabetic cardiomyopathy may increase the risk of HF in response
to these insults; however, whether diabetic cardiomyopathy alone may be responsible for HF remains unknown.

Diabetic cardiomyopathy
Diabetic cardiomyopathy has been defined as the presence of myocardial abnormalities in the
absence of coronary artery disease, hypertension or other significant etiology(3)
. Hyperglycemia
seems to be central to the pathogenesis of diabetic cardiomyopathy and to trigger a series of
maladaptive stimuli that result in myocardial fibrosis and collagen deposition. These processes
are thought to be responsible for altered myocardial relaxation characteristics and manifest as
diastolic dysfunction on imaging (9)
.
Pathogenesis of Diabetic Cardiomyopathy:
Mechanisms(10)
The pathogenesis of diabetic cardiomyopathy is multifactorial. Several hypotheses have been
proposed, including autonomic dysfunction, metabolic derangements, abnormalities in ion
homeostasis, alteration in structural proteins, and interstitial fibrosis(11,12)
Sustained
hyperglycemia also may increase glycation of interstitial proteins such as collagen, Interstitial
accumulation of advanced-glycated end products (AGEs), which results in myocardial stiffness
and impaired contractility(13–15)
Several mechanisms that are involved in decreasing myocardial contractility in diabetes
mellitus. These are
(1) Impaired calcium homeostasis,
(2) Upregulation of the renin-angiotensin system,
(3) Increased oxidative stress,
(4) Altered substrate metabolism, and
(5) Mitochondrial dysfunction.

Impaired calcium homeostasis
The mechanisms by which disturbed calcium homeostasis alters cardiac function in diabetes
include reduced activity of ATPases,(16)
decreased ability of the SR to take up calcium, and
reduced activities of other exchangers such as Na+-Ca
2+ and the sarcolemmal Ca
2+ATPase.
(17,18).
Furthermore, decreased cardiac expression of SERCA2a or the Na+Ca
2+ - exchanger has been
observed in type 1(10)
and type 2 diabetes.(20).
Trost et al( 21)
observed that transgenic mice
overexpressing SERCA2a were protected from streptozotocin-induced cardiac dysfunction,
suggesting that altered calcium handling contributes to impaired cardiac function in diabetes
mellitus.
Activation of the Renin-Angiotensin System
The role of activation of the renin-angiotensin system in the development of diabetic
cardiomyopathy is well recognized.(22)
Angiotensin II receptor density and mRNA expression are
elevated in the diabetic heart.(23–25)
Activation of the renin-angiotensin system during diabetes
mellitus has been shown to be associated with increased oxidative damage and cardiomyocyte
and endothelial cell apoptosis and necrosis in diabetic hearts, (26)
which contributes to the
increased interstitial fibrosis.
Increased Oxidative Stress
Increased reactive oxygen species (ROS) production in the diabetic heart is a contributing factor
in the development and the progression of diabetic cardiomyopathy(27,28)
Several groups have
shown that ROS is overproduced in both type 1 and type 2 diabetes.29,30
Increased ROS
generation may activate maladaptive signaling pathways, which may lead to cell death, which
could contribute to the pathogenesis of diabetic cardiomyopathy.31
Thus, increased ROS-

mediated cell death could promote abnormal cardiac remodeling, which ultimately may
contribute to the characteristic morphological and functional abnormalities that are associated
with diabetic cardiomyopathy.
In addition to causing cellular injury, increased ROS production might lead to cardiac
dysfunction via other mechanisms. For example, increased ROS has been proposed to amplify
hyperglycemia-induced activation of protein kinase C isoforms, increased formation of glucose-
derived advanced glycation end products, and increased glucose flux through the aldose
reductase pathways,32,33
which may all contribute in various ways to the development of cardiac
complications in diabetes mellitus. Thus, strategies that either reduce ROS or augment
myocardial antioxidant defense mechanisms might have therapeutic efficacy in improving
myocardial function in diabetes mellitus.
Altered Substrate Metabolism
Altered myocardial substrate and energy metabolism has emerged as an important contributor to
the development of diabetic cardiomyopathy.34,35
. Diabetes mellitus is characterized by reduced
glucose and lactate metabolism and enhanced fatty acid (FA) metabolism.36,37
Despite an
increase in FA use in diabetic hearts, it is likely that FA uptake exceeds oxidation rates in the
heart, thereby resulting in lipid accumulation in the myocardium that may promote
lipotoxicity(38-40)
. Lipid intermediates such as ceramide might promote apoptosis of
cardiomyocytes, thus representing another mechanism that might lead to cardiac dysfunction.41
Free Fatty Acid Metabolism Disturbances
Figure 3 summarizes the role of altered free fatty acid metabolism and its contribution to the
development of diabetic cardiomyopathy. Figure 4 illustrates the role of hyperglycemia in

inducing the ultimate downstream effects. In the absence of diabetes, approximately equivalent
proportions of energy required for cardiac contractility come from glucose metabolism and free
fatty acids; whereas in diabetes, myocardial glucose use is significantly reduced, with a shift in
energy production from beta-oxidation of free fatty acids.42
This reduction in glucose use in the
diabetic myocardium results from depleted glucose transporter proteins, glucose transporter-1
and 4. In addition, free fatty acids inhibit pyruvate dehydrogenase, which impairs myocardial
energyproduction and leads to the accumulation of glycolytic intermediates and ceramide,
enhancing apoptosis.43,44
In addition to the effects of free fatty acids on glucose metabolism
and oxidative phosphorylation, free fatty acid metabolism for adenosine triphosphate production
requires large amounts of oxygen. The toxic intermediates resulting from free fatty acid
metabolism(42,45)
(so-called lipotoxicity) can impair myocyte calcium handling, worsening
myocardial mechanics.46-48
Figure 3 Overall schema for the pathogenesis of diabetic cardiomyopathy.
FFA-free fatty acid; CPC-cardiac progenitor cells; RAAS-renin-angiotensin-aldosterone system

Figure 4 Effects of hyperglycemia on the diabetic myocardium.
Mitochondrial Dysfunction
Recent studies of mitochondria have reignited interest in a role for mitochondrial dysfunction in
the pathogenesis of diabetic cardiomyopathy.49-51
Diabetes mellitus causes functional and
structural alterations in mitochondria.
Impaired mitochondrial function was initially reported almost 25 years ago when Kuo et al
showed depressed state 3 respiration in db/db heart mitochondria. This study was followed by
others showing reduced mitochondrial oxidative capacity in type 1 diabetes.52–55
Boudina et al demonstrated decreased mitochondrial respiration and reduced protein expression
of the oxidative phosphorylation components in obese type 2 diabetic mice.49
These alterations
contribute to cardiac dysfunction because they reduce ATP production, which we speculate will
diminish myocardial high-energy phosphate reserves, thereby contributing to impaired
myocardial contractility.
Autonomic Neuropathy
Diabetic autonomic neuropathy can lead to changes in sympathetic innervations and subsequent
disordered adrenergic receptor expression and altered catecholamine levels in the myocardium.
An increased expression of theβ1-receptor results in enhanced apoptosis, fibrosis, hypertrophy,
and impaired myocardial function.56
DIAGNOSING DIABETIC CARDIOMYOPATHY
There are 2 important components in the clinical diagnosis of diabetic cardiomyopathy: the
detection of myocardial abnormalities and the exclusion of other contributory causes of
cardiomyopathy.
An important challenge in the clinical diagnosis of diabetic cardiomyopathy has been the lack of
any pathognomonic histologic changes or imaging characteristics associated with the diagnosis.
Endomyocardial biopsies are not indicated because of their invasiveness, unless circumstances
to suspect other causes of cardiomyopathy in the differential diagnosis exist (eg, hypertrophic
cardiomyopathy and infiltrative heart diseases).Nevertheless, the presence of myocardial fibrosis
or collagen deposition can be fairly characteristic of diabetic cardiomyopathy. Electron

microscopic features, including mitochondrial abnormalities, fatty acid deposits, or even
myocyte hypertrophy, can be evident.
The diagnosis of diabetic cardiomyopathy currently rests on noninvasive imaging techniques that
can demonstrate myocardial dysfunction across the spectra of clinical presentation. There is still
no consensus in the precise imaging definition of diabetic cardiomyopathy, but evidence of
hypertrophy or diastolic dysfunction is likely crucial to support a diagnosis of diabetic
cardiomyopathy, but is not specific to it.
On the basis of the review of the literature, the imaging definition of diabetic cardiomyopathy
that includes either or both features listed as follows:
● Evidence of cardiac hypertrophy determined by conventional echocardiography or cardiac
magnetic resonance imaging;
● Evidence of LV diastolic dysfunction (with or without LV systolic dysfunction), either
clinically by transmitral Doppler or tissue Doppler imaging (TDI), or evidence of left atrial
enlargement; or subclinically by novel imaging techniques or provocative testing (eg, strain rate
imaging or stress imaging).

Methods of diagnosing diastolic dysfunction
Cardiac catheterisation with simultaneous pressure and volume measurements is the ―gold
standard‖ for assessing LV diastolic function. The rate of LV relaxation, rate and timing of
diastolic filling as well as myocardial and chamber stiffness can be determined [57]
. However, this
diagnostic method is invasive and cannot be performed in all patients with suspected diastolic
dysfunction.
During the last two decades, Doppler echocardiography has emerged as an important and easy to
perform noninvasive diagnostic tool providing reliable data on diastolic performance. The trans-
mitral flow across the mitral valve demonstrates a biphasic pattern, in which an early peak flow
occurs during rapid early diastolic filling (peak E) and a late peak occurs during atrial
contraction (peak A).Based on Doppler trans mitral flow, a grading system for diastolic
dysfunction has been proposed.
Three characteristic abnormal LV diastolic filling patterns mainly based on the E/A ratio have
been proposed [58]
The first abnormal filling pattern, called ―delayed relaxation‖, results in a reversed E/A
ratio (E/A < 1) when relaxation impairs. It identifies patients with early stages of heart
disease.
The second pattern, representing abnormalities of both relaxation and compliance, has
been termed pseudo normalization, because of an apparently normal E/A ratio (E/A > 1).
This results from an increase in left atrial pressure compensating for slow relaxation.
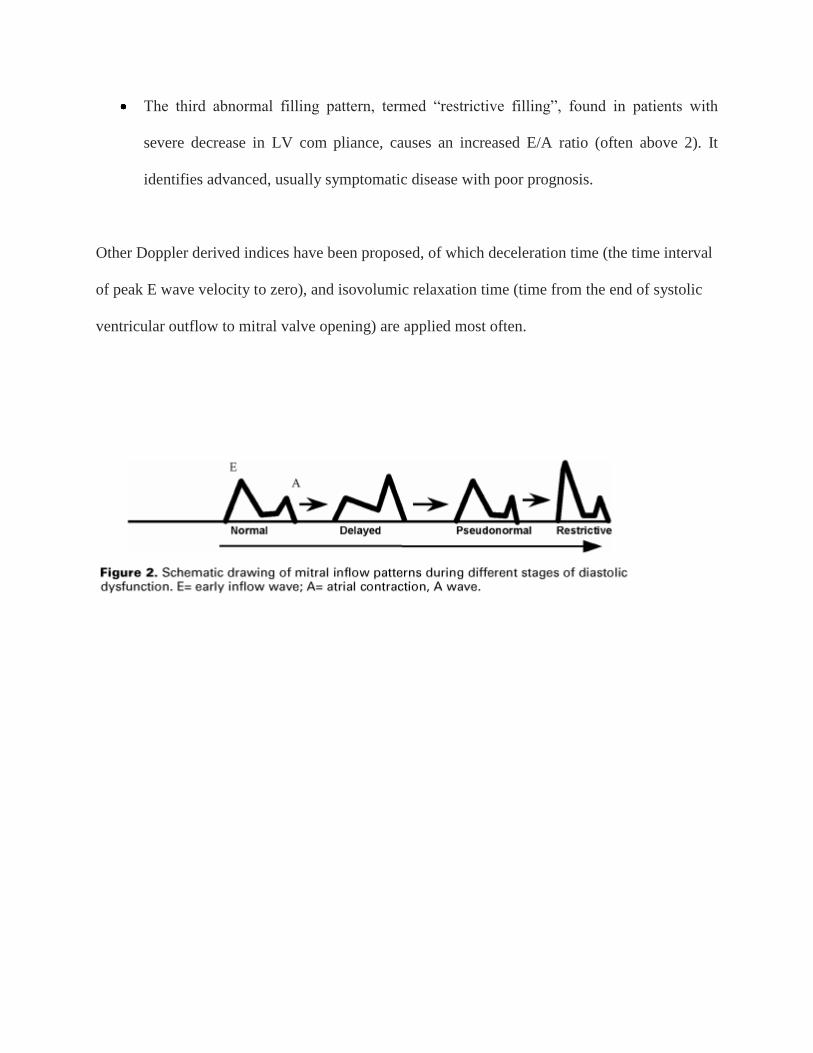
The third abnormal filling pattern, termed ―restrictive filling‖, found in patients with
severe decrease in LV com pliance, causes an increased E/A ratio (often above 2). It
identifies advanced, usually symptomatic disease with poor prognosis.
Other Doppler derived indices have been proposed, of which deceleration time (the time interval
of peak E wave velocity to zero), and isovolumic relaxation time (time from the end of systolic
ventricular outflow to mitral valve opening) are applied most often.

Normal trans–mitral-valve spectral Doppler flow pattern. The E-to-A-wave ratio is pproximately
1.4 to 1.0.
Trans–mitral-valve Doppler flow tracing in a patient with mild diastolic dysfunction (abnormal
relaxation). The E-to-A-wave ratio is less than 1.0.
Trans–mitral-valve Doppler flow pattern in a patient with severe (restrictive) diastolic
dysfunction. The E-to-A-wave ratio is abnormally high, and the A-wave velocity is extremely
low.

LEFT VENTRICULAR FUNCTION IN DIABETES MELLITUS
Numerous studies have shown that impairment of the LV diastolic function may be detected in
patients with diabetes The existence of a diabetic cardiomyopathy was first suggested by Rubler
et al (59)
in 1972 on the basis of postmortem findings in four adult diabetic subjects with non-
coronary congestive cardiac failure (CCF)
.
Subsequent observations by the Framingham workers about the most frequent occurrence of
CCF among the diabetics than could be explained by hypertension or ischemic heart disease
alone, interest was renewed in the field of cardiac involvement in long-standing diabetic patients.
Regan et al. [60]
demonstrated in normotensive, diabetic patients without coronary artery disease
and without clinical evidence of heart failure, increased left-ventricular end-diastolic pressure,a
decreased left-ventricular end-diastolic volume with a normal ejection fraction
Hamby et al (61) Impaired left ventricular (LV) function may frequently be detected in
asymptomatic diabetic subjects and is related to the extent of diabetes and evidence of micro
vascular complications. Although systolic and diastolic functions of the heart are impaired in
diabetes, many studies have shown that the LV diastolic abnormalities are most common and
may in fact precede the development, of systolic abnormality.
Thus, diastolic abnormalities present in diabetic patients without diabetic complications or
cardiovascular disease has been suggested as an earliest functional effect of a specific diabetic
cardiomyopathy [62, 63]
.
In the large majority of studies, abnormalities of LVdiastolic function have been demonstrated
in diabetic patients with intact systolic function Raev et al. [64].
It is now clear from the various studies that the primary functional abnormality in a diabetic heart
is the impairment of LV diastolic function reflecting the reduced LV filling and that even the
systolic functional alteration is the result of reduced LV filling.
EVALUATION OF LV FUNCTION IN DIABETIC SUBJECTS
There are two chief methods of evaluating the LV function
1. Utilizing the non-invasive techniques.
2. Invasive techniques
Non-invasive methods include the assessment by
a) Systolic time intervals (STI)
b) Apex cardio graphy (ACG)
c) Radio nucleotide ventriculography
d) Echocardiography and cardiac Doppler
Invasive method is by cardiac catheterization delineating the coronary artery anatomy and LV
angiography. This procedure is usually reserved for symptomatic diabetic subjects with overt or
those who manifest CCF and is unnecessary in asymptomatic although long-standing diabetics.

ECHOCARDIOGRAPHY- M-MODE AND 2-D
Aerakisnen et al(65) utilizing the digitalized M-mode technique studied 36 female IDDM
patients with a mean duration of diabetes of 10 years or more and found that the most common
abnormality (19 pts) was prolonged rapid filling period while the systolic function was normal in
all. Another study recorded simultaneous echo and phonocardiogram in142diabetics. The LV
relaxation, the rate and duration of cavity dimension increase and wall thinning were determined.
Delayed mitral valve opening (MVO) relative to minimal LV cavity dimension and aortic valve
closure (AVC) was found in all but 12 subjects, especially in those with micro vascular
complications. Prolongation of isovolumic relaxation time (IVRT) i.e. measured as period
between AVC and MVO (abnormal, if more than 110 m sec), which can be demonstrated using
dual M-mode echo preferably at 100 min/sec speed showing simultaneous aortic and mitral valve
levels, is an important diastolic abnormality, as found by Sanderson et al(66)
.
Others using quantitative cross-sectional echocardiography and stress myocardial perfusion
scintigraphy found that diabetic subjects had mildly reduced LV end diastolic volumes and
impaired diastolic filling as assessed by lower left atrial emptying index compared to controls.
The left atrial emptying index is defined on M-mode tracing of the aorta
DOPPLER TECHNIQUES
Pulsed Doppler ultrasound interrogation of mitral inflow velocities (Doppler cursor placed at the
tips of the mitral leaflets on apical 4-chamber view) gives a simple and reproducible method of
determining the LV filling that correlates well with radio nucleotide and invasive techniques.
Ventricular filling in the normal subjects is characterized by a biphasic pattern with an initial

peak velocity of rapid early ventricular filling ('E') and a relatively low peak velocity of late
inflow due to atrial contraction (A). Impaired diastolic filling of the left ventricle in both Type 1
and Type 2 asymptomatic diabetics without the evidence of cardiovascular disease and unrelated
to microangiopathic complications has been demonstrated using PW Doppler which showed
reduction in the early filling velocity (reduced 'E' peak) and compensatory increase in the late
flow (increased 'A' peak) and thus increased A/E ratio (i.e. A/E more than 1). Besides, the
deceleration of 'E' velocity is prolonged indicating a slow rapid-filling phase ('E' deceleration
more than 250 m/sec). Increased atrial contribution to LV filling can be assessed by the area
under the late diastolic filling envelope compared to the total diastolic area. Various studies have
demonstrated these above Doppler findings in young diabetic subjects without evidence of heart
failure.
A 3-year follow-up study by Charella et al of a group of asymptomatic diabetics with slow filling
and wall thinning demonstrable on echocardiography showed 31% developing heart failure and
19% that died. Measurement of LV diastolic function may therefore prove to be a useful
indicator of cardiovascular morbidity and mortality in diabetics.
Hence abnormal diastolic function suggestive of reduced LV compliance resulting in a 'Stiff'
myocardium appears to be the hall mark of the specific type of diabetic heart muscle disease.
The presence or addition of hypertension or coronary artery disease will certainly put a new
burden on the already 'non-compliant’ myocardium in long-standing diabetics with or without
micro vascular complications.

ECHO PICTURE OF M-MODE SHOWING VARIOUS LV DIMENSIONS

DOPPLER ECHO SHOWING GRADING OF DIASTOLIC DYSFUNCTION

PREVENTION AND THERAPY
Glycemic Control
The prevention and treatment of diabetic cardiomyopathy are clinically relevant because of its
role in the pathogenesis of heart failure. Although the effect of glycemic control on diabetic
cardiomyopathy has been studied in only a limited fashion, evidence suggests that good glycemic
control is beneficial, at least in the early stages of myocardial dysfunction (67-69)
. Evidence also
suggests that diabetic cardiomyopathy does not develop in patients with tightly controlled type 1
diabetes, supporting an important role for hyperglycemia in the pathogenesis of diabetic
cardiomyopathy70
. Hyperglycemia is responsible for microvascular complications in diabetes,
and because microvascular alterations are thought to contribute significantly to the pathogenesis
of diabetic cardiomyopathy, good glycemic control is perhaps the most important component in
the overall management of diabetic cardiomyopathy. Firm recommendations regarding the
choice of current glucose-lowering therapies in patients with diabetic cardiomyopathy cannot be
made because of a lack of evidence.
However, glucagon-like peptide-1 analogues have demonstrated improved hemodynamic
variables in diabetic patients without overt heart failure. Improved cardiac parameters also have
been noted with this agent class in post infarction and in populations with advanced heart
failure(71)
. On the other hand, the use of thiazolidinediones in the management of patients with
diabetic cardiomyopathy is problematic because of a propensity for fluid overload. In general,
the choice of antidiabetic therapy in diabetic cardiomyopathy should be dictated by clinical
characteristics,such as the presence or absence renal dysfunction, risk of hypoglycemia, age,
volume status, and concomitant drug therapy.

Neurohormonal Antagonism
The important role of the renin-angiotensin-aldosterone system in the pathogenesis of
complications in diabetic patients is well described. Evidence supports the use of Angiotensin-
Converting Enzyme Inhibitors in preventing myocardial fibrosis, cardiac hypertrophy, and
myocardial mechanical dysfunction associated with diabetic cardiomyopathy.72-74
Angiotensin-
converting enzyme inhibition and angiotensin-1 receptor blockade also have been shown to
prevent coronary perivascular fibrosis and collagen deposition.75
The Angiotensin Receptor
Blocker, candesartan, can improve echocardiographic parameters of diastolic dysfunction,
reduce collagen synthesis, and increase collagen degradation in asymptomatic diabetic subjects.76
Novel Therapies Targeting Diabetic Cardiomyopathy
Therapies directed toward the prevention and progression of diabetic cardiomyopathy are in the
early stages of clinical development and have targeted either enhanced fibrosis/collagen
deposition or alterations in cardiomyocyte metabolism.The majority of the agents listed below
are in experimental stages, and none of them have been approved for use in diabetic
cardiomyopathy. Notable among these novel agents are Advance Glycation End Product
Inhibitors (eg,aminoguanidine, alanine aminotransferase 946, and pyridoxamine);Advance
Glycation End Product Cross-Link Breakers (eg, alanine aminotransferase 711); and copper
chelation therapy (eg, trientine). Modulators of free fatty acid metabolism,such as
trimetazidine, have proven useful in the management of angina, but their efficacy on diabetic
cardiomyopathy is unknown. Exenatide (recombinant glucagon-like peptide-1, a Food and Drug
Administration-approved glucose-lowering agent) has yet to be studied specifically in patients
with diabetic cardiomyopathy patients despite promising cardiac effects with glucagon-like
peptide-1 infusion in mechanistic studies.

MATERIALS AND METHODS
The Clinical materials were newly diagnosed Type-2 Diabetes Mellitus individuals selected
from Diabetic outpatient department and the department of internal medicine in the Stanley
hospital,Chennai-1
About 77 patients were subjected to initial assessment , it included through clinical examination,
routine blood investigation consisting of biochemistry investigation, ECG, estimation of HbA1c
and echo cardiography were done from which 50 patients were included in the study and
compared with 50 healthy age and sex matched controls.
Informed consent was obtained from all the subjects and the hospital ethical board committee
ethically approved the study.
The Period of study was from march 2009 to September 2010.
STUDY DESIGN – case control study
STUDY GROUPS
Group I - 50 newly diagnosed Type II Diabetes Mellitus patients.
Group II - 50 healthy controls.
These groups were selected on the basis of inclusion and exclusion criteria.

INCLUSION CRITERIA
Newly diagnosed Type II Diabetes Mellitus
Healthy controls
EXCLUSION CRITERIA
Patients with age above 70
Systemic Hypertension.
conduction disturbance on ECG.
Documented Ischaemic heart disease
History suggestive of previous angina, congestive cardiac failure.
Documented evidence of other cardiac disease like cardiomyopathy
Valvular heart disease
Congenital Heart Disease
primary myocardial diseases,
pericardial diseases,
Chronic obstructive pulmonary disease
sustained arrhythmias
CKD
liver diseases
thyroid diseases
pregnancy and seriously ill patients
New cases were diagnosed by the revised criteria for diagnosis of diabetes mellitus.

CRITERIA FOR DIAGNOSIS
Revised criteria for diagnosing diabetes mellitus has been issued and taken from
American Diabetes Association and the World Health Organization.
The criteria is based on the premises that
1. The spectrum of fasting plasma glucose (FPG) and the response to an oral glucose load
varies in normal individuals.
2. Diabetes Mellitus defined as the level of glycemia at which diabetic specific
complications are noted and not on the level of glucose tolerance from a population based
viewpoint.
CRITERIA for Diagnosis of Diabetes(6)
1. HgbA1c of ≥ 6.5% is new diagnostic criterion. Needs to be done in a lab setting using
NGSP certified method and following DCCT standard (point of care tests are not
accepted)
2. HgbA1C can not be used to diagnose diabetes in pregnancy nor in patients with anemia
from iron deficiency or hemolysis Increased rate of red cell turnover
3. Fasting Plasma Glucose > or = 126 (no calories for 8 hours)
4. 2 hour plasma glucose > or = 200mg/dl using 75gm OGTT
5. Random plasma glucose > or = 200 with hyperglycemia Symptoms
Note: In the absence of unequivocal hyperglycemia and acute metabolic decompensation, these
criteria should be confirmed by repeat testing on a different day.

All of them were subjected to echocardiography done at the Department of Cardiology, Stanley
hospital, Chennai. Echocardiograms were done using the commercially available Esaote`S My
Lab50. which has the capabilities of performing two dimensional, M mode, Pulsed wave and
continuous wave Doppler and colour flow imaging was used to obtain echo cardiogram images.
Phased array transducers 2.5 - 3.5 MHz frequencies were used to obtain 2-D / M-mode echo
cardiography. Images were obtained with subjects in 30 degree lateral decubitus position. All
measurements were performed in the freezed images from all the patients, good quality images
suitable for the measurements and interpretations were obtained and recorded.
For assessment of LV systolic function the following parameters were calculated from the M-
mode echocardiogram obtained at the level of mitral valve chordae. LV dimension diastole
(LVId) systole (LVsd) and thickness of inter ventricular septum, left ventricular posterior wall
thickness in diastole.LV ejection fraction was calculated using the following formula,
EF= LVEDV-LDESV/ LVEDV x 100
For the assessment of LV diastolic dysfunction following parameters were calculated from
doppler transmitral flow velocities in the apical 4-chamber view by positioning the pulsed
doppler sample volume between the tips of the mitral leaflets.
1. LV filling during the early rapid phase(E wave m/s ),
2. LV filling during atrial contraction (A wave m/s)
3. Ratio of the filling velocity E/A ratio
4. Deceleration time ( from the peak of E wave to the point at which the deceleration velocity
reaches the base line)
5. Isovolumetric relaxation time. (from the aortic valve closure to the beginning of E wave)

STATISTICAL ANALYSIS
All data were expressed as mean ± SD. Statistical analysis was performed using Graph pad
Instat. Student`s T test were used between group comparison. Differences in variables between
patients with and without LV diastolic dysfunction were analyzed using Fisher’s Exact test and
a P value of less than 0.05 was considered as statistically significant.
OBSERVATIONS AND RESULTS
OBSERVATIONS

Table No 1. SEX DISTRIBUTION
Category Sex
Total Female Male
Diabetic patients 32 18 50
Controls 30 20 50
Out of 50 patients in study group, 32 were female and 18 were male. In control
group 30 were female and 20 were male.
Table No. 2 AGE DISTRIBUTION
Age(in
Years)
Control group Diabetic group
Male Female Total % Male Female Total %
31-40 4 4 8 16% 5 4 9 18%
41-50 8 21 29 58% 7 22 29 58%
51-60 5 3 8 16% 4 4 8 16%
61-70 3 2 5 10% 2 2 4 8%
More than half of the study population and control population belong to age group of 41-50 years
(58%).
SEX DISTRIBUTION

AGE DISTRIBUTION IN DIABETIC PATIENTS
OBESITY ASSESSMENT
0
5
10
15
20
25
30
35
diabetic patients
controls
female
male
male
female
total
0
5
10
15
20
25
30
31-4041-50
51-6061-70
male
female
total

The Health Ministry has reduced the diagnostic cut-offs for body mass index (BMI) to 23 kg/m2
and the standard waist circumference to assess obesity (77 )
Table No .3 DISTRIBUTION OF BMI IN DIABETIC GROUP
Body Mass Index
31-40
years
41-50
years
51-60
years
60-70
years
Total
Percentage
<18.5 Low BMI 0 1 1 0 2 4%
18.6-23 healthy 6 7 2 1 16 32%
23.1-25 Over wt 4 7 2 1 14 28%
>25 obesity 0 13 3 2 18 36%
In study groups 4% were in low BMI
32% were in healthy state
28% were overweight and
36% were obese .
Table No.4 DISTRIBUTION OF BMI IN CONTROL GROUP

Body mass index
31-40
years
41-50
years
51-60
years
60-70
years
Total
Percentag
e
<18.5 Low
BMI
2 3 1 1 7 14%
18.6-23 healthy 9 8 3 3 23 46%
23.1-25 Over wt 4 8 1 2 15 30%
>25 obesity 1 2 2 0 5 10%
14% had low BMI, 46% had acceptable BMI, 30% had over weight and 10% had obesity
In this study, obesity is more in diabetic population than control groups (36% vs.10%)
Unfavorable BMI was found in 32 patients out of 50(64%) 18 were overweight and 14
were obese in diabetic group, where as in control group 20 people had un favorable BMI
(40%) 15 were overweight and 5 were obese.
Table No.5 Distribution of Waist Hip Ratio in study and control groups
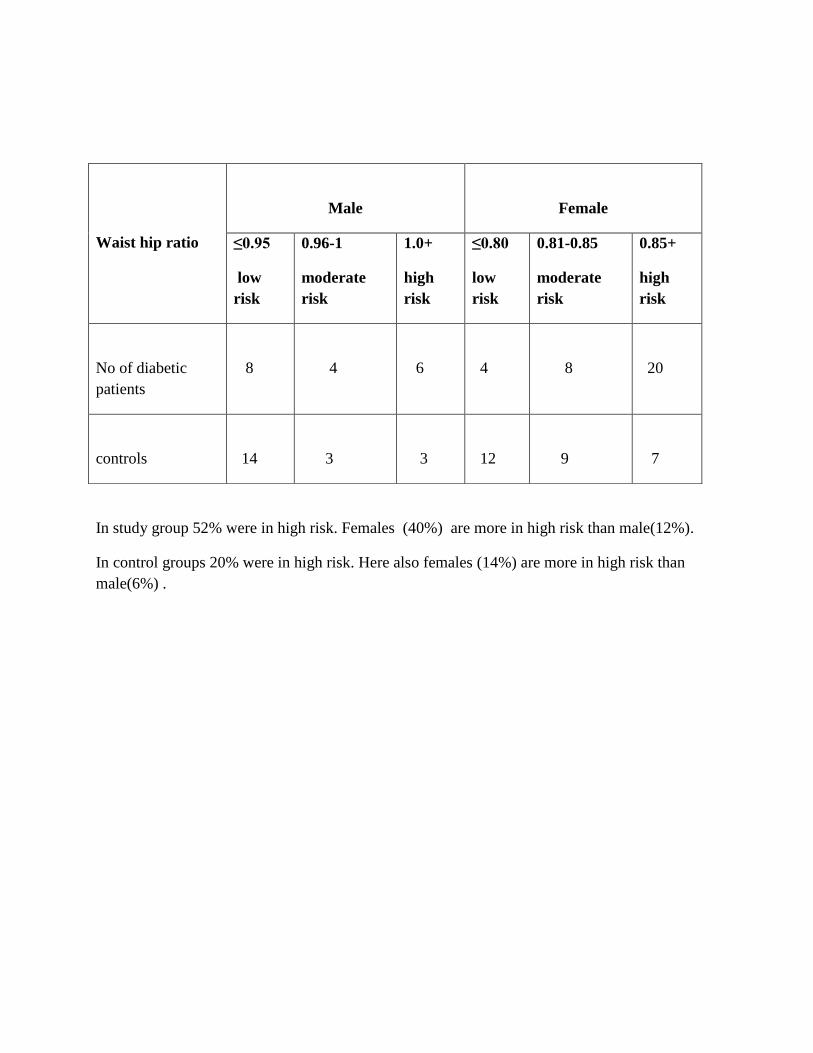
In study group 52% were in high risk. Females (40%) are more in high risk than male(12%).
In control groups 20% were in high risk. Here also females (14%) are more in high risk than
male(6%) .
Waist hip ratio
Male
Female
≤0.95
low
risk
0.96-1
moderate
risk
1.0+
high
risk
≤0.80
low
risk
0.81-0.85
moderate
risk
0.85+
high
risk
No of diabetic
patients
8
4
6
4
8
20
controls
14
3
3
12
9
7

STATISTICAL ANALYSIS
STUDY GROUP
BMI mean value
T value
P value
Total DM patients
Total control
25.396 ± 4.375
22.012 ± 3.441
4.298
<0.0001
Male patients
Male control
24.846 ± 4.949
22.669 ± 4.116
1.480
0.1477
Female patients
Female control
25.872 ± 4.089
23.187 ± 3.948
2.657
0.010
STUDY GROUP
W/H ratio
T value
P value
DM patients
control
0.9226 ± 0.1252
0.8372 ± 0.0919
3.887
0.0002
Male patients
Male control
0.9389 ± 0.1369
0.8570 ± 0.1155
1.999
0.0532
Female patients
Female control
0.9134 ± 0.1148
0.8332 ± 0.0768
3.353
0.0013

Lipid analysis
The above statistical analysis showed significant correlation between groups regarding the Body
Mass Index, Waist/Hip Ratio, Triglycerides, total cholesterol, HDL, and LDL.
Study
group
S.cholesterol T value P value
Patients 205.08 ± 31.04 4.190 <0.0001
control 178.90 ± 31.43
Study group TGL T value P value
patients 197.18±74.93 4.611 <0.0001
control 142 ± 38.46
Study group HDL T value P value
patients 42.4±8.827 2.349 0.0208
control 46.44 ± 8.367
Study group LDL T value P value
patients 124.26±32.47 4.289 <0.0001
control 97.51 ± 29.82

Table .6 COMPARISON OF CHARACTERISTICS BETWEEN SUBJECTS WITH
NORMAL AND THOSE WITH DIASTOLIC DYSFUNCTION IN DIABETIC
POPULATION
Variables
Diabetic patients
T value
P value With Normal LV
function(36)
with diastolic
dysfunction(14)
Age years
Male :female
BMI
W/H ratio
FBS
PPBS
HBA1C
T.CHOLESTEROL
TGL
HDL
LDL
Urea
S.Creatinine
45.56 ± 7.16
14:25
24.48 ± 3.96
0.907 ± 0.13
163.28 ± 44.41
261.81 ± 61.74
8.13 ± 1.48
197.75 ± 25.52
179.17 ± 56.53
43.97 ±8.5
117.81 ± 26.9
30.87±7.7
0.74±3.8
53.07 ± 8.76
4:10
27.18 ± 3.64
0.963 ± 0.11
187.5 ± 56.49
316.86 ± 57.86
9.16 ± 1.4
223.93 ± 36.72
243.5 ± 97.03
38.36 ± 8.65
140.86 ± 40.20
33.77±9.6
0.79±4.3
3.129
2.205
1.437
1.603
2.879
2.250
2.868
2.927
2.088
2.356
0.9740
0.7645
0.003
0.0323
0.1585
0.1156
0.0059
0.0291
0.0061
0.0052
0.0422
0.0226
0.3350
0.2643
ECHO variables
IVS thickness
LVPW thickness
EF%
10.36 ± 1.53
9.26 ± 1.18
57±8.2%
11.61 ± 0.99
10.75 ± 1.2
58±6.8%
2.806
3.973
0.762
0.0072
0.0002
0.2613

Baseline characteristics and laboratory data shows significant differences within diabetic group
regarding the Body Mass Index, Waist/Hip Ratio, FBS, PPBS, Triglycerides, total cholesterol,
HDL, and LDL. No significant differences with respect to urea and creatinine concentrations
were observed.
Echocardiographic data are showed there were no significant differences within diabetic group
regarding left ventricle ejection fraction, but there were significant differences in thickness of
interventricular septum, thickness of left ventricle posterior wall.
Table No .7 TRANSMITRAL DOPPLER FLOW VELOCITY RECORDING
Doppler
parameter
Diabetic patients control
Subjects with
normal cardiac
function
Subject with
diastolic
dysfunction
Subjects with
normal cardiac
function
Subject with
diastolic
dysfunction
Number 36(72%) 14(28%) 45(90%) 5(10%)
E wave(cm/s) 71± 10
56 ±10
69± 11
58 ± 12
A wave(cm/s) 58 ±8
71 ±3
52 ±9
69 ± 4
E/A 1.26± 0.09 0.78 ±0.053 1.34± 0.17 0.81 ± 0.10
DT(ms) 218 ± 46 244 ±51 189 ± 42 238 ± 48
IVRT(ms) 106±19 110 ±11 90±17 109 ± 12

Transmitral velocity data showed the significant low E/A ratio (E<A), prolonged declaration
time (>240ms) and isovolumetric relaxation time (>110ms) in patients with diastolic dysfunction
both in study group and control group.
Table .8 GRADING OF DIASTOLIC DYSFUNCTION IN STUDY GROUPS
Diastolic function
category
New diabetic
patients
Control group
1.Normal pattern
36
45
2.Impaired relaxation
14
5
3.Pseudo normal pattern
0
0
4.Restrictive pattern
0
0
All of them had Grade I Diastolic dysfunction only.
GRADING OF DIASTOLIC DYSFUNCTION IN STUDY GROUPS
05
1015202530354045
DIABETIC PATIENTS
CONTROL

RESULTS
Table No.9 INCIDENCE OF DIASTOLIC DYSFUNCTION IN STUDY GROUPS
Study group With diastolic
dysfunction
Without diastolic
dysfunction
Total
New diabetic
patients
14 36 50
control 5 45 50
Fisher`s exact test showed, the two- sided P value is 0.0395, and the Relative risk is 2.80
considered statistically significant.
Of the 50 patients of diabetic group that were included in the study, diastolic dysfunction was
detected in 14 patients giving an incidence of 28% .Where as in control group, out of 50 people
5 had diastolic dysfunction giving an incidence of 10% , revealing a threefold risk in the
incidence of diastolic dysfunction in newly diagnosed diabetic patients.
Table No .10 DIASTOLIC DYSFUNCTION AND AGE DISTRIBUTION IN STUDY
GROUPS
Age Diastolic dysfunction
New diabetic patients Control group
40-50 7 0
51-60 4 2
61-70 3 3
Diastolic dysfunction occurs more earlier in new diabetic patients than control population 50% in
the age group of 40-50 years.

INCIDENCE OF DIASTOLIC DYSFUNCTION IN STUDY GROUPS
DIASTOLIC DYSFUNCTION AND AGE DISTRIBUTION IN STUDY GROUPS
0%
10%
20%
30%
40%
50%
60%
70%
80%
90%
100%
diabetes group control
without Diastolic dysfunction
with diastoli dysfunction
diabetic patients
control0
1
2
3
4
5
6
7
40-5051-60
61-70
diabetic patients
control

Table No. 11 GENDER DISTRIBUTION OF DIASTOLIC DYSFUNCTION
In study groups, of the 32 females 10 patients(31.25%) had LVDD while of the 18 males 4
patients had LVDD(22%).In control groups, of the 30 females 3 person(10%) had LVDD while
of the 20 males 2 person had LVDD(10%)
GENDER DISTRIBUTION OF DD IN STUDY GROUPS
MALE
FEMALE
0
5
10
15
20
25
NORMAL
DIASTOLIC DYSFUNCTION
MALE
FEMALE
study
group
diabetic patients control group
normal
function
with diastolic
dysfunction
normal
function
with diastolic
dysfunction
male
14
4
18
2
female
22
10
27
3

Table .12 ANALYSIS OF ASSOCIATED RISK FACTORS IN NEW DIABETIC
PATIENTS WITH DIASTOLIC DYSFUNCTION
Total BMI>25 WHR
>1/>.85 FBS>200 PPBS>300
HbA1C
> 9
T. chol
> 240
TGL
>200
HDL
<40
LDL
>30
14 8 7 5 9 6 4 8 8 5
Out of 14 patients, 4 were male and 10 of them were female. 73% were obese, 64 % had higher
waist-hip ratio, 45.46% had FBS >200, 82% had post prandial glucose >300 mg%, 57% had
HbA1C > 9% and >50% had dyslipidemia.
Table .13 ANALYSIS OF ASSOCIATED RISK FACTORS IN CONTROL GROUP WITH
DIASTOLIC DYSFUNCTION
Total BMI>25 WHR
>1/>.85 T. Chol> 240
TGL
>200 HDL <40 LDL >30
5 1 3 0 1 2 1
Out of 5 patients, 2 were male and 3 of them were female.
Compared to the patients with diastolic dysfunction in control group, new diabetic patients with
diastolic dysfunction had significantly higher BMI and dyslipidemia.
In new diabetic patient, those who are having high PPBS at the time of diagnosis had significant
correlation with diastolic dysfunction (P value 0.0059) .

DISCUSSION
Epidemiological data indicate a greater risk of cardiovascular morbidity and mortality,
particularly congestive cardiac failure, in diabetic subjects as compared with those without
diabetes (78
). The prevalence of diastolic dysfunction in diabetic population ranges from 30% to
70%.
Left ventricular diastolic dysfunction may represent the first stage of diabetic cardiomyopathy
reinforcing the importance of early examination of diastolic function in individuals with
diabetes.
Our study showed that the prevalence of diastolic dysfunction in newly diagnosed type 2
diabetic patients was 28% and those in control population it was 10% .
Similar findings have been reported with Doppler echocardiography (E/A ratio), in newly
diagnosed type 2 diabetic patients free of microvascular complications, without evidence of
hypertension and coronary artery disease [79-81].
In the study of Gough et al. [79]
LVdiastolic function was assessed with pulsed wave Doppler
mitral flow velocities in20 normotensive patients with a new diagnosis of type 2 diabetes
mellitus. The E/A ratio was significantly reduced in the diabetic group but despite improvements
in glycemic control over 3 months (HbA1c 9.9% to 7.4%), maintained at 6 months (HbA1c
7.0%), there were no changes in the E/A ratio.
In the study of Beljic et al. [80]
LV diastolic function was evaluated at the onset of disease and
after 6 and 12 months of adequate glycemic control. A significantly reduced value of peak E/A
ratio was found in the diabetic patients before treatment, but did not significantly change after 1
year of adequate glycemic control with therapy.

Vanninen et al. [81]
also demonstrated in a population of newly diagnosed diabetics,
an improvement of diastolic function concomitantly with declining blood glucose levels
evaluated after a 15-month period. Of note, this was demonstrated with a complex
echocardiographic indices but not with the conventional mitral E/A ratio.
Di Bonito et al. [82]
reached to the same conclusions in a case-control study using Doppler
echocardiography (E/A ratio). They observed diastolic dysfunction in 16 normotensive type 2
diabetic patients, free of microvascular complications with a disease duration of less than 1 year.
These observations of an impaired diastolic function in patients with newly diagnosed diabetes
or with a short duration of the disease and with no microangiopathic complications suggest that
this alteration may occur early in the history of type 2 diabetes and would not be related to
microvascular complications.
Celentano et al. [83]
studied 64 subjects with normal glucose tolerance (n = 25), with impaired
glucose tolerance (n = 15) and with type 2 diabetes mellitus (n = 24) diagnosed by an oral
glucose tolerance test according to the recommendations of the World Health Organization. They
found early signs of diastolic dysfunction (assessed by E/A mitral flow ratio), not only in patients
with diabetes but also in those with impaired glucose tolerance, independent of the confounding
role of ischemia, body weight, and blood pressure.
Poirier et al(84)
in 2001 in Canada attempted to determine the prevalence of left ventricular
diastolic dysfunction in middle-aged asymptomatic subjects with type 2 diabetes in a study,

which included 46 men who has no evidence of diabetic complications, hypertension, coronary
artery disease, congestive cardiac failure, thyroid or renal disease. Left ventricular diastolic
dysfunction was found in 28 (60%) subjects impaired relaxation.
Bajraktari et al (85)
in 2004 in Kosovo demonstrated that left ventricular diastolic dysfunction
was present in 68.8% of asymptomatic type 2 diabetic patients as compared to 34.9% in the
control group without diabetes which was due to the presence of asymptomatic diabetic
cardiomyopathy which was present in the diabetic population.
It was also noted that diastolic dysfunction is more common among diabetic women and they
also had a more advanced form of diastolic dysfunction as compared to men
In our study, 0f the 32 female patients 10 patients(31.25%) had LVDD while of the18 male 4 patients(22%) had LVDD
In Framingham study also females out numbered the males.The Strong Heart study by Devereuex and colleagues in 2000 also
demonstrated that diastolic dysfunction is more prevalent in women than in men. (86
)
This could be due to hormonal changes that accompany after menopause.
Risk Factors Associated with Left Ventricular Diastolic Dysfunction (87, 88)
Hypertension and IHD are recognized as important risk factors for left ventricular (LV) diastolic
dysfunction. Some studies have shown that diabetes itself may also be an independent risk factor
for LV diastolic dysfunction.
In our study post prandial blood sugar (PPBS) and HbA1c significantly correlated with diastolic
dysfunction
Poirier and colleagues 84
also did not find any difference in the glycemic indices and concluded
that fasting blood glucose levels did not correlate with the presence of diastolic dysfunction in
type 2 diabetes. However, Holzmann and colleagues demonstrated that the presence of diastolic
dysfunction is related to the concentrations of fasting blood glucose, post prandial blood glucose
and HbA1c (89)
.
BMI was higher in patients with DD (27.18 ± 3.64 vs. 24.48 ± 3.96 kg/m2; P value of 0.0323) ,
it has direct correlation with LVDD. But WHR (waist hip ratio) not significantly correlate with
diastolic dysfunction
Diabetic patients who had abnormal lipid values had increased incidence of LVDD than who had
normal lipid values, particularly total cholesterol and TGL with significant P value of 0.0052.

The potential risk factors for the development of diastolic dysfunction in type 2 diabetics that
were determined were; (a) age ≥45 years was associated with an almost three times higher risk
for the development of diastolic dysfunction, (b) females had almost two times a higher risk for
the development of diastolic dysfunction as compared with men, and (c) diabetic patients with
high PPBS and high HbAIc were higher risk of developing diastolic dysfunction (d)diabetic
patients with high BMI and dyslipidemia was associated with higher risk for the development of
diastolic dysfunction
STUDY LIMITATION
The limitation of our study was that TMT was not performed thus the possibility of coronary
artery disease could not be completely excluded however the absence of clinical,
Electrocardiographic and Echocardiographic evidence makes it unlikely, and this study was done
in a small population.

SUMMARY
Incidence of diabetes is more common in the age group of 41-50years
Incidence of diastolic dysfunction is higher in new type 2 diabetic patients than control
group, (28% vs 10%) with significant p value 0.039, they are in three fold risk in
developing DD than general population.
Systolic dysfunction was not found in any newly detected type 2 diabetic patients.
Patients with LV diastolic dysfunction were older than patients without LV diastolic
dysfunction in new diabetic patients.(53.07 ± 8.76 vs. 45.56 ± 7.16 years; P 0.003).
Diastolic dysfunction occur more earlier in diabetic patients (40-50years), compared to
control group where diastolic dysfunction commonly occur in elderly people (60-70).
Diastolic dysfunction in new type 2 diabetic patients showed a higher incidence in female
population compared to male (28% vs 22%). Interestingly diastolic dysfunction occurs in
later age group in female than male (>50years vs >40 years).
Analysis clearly showed that new diabetic patient with diastolic dysfunction had
significant association with PPBS,HbA1C, BMI and dyslipidemia.

CONCLUSIONS
The incidence of diastolic dysfunction was found significantly high in newly
diagnosed type 2 diabetes mellitus patients as compared with non diabetic subjects.
Prevalence of diastolic diastolic dysfunction in new diabetic population has female
preponderance in the ratio of 2:1 .
Among the type 2 diabetes patients, Advancing Age, abnormal BMI, PPBS, raised
HbA1c, elevated Total Cholesterol and Triglyceride were significantly associated
with diastolic dysfunction.
Hence all newly detected diabetes with these risk factors should be evaluated for
cardiac function with echocardiography.
When definite therapeutic and prevention strategies have evolved, then it may
become necessary and useful to screen all new diabetic patients for LV diastolic
dysfunction with echocardiography.

BIBLIOGRAPHY
1.Haffner SM, Lehto S, Ronnemma T, Pyorala K, Laakso M. Mortality from coronary heart
disease in subjects with type 2 diabetes and in non diabetic subjects with and without prior
myocardial infarction. N Engl J Med 1998;339:229-34.
2.The DECODE study group ,on behalf of European Diabetes Epidemiology Study
roup;glucose tolerance CV mortality:Arch.intern.med 2001 161:397-405
3. Kannel WB, Hjortland M, Castelli WP. Role of diabetes in congestive heart failure; The
Framingham heart study. Am J Cardiol 1974;34: 29-34.
4. Zarich SW, Arbuckle BE, Cohen LR, Roberts M, Nesto RW. Diastolic abnormalities in young
asymptomatic diabetic patients assessed by pulsed Doppler echocardiography. J Am Coll Cardiol
1988; 12: 114-20.
5. Raev DC. Which left ventricular function is impaired earlier in the evolution of diabetic
cardiomyopathy? An echocardiographic study of young type 1 diabetic patients. Diabetes Care
1994: 17; 633-639.
6. Diabetes Care, Volume 33, Supplement 1, January 2010, p. S4
7. Cecilia Gutierrez, M.D, and Daniel G. Blanchard, M.D., University of California, San Diego,
School of Medicine, La Jolla, California- Diastolic Heart Failure: Challenges of Diagnosis and
Treatment Am Fam Physician. 2004 Jun 1;69(11):2609-2617.
8. Stratton IM, Adler AI, Neil HA, et al. Association of glycemia with macrovascular and
microvascular complications of type 2 diabetes (United Kingdom Prospective Diabetes Study
35): prospective observational study. BMJ. 2000;321:405-412.

9. Elsevier et al The American Journal of Medicine (2008) 121, 748-757
10.Sihem Boudina and E. Dale Abel Diabetic Cardiomyopathy Revisited Circulation
2007;115;3213-3223
11. Spector KS. Diabetic cardiomyopathy. Clin Cardiol. 1998;21:885– 887.
12. Tziakas DN, Chalikias GK, Kaski JC. Epidemiology of the diabetic heart. Coron Artery Dis.
2005;16(suppl 1):S3–S10.
13 Avendano GF, Agarwal RK, Bashey RI, Lyons MM, Soni BJ, Jyothirmayi GN, Regan TJ.
Effects of glucose intolerance on myocardial function and collagen-linked glycation. Diabetes.
1999;48:1443–1447.
14. Capasso JM, Robinson TF, Anversa P. Alterations in collagen crosslinking impair
myocardial contractility in the mouse heart. Circ Res.1989;65:1657–1664.
15. Berg TJ, Snorgaard O, Faber J, Torjesen PA, Hildebrandt P, Mehlsen J, Hanssen KF. Serum
levels of advanced glycation end products are associated with left ventricular diastolic function
in patients with type 1 diabetes. Diabetes Care. 1999;22:1186 –1190.
16. Zhao XY, Hu SJ, Li J, Mou Y, Chen BP, Xia Q. Decreased cardiac sarcoplasmic reticulum
Ca2+ -ATPase activity contributes to cardiac dysfunction in streptozotocin-induced diabetic rats.
J Physiol Biochem.2006;62:1– 8.
17. Lopaschuk GD, Tahiliani AG, Vadlamudi RV, Katz S, McNeill JH. Cardiac sarcoplasmic
reticulum function in insulin- or carnitine-treated Diabetic rats. Am J Physiol Heart Circ
Physiol. 1983;245:H969–H976.
18. Pierce GN, Dhalla NS. Cardiac myofibrillar ATPase activity in diabetic rats. J Mol Cell
Cardiol. 1981;13:1063–1069.

19. Das AK, Das JP, Chandrasekar S. Specific heart muscle disease in diabetes mellitus—a
functional structural correlation. Int J Cardiol, 1987, 17, 299-302.
20. Belke DD Swanson EA Dillmann WH, Decreased sarcoplasmic reticulum activity and
contractility in diabetic mouse heart, Diabetes 2004; 53:v3201-3208
21.lTrost SU, Belke DD, Bluhm WF, Meyer M, Swanson E, Dillmann WH.Overexpression of
the sarcoplasmic reticulum Ca(2+)-
ATPase improves myocardial contractility in diabetic
cardiomyopathy. Diabetes.2002;51:1166 –1171.
22. Dhalla NS, Liu X, Panagia V, Takeda N. Subcellular remodeling andheart dysfunction in
chronic diabetes. Cardiovasc Res. 1998;40: 239–247.
23. Fiordaliso F, Li B, Latini R, Sonnenblick EH, Anversa P, Leri A, Kajstura J. Myocyte death
in streptozotocin-induced diabetes in rats in angiotensin II- dependent. Lab Invest J Tech
Methods Pathol. 2000;80: 513–527.
24. Khatter JC, Sadri P, Zhang M, Hoeschen RJ. Myocardial angiotensin II (Ang II) receptors in
diabetic rats. Ann N York Acad Sci. 1996;793: 466–472.
25. Christlieb AR, Long R, Underwood RH. Renin-angiotensin-aldosterone system, electrolyte
homeostasis and blood pressure in alloxan diabetes. Am J Med Sci. 1979;277:295–303.
26.Frustaci A, Kajstura J, Chimenti C, Jakoniuk I, Leri A, Maseri A,Nadal-Ginard B, Anversa P.
Myocardial cell death in human diabetes.Circ Res. 2000;87:1123–1132.
27. Cai L, Wang Y, Zhou G, Chen T, Song Y, Li X, Kang YJ. Attenuation by metallothionein of
early cardiac cell death via suppression of mitochondrial oxidative stress results in a prevention
of diabetic cardiomyopathy.J Am Coll Cardiol. 2006;48:1688 –1697.
28. Cai L. Suppression of nitrative damage by metallothionein in diabetic heart contributes to the
prevention of cardiomyopathy. Free Radic Biol Med. 2006;41:851– 861.

29. Wold LE, Ren J. Streptozotocin directly impairs cardiac contractile function in isolated
ventricular myocytes via a p38 map kinasedependent oxidative stress mechanism. Biochem
Biophys Res Commun.2004;318:1066 –1071.
30. Cai L, Li W, Wang G, Guo L, Jiang Y, Kang YJ. Hyperglycemiainduced apoptosis in mouse
myocardium: mitochondrial cytochrome C-mediated caspase-3 activation pathway. Diabetes.
2002;51: 1938–1948.
31. Kwon SH, Pimentel DR, Remondino A, Sawyer DB, Colucci WS.H(2)O(2) regulates cardiac
myocyte phenotype via concentrationdependent activation of distinct kinase pathways. J Mol
Cell Cardiol.2003;35:615– 621.
32Brownlee M. Advanced protein glycosylation in diabetes and aging.Annu Rev Med.
1995;46:223–234.
33 Koya D, King GL. Protein kinase C activation and the development of diabetic complications.
Diabetes. 1998;47:859–866.
34. Lopaschuk GD. Metabolic abnormalities in the diabetic heart. Heart Fail Rev. 2002;7:149 –
159.
35. Taegtmeyer H, McNulty P, Young ME. Adaptation and maladaptation of the heart in
diabetes, part I: general concepts. Circulation. 2002;105: 1727–1733.
36. Stanley WC, Lopaschuk GD, McCormack JG. Regulation of energy substrate metabolism in
the diabetic heart. Cardiovasc Res. 1997;34:25–33.
37. Carley AN, Severson DL. Fatty acid metabolism is enhanced in type 2 diabetic hearts.
Biochim Biophys Acta. 2005;1734:112–126.
38. McGavock JM, Victor RG, Unger RH, Szczepaniak LS. Adiposity of the heart, revisited.
Ann Intern Med. 2006;144:517–524.
39. Sharma S, Adrogue JV, Golfman L, Uray I, Lemm J, Youker K, Noon GP, Frazier OH,
Taegtmeyer H. Intramyocardial lipid accumulation in the failing human heart resembles the
lipotoxic rat heart. FASEB J.2004;18:1692–1700.
40. Szczepaniak LS, Dobbins RL, Metzger GJ, Sartoni-D’Ambrosia G,Arbique D, ongpatanasin
W, Unger R, Victor RG. Myocardial triglycerides and systolic function in humans: in vivo
evaluation by localized proton spectroscopy and cardiac imaging. Magn Reson Med.
2003;49:417–423.
41. Zhou YT, Grayburn P, Karim A, Shimabukuro M, Higa M, Baetens D,Orci L, Unger RH.
Lipotoxic heart disease in obese rats: implications for human obesity. Proc Natl Acad Sci U S A.
2000;97:1784 –1789.
42. Rodrigues B, Cam MC, McNeill JH. Metabolic disturbances in diabetic cardiomyopathy.
Mol Cell Biochem. 1998;180:53-57.
43. Eckel J, Reinauer H. Insulin action on glucose transport in isolated cardiac myocytes:
signalling pathways and diabetes-induced alterations.Biochem Soc Trans. 1990;18:1125-1127.
44. Liedtke AJ, DeMaison L, Eggleston AM, et al. Changes in substrate metabolism and effects
of excess fatty acids in reperfused myocardium. Circ Res. 1988;62:535-542.
45. Yazaki Y, Isobe M, Takahashi W, et al. Assessment of myocardial fatty acid abnormalities in
patients with idiopathic dilated cardiomyopathy using I123 BMIPP SPECT: correlation with
clinicopathological findings and clinical course. Heart. 1999;81:153-159.
46. Malhotra A, Sanghi V. Regulation of contractile proteins in diabetic heart. Cardiovasc Res.
1997;34:34-40.
47. Takeda N, Nakamura I, Hatanaka T, et al. Myocardial mechanical and myosin isoenzyme
alterations in streptozotocin-diabetic rats. Jpn Heart J. 1988;29:455-463.

48. Abe T, Ohga Y, Tabayashi N, et al. Left ventricular diastolic dysfunction in type 2 diabetes
mellitus model rats. Am J Physiol Heart Circ Physiol. 2002;282:H138-H148.
49. Boudina S, Abel ED. Mitochondrial uncoupling: a key contributor to reduced cardiac
efficiency in diabetes. Physiology (Bethesda). 2006;21:250–258.
50. An D, Rodrigues B. Role of changes in cardiac metabolism in development of diabetic
cardiomyopathy. Am J Physiol Heart Circ Physiol. 2006;291:H1489–H1506.
51. Kuo TH, Moore KH, Giacomelli F, Wiener J. Defective oxidative metabolism of heart
mitochondria from genetically diabetic mice.Diabetes. 1983;32:781–787.
52. Pierce GN, Dhalla NS. Heart mitochondrial function in chronic experimental diabetes in rats.
Can J Cardiol. 1985;1:48 –54.
53. Tanaka Y, Konno N, Kako KJ. Mitochondrial dysfunction observed in situ in
cardiomyocytes of rats in experimental diabetes. Cardiovasc Res.1992;26:409–414.
54. Lashin O, Romani A. Hyperglycemia does not alter state 3 respiration in cardiac
mitochondria from type-I diabetic rats. Mol Cell Biochem. 2004; 267:31–37.
55. Shen X, Zheng S, Thongboonkerd V, Xu M, Pierce WM Jr, Klein JB, Epstein PN. Cardiac
mitochondrial damage and biogenesis in a chronic model of type 1 diabetes. Am J Physiol
Endocrinol Metab. 2004;287: E896–E905.
56. Bisognano JD, Weinberger HD, Bohlmeyer TJ, et al. Myocardialdirected overexpression of
the human _(1)-adrenergic receptor in transgenic mice. J Mol Cell Cardiol. 2000;32:817-830.
57. Mirsky I. Assessment of diastolic function: suggested methods and future considerations.
Circulation, 1984, 69, 836-41.

58. Appleton CP, Hatle LK, Popp RL. Relation of transmitral flow velocity patterns to LV
diastolic function: new insights from a combined hemodynamic and Doppler echocardiographic
study. J Am Coll Cardiol, 1988, 12, 426-40.
59. Rubler S, Dlugash J, Yeceoglu YZ, Kumral T, Branwood AW, Grishman A. New type of
cardiomyopathy associated with diabetic glomerulosclerosis. Am J Cardiol 1972; 30: 595-602.
60.Regan TJ, Weisse AB. Diabetic cardiomyopathy. J Am Coll Cardiol, 1992, 19, 1165-6.
61.Hamby RI, Zoneraich S, Sherman L. Diabetic cardiomyopathy. JAMA, 1974, 229, 1749-54.
62. Holmang et al, the effects of hyper insulinemia inon myocardial mass blood pressure
regulation and central haemo dynamics in rats . Europien journal of clinical investigation
26 :973-8
63. Jyorthirmayi et al effects of metformin on collgen glycosylation and diastolic dysfunction in
diabetic ocardium. journal of circulation pharmacology and therapeutics 3 : 319-26
64. Raev DC. Which LV function is impaired earlier in the evolution of diabetic
cardiomyopathy? An echocardiographic study of young type I diabetic patients. Diabetes Care,
1994, 17, 633-9.
65. Airaksinen J, Ikaheimo M, Kaila J, Linnaluoto M, Takkunen J. Impaired LV filling in young
female diabetics. An echocardiographic study.Acta Med Scand, 1984, 216, 509-16.
66.Sanderson JE, Brown DJ, Rivellese A, Kohner E. Diabetic cardiomyopathy? An
echocardiographic study of young diabetics. BMJ, 1978, 1, 404-7.
67. Von Bibra H, Hansen A, Dounis V, et al. Augmented metabolic control improves myocardial
diastolic function and perfusion in patients with non-insulin dependent diabetes. Heart.
2004;90:1483-1484.

68. Von Bibra H, Siegmund T, Hansen A, et al. Augmentation of myocardial function by
improved glycemic control in patients with type 2 diabetes mellitus. Dtsch Med Wochenschr.
2007;132:729-734.
69. Hordern MD, Smith LM, Short L, et al. Use of diastolic tissue velocity and standard
parameters to assess treatment response in subclinical myocardial disease. A randomized trial of
lifestyle intervention in type 2 diabetes. Poster abstract presented at the proceedings of the
Annual American Heart Association Meeting at Orlando, Florida, November 4-7, 2007.
70. Konduracka E, Gackowski A, Rostoff P, et al. Diabetes-specific cardiomyopathy in type 1
diabetes mellitus: no evidence for its occurrence in the era of intensive insulin therapy. Eur
Heart J. 2007;28: 2465-2471.
71. Thrainsdottir I, Malmberg K, Olsson A, et al. Initial experience with GLP-1 treatment on
metabolic control and myocardial function in patients with type 2 diabetes mellitus and heart
failure. Diab Vasc Dis Res. 2004;1:40-43.
72. Rösen R, Rump AF, Rösen P. The ACE-inhibitor captopril improves myocardial perfusion in
spontaneously diabetic (BB) rats. Diabetologia. 1995;38:509-517.
73. Al-Shafei AI, Wise RG, Gresham GA, et al. Magnetic resonance imaging analysis of cardiac
cycle events in diabetic rats: the effect of angiotensin-converting enzyme inhibition. J Physiol.
2002;538(Pt 2):555-572.
74. Al-Shafei AI, Wise RG, Gresham GA, et al. Non-invasive magnetic resonance imaging
assessment of myocardial changes and the effects of angiotensin-converting enzyme inhibition in
diabetic rats. J Physiol.2002;538(Pt 2):541-553.

75. Zaman AK, Fujii S, Goto D, et al. Salutary effects of attenuation of angiotensin II on
coronary perivascular fibrosis associated with insulin resistance and obesity. J Mol Cell Cardiol.
2004;37:525-535.
76. Kawasaki D, Kosugi K, Waki H, et al. Role of activated reninangiotensin system in
myocardial fibrosis and left ventricular diastolic dysfunction in diabetic patients-reversal by
chronic angiotensin II type 1A receptor blockade. Circ J. 2007;71:524-529.
77.India reworks obesity guidelines, BMI lowered -The Health Ministry has reduced the
diagnostic cut-offs for body mass index (BMI) to 23 kg/m2 and the standard waist circumference
to deal obesity Published on 11/26/2008
78. Bauters C, Lambin N, McFadden EP, Belle EV, Millaire A, de Groote P. Influence of
diabetes mellitus on heart failure risk and outcome. Cardiovasc Diabetol 2003;2:1.
79. Gough SC, Smyllie J, Barker M, Berkin KE, Rice PJ, Grant PJ. Diastolic dysfunction is not
related to changes in glycaemic control over 6 months in type 2 (non-insulin-dependent) diabetes
mellitus: a crosssectional study.Acta Diabetol, 1995, 32, 110-5.
80.. Beljic T, Miric M: Improved metabolic control does not reverse LV filling abnormalities in
newly diagnosed noninsulin-dependent diabetes patients. Acta Diabetol, 1994, 31, 147-50.
81. Vanninen E, Mustonen J, Vainio P, Lansimies E, Uusitupa M. LV function and dimensions
in newly diagnosed non-insulin-dependent diabetes mellitus.AmJ Cardiol, 1992, 70, 371-8.
82. Di Bonito P, Cuomo S, Moio N, et al. Diastolic dysfunction in patients with non-insulin-
dependent diabetes mellitus of short duration. Diabet Med, 1996, 13, 321-4.
83.Celentano A, Vaccaro O, Tammaro P, et al. Early abnormalities of cardiac function in non-
insulin-dependent diabetes mellitus and impaired glucose tolerance.AmJ Cardiol, 1995, 76,
1173-6.

84. Poirier P, Bogaty C, Garneau C, Marois L, Dumesnil JG. Diastolic dysfunction in
normotensive men with well controlled type 2 diabetes: importance in maneuvers in
echocardiographic screening for preclinical diabetic cardiomyopathy; Diabetes Care 2001: 4; 3-.
85. Bajraktari G, Quinko S, Bakalli A, Rexhepaj N, Elizi S. Reduced left ventricular diastolic
function in asymptomatic patients with non insulin dependent diabetes mellitus. Med Arch.
2004; 58(6): 220-41.
86. Devereux RB, Roman MJ, Liu JE. Congestive heart failure despite normal left ventricular
systolic function in a population based sample. The strong heart study. Am J Cardiol 2000;
86:1090.
87.Risk Factors Associated with Left Ventricular Diastolic Dysfunction in Type 2 Diabetic
Patients without Hypertension Jung Hyun Noh,1,2
Joon Hyung Doh,1 et al Korean Diabetes J
2010;34:40-46 doi:10.4093/kdj.2010.34.1.40 pISSN 1976-9180 · eISSN 2093-2650
88.Prevalence of left ventricular diastolic dysfunction in obese persons with and without diabetes
mellitus. The American Journal of Cardiology - Volume 95, Issue 12 (June 2005)
DOI: 10.1016/j.amjcard.2005.02.031
89. Holzmann M, Olsson A, Johansson J, Jensen U. Left ventricular diastolic function is related
to glucose in a middle aged population. J Intern Med. 2002; 251:415-20.

PROFORMA
1.Name
2.Age
3.Sex
4.Educational status
5.Occupation
6.Family income/yr
7.Address
8.Hgt in cms
9.Wgt in kg
10.BMI(kg/m2)
11.Waist-hip ratio
12.Clinical presentation
Polyuria, Polydipsia, wgt loss
13 . other history
14.Past history-SHT, CAD ,CVA, PT
15.Personal history- Alcohol, Smoking
16.Family history
17.Menstural history-pre menopausal/post menopausal
18.Diet history; veg/non veg
Frequency/duration
19.General examination; consciousness /orientation
Vitals BP: PR:
20. Systemic examination
CVS:

RS:
Abdomen;
CNS:
21.investigations
1.Urine R/E; Alb
Sugar
Deposits
2.FBS
PPBS
3.HbA1c
4.Lipid profile
5.ECG
6 Eehocardiography
LV IVS thickness/post wall thickness/LV diameter
E/A ratio
Ejection fraction

INFORMED CONSENT FORM
I agree to participate in the study titled ― ECHOCARDIOGRAPHIC EVALUATION OF
CARDIAC FUNCTION IN NEWLY DETECTED TYPE 2 DIABETES PATIENTS‖
I confirm that I have been told in my mother tongue and have had the opportunity to ask
questions
I understand that my participation is voluntary and I may refuse to participate at any time without
giving any reason and without affecting my benefits
I agree not to restrict the use of any data or results that arise from this study
Name of the participant:
Signature/ thumb print:
Witness Investigator

ABBREVIATIONS
DM Diabetes Mellitus
CVD Cardiovascular disease
LVDF Left ventricular diastolic function
LVDD Left ventricular diastolic dysfunction
IDDM Insulin dependent diabetes mellitus
MODY Maturity onset diabetes of young
BMI Body mass index
WHR Waist hip ratio
IFG Impaired fasting glucose
IGT Impaired glucose tolerance
HF Heart failure
AGE Advanced glycation end products
ROS Reactive oxygen species
FA Fatty acid
DT Deceleration time
IVRT Isovolumetric relaxation time
EF Ejection fraction
LVEDV Left ventricular end diastolic volume
LDESV Left ventricular end systolic volume
IVS Interventricular septum
LVPW Left ventricular posterior wall

MASTER CHART
NEWLY DETECTED DIABETIC PATIENTS
S.N name age sex BMI WHR BP FBS PPBS HbAIC TC TGL HDL LDL IVS LVPW E/A ratio EF%
1 RAMALINGAM 57 M 24.89 1.08 130/80 152 247 7.7 200 150 42 110 8.2 8.7 1.3 63%
2 LAKSHMI 65 F 23.8 0.84 128/86 163 370 9.6 261 280 35 191 13 11.2 0.86 60%
3 GOWRI 50 F 23.58 0.87 136/86 134 228 7.2 176 180 56 86 9.8 10.8 1.1 62%
4 SABIR ALLAH 47 M 20.06 0.82 120/78 135 248 7.2 179 175 45 94 11 12 1.1 58%
5 SHANTHI 50 F 31.2 1.01 120/82 360 480 13.4 246 387 32 156 11.8 9.6 0.74 63%
6 POWNU 56 F 24.09 0.74 132/84 133 210 7 210 207 38 130 9.8 10 1.2 68%
7 LAKSHMI 45 F 31.11 1.06 120/80 128 198 6.8 210 232 31 132 8.6 9.8 1.4 59%
8 PARIMALA 45 F 22.51 0.72 130/70 134 221 7.1 180 156 58 89 9.8 11 1.2 55%
9 ISMAIL 64 M 23.59 1.12 126/78 162 288 9.2 230 366 36 138 10.8 9.8 0.79 64%
10 PONNUTHAI 48 F 30.54 1.04 130/80 140 210 7.1 190 173 56 99 11.8 9.5 1.3 64%
11 POOMARI 45 F 31.58 1.02 110/76 201 330 9.6 210 176 42 132 12.8 9.7 1.3 63%
12 LOKESH 35 M 22.35 0.8 120/70 138 224 7.1 187 177 50 101 13 8.9 1.2 66%
13 VENDRA 57 F 26.26 0.81 110/80 140 280 8.1 230 215 33 110 12.8 11.2 0.84 58%
14 KALYANI 45 F 22.41 0.86 124/68 168 330 9.1 198 178 46 130 11.8 11 0.78 60%
15 KASTHURI 55 F 21.93 0.88 110/70 160 276 8.3 261 206 35 190 9.6 11 1.3 61%
16 RAJAMMAL 50 F 33.29 1.1 130/70 120 192 6.6 190 168 50 100 8.2 9.9 1.3 55%
17 KAMALA 70 F 24.51 1.08 140/80 146 306 8.6 223 188 25 165 10.8 11.2 0.69 68%
18 SUMATHI 37 F 22.67 0.89 120/80 200 320 9.5 186 166 50 99 10 9.8 1.2 69%
19 THAMBIAYYAN 39 M 22.26 0.98 110/68 164 246 7.9 220 184 38 124 8.2 8.5 1.3 59%
20 RAMANI 56 F 23.49 0.84 140/82 160 278 8.3 187 177 54 88 12 13 0.82 58%
21 RAJENDRAN 44 M 24.89 0.81 130/78 180 240 8.1 210 344 42 168 9.8 7.4 1.4 64%
22 SAVITHRI 48 F 23.8 0.84 126/86 180 268 8.5 210 190 46 130 10.2 8.9 0.74 59%
23 GAJALAXMI 43 F 23.58 0.87 100/70 120 250 7.4 210 176 42 132 12.6 9.2 1.2 66%
24 SAKAYAM 51 M 31.2 1.01 110/84 220 310 9.6 188 146 54 88 10.4 12 0.73 60%
25 MUNI VEL 68 M 20.76 0.82 130/78 160 310 8.7 211 219 33 125 8.8 11 1.3 64%

NEWLY DETECTED DIABETIC PATIENTS
S.N name age Sex BMI WHR BP FBS PPBS HbAIC TC TGL HDL LDL IVS LVPW E/A ratio EF%
26 ANJALAI 40 F 20.54 0.85 120/80 320 420 13 240 210 42 146 9.9 11 1.4 55%
27 NEELA 47 F 32 0.97 124/76 280 430 12 246 212 30 180 8.4 7.7 1.3 63%
28 LAKSHMI 48 F 24.74 1.14 110/88 140 220 7.2 190 168 52 100 12.3 9.6 1.2 58%
29 PATTU 50 F 27 0.94 134/78 210 320 9.6 183 166 54 98 13.4 10 1.3 59%
30 KULANDAIRAJ 34 M 20 0.97 126/68 138 288 8.1 190 180 56 97 11.4 8.2 1.2 68%
31 PANDIDURAI 42 M 28 0.98 130/80 168 246 8 200 246 38 130 13 11 0.86 58%
32 PECHIAMMAL 34 F 24.16 1.02 120/80 126 188 6.6 175 120 25 126 10.6 10 1.3 60%
33 VIJAYA 46 F 24.5 0.9 100/70 164 268 8.2 180 146 42 100 11 9 1.3 58%
34 MEENAKSHI 38 F 24 0.86 136/84 204 320 9.5 192 150 46 116 9.8 7.1 1.1 68%
35 JOSEPH 38 M 24.16 0.79 120/80 146 248 7.7 160 120 50 82 9.6 9.2 1.4 64%
36 MUTHU 44 F 28.12 0.97 122/78 168 310 8.9 320 466 32 212 10.6 8.8 0.78 63%
37 THIRUMALAI 38 M 24 0.78 100/80 160 210 7.4 160 110 50 88 11 9.6 1.4 59%
38 VEDHACHALAM 48 M 30.24 0.98 136/78 230 360 10.4 200 150 40 110 12.6 9.8 0.82 69%
39 RAJAMANICKAM 43 M 20.77 1.06 100/68 128 189 6.6 224 168 55 136 11.4 8.1 1.4 65%
40 RAJANGAM 50 F 16.36 0.72 128/72 210 340 9.9 190 150 46 120 13 9.1 1.2 59%
41 MEENAMBAL 45 F 29.12 0.86 110/70 116 188 6.5 190 155 35 125 11.8 8.3 1.3 59%
42 RAJALAKSHMI 58 F 30.54 1.04 124/78 208 320 8.2 250 210 34 206 11.8 11 0.72 65%
43 SAVARIMUTHU 55 M 31.58 1.02 110/70 166 288 8.5 160 110 50 88 8.8 8.6 1.2 59%
44 VARALAXMI 40 F 22.35 0.72 134/80 188 310 9.1 190 160 40 128 11 9.5 1.1 60%
45 VASANTHA 45 F 26.26 0.81 110/70 126 244 7.4 175 120 46 90 10.2 7.9 1.2 68%
46 SHANMUGAM 44 M 22.41 0.86 124/78 166 310 8.9 194 138 44 110 9.6 8.3 1.3 62%
47 MUNIYANDI 51 M 21.93 1.24 100/70 210 298 9.2 224 322 30 152 11 8.1 1.2 59%
48 ALAMELU 45 F 33.29 1.1 110/82 152 290 8.4 192 210 32 118 11 12 0.76 60%
49 VALLI 45 F 24.56 0.86 136/78 155 208 7.4 256 336 36 148 8.5 7.4 1.4 64%
50 JAMES 45 M 20.8 0.78 120/80 126 188 6.7 170 120 46 100 8.8 9.6 1.3 60%

CONTROL GROUP
S.N NAME FBS PPBS BMI WHR BP TC TGL HDL LDL IVS LVPW E/A EF
1 SUMATHY 40/F 88 128 21.02 0.72 120/70 188 121 50 75.6 7.6 9.5 1.3 64%
2 LAKSHMI 46/F 100 127 24 0.85 130/82 154 100 48 68 8.2 9.7 1.2 59%
3 THAYANIDHI 50/M 96 121 23.12 0.79 140/88 190 176 51 104 8.6 7.1 1.1 55%
4 RAJAMANI 45/M 117 129 32 0.82 132/86 164 110 56 86 8.2 9.2 1.2 58%
5 PANDIAN 43/M 82 107 24.21 0.93 126/76 222 194 34 149 9.5 8.8 1.2 56%
6 KANDASAMY 51/M 110 126 20.14 0.81 110/70 180 156 55 93.8 9.7 9.6 1.4 60%
7 ANNAMANI 43/F 103 121 18.26 0.9 130/80 185 189 40 138 8.9 9.8 1.3 58%
8 DEVAKI 40/F 112 127 24 0.72 120/80 140 118 60 56 9.2 8.1 1.3 65%
9 KRISHNAN 42/M 88 112 23.44 0.86 134/86 136 96 62 54 7.8 9.1 1.4 62%
10 RAMADEVI 54/F 82 118 31.5 1.01 140/80 271 200 36 110 11 9.8 0.74 64%
11 MALLIGA 45/F 97 127 25.63 0.82 126/78 210 188 38 134 9.9 11 1.2 59%
12 PARAMESWARI 38/F 90 126 23.3 0.82 110/70 158 116 60 78 11.2 8.6 1.3 64%
13 VASUDEVAN 37/M 78 118 28.04 1.27 100/70 164 125 55 84 9.8 9.5 1.4 58%
14 KANNAPPAN 68/M 98 134 23.87 0.79 140/86 240 190 32 130 10.8 12 0.82 56%
15 UMAIYAL 62/F 115 136 18.74 0.76 134/78 130 120 56 68 7.8 8.3 1.3 64%
16 SATHYA 47/F 99 113 24.12 0.83 120/80 202 180 44 153 7.4 8.1 1.2 60%
17 SELVAMUTHU 44/M 108 127 20 0.78 124/82 175 160 54 89 8.9 8.5 1.3 62%
18 MEERABAI 55/F 115 126 24 0.79 110/70 128 100 55 52 9.2 7.4 1.3 64%
19 CHANDRAN 48/M 113 129 25.33 0.84 120/80 120 103 58 41 8.4 8.6 1.2 68%
20 POOVATHAA 52/F 107 127 24.5 0.9 140/90 146 130 50 70 11 8.2 0.8 61%
21 KAMALABAI 42/F 84 108 19.9 0.83 110/70 150 121 50 76 8.2 9.5 1.4 58%
22 ANJALAI 50/F 100 128 24.8 0.86 130/80 102 90 48 36 11 9.7 1.3 59%
23 ARUMUGAM 56/M 96 121 16.5 0.77 120/76 190 176 51 103 10 8.9 1.2 68%
24 KADHAR 49/M 82 107 20 0.78 132/76 222 195 34 149 9 9.2 1.3 61%
25 CHEZHIYAN 34/M 117 129 21 0.77 120/80 164 109 56 86 7.1 7.8 1.2 63%

CONTROL GROUP
S.N NAME FBS PPBS BMI WHR BP TC TGL HDL LDL IVS LVPW E/A EF
26 IRRUSAPPAN 70/M 70 118 17.14 0.93 130/80 196 138 38 100 9.2 11 1.3 60%
27 SURYA DEVI 54/F 115 136 21.05 0.7 124/78 210 168 40 120 8.8 9.9 1.3 64%
28 SHANMUGAVEL 62/M 99 113 18.73 0.76 140/86 190 134 46 100 9.6 11.2 0.75 59%
29 MANSRANI 40/F 108 127 20.77 0.76 134/78 210 148 43 110 9.8 9.8 1.3 65%
30 RAMASAMY 53/M 115 126 20 0.84 120/80 200 132 40 100 8.1 8.5 1.1 58%
31 RAJENDRAN 53/M 113 129 24.16 0.91 124/82 198 136 42 90 9.1 8.9 1.4 62%
32 PADMA 39/F 107 127 17.34 0.84 110/70 190 118 38 130 8.3 9.2 1.2 60%
33 YOGALAKSHMI 37/F 92 128 16.5 0.77 120/80 184 140 44 112 11 8.4 1.2 58%
34 SELVI 38/F 100 166 20.12 0.92 140/90 196 152 42 120 8.6 11 1.1 63%
35 MARIAMMAL 40/F 102 134 21.05 0.8 110/70 188 138 46 90 9.5 8.2 1.4 62%
36 DEVIKA 61/F 86 127 24.12 0.88 120/70 230 188 36 140 9.8 11 0.94 64%
37 MARIYAAL 34/F 98 133 23 0.76 130/82 190 144 42 110 8.3 10 1.2 59%
38 ABIRAMI 50/F 105 150 17.72 0.88 140/88 128 105 48 98 8.1 9 1.2 64%
39 CHAKKUBAI 50/F 78 108 22 0.85 132/86 188 143 56 100 8.5 7.1 1.1 58%
40 NATARAJAN 38/M 110 154 20.12 0.78 126/76 175 100 40 88 7.4 9.2 1.4 56%
41 LATHA 43/F 94 100 20.5 0.86 110/70 134 98 56 54 9.6 8.8 1.2 64%
42 ARUMUGAM 50/M 82 118 18 0.89 130/80 164 110 45 78 8.7 9.6 1.3 61%
43 VALLIAMMAL 46/F 97 127 24.21 0.8 120/80 220 188 34 130 9.8 9.8 1.3 62%
44 SUKUMAR 39/M 90 126 26 0.97 134/86 196 156 32 140 10.8 8.1 1.4 62%
45 RAJANGAM 40/F 78 118 19.12 0.86 140/80 180 134 42 100 7.2 7.6 1.2 61%
46 MEENAMBAL 42/F 98 134 21 0.7 126/78 188 121 50 75.6 9.6 8.2 1.3 60%
47 RAJALAKSHMI 40/F 115 136 23.23 0.79 110/70 154 100 48 68 8.1 8.6 1.3 64%
48 SAVARIMUTHU 55/M 99 113 21.18 0.85 122/86 190 176 51 104 9.8 8.2 1.4 67%
49 VARALAXMI 40/F 78 118 17.12 0.82 130/70 164 110 56 86 11 9.5 1.2 62%
50 VASANTHA 45/F 98 128 25 0.92 110/70 222 194 34 149 8.2 9.7 1.3 59%