Embed Size (px)
Citation preview
FVCC:BioTech;Morrison 7/18/2014 Page 1
ECG/ EKG
Electro Cardio-Gram
SOP and Sample Lab
Prepared by: Bob Morrison
FVCC, Instrumentation Specialist
Aug 09
Bionet America
CardioCare 2000
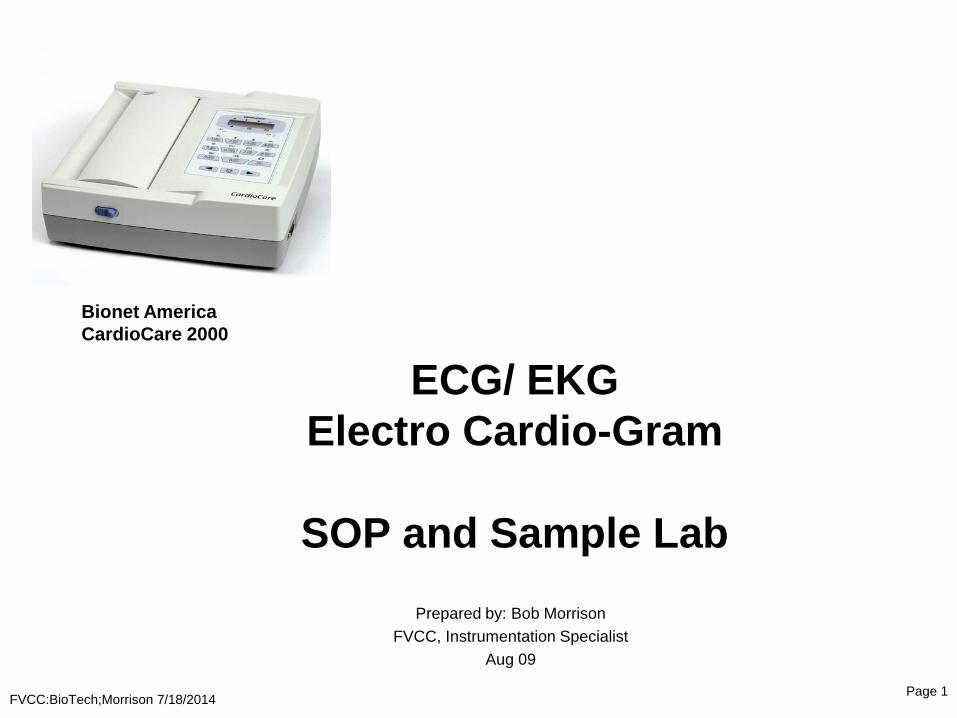
ECG; CardioCare 2000 Equipment Controls
FVCC:BioTech;Morrison 7/18/2014 Page 2
Power Switch, LAN and
Serial Connectors on rear
LCD (control display)
Function Control Pad
Printer Door Release
Printer Door
Patient Cable
Connection Port
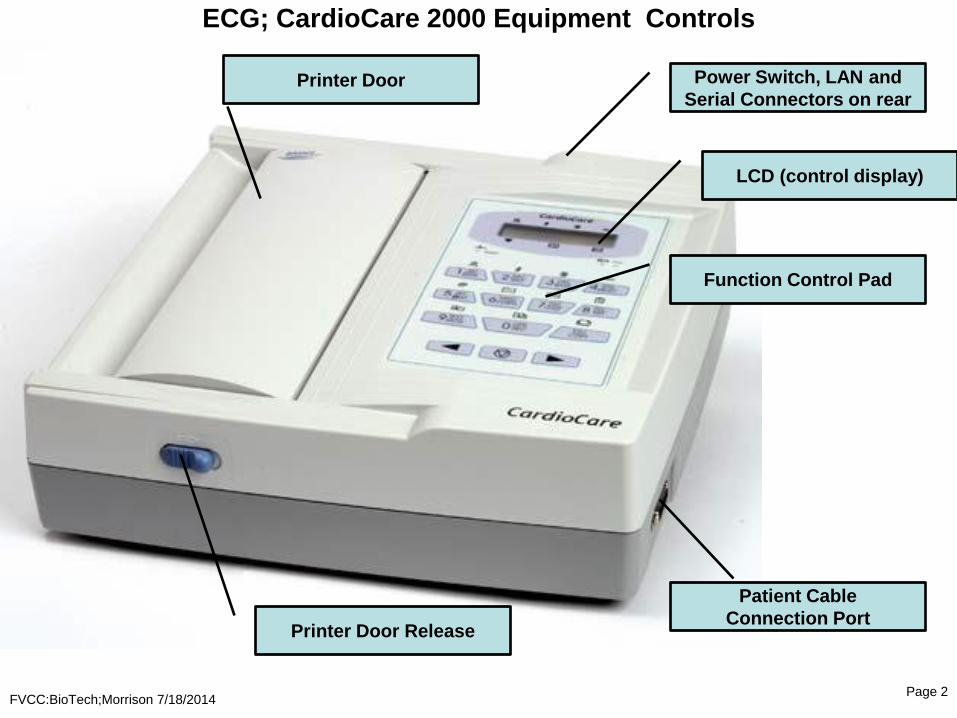
ECG: CardioCare2000 Control Panel
FVCC:BioTech;Morrison 7/18/2014 Page 3
Signal Level , 5, 10, 20, or aut
Print speed; 12.5, 25, or 50
Activate filer on baseline drift
Activate/eliminate EMG
CH:Channel form; 3ch+1rhy,
RHY; rhythym channel
Menu for Patient Info;
Monitor Mode: continuous printing
Records 10s, then prints report
Prints, then allows exit from Setup Menu COMMAND key,
activates MENU
mode for setting
Patient info, filters,
printing, other SYS
settings.

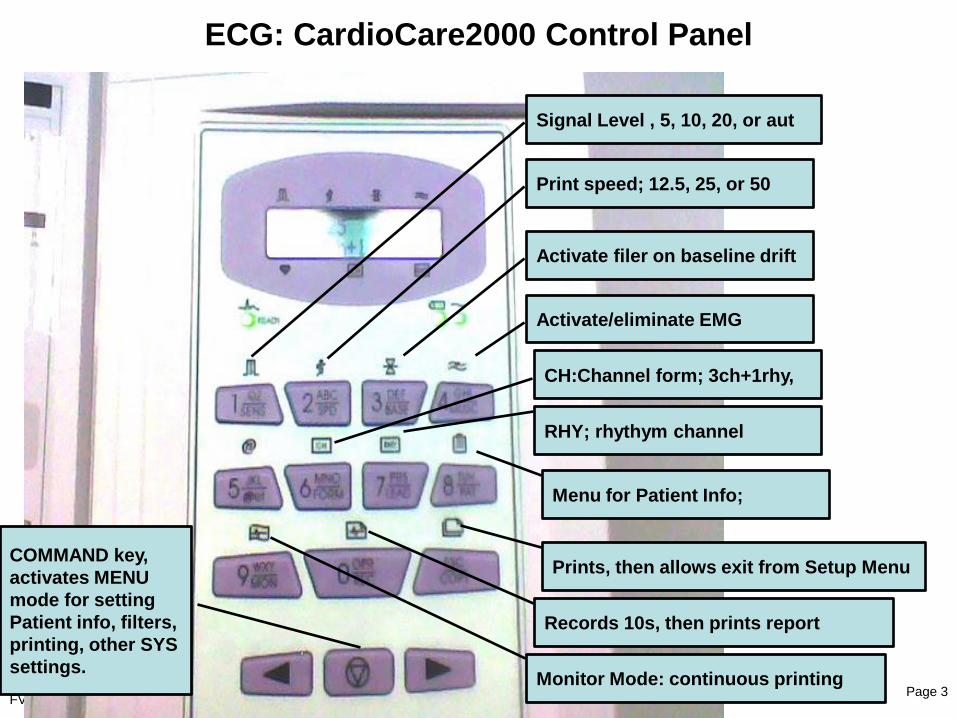
ECG: LCD Panel Display, Typical Startup Display
FVCC:BioTech;Morrison 7/18/2014 Page 4
1 0 1 2 . 5 O F F O F
F
1 0 0 6 C H + 1 R H Y a V R
ECG signal level; 5, 10,
20, or Aut (autogain)
Printing Speed
12.5, 25, or 50
Base Line Filter
status (on/off)
EMG Filter
status (on/off)
Heart Rate Channel Form
for output:
3ch+1rhy
6ch+1rhy
12ch rhy
60x 1rhy
Rhythm Channel
Setting of:
I, II, III, aVR,
aVL, aVF, V1, V2,
V3, V4, V5, V6

ECU: Menu Structure, Preparation Mode
• Preparation Mode: Initial condition when system starts up and LCD displays
heart rate and system settings
– 1; SENS, signal level, (10mm/mV initial setting)
– 2; SPD, Display Speed, (25mm/s initial setting)
– 3; BASE, Base line filter, (on is initial setting)
– 4; MUSC, EMG filter, (on is initial setting)
– 6; FORM, Channel form , (6ch+1rhy initial setting)
– 7; LEAD, Rhythm lead (II is initial setting
– 8; PAT, Patient Info
– 9; MON; Monitor Mode
– 0; REC ; Record mode
FVCC:BioTech;Morrison 7/18/2014 Page 5

ECG: Laboratory Experiment Example ( J. Fickas, A&PII)
FVCC:BioTech;Morrison 7/18/2014 Page 6
1. Make sure the EGC unit is plugged in and turned on and wait for a standard
menu to display as shown on slide page 4.
2. Press button 7 (LEAD) until the screen displays “Lead II”
3. Press button 6 (FORM) until the screen displays “3ch + 1Rhy”
4. Place sticky tabs (attach pads) on each limb at/near the locations shown
on the diagram and then attach limb leads.
- Limb leads are marked (RA – right arm etc. )
5. While sitting very still, press the 0 (RECORD) button to begin the reading
session. The reading is done and then processed before it prints.
6. Calculate your HR from the reading printout using the information and table in
your lab instructions (worksheet on next slide).
RA LA
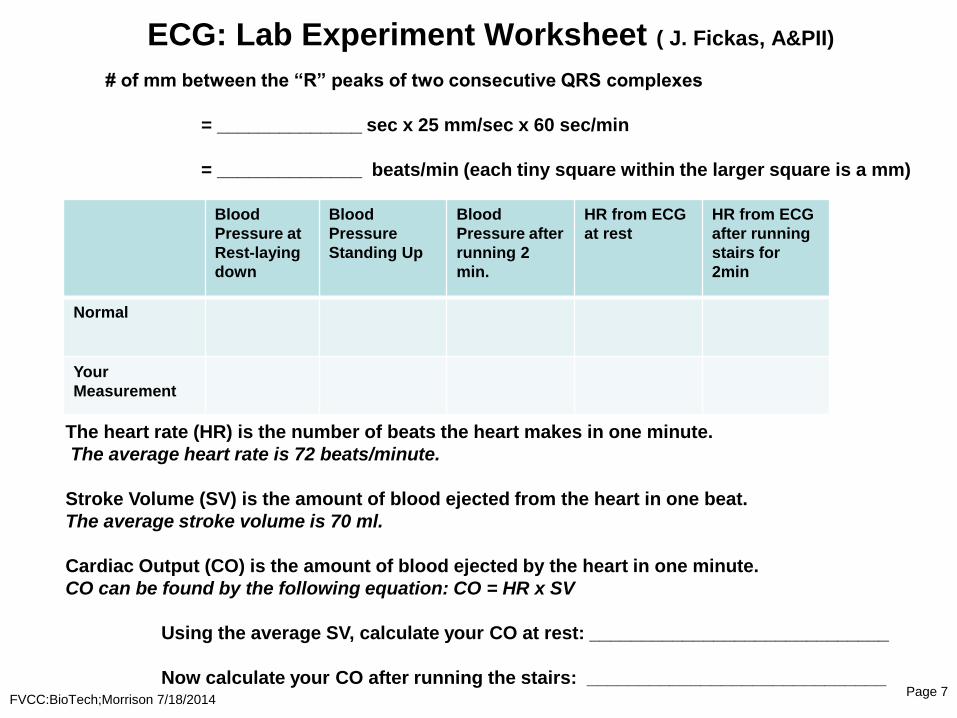
ECG: Lab Experiment Worksheet ( J. Fickas, A&PII)
FVCC:BioTech;Morrison 7/18/2014 Page 7
Blood
Pressure at
Rest-laying
down
Blood
Pressure
Standing Up
Blood
Pressure after
running 2
min.
HR from ECG
at rest
HR from ECG
after running
stairs for
2min
Normal
Your
Measurement
# of mm between the “R” peaks of two consecutive QRS complexes
= ______________ sec x 25 mm/sec x 60 sec/min
= ______________ beats/min (each tiny square within the larger square is a mm)
The heart rate (HR) is the number of beats the heart makes in one minute.
The average heart rate is 72 beats/minute.
Stroke Volume (SV) is the amount of blood ejected from the heart in one beat.
The average stroke volume is 70 ml.
Cardiac Output (CO) is the amount of blood ejected by the heart in one minute.
CO can be found by the following equation: CO = HR x SV
Using the average SV, calculate your CO at rest: _____________________________
Now calculate your CO after running the stairs: _____________________________
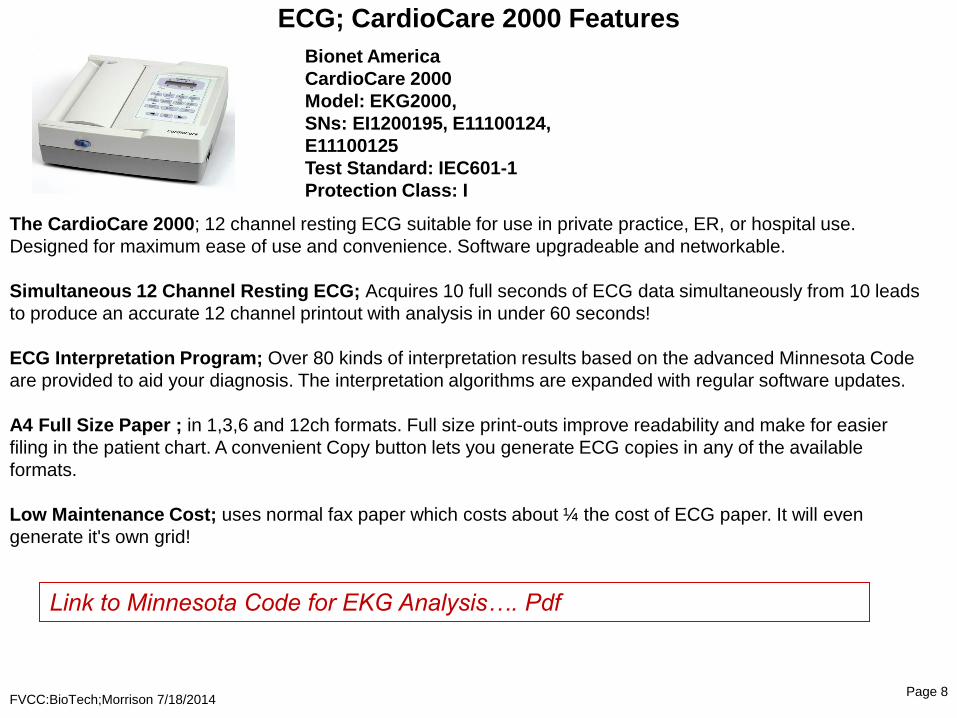
ECG; CardioCare 2000 Features
FVCC:BioTech;Morrison 7/18/2014 Page 8
The CardioCare 2000; 12 channel resting ECG suitable for use in private practice, ER, or hospital use.
Designed for maximum ease of use and convenience. Software upgradeable and networkable.
Simultaneous 12 Channel Resting ECG; Acquires 10 full seconds of ECG data simultaneously from 10 leads
to produce an accurate 12 channel printout with analysis in under 60 seconds!
ECG Interpretation Program; Over 80 kinds of interpretation results based on the advanced Minnesota Code
are provided to aid your diagnosis. The interpretation algorithms are expanded with regular software updates.
A4 Full Size Paper ; in 1,3,6 and 12ch formats. Full size print-outs improve readability and make for easier
filing in the patient chart. A convenient Copy button lets you generate ECG copies in any of the available
formats.
Low Maintenance Cost; uses normal fax paper which costs about ¼ the cost of ECG paper. It will even
generate it's own grid!
Bionet America
CardioCare 2000
Model: EKG2000,
SNs: EI1200195, E11100124,
E11100125
Test Standard: IEC601-1
Protection Class: I
Link to Minnesota Code for EKG Analysis…. Pdf
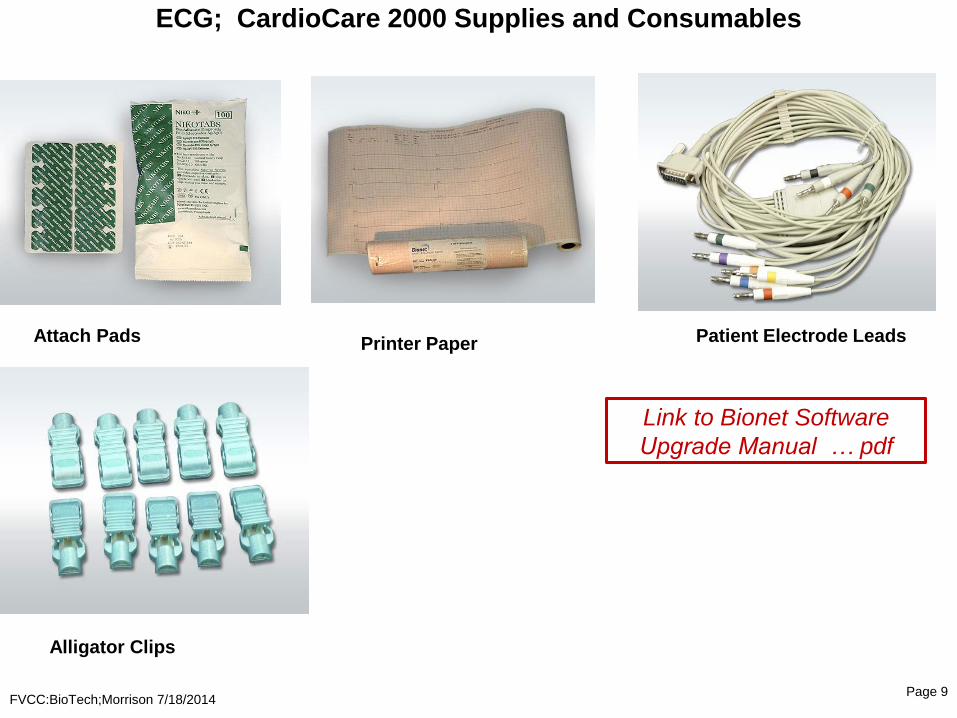
ECG; CardioCare 2000 Supplies and Consumables
FVCC:BioTech;Morrison 7/18/2014 Page 9
Link to Bionet Software
Upgrade Manual … pdf
Attach Pads Printer Paper Patient Electrode Leads
Alligator Clips

ECG: CardioCare 2000 Specifications
FVCC:BioTech;Morrison 7/18/2014 Page 10

ECG: CardioCare 2000 Specifications (cont)
FVCC:BioTech;Morrison 7/18/2014 Page 11

ECG: Background Info; Typical Leads Placement
FVCC:BioTech;Morrison 7/18/2014 Page 12
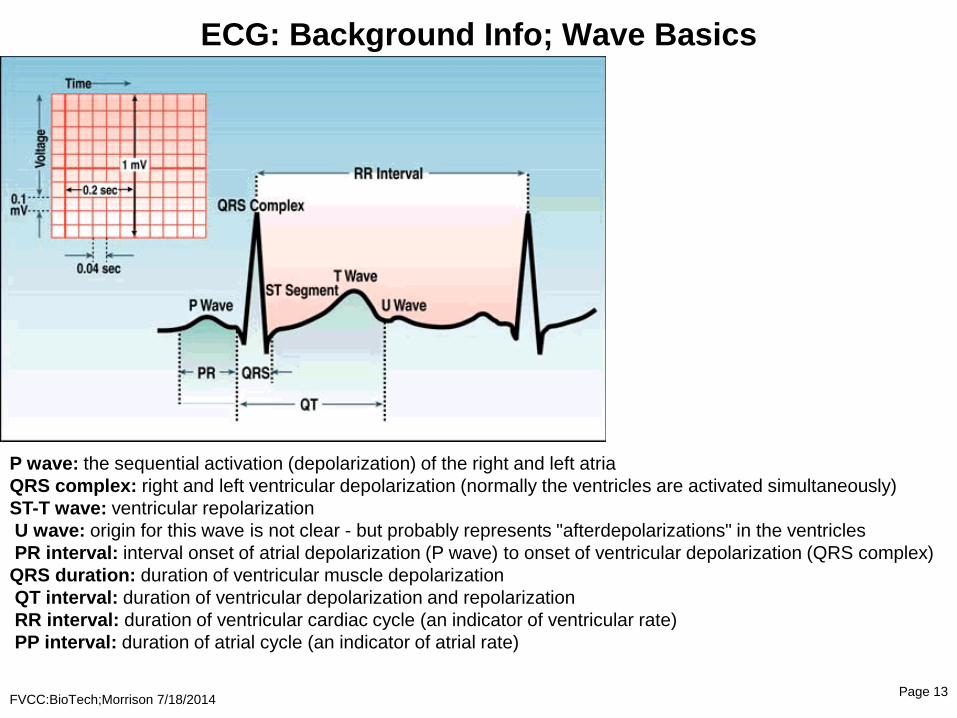
ECG: Background Info; Wave Basics
FVCC:BioTech;Morrison 7/18/2014 Page 13
P wave: the sequential activation (depolarization) of the right and left atria
QRS complex: right and left ventricular depolarization (normally the ventricles are activated simultaneously)
ST-T wave: ventricular repolarization
U wave: origin for this wave is not clear - but probably represents "afterdepolarizations" in the ventricles
PR interval: interval onset of atrial depolarization (P wave) to onset of ventricular depolarization (QRS complex)
QRS duration: duration of ventricular muscle depolarization
QT interval: duration of ventricular depolarization and repolarization
RR interval: duration of ventricular cardiac cycle (an indicator of ventricular rate)
PP interval: duration of atrial cycle (an indicator of atrial rate)