Embed Size (px)
Citation preview
ECETOC
Joint Assessment ofCommodity Chemicals No. 39
Tetrachloroethylene
CAS No. 127-18-4
European Centre for Ecotoxicology Avenue E Nieuwenhuyse 4 (Bte 6)and Toxicology of Chemicals B - 1160 Brussels, Belgium


Joint Assessment ofCommodity Chemicals No. 39
Tetrachloroethylene
CAS No. 127-18-4
ISSN - 0773 - 6339 - 39
Brussels, December 1999© ECETOC copyright 1999

ECETOC JACC Report No. 39
© Copyright - ECETOC (European Centre for Ecotoxicology and Toxicology of Chemicals),
Avenue E Van Nieuwenhuyse 4 (Bte 6), 1160 - Brussels, Belgium.
All rights reserved. No part of this publication may be reproduced, copied, stored in a retrieval system or
transmitted in any form or by any means, electronic, mechanical, photocopying, recording or otherwise
without the prior written permission of the copyright holder. Applications to reproduce, store, copy or
translate should be made to the Secretary General. ECETOC welcomes such applications. Reference
to the document, its title and summary may be copied or abstracted in data retrieval systems without
subsequent reference.
The content of this document has been prepared and reviewed by experts on behalf of ECETOC with all
possible care and from the available scientific information. It is provided for information only. ECETOC
cannot accept any responsibility or liability and does not provide a warranty for any use or interpretation of
the material contained in this publication.
THE ECETOC SCHEME FOR THE JOINT ASSESSMENT OF
COMMODITY CHEMICALS
This report has been produced as part of the ECETOC programme for preparing critical reviews of the
toxicology and ecotoxicology of selected existing industrial chemicals.
In the programme, commodity chemicals, that is those produced in large tonnage by several
companies and having widespread and multiple uses, are jointly reviewed by experts from a number of
companies with knowledge of the chemical. It should be noted that in a JACC review only the
chemical itself is considered; products in which it appears as an impurity are not normally taken into
account.
ECETOC is not alone in producing such reviews. There are a number of organisations that have
produced, and are continuing to prepare, reviews with the aim of ensuring that toxicological knowledge
and other information are evaluated. Thus a producer, government official or consumer can be
informed on the up-to-date position with regard to safety information and standards. Within ECETOC
we do not aim to duplicate the activities of others. When it is considered that a review is needed every
effort is made to discover whether an adequate review exists already; if this is the case the review is
checked, its conclusions summarised and the literature published subsequent to the review assessed.
To assist ourselves and others working in this field we have published a summary of international
activities incorporating work planned, in hand, or completed on the review of safety data for commodity
chemicals. Interested readers should refer to Technical Report No. 71 entitled "Inventory of Critical
Reviews on Chemicals", jointly published by ECETOC and UNEP Chemicals.
This document presents a critical evaluation of the toxicology and ecotoxicology of tetrachloroethylene
(CAS No. 127-18-4).

Tetrachloroethylene
CAS No. 127-18-4
CONTENTS
1. SUMMARY AND CONCLUSIONS.....................................................................................................1
1.1 ENVIRONMENTAL DISTRIBUTION......................................................................................1
1.2 ENVIRONMENTAL LEVELS..................................................................................................1
1.3 ENVIRONMENTAL EFFECTS...............................................................................................2
1.4 MAMMALIAN KINETICS AND METABOLISM.......................................................................2
1.5 MAMMALIAN TOXICITY........................................................................................................3
1.6 CANCER EPIDEMIOLOGY....................................................................................................5
2. IDENTITY, PHYSICAL AND CHEMICAL PROPERTIES, ANALYTICAL METHODS ......................7
2.1 IDENTITY...............................................................................................................................7
2.2 PHYSICAL AND CHEMICAL PROPERTIES .........................................................................8
2.2.1 Impurities ..............................................................................................................10
2.3 CONVERSION FACTORS...................................................................................................10
2.4 ANALYTICAL METHODS ....................................................................................................10
2.4.1 Determination in Air ..............................................................................................11
2.4.2 Determination in Water.........................................................................................12
2.4.3 Determination in Soils, Sediments and Wastes ...................................................12
2.4.4 Determination in Food and Tissues......................................................................13
3. PRODUCTION, STORAGE, TRANSPORT AND USE ....................................................................14
3.1 PRODUCTION .....................................................................................................................14
3.1.1 Stabilisers .............................................................................................................15
3.2 STORAGE AND HANDLING................................................................................................15
3.3 USE ......................................................................................................................................15
4. ENVIRONMENTAL DISTRIBUTION AND TRANSFORMATION....................................................18
4.1 ENVIRONMENTAL DISTRIBUTION....................................................................................18
4.1.1 Emissions during Production, Storage and Handling ...........................................18
4.1.2 Emissions during Use...........................................................................................19
4.2 BIOTRANSFORMATION AND ENVIRONMENTAL FATE ..................................................19
4.2.1 Atmospheric Fate .................................................................................................19
4.2.2 Aquatic Fate .........................................................................................................21

4.2.3 Fate in Soils and Sediments.................................................................................22
4.2.4 Biodegradation .....................................................................................................23
4.2.5 Bioaccumulation ...................................................................................................28
4.2.6 Evaluation.............................................................................................................28
5. ENVIRONMENTAL LEVELS AND HUMAN EXPOSURE ...............................................................30
5.1 ENVIRONMENTAL LEVELS................................................................................................30
5.1.1 Atmosphere ..........................................................................................................30
5.1.2 Surface Water ......................................................................................................35
5.1.3 Soil and Sediment ................................................................................................38
5.1.4 Aquatic Organisms ...............................................................................................39
5.1.5 Plants....................................................................................................................40
5.2 HUMAN NON-OCCUPATIONAL EXPOSURE ....................................................................40
5.2.1 Indoor Air ..............................................................................................................40
5.2.2 Drinking Water......................................................................................................42
5.2.3 Foodstuffs.............................................................................................................44
5.2.4 Total Exposure .....................................................................................................47
5.2.5 Environmental and Public Health Standards ........................................................48
5.3 OCCUPATIONAL EXPOSURE............................................................................................49
5.3.1 Production and Intermediate Use.........................................................................49
5.3.2 Dry-Cleaning.........................................................................................................50
5.3.3 Metal Degreasing .................................................................................................53
5.3.4 Occupational Exposure Limits..............................................................................53
5.3.5 Biological Monitoring.............................................................................................55
5.4 SUMMARY OF EXPOSURE DATA .....................................................................................58
6. EFFECTS ON ORGANISMS IN THE ENVIRONMENT ...................................................................59
6.1 MICRO-ORGANISMS ..........................................................................................................59
6.2 AQUATIC ORGANISMS ......................................................................................................59
6.2.1 Acute Toxicity .......................................................................................................59
6.2.2 Chronic Toxicity ....................................................................................................65
6.2.3 Ecosystems ..........................................................................................................69
6.2.4 Sewage Treatment Plants ....................................................................................69
6.3 TERRESTRIAL ORGANISMS..............................................................................................69
6.3.1 Invertebrates.........................................................................................................69
6.3.2 Plants....................................................................................................................70
6.4 SUMMARY ...........................................................................................................................71
7. KINETICS AND METABOLISM.......................................................................................................73
7.1 IN HUMANS .........................................................................................................................73
7.1.1 Oral.......................................................................................................................73
7.1.2 Dermal ..................................................................................................................73
7.1.3 Inhalation ..............................................................................................................73
7.2 IN EXPERIMENTAL ANIMALS ............................................................................................75
7.2.1 Dermal ..................................................................................................................75
7.2.2 Inhalation ..............................................................................................................75
7.3 KINETIC MODELS ...............................................................................................................77
7.4 EVALUATION.......................................................................................................................78
8. EFFECTS ON EXPERIMENTAL ANIMALS AND IN VITRO TEST SYSTEMS ..............................80
8.1 ACUTE TOXICITY................................................................................................................80
8.1.1 Oral.......................................................................................................................80
8.1.2 Dermal ..................................................................................................................81
8.1.3 Inhalation ..............................................................................................................81
8.1.4 Intraperitoneal.......................................................................................................83
8.1.5 Intravenous...........................................................................................................83
8.1.6 Summary ..............................................................................................................84
8.2 IRRITATION, SENSITISATION AND IMMUNOTOXICITY..................................................84
8.2.1 Skin Irritation.........................................................................................................84
8.2.2 Respiratory Irritation .............................................................................................84
8.2.3 Eye Irritation..........................................................................................................85
8.2.4 Sensitisation .........................................................................................................85
8.2.5 Effects on the Immune Function...........................................................................85
8.2.6 Evaluation.............................................................................................................85
8.3 SUBCHRONIC TOXICITY....................................................................................................86
8.3.1 Oral.......................................................................................................................86
8.3.2 Dermal ..................................................................................................................89
8.3.3 Inhalation ..............................................................................................................89
8.3.4 Intraperitoneal.......................................................................................................96
8.3.5 Summary ..............................................................................................................96
8.4 MUTAGENICITY ..................................................................................................................99
8.4.1 In Vitro ..................................................................................................................99
8.4.2 In Vivo...................................................................................................................99
8.5 CHRONIC TOXICITY.........................................................................................................100
8.5.1 Oral.....................................................................................................................100
8.5.2 Inhalation ............................................................................................................101
8.5.3 Evaluation...........................................................................................................101
8.6 CARCINOGENICITY..........................................................................................................102

8.6.1 Oral.....................................................................................................................102
8.6.2 Dermal ................................................................................................................103
8.6.3 Inhalation ............................................................................................................103
8.6.4 Intraperitoneal Studies........................................................................................103
8.6.5 Tumour Promotion..............................................................................................104
8.6.6 Evaluation...........................................................................................................105
8.7 MECHANISMS OF TUMOUR FORMATION .....................................................................105
8.8 REPRODUCTIVE TOXICITY, EMBRYOTOXICITY AND TERATOGENICITY .................106
8.8.1 Reproductive Toxicity .........................................................................................106
8.8.2 Developmental Toxicity ......................................................................................109
8.8.3 Summary ............................................................................................................113
8.9 NEUROBEHAVIOURAL EFFECTS AND NEUROTOXICITY.............................................113
8.9.1 Summary ............................................................................................................117
9. EFFECTS ON HUMANS ................................................................................................................118
9.1 ACUTE TOXICITY..............................................................................................................118
9.1.1 Oral.....................................................................................................................118
9.1.2 Dermal ................................................................................................................118
9.1.3 Inhalation ............................................................................................................118
9.1.4 Summary ............................................................................................................120
9.2 HUMAN SKIN, RESPIRATORY AND EYE IRRITATION AND SENSITISATION..............120
9.2.1 Skin Irritation.......................................................................................................120
9.2.2 Respiratory Irritation ...........................................................................................121
9.2.3 Eye Irritation........................................................................................................121
9.2.4 Skin Sensitisation ...............................................................................................121
9.2.5 Respiratory System Sensitisation.......................................................................121
9.2.6 Summary and Evaluation ...................................................................................121
9.3 EFFECTS ON THE CENTRAL NERVOUS SYSTEM........................................................122
9.3.1 Volunteer Studies ...............................................................................................122
9.3.2 Occupational Studies..........................................................................................125
9.3.3 Non-Occupational Studies..................................................................................133
9.4 MUTAGENICITY ................................................................................................................134
9.5 CARCINOGENICITY..........................................................................................................134
9.5.1 Epidemiology ......................................................................................................134
9.5.2 Summary ............................................................................................................140
9.5.3 Evaluation...........................................................................................................142
9.6 REPRODUCTIVE TOXICITY .............................................................................................146
9.6.1 Fertility ................................................................................................................146
9.6.2 Pregnancy...........................................................................................................150
9.6.3 Birth Defects .......................................................................................................158
9.6.4 Evaluation...........................................................................................................159
9.7 OTHER CHRONIC TOXIC EFFECTS ...............................................................................160
9.7.1 Morbidity .............................................................................................................160
9.7.2 Mortality ..............................................................................................................164
9.7.3 Evaluation...........................................................................................................165
10. HAZARD ASSESSMENT .............................................................................................................166
10.1 ASSESSMENT OF HAZARD TO HUMAN HEALTH ........................................................166
10.1.1 Acute Health Effects .........................................................................................166
10.1.2 Irritation Effects.................................................................................................166
10.1.3 Chronic Toxicity ................................................................................................166
10.1.4 Reproductive Toxicity .......................................................................................167
10.1.5 Genotoxicity......................................................................................................167
10.1.6 Carcinogenicity .................................................................................................167
10.2 ASSESSMENT OF HAZARD TO ORGANISMS IN THE ENVIRONMENT .....................168
10.2.1 Aquatic Compartment.......................................................................................168
10.2.2 Terrestrial Compartment ..................................................................................169
10.2.3 Secondary Poisoning (“Non-Compartment Specific Exposure Relevant to the
Food Chain”)....................................................................................................169
10.3 SUMMARY OF HAZARD DATA TO BE USED FOR RISK ASSESSMENT ....................169
10.3.1 Health Effects ...................................................................................................169
10.3.2 Environmental Effects ......................................................................................169
11. FIRST AID, MEDICAL TREATMENT AND SAFE HANDLING ADVICE.....................................171
11.1 FIRST AID ........................................................................................................................171
11.2 SPECIAL FEATURES FOR MEDICAL TREATMENT .....................................................171
11.3 SAFE HANDLING ............................................................................................................172
11.3.1 Storage .............................................................................................................172
11.3.2 Handling Precautions and Personal Protection ................................................172
11.3.3 Health Surveillance and Biological Monitoring..................................................173
11.4 MANAGEMENT OF SPILLAGE AND WASTE.................................................................173
11.4.1 Spillage.............................................................................................................173
11.4.2 Waste ...............................................................................................................173
APPENDIX A. ATMOSPHERIC FATE OF TETRACHLOROETHYLENE.........................................175
A.1 CHEMICAL AND PHYSICAL REMOVAL PROCESSES ...................................................175
A.1.1 Reaction with the Hydroxyl Radical....................................................................175
A.1.2 Reaction with the Chlorine Atom........................................................................175
A.1.3 Other Processes ................................................................................................177
A.2 OVERALL LIFETIME, BUDGET CALCULATIONS, LONG-RANGE TRANSPORT..........178
A.3 DEGRADATION MECHANISM AND NATURE OF PRODUCTS FORMED .....................179
A.3.1 Simulated Atmospheric Studies .........................................................................179
A.3.2 Reaction Mechanisms........................................................................................180
A.3.3 Formation of Carbon Tetrachloride and Chloroform ..........................................183
A.4 EFFECT ON STRATOSPHERIC OZONE DEPLETION....................................................185
A.5 EFFECT ON TROPOSPHERIC OZONE FORMATION (PHOTOCHEMICAL SMOG) .....187
A.6 OTHER EFFECTS OF REACTION PRODUCTS..............................................................188
A.6.1 Chloride..............................................................................................................188
A.6.2 Acidity.................................................................................................................188
A.6.3 Phosgene ...........................................................................................................189
A.6.4 Trichloroacetic Acid............................................................................................189
APPENDIX B. AQUATIC FATE OF TETRACHLOROETHYLENE (ABIOTIC PROCESSES)..........192
B.1. VOLATILISATION.............................................................................................................192
B.1.1 Laboratory Studies .............................................................................................192
B.1.2 Large-Scale Experiments and Observations .....................................................193
B.1.3 Field Observations .............................................................................................194
B.2. CHEMICAL REACTION....................................................................................................194
B.3. SORPTION .......................................................................................................................196
B.3.1 Laboratory Studies .............................................................................................196
B.3.2 Field Observations .............................................................................................198
APPENDIX C. MODELLING OF CANCER RISK - A CRITICAL EVALUATION ..............................199
APPENDIX D. REVIEW OF MUTAGENICITY TESTS ......................................................................203
D.1 GENE MUTATION.............................................................................................................203
D.1.1 Yeast Assays (Table D.2) ..................................................................................204
D.1.2 Drosophila Assay (Table D.2) ............................................................................204
D.1.3 Host-mediated Assays (Table D.3)....................................................................204
D.1.4 Mammalian System (Table D.4) ........................................................................205
D.2 CHROMOSOMAL EFFECTS ............................................................................................211
D.2.1 In Vitro Mammalian Systems (Tables D.5 and D.6)...........................................211
D.2.2 In Vivo Mammalian Systems (Table D.7) ..........................................................211
D.2.3 Non-Mammalian Systems (Tables D.8 and D.10) .............................................211
D.2.4 In Vivo Human Systems (Tables D.6 and D.9) ..................................................211
D.3 DNA DAMAGE...................................................................................................................215
D.3.1. Unscheduled DNA Synthesis (Tables D.11 to D.12) ........................................215

D.3.2 Single-Strand DNA Breaks (Table D.13) ...........................................................215
D.3.4 Evaluation ..........................................................................................................215
D.4 MISCELLANEOUS TEST SYSTEMS................................................................................219
D.4.1 Cell Transformation (Table D.16) ......................................................................219
D.4.2 Germ Cell Effects (Table D.17)..........................................................................219
D.5 METABOLITES OF PER ...................................................................................................221
D.5.1. Evaluation .........................................................................................................221
BIBLIOGRAPHY .................................................................................................................................223
MEMBERS OF THE TASK FORCE....................................................................................................272
MEMBERS OF THE SCIENTIFIC COMMITTEE................................................................................273

Tetrachloroethylene 1
1. SUMMARY AND CONCLUSIONS
Tetrachloroethylene (perchloroethylene, PER) is a volatile, non-flammable liquid. Its primary use is as
a solvent in the dry-cleaning of textiles, in metal degreasing and as a chemical intermediate. It is
produced and used in large quantities (several hundred kt/y) throughout the world. Due to the
increased use of control technology and recycling, the production of PER has declined in recent years
and will continue to do so in the future.
1.1 ENVIRONMENTAL DISTRIBUTION
Due to its high volatility and pattern of use, the majority of PER released to the environment is
distributed to the atmosphere with a minor proportion finding its way into water and soil. Natural
production of PER by marine algae may contribute a significant part of the total release to the
atmosphere.
The atmospheric half-life of PER is approximately 3 months. In the atmosphere, PER is believed to be
degraded mainly to carbon dioxide and hydrogen chloride, with trichloroacetic acid (TCA) as a minor
product. The contribution of PER to the TCA levels observed in precipitation is uncertain, but it may
be a significant part of the total. It is not transported in significant quantities to the stratosphere and
does not contribute appreciably to ozone depletion. It is too unreactive to be a “volatile organic carbon
compound (VOC)” and does not contribute to urban tropospheric ozone formation (“photochemical
smog”).
In surface waters, PER is removed mainly by volatilisation. Its evaporation half-life varies from a
few days to up to one month, depending on the prevailing conditions. When present in sediment or
soil, PER is fairly mobile and may leach, unchanged, into groundwater.
PER is not readily biodegradable using standard aerobic test procedures, but biodegradation has been
observed under methanogenic conditions. Its bioaccumulation is limited due to its high volatility and
depuration rate.
1.2 ENVIRONMENTAL LEVELS
PER has been detected at ppb levels in all environmental compartments, in aquatic organisms and in
plants. The background concentrations in air in remote regions is much lower (< 0.1 ppb;
< 0.69 mg/m3) than in urban or suburban air (up to 3 ppb; 21 mg/m3). PER has been found in indoor
air at concentrations up to 1 ppm (6.9 mg/m3), principally as a consequence of its use in dry-cleaning.
PER may also be present in drinking water and foodstuffs.
2 ECETOC Joint Assessment of Commodity Chemicals No. 39
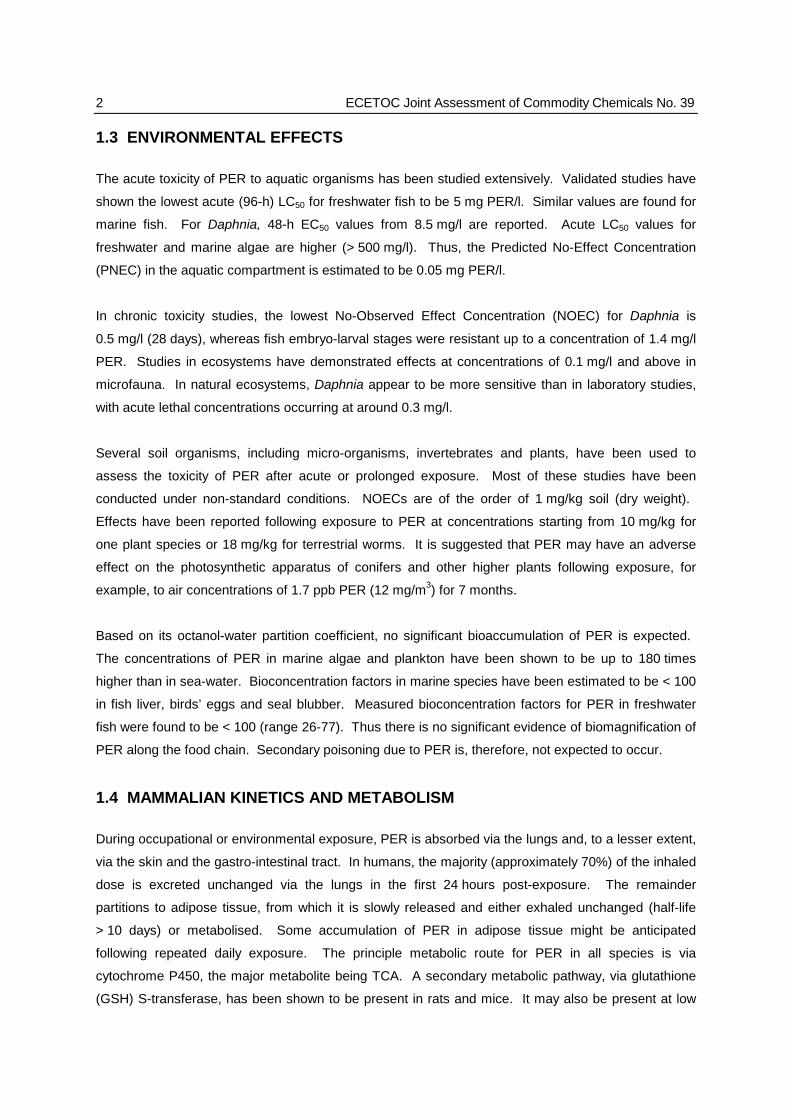
1.3 ENVIRONMENTAL EFFECTS
The acute toxicity of PER to aquatic organisms has been studied extensively. Validated studies have
shown the lowest acute (96-h) LC50 for freshwater fish to be 5 mg PER/l. Similar values are found for
marine fish. For Daphnia, 48-h EC50 values from 8.5 mg/l are reported. Acute LC50 values for
freshwater and marine algae are higher (> 500 mg/l). Thus, the Predicted No-Effect Concentration
(PNEC) in the aquatic compartment is estimated to be 0.05 mg PER/l.
In chronic toxicity studies, the lowest No-Observed Effect Concentration (NOEC) for Daphnia is
0.5 mg/l (28 days), whereas fish embryo-larval stages were resistant up to a concentration of 1.4 mg/l
PER. Studies in ecosystems have demonstrated effects at concentrations of 0.1 mg/l and above in
microfauna. In natural ecosystems, Daphnia appear to be more sensitive than in laboratory studies,
with acute lethal concentrations occurring at around 0.3 mg/l.
Several soil organisms, including micro-organisms, invertebrates and plants, have been used to
assess the toxicity of PER after acute or prolonged exposure. Most of these studies have been
conducted under non-standard conditions. NOECs are of the order of 1 mg/kg soil (dry weight).
Effects have been reported following exposure to PER at concentrations starting from 10 mg/kg for
one plant species or 18 mg/kg for terrestrial worms. It is suggested that PER may have an adverse
effect on the photosynthetic apparatus of conifers and other higher plants following exposure, for
example, to air concentrations of 1.7 ppb PER (12 mg/m3) for 7 months.
Based on its octanol-water partition coefficient, no significant bioaccumulation of PER is expected.
The concentrations of PER in marine algae and plankton have been shown to be up to 180 times
higher than in sea-water. Bioconcentration factors in marine species have been estimated to be < 100
in fish liver, birds’ eggs and seal blubber. Measured bioconcentration factors for PER in freshwater
fish were found to be < 100 (range 26-77). Thus there is no significant evidence of biomagnification of
PER along the food chain. Secondary poisoning due to PER is, therefore, not expected to occur.
1.4 MAMMALIAN KINETICS AND METABOLISM
During occupational or environmental exposure, PER is absorbed via the lungs and, to a lesser extent,
via the skin and the gastro-intestinal tract. In humans, the majority (approximately 70%) of the inhaled
dose is excreted unchanged via the lungs in the first 24 hours post-exposure. The remainder
partitions to adipose tissue, from which it is slowly released and either exhaled unchanged (half-life
> 10 days) or metabolised. Some accumulation of PER in adipose tissue might be anticipated
following repeated daily exposure. The principle metabolic route for PER in all species is via
cytochrome P450, the major metabolite being TCA. A secondary metabolic pathway, via glutathione
(GSH) S-transferase, has been shown to be present in rats and mice. It may also be present at low
Tetrachloroethylene 3
levels in humans; low levels of mercapturic acid metabolites, presumably resulting from the GSH
conjugation of PER, have been detected in the urine of exposed volunteers. Significant differences in
the kinetics of both pathways have been demonstrated between species, including humans. These
metabolic differences are reflected in the toxicity of PER to different species, particularly in their
carcinogenic response.
In humans, the total urinary metabolite levels of trichlorinated compounds (trichloroethanol and TCA)
correlate well with atmospheric concentrations of PER up to 100 ppm (690 mg/m3) at which level there
is substantial evidence of a saturation of the oxidative pathway (cytochrome P450). Urinary metabolite
levels have therefore been used as the basis for the biological monitoring of exposure to PER in the
workplace.
A number of kinetic models have been developed for PER which, in general, describe toxicological
risk in terms of total metabolised dose. None of these models provides a full description of the kinetic
behaviour of PER nor of its metabolism via the GSH pathway. It is judged that these models are not
sufficiently developed to allow a reliable prediction of the carcinogenic or other toxicological risks for
humans.
1.5 MAMMALIAN TOXICITY
PER has low acute toxicity by all relevant routes of occupational or environmental exposure. The
principal target organs for the acute toxic effects of PER are the central nervous system (CNS),
and - at higher doses - possibly the heart (sensitisation to catecholamine-induced arrhythmias), the
liver and, at even higher doses, the kidney. PER is irritant to the skin under occlusive conditions, this
effect being much reduced under non-occlusive conditions due to its volatility. It is a mild eye irritant
and may cause irritation of the respiratory tract at high concentrations. It is not a skin sensitiser and
no significant effects on immune function have been described.
Target organs following repeated exposure to PER in animals (up to 8 months) are the liver (adaptive
changes in rodents not accompanied by histochemical changes) and, at higher concentrations, the
kidney (increased weight and histopathological changes) the lungs (dyspnoea) and the CNS (neuro-
behavioural effects). Following the administration of PER to rats or mice for 2 years, the principal
target organ is the kidney, with adaptive effects in the liver being primarily observed for the mouse.
There are no reports of toxic effects in the liver or kidney in humans following repeated occupational
exposure to PER.
PER has been shown to be foetotoxic, but not teratogenic, at maternally toxic dose levels in several
animal species, with the mouse being the most sensitive species. It is concluded that this effect is
associated with the maternal toxicity of either PER or its oxidative metabolite, TCA. PER had no effect
4 ECETOC Joint Assessment of Commodity Chemicals No. 39
on fertility in rats and mice although there was evidence of aberrant sperm morphology in mice (but
not in rats) and lower testicular weight in rats at high exposure levels. In a two-generation inhalation
reproductive toxicity study in rats, PER induced pre- and post-natal toxic effects, with a No Observed
Effect Level (NOEL) of 100 ppm (690 mg/m3). PER had no effect in a dominant lethal study in the rat.
There is no substantive evidence from occupationally-exposed human populations that PER leads to
infertility or to any significant adverse effects on pregnancy or birth. Reports have been published of
adverse effects on fertility and on pregnancy outcome in women employed either in the laundry and/or
dry-cleaning industry and assumed to have been exposed to PER. These studies provide inadequate
details of the exposure to PER which is important, as mixed exposures are usual in these industries.
Furthermore, the studies were inadequate in their design, particularly in the control for confounding
factors and, in some instances, claimed effects were not statistically significant. Other studies in the
same industries have revealed no evidence of an excess in birth defects in the offspring of exposed
women.
PER has been assessed for mutagenic activity in a wide variety of in vivo and in vitro test systems. It
is concluded from an overall assessment of the available data, taking into account the quality of
conduct and reporting of the studies, that PER is non-mutagenic.
PER has been shown to cause hepatocellular carcinoma in the mouse and renal tubular cell
carcinoma in the male rat.
Studies on the mechanism of tumour formation in rodents lead to the conclusion that the increased
incidence of mouse liver tumours is due to the metabolism of PER to TCA (a known peroxisome
proliferator, liver growth agent and rodent hepatocarcinogen) via the cytochrome P450 pathway, a
route that is not saturated at the highest dose tested in this species. The absence of an increased
incidence of liver tumours in the rat can be explained by the fact that the oxidative pathway is
saturated at low doses (> 100 ppm; 690 mg/m3) in this species, which results in a limitation of
metabolite (TCA) formation and hence, any resulting toxicity.
It is thus predicted that PER would not induce liver tumours in humans because saturation of the
oxidative pathway in humans (following exposure to atmospheric concentrations of PER > 100 ppm;
> 690 mg/m3) leads to insufficiently high blood levels of TCA. In addition, human hepatocytes have
been shown not to be responsive to TCA as shown by the absence of peroxisome proliferation and
associated biochemical events in human hepatocytes exposed to the metabolite. Thus, there are both
kinetic and toxicodynamic reasons for concluding that humans will not be susceptible to PER-induced
liver tumours.
Tetrachloroethylene 5
Mechanistic studies on the male rat kidney tumours have led to the conclusion that they are the
consequence of protein droplet nephropathy, a male rat specific phenomenon, coupled with sustained
chronic toxicity. The latter effect is probably due to hepatic GSH conjugation of PER leading to the
activation of the resulting cysteine conjugate via renal β-lyase to a genetically active metabolite.
Although mercapturic acid derivatives have been detected in the urine of humans exposed to PER, the
GSH-conjugation pathway has not be detected in human liver samples in-vitro. Nevertheless, it is
reasonable to conclude that this pathway is operative in humans, albeit at a very low level. The large
difference in rates of metabolism of PER by this pathway in rats, compared to humans, suggests that
humans are not likely to be susceptible to the renal toxicity associated with the resulting metabolites.
This conclusion is supported by the lack of the observation of renal toxicity in humans exposed to
PER.
The observation of increased incidences of mononuclear cell leukaemia in F344/N rats, but not in the
Osborne-Mendel nor Sprague-Dawley rat, exposed to PER is considered to be of no significance for
human hazard assessment. This neoplasm is known to be of a high and variable incidence
specifically in the F344/N strain of rat.
1.6 CANCER EPIDEMIOLOGY
A number of cohort mortality and proportional mortality studies of workers from the laundry and dry
cleaning industry have been published in which exposure to PER may have occurred in the latter
group. Cohort mortality studies have also been conducted on groups of workers exposed to PER
during its use in metal cleaning. Some case-control studies of various cancers also provide some
information regarding exposure to PER. Finally, several studies of cancer incidence in populations
exposed to drinking water contaminated by PER are also described in the literature.
Of these, three cohort studies provide the most relevant information for assessing the relationship
between exposure to PER and cancer risk in humans. Excesses of various cancers are described in
these studies, including oesophageal cancer, cervical cancer, non-Hodgkin's lymphoma and bladder
cancer. The incidence of none of these cancers was consistently increased in all studies. All three
studies provide only limited information about the extent of exposure to PER. Furthermore, none of
the investigators collected data on known determinants of mortality for the various cancers of interest,
with the exception of factors such as race, sex and duration of follow-up. A further limitation of all
three studies is their low power to detect changes in cancer incidence for specified sites.
Overall, the epidemiological studies of greatest relevance are insufficient in both their design and
outcome to demonstrate a relationship between exposure to PER and the occurrence of cancer in
humans.

6 ECETOC Joint Assessment of Commodity Chemicals No. 39
There are reports in the literature of animal studies and of studies in human populations which suggest
a relationship between repeated exposure to PER and the occurrence of permanent chronic toxic
effects on the CNS. An overall assessment of the data leads to the conclusion that there is no
convincing evidence in support of this relationship. However reversible CNS effects of a neuro-
pharmacological nature are observed following acute exposure to PER at concentrations of 100 ppm
and above.
It is concluded that the appropriate effects upon which human health hazard assessment should be
conducted are toxic effects on the liver and the kidney. A Lowest Observed Effect Level (LOEL)
following repeated inhalation of 100 ppm PER (690 mg/m3) has been demonstrated in a wide range of
species, on the basis of histological criteria for all critical organs in studies of up to 2 years duration.
Tetrachloroethylene 7
2. IDENTITY, PHYSICAL AND CHEMICAL PROPERTIES,
ANALYTICAL METHODS
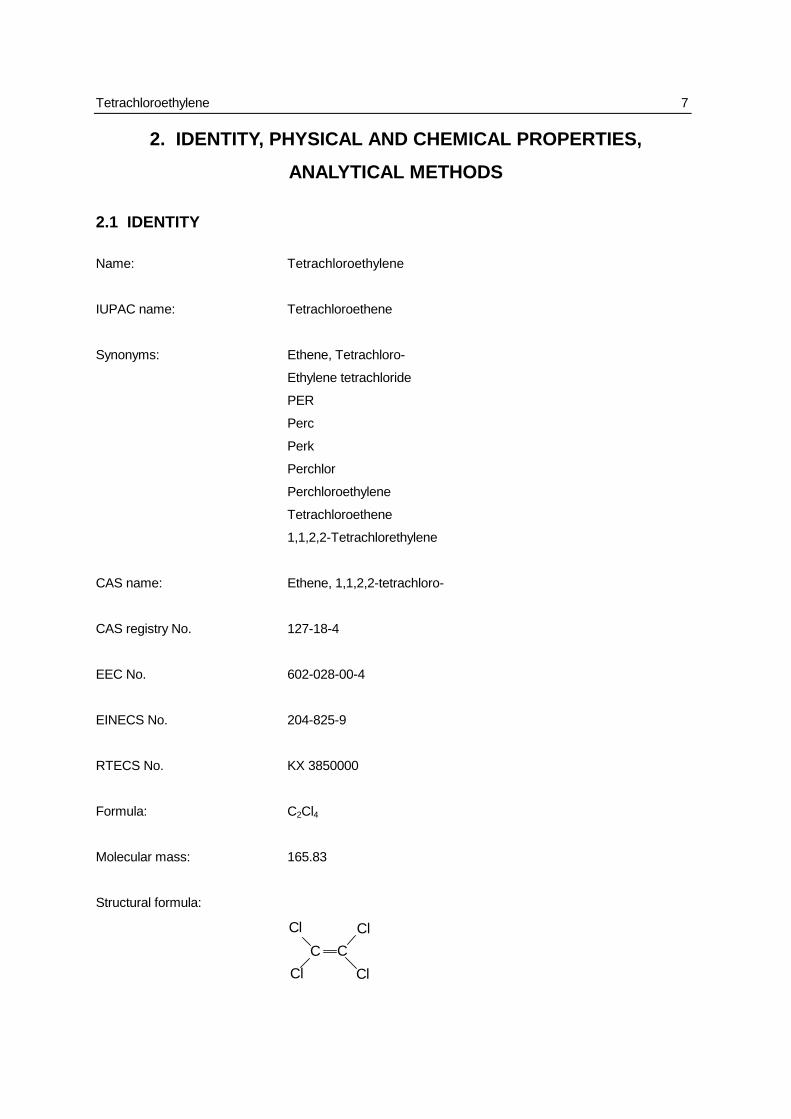
2.1 IDENTITY
Name: Tetrachloroethylene
IUPAC name: Tetrachloroethene
Synonyms: Ethene, Tetrachloro-
Ethylene tetrachloride
PER
Perc
Perk
Perchlor
Perchloroethylene
Tetrachloroethene
1,1,2,2-Tetrachlorethylene
CAS name: Ethene, 1,1,2,2-tetrachloro-
CAS registry No. 127-18-4
EEC No. 602-028-00-4
EINECS No. 204-825-9
RTECS No. KX 3850000
Formula: C2Cl4
Molecular mass: 165.83
Structural formula:
C
Cl
Cl
Cl
C
Cl
8 ECETOC Joint Assessment of Commodity Chemicals No. 39
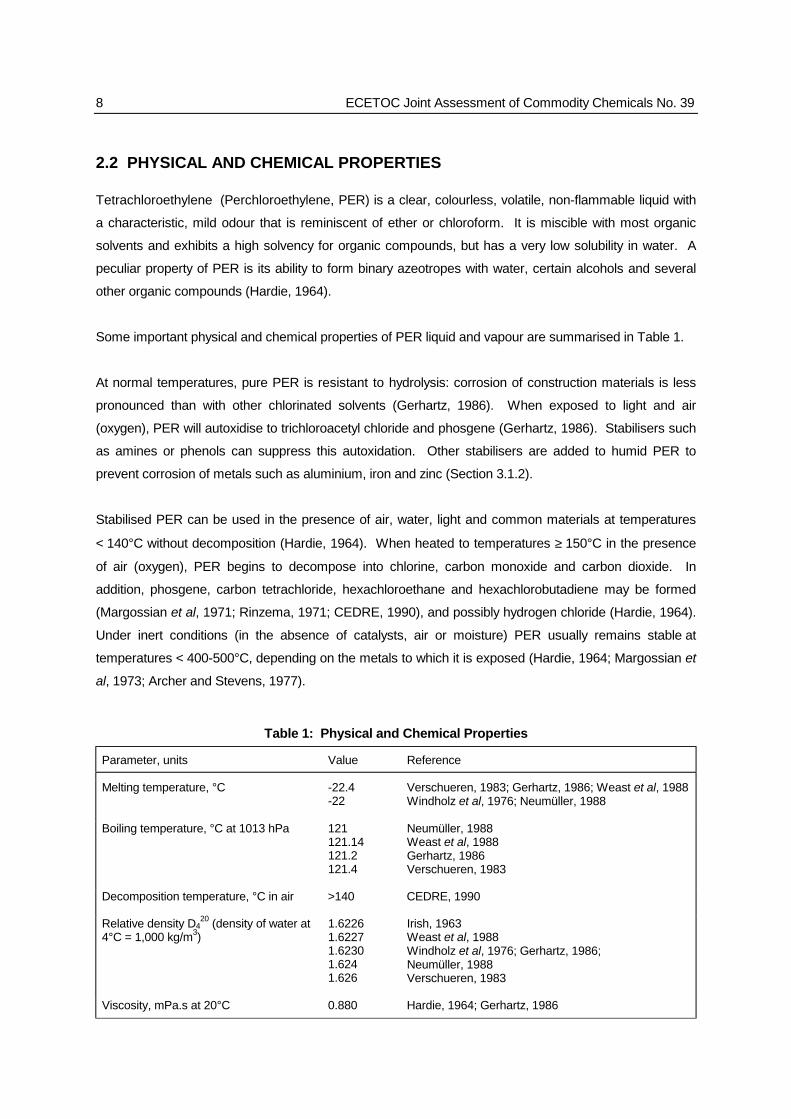
2.2 PHYSICAL AND CHEMICAL PROPERTIES
Tetrachloroethylene (Perchloroethylene, PER) is a clear, colourless, volatile, non-flammable liquid with
a characteristic, mild odour that is reminiscent of ether or chloroform. It is miscible with most organic
solvents and exhibits a high solvency for organic compounds, but has a very low solubility in water. A
peculiar property of PER is its ability to form binary azeotropes with water, certain alcohols and several
other organic compounds (Hardie, 1964).
Some important physical and chemical properties of PER liquid and vapour are summarised in Table 1.
At normal temperatures, pure PER is resistant to hydrolysis: corrosion of construction materials is less
pronounced than with other chlorinated solvents (Gerhartz, 1986). When exposed to light and air
(oxygen), PER will autoxidise to trichloroacetyl chloride and phosgene (Gerhartz, 1986). Stabilisers such
as amines or phenols can suppress this autoxidation. Other stabilisers are added to humid PER to
prevent corrosion of metals such as aluminium, iron and zinc (Section 3.1.2).
Stabilised PER can be used in the presence of air, water, light and common materials at temperatures
< 140°C without decomposition (Hardie, 1964). When heated to temperatures ≥ 150°C in the presence
of air (oxygen), PER begins to decompose into chlorine, carbon monoxide and carbon dioxide. In
addition, phosgene, carbon tetrachloride, hexachloroethane and hexachlorobutadiene may be formed
(Margossian et al, 1971; Rinzema, 1971; CEDRE, 1990), and possibly hydrogen chloride (Hardie, 1964).
Under inert conditions (in the absence of catalysts, air or moisture) PER usually remains stable at
temperatures < 400-500°C, depending on the metals to which it is exposed (Hardie, 1964; Margossian et
al, 1973; Archer and Stevens, 1977).
Table 1: Physical and Chemical Properties
Parameter, units Value Reference
Melting temperature, °C -22.4-22
Verschueren, 1983; Gerhartz, 1986; Weast et al, 1988Windholz et al, 1976; Neumüller, 1988
Boiling temperature, °C at 1013 hPa 121121.14121.2121.4
Neumüller, 1988Weast et al, 1988Gerhartz, 1986Verschueren, 1983
Decomposition temperature, °C in air >140 CEDRE, 1990
Relative density D420 (density of water at
4°C = 1,000 kg/m3)1.62261.62271.62301.6241.626
Irish, 1963Weast et al, 1988Windholz et al, 1976; Gerhartz, 1986;Neumüller, 1988Verschueren, 1983
Viscosity, mPa.s at 20°C 0.880 Hardie, 1964; Gerhartz, 1986

Tetrachloroethylene 9
Table 1: Physical and Chemical Properties (continued)
Parameter, units Value Reference
Refractive index nD, at 20°C 1.50531.5055
Weast et al, 1988Windholz et al, 1976; Gerhartz, 1986
Vapour pressure, hPa at 20°C 18.619.0
Verschueren, 1983Gerhartz, 1986
Relative density (air = 1), at boilingtemperature
5.75.85.83
Irish, 1963Gerhartz, 1986; CEDRE, 1990Verschueren, 1983
Saturation concentration in air, kg/m3
at 1,013 hPa and 20°C0.126 Verschueren, 1983
Threshold odour concentration, mg/m3 30 - 470230340
Ruth, 1986Ballschmiter et al, 1987Verschueren, 1983
Odour: ethereal, reminiscent of chloroform
Surface tension, mN/m at 20°C 31.332.1
CEDRE, 1990Gerhartz, 1986
Solubility in water, mg/kg at 20°Cat 25°C
160150
Ballschmiter et al, 1987Horvath, 1982; Gerhartz, 1986; CEDRE, 1990
Solubility of water in PER, mg/kgat 25°C
105 Horvath, 1982; Gerhartz, 1986
Miscible with ethanol, ether, chloroform,benzene and numerous other organicsolvents
Yes Windholz et al, 1976; Gerhartz, 1986; Weast et al,1988
Fat solubility, mg/100 g at 37°C No data
Partition coefficient, log Pow
(octanol/water) at 20°C2.53 - 2.88 Neely et al, 1974; Chiou et al, 1977; Hansch and Leo,
1979; Veith et al, 1980
Partition coefficient, log Koc
(soil-sediment/water) at 20°C1.9 - 2.56 Chiou et al, 1977; Kenaga, 1980; Schwarzenbach and
Westall, 1981; Mabey et al, 1982; Giger et al, 1983;Friesel et al, 1984; Seip et al, 1986; Abdul et al, 1987;Heil et al, 1989; Lee et al, 1989; Zytner et al, 1989a
Henry's law constant, Pa.m3.mol − 1
at 20°C1,303 - 1,429 Yurteri et al, 1987 and Ashworth et al, 1988, both as
cited in BUA, 1994
Flash point, °C None
Flammability None
Explosive properties No data
Auto-flammability None
Oxidising properties No data
10 ECETOC Joint Assessment of Commodity Chemicals No. 39
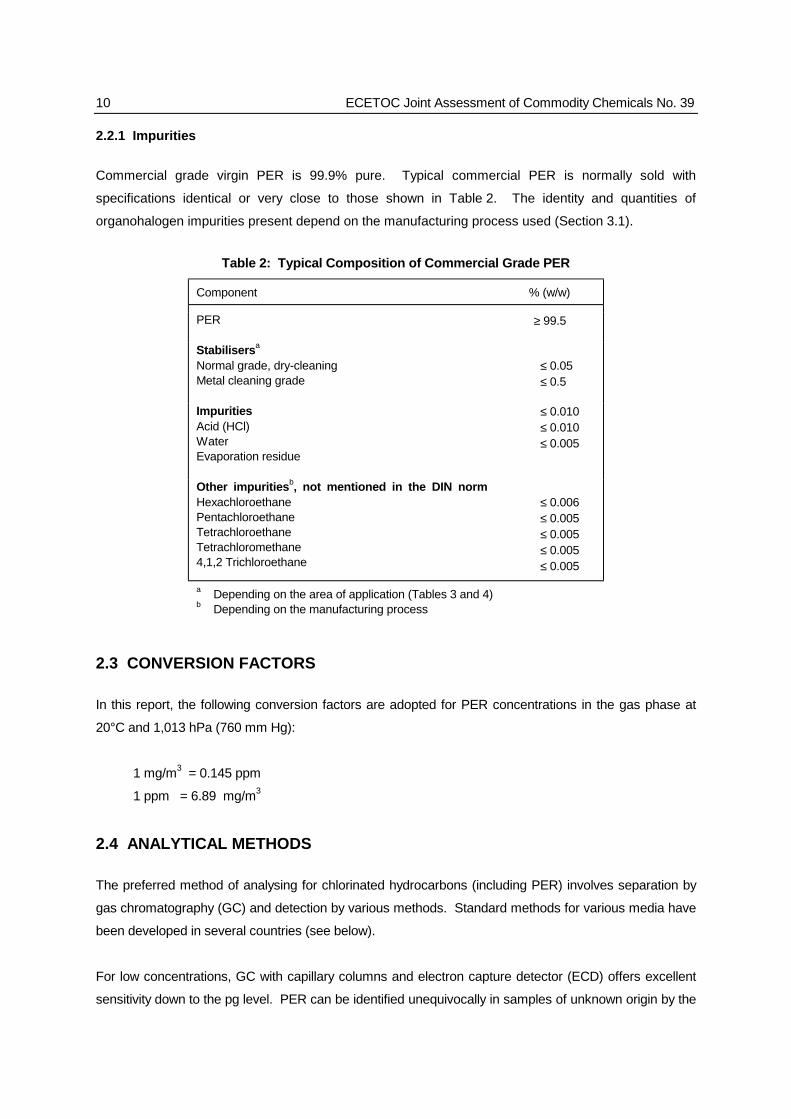
2.2.1 Impurities
Commercial grade virgin PER is 99.9% pure. Typical commercial PER is normally sold with
specifications identical or very close to those shown in Table 2. The identity and quantities of
organohalogen impurities present depend on the manufacturing process used (Section 3.1).
Table 2: Typical Composition of Commercial Grade PER
Component % (w/w)
PER ≥ 99.5
Stabilisersa
Normal grade, dry-cleaningMetal cleaning grade
≤ 0.05≤ 0.5
ImpuritiesAcid (HCl)WaterEvaporation residue
≤ 0.010≤ 0.010≤ 0.005
Other impuritiesb, not mentioned in the DIN normHexachloroethanePentachloroethaneTetrachloroethaneTetrachloromethane4,1,2 Trichloroethane
≤ 0.006≤ 0.005≤ 0.005≤ 0.005≤ 0.005
a Depending on the area of application (Tables 3 and 4)b Depending on the manufacturing process
2.3 CONVERSION FACTORS
In this report, the following conversion factors are adopted for PER concentrations in the gas phase at
20°C and 1,013 hPa (760 mm Hg):
1 mg/m3 = 0.145 ppm
1 ppm = 6.89 mg/m3
2.4 ANALYTICAL METHODS
The preferred method of analysing for chlorinated hydrocarbons (including PER) involves separation by
gas chromatography (GC) and detection by various methods. Standard methods for various media have
been developed in several countries (see below).
For low concentrations, GC with capillary columns and electron capture detector (ECD) offers excellent
sensitivity down to the pg level. PER can be identified unequivocally in samples of unknown origin by the

Tetrachloroethylene 11
use of GC coupled with mass spectrometry (GC-MS) analysis. During routine analysis for higher
concentrations, reliable results are obtained using packed columns and a flame ionisation detector (FID).
A concentration step prior to GC analysis is often required for the determination of very low
(environmental) PER concentrations. Therefore, it is important to ensure that samples are not
contaminated by PER present in the local environment e.g. recently dry-cleaned clothes. Sampling,
storage and preparation of samples should be carried out carefully and quickly so as to avoid any
contamination, loss or changes of the sample.
2.4.1 Determination in Air
A method for the determination of PER in the sub-ppb range in air by GC-ECD was developed by Sykes
et al (1980). Air is sampled at a flow rate of 250 ml/min through a standard NIOSH (US National Institute
of Occupational Safety and Health) charcoal tube that is subsequently desorbed using a carbon
disulphide/methanol (25:75) mixture. The method was comparable to a technique using Tenax as
sorbent material, thermal desorption and subsequent GC-MS in the concentration range of 0.1-3.2 ppb
(0.69-22 µg/m3).
The detection limit can be lowered by prior enrichment, i.e. by passing air over a suitable sorbent, such
as active carbon, Tenax or XAD, followed by thermal elution or solvent extraction; a cold trap has also
been used. In this way, detection limits of 0.1-5 ppt (0.69-34.5 ng/l) have been achieved (Grimsrud and
Rasmussen, 1975; Class and Ballschmiter, 1986, 1987).
Higher concentrations (ppm levels), e.g. at the workplace, can be determined with personal monitoring
tubes (Dräger, Auer). Dräger reports useful ranges of 5-50 ppm (34.5-344.5 mg/m3) 10-500 ppm (69-
3,445 mg/m3) respectively for two different PER detector tubes. There is also a diffusion tube for long-
term sampling available from Dräger, which has an application range of 25-200 ppm (172-1,378 mg/m3).
These detector tubes should be used with care, considering possible cross-sensitivities and interferences
(Dräger, 1982; Von Düszeln and Thiemann, 1983; Kühn-Birett, 1991). Passive sampling by diffusion on
Tenax and thermodesorption has also been used to achieve a lower detection limit (ppm) (Von Düszeln
and Thiemann, 1983).
For the purpose of workplace monitoring, various countries have adopted standard methods. The
methods reported by the US-NIOSH and the UK Health and Safety Executive (HSE) are summarised
below. Although primarily designed for workplace monitoring, the techniques described below may also
be useful for stack (emission) monitoring and related environmental measurements with appropriate
quality assurance measures.
12 ECETOC Joint Assessment of Commodity Chemicals No. 39
UK-HSE Methods for the Determination of Hazardous Substances 28 (Rev)
A method for workplace monitoring of a group of halogenated hydrocarbons including PER over periods
from 10 minutes to 8 hours is described. It involves collection of the vapours in an activated charcoal
tube by means of battery operated pumps. The charcoal is subsequently desorbed in carbon disulphide
and analysed by GC-FID. A useful range of 0.2-200 ppm (1.4-1.378 mg/m3) is reported for a 10-litre air
sample (HSE, 1990).
US-NIOSH Projected and Completed Analytical Methods 127 and S335
In NIOSH method 127, a known volume of air (1-25 l) is drawn through a charcoal tube by means of a
personal sampling pump to trap any PER vapours present. The charcoal tube is transferred to a test
tube and desorbed with carbon disulphide. An aliquot of the desorbed sample is injected into a GC-FID
and the peak measured and compared with the area obtained from injected standards. The detection
limit is 2.4-60 mg/m3 air (0.35-8.7 ppm) (NIOSH, 1977a). The US Occupational Safety and Health
Administration (OSHA) uses a slightly modified, generalised version of this method (OSHA, 1989).
NIOSH Method S335 is based on the same principles, but using a 3-litre air sample. The method was
validated over a range of 655-2,749 mg PER/m3 (95.0-398.6 ppm) (NIOSH, 1977b).
2.4.2 Determination in Water
Water samples with higher concentrations of PER (e.g. > 1 mg/l) can be injected directly into a capillary
GC-ECD (Nicholson et al, 1977), but an enrichment step is usually necessary to cope with lower levels.
PER is part of the (organic) fraction that may be absorbed on to active carbon or Tenax (AOX), extracted
by pentane (EOX) or purge-and-trapped by air (POX); other validated enrichment techniques include
closed-loop stripping and the use of headspace and cold trap. The detection limits vary from 0.1 ng/l to
0.5 µg/l (Bauer, 1981a,1990; UBA, 1983; Gruber, 1984; Selenka and Bauer, 1984). The latter limit can
also be obtained with a GC-FID combination (Nicholson et al, 1977).
2.4.3 Determination in Soils, Sediments and Wastes
A variety of methods for the determination of PER in soils and sediments are available. One method
describes the need to grind soil or sediment samples prior to suspension in distilled water followed by
extraction into n-pentane. The pentane fraction is analysed for PER by direct GC-ECD. The detection
limit, with a proviso for matrix effects, is 0.1 µg/kg (Arge Elbe, 1986).
A standard GC method prescribed by the US Environmental Protection Agency (US-EPA) uses the
purge-and-trap method for analysing PER in ground water or soils contaminated at low levels. For soils
or sediments contaminated at intermediate levels, methanol extraction may be necessary prior to purge-
Tetrachloroethylene 13
and-trap analysis. When the GC is equipped with a halogen-specific detector (HSD), the limit of
detection is 0.3 µg/l for ground water and soil contaminated at low levels, 15 µg/l for water-miscible liquid
waste and 37.5 µg/l for soil contaminated at high levels and sludge or non-water-miscible waste. These
limits are highly matrix dependent (US-EPA, 1987-1988).
PER can be determined by GC-MS in nearly all types of soils, regardless of the water content, including
ground water and sediments. The sample may be introduced into the GC by the purge-and-trap
technique or by direct injection. With a packed column, the detection limits range from approximately
5 µg/kg (w/w) for soil/sediment samples, to 5 µg/l for groundwater samples. With a capillary column, the
respective detection limits are 5 mg/kg (w/w) for soils and sediments and 5 mg/l for groundwater. This
method is also suitable for various wastes (US-EPA, 1987-1988).
The air in soils can be analysed for PER by direct GC-ECD. Normally 10-100 µl air is taken by means of
an injection valve from a sampling tube, which is driven into the soil. A detection limit of 1 µg/m3 (150
ppt) has been reported (Neumayr, 1981; Walther et al, 1985).
2.4.4 Determination in Food and Tissues
PER can be analysed in solid food or tissue samples after they are deep-frozen and ground with sodium
sulphate, exposed to nitrogen gas at 80°C to desorb gaseous contents and subsequently adsorbed by a
suitable sorbent. Following elution of the sorbent, the eluate is analysed directly for PER (Bauer, 1981a).
PER can be co-distilled from fatty foodstuffs with decane or using a modified distillation with water vapour
and n-pentane in a Clavenger apparatus. Other validated methods are available. The detection limits
depend on matrix effects and, using GC-ECD or GC-MS, range from 0.01-0.02 µg/kg (McConnell et al,
1975; Bauer, 1981a; Selenka and Bauer, 1984).
Bauer (1990) reports a standard method for the determination of PER in edible oil.
PER and its metabolites can be determined in blood or urine (20 or 100 µl) by incubation with
β-glucoronidase to split the trichloroethanol glucuronide, followed by heating to 100°C to convert TCA to
chloroform. The headspace gas is collected after 30 minutes at 90°C, and injected into a GC with
capillary column and ECD. The limit of detection varies from 0.01-0.04 mg/ml (Schoknecht et al, 1983).
GC has also been used in biological monitoring assays (Section 11.3.3).
14 ECETOC Joint Assessment of Commodity Chemicals No. 39
3. PRODUCTION, STORAGE, TRANSPORT AND USE
3.1 PRODUCTION
Industrial production of PER commenced in Europe in 1914, when it was commercially marketed in
Germany and the UK, and in the USA in 1925.
PER may be produced by oxychlorination, chlorination and/or dehydrochlorination reactions of
hydrocarbons or chlorinated hydrocarbons. The most common methods of production reported are
high-temperature chlorinolysis of propylene and oxychlorination of 1,2-dichloroethane (Brooke et al,
1993). Both routes yield a mixture of PER and trichloroethylene. Varying the reaction conditions can
alter the proportions of each compound produced. Carbon tetrachloride is also produced via the
chlorination of propylene, the amounts produced being dependent upon the reaction conditions
employed. Due to reduction in use of carbon tetrachloride, the current reaction conditions are likely to
favour the production of PER by the oxychlorination of 1,2-dichloroethane route (ECSA, 1996).
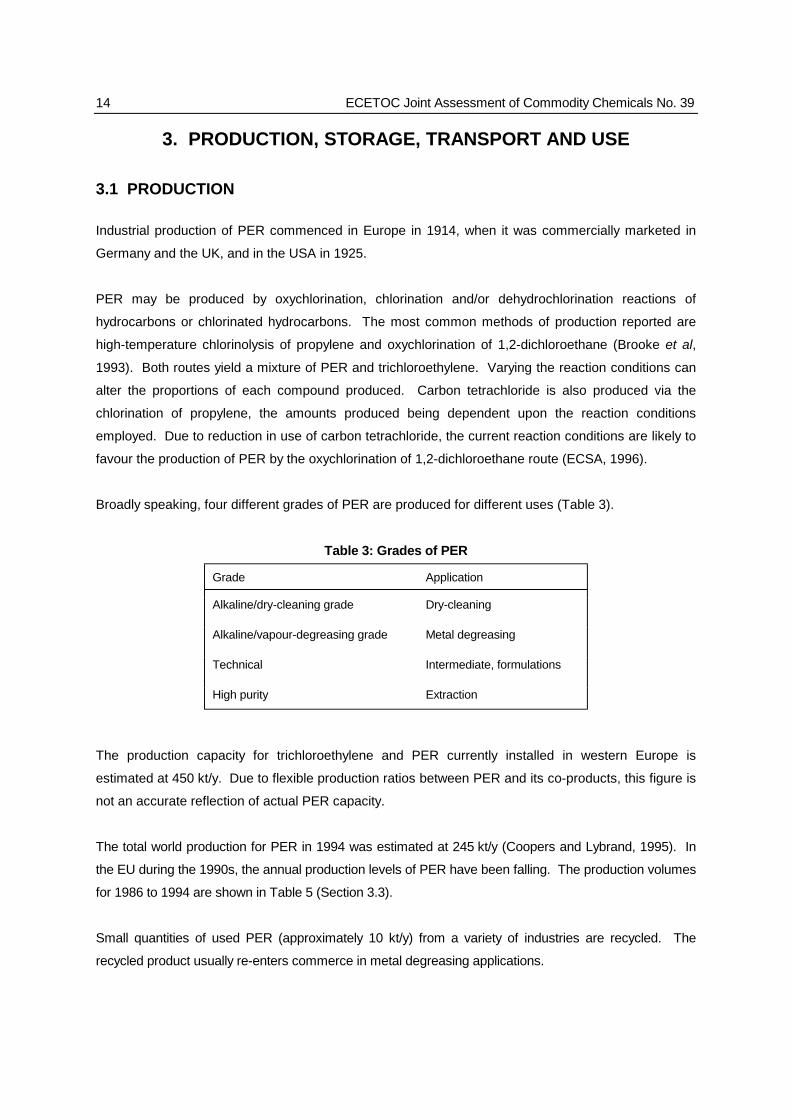
Broadly speaking, four different grades of PER are produced for different uses (Table 3).
Table 3: Grades of PER
Grade Application
Alkaline/dry-cleaning grade Dry-cleaning
Alkaline/vapour-degreasing grade Metal degreasing
Technical Intermediate, formulations
High purity Extraction
The production capacity for trichloroethylene and PER currently installed in western Europe is
estimated at 450 kt/y. Due to flexible production ratios between PER and its co-products, this figure is
not an accurate reflection of actual PER capacity.
The total world production for PER in 1994 was estimated at 245 kt/y (Coopers and Lybrand, 1995). In
the EU during the 1990s, the annual production levels of PER have been falling. The production volumes
for 1986 to 1994 are shown in Table 5 (Section 3.3).
Small quantities of used PER (approximately 10 kt/y) from a variety of industries are recycled. The
recycled product usually re-enters commerce in metal degreasing applications.
Tetrachloroethylene 15
3.1.1 Stabilisers
Stabilisers are normally added to PER to prevent its decomposition during storage and use. Due to its
relatively high stability, PER is less stabilised than other chlorinated solvents. To be effective during use,
the stabilisers must be co-volatile with PER, so that they are present in both the liquid and vapour phase.
Four types of stabiliser can be blended with the commercial product, depending on the application:
! epoxides, which neutralise small quantities of acids formed during metal degreasing; they are not
normally used for dry-cleaning grade PER;
! secondary or tertiary alcohols, or nitroalkanes to protect the metal surface by de-activation or
removal of metal salts by complex formation;
! alkylamines or phenols, as antioxidants to inhibit autoxidation of PER by air (oxygen);
! alkylamines, to prevent corrosion of mild or galvanised steel.
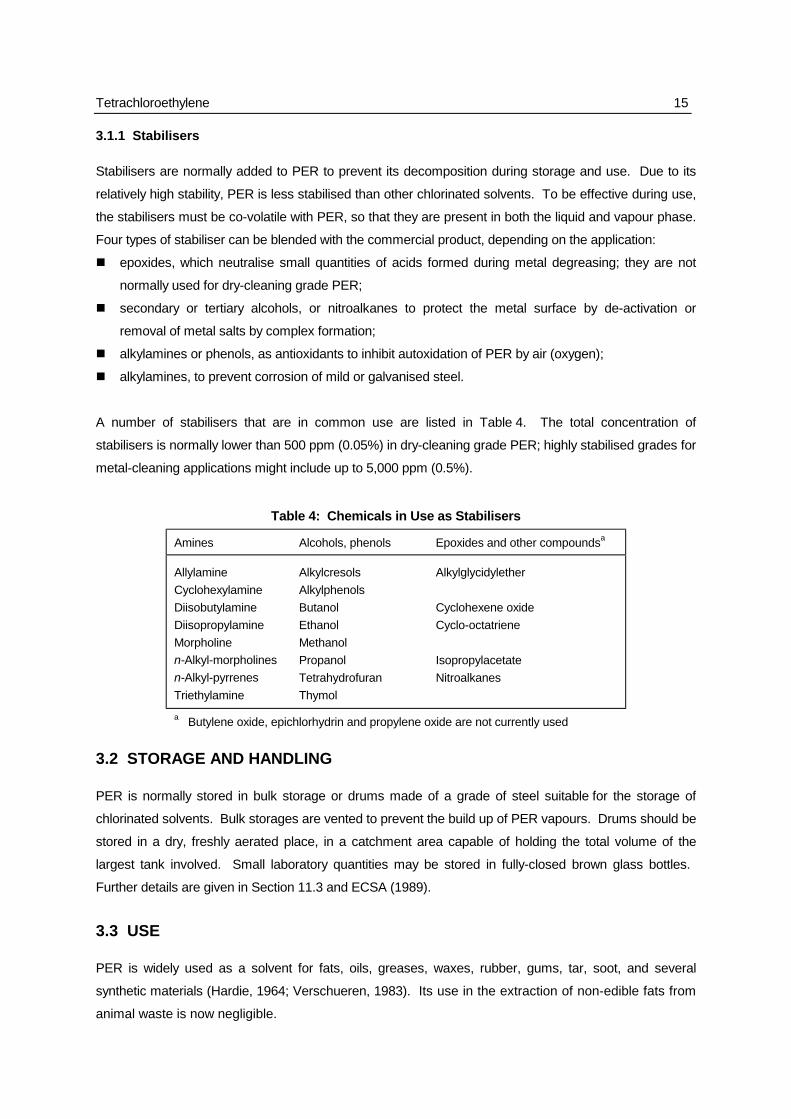
A number of stabilisers that are in common use are listed in Table 4. The total concentration of
stabilisers is normally lower than 500 ppm (0.05%) in dry-cleaning grade PER; highly stabilised grades for
metal-cleaning applications might include up to 5,000 ppm (0.5%).
Table 4: Chemicals in Use as Stabilisers
Amines Alcohols, phenols Epoxides and other compoundsa
Allylamine
Cyclohexylamine
Diisobutylamine
Diisopropylamine
Morpholine
n-Alkyl-morpholines
n-Alkyl-pyrrenes
Triethylamine
Alkylcresols
Alkylphenols
Butanol
Ethanol
Methanol
Propanol
Tetrahydrofuran
Thymol
Alkylglycidylether
Cyclohexene oxide
Cyclo-octatriene
Isopropylacetate
Nitroalkanes
a Butylene oxide, epichlorhydrin and propylene oxide are not currently used
3.2 STORAGE AND HANDLING PER is normally stored in bulk storage or drums made of a grade of steel suitable for the storage of
chlorinated solvents. Bulk storages are vented to prevent the build up of PER vapours. Drums should be
stored in a dry, freshly aerated place, in a catchment area capable of holding the total volume of the
largest tank involved. Small laboratory quantities may be stored in fully-closed brown glass bottles.
Further details are given in Section 11.3 and ECSA (1989).
3.3 USE
PER is widely used as a solvent for fats, oils, greases, waxes, rubber, gums, tar, soot, and several
synthetic materials (Hardie, 1964; Verschueren, 1983). Its use in the extraction of non-edible fats from
animal waste is now negligible.
16 ECETOC Joint Assessment of Commodity Chemicals No. 39
The principal use of PER is as a solvent in the dry-cleaning industry because of its high solvency and
high solute-carrying capacity, low capacity to inflate hydrophilic textile fibres and above all its non-
flammability and low toxicity, when compared with other potential dry-cleaning solvents. Another major
use is in vapour-phase metal degreasing in the engineering industry (ECSA, 1995).
PER is also used as an intermediate in the manufacture of TCA and fluorocarbons, including both
chlorofluorocarbons (CFCs; production already phased out in developed countries) and their partially
hydrogenated substitutes, hydrofluorocarbons (HFCs). Other minor uses include various applications
in the textile industry and as a solvent during fabrication of industrial glues and rubber formulations.
In western Europe, the quantities of PER sold have declined from 290 kt/y in 1974 to 162 kt/y in 1986
and further to 78 kt/y in 1994 (ECSA, 1995) (Table 5). These figures exclude amounts of recycled
PER, currently estimated at 10 kt/y, and uses for the production of fluorocarbons. It is expected that
both the pattern of use and the total amount of product used (virgin and recycled) will change, due to
the future decrease in consumption. This decrease in consumption is due to evolving techniques to
further improve the capture of emissions and the recycling of residues. Use in the production of CFCs
(not HFCs) has fallen significantly in western Europe the 1990s as a consequence of the controls
introduced by the Montreal Protocol.
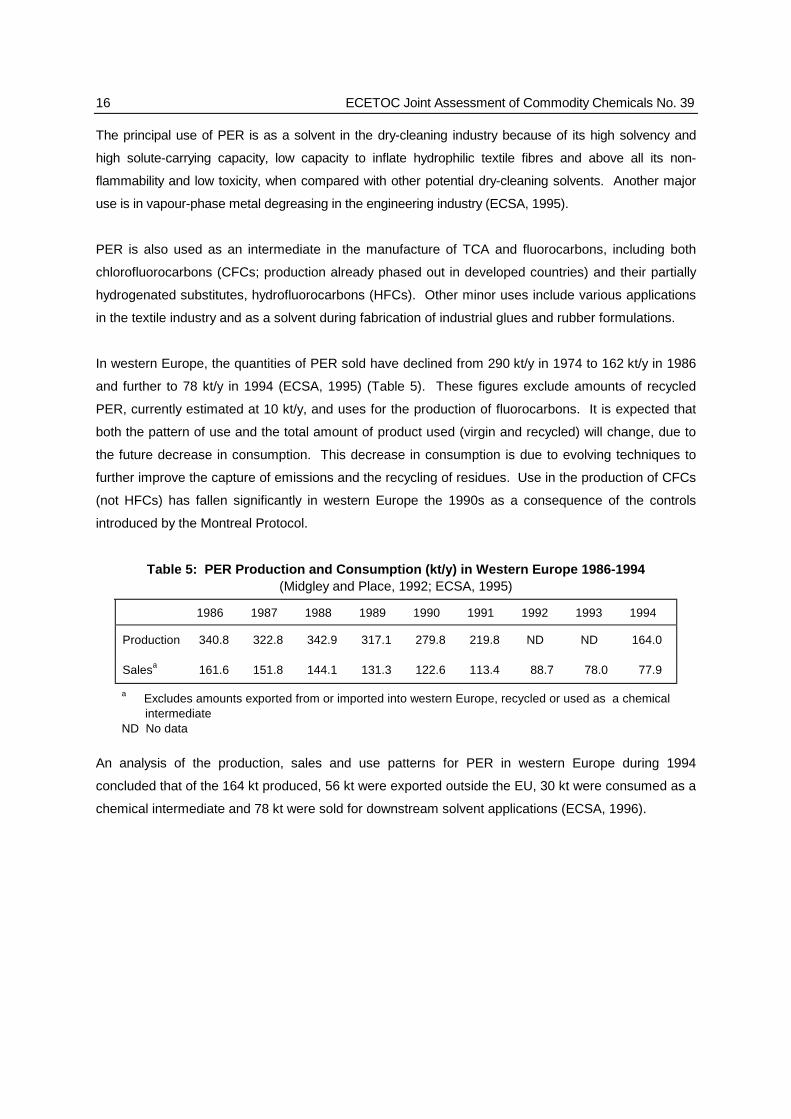
Table 5: PER Production and Consumption (kt/y) in Western Europe 1986-1994(Midgley and Place, 1992; ECSA, 1995)
1986 1987 1988 1989 1990 1991 1992 1993 1994
Production 340.8 322.8 342.9 317.1 279.8 219.8 ND ND 164.0
Salesa 161.6 151.8 144.1 131.3 122.6 113.4 88.7 78.0 77.9
a Excludes amounts exported from or imported into western Europe, recycled or used as a chemical intermediateND No data
An analysis of the production, sales and use patterns for PER in western Europe during 1994
concluded that of the 164 kt produced, 56 kt were exported outside the EU, 30 kt were consumed as a
chemical intermediate and 78 kt were sold for downstream solvent applications (ECSA, 1996).
Tetrachloroethylene 17
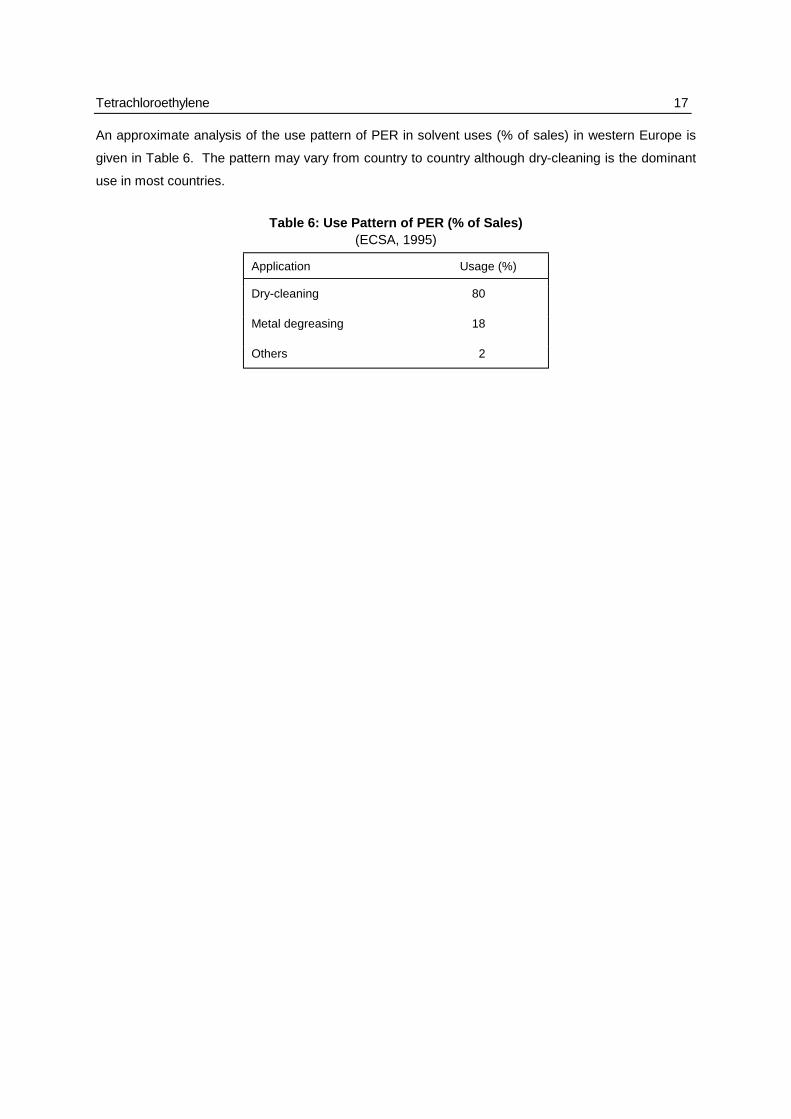
An approximate analysis of the use pattern of PER in solvent uses (% of sales) in western Europe is
given in Table 6. The pattern may vary from country to country although dry-cleaning is the dominant
use in most countries.
Table 6: Use Pattern of PER (% of Sales)(ECSA, 1995)
Application Usage (%)
Dry-cleaning 80
Metal degreasing 18
Others 2
18 ECETOC Joint Assessment of Commodity Chemicals No. 39
4. ENVIRONMENTAL DISTRIBUTION AND TRANSFORMATION
4.1 ENVIRONMENTAL DISTRIBUTION
Most of the known sources of PER are anthropogenic. However, synthesis by marine macro and
micro algae has been detected in the laboratory (Abrahamsson et al, 1995a,b). Aucott (1997) has
estimated the oceanic source of PER to be of the order of 100 kt/y (Appendix A).
Because of its physico-chemical properties and the large number of consumers (dry-cleaning shops
and degreasing in workshops), the potential for release of PER in the environment is high. Owing to
its high Henry's Law constant (Table 1), the majority will ultimately partition into the air (ECETOC,
1988). The ambient air levels are higher in areas of concentrated industry and population, where most
dry-cleaning establishments and engineering workshops are located; the values found in rural and
remote areas are lower. These levels reflect the relative magnitude of sources, and are usually in the
ppt to ppb range.
4.1.1 Emissions during Production, Storage and Handling
Losses of PER to the atmosphere were reported to be 2.5 t/y from a German company in 1990 (BUA,
1994). Accidental release of vapours and spillage of liquid will occur during the manufacturing process
itself and also during blending and filling operations. Two European producers reported general
emissions for 1994 around 0.02% of PER production mainly coming from tank respiration (ECSA,
1996). Based on a total production of 164 kt/y for the EU, this would lead to a total release of
approximately 32 t/y in 1994.
PER occurs in waste-water for a variety of reasons, including washing organic phases during
production, rinsing during cleaning operations of tanks used in bulk storage and transport, leakage
during filling, vent scrubbing and its dissolution in rainwater. Contaminated effluents are normally
collected in basins where most of the PER settles by gravity. Small quantities of PER which remain in
solution can be removed by stripping, by adsorption or by biological treatment with adapted micro-
organisms. A removal efficiency of > 95% is normally obtained (Section 4.2.4).
Two German producers reported, respectively, total emissions of 0.12 and 0.15 t of PER in water for
the year 1991 (BUA, 1994). From 1994, European producers were expected to comply with Directive
76/464/EEC, i.e. water emissions to be < 2.5 g/t of PER produced (ECSA, 1996). Based on a total
production of 164 kt/y for the EU, this would lead to a total release to water of a maximum of 410 kg/y.
Tetrachloroethylene 19
4.1.2 Emissions during Use
There is no significant emission of PER during its use as a chemical intermediate: data from one
European company show air releases being 0.04% of the total quantity of PER used for intermediate
production (ECSA, 1996). Emissions of PER to air, to water and via solid waste occur during use of
the product as a solvent in dry-cleaning and metal degreasing. The average releases to the
environment in western Europe in 1994, based on sales figures for 1994, were 90% (70.2 kt/y) to air
and 10% (7.8 kt/y) to water (ECSA, 1996).
The current trend in the dry-cleaning industry is a stringent reduction of the total (mainly airborne)
emissions. This is achieved by the increasing use of closed-system machines. Total losses,
estimated in the past to be up to 7 kg of solvent per 100 kg of cleaned clothes, are decreasing
substantially and now amount to only one kg per 100 kg of cleaned clothes. Similar efforts undertaken
in the metal-degreasing industry are leading to reduced air emissions from their workshops.
The residues from dry-cleaning and metal-degreasing operations contain, typically, 10% of PER.
Sometimes the content of PER may be as high as 50%, which makes recycling technically and
economically viable in specialised recycling plants. Alternatively, residues may be incinerated (ECSA,
1996).
4.2 BIOTRANSFORMATION AND ENVIRONMENTAL FATE
4.2.1 Atmospheric Fate
A detailed discussion of the fate of PER in the atmosphere, with references to the relevant literature, is
given in Appendix A. The conclusions may be summarised as follows:
The atmospheric degradation of PER occurs mainly in the troposphere and is initiated principally by
reaction with hydroxyl (!OH) radicals and possibly to some extent by reaction with chlorine atoms.
Reaction with other reactive trace species and direct photolysis are believed to make only a very minor
contribution to the degradation of PER. Physical removal of PER from the troposphere by “rainout” or
uptake by the oceans is negligible compared to chemical destruction.
The overall atmospheric lifetime of PER, derived either from the rate constant of the reaction of PER
and the known concentration of !OH, or from “budget” calculations, is approximately 4 to 5 months
(corresponding to a half-life of roughly 3 months). This lifetime is long enough for transport to occur to
regions far removed from the emission sources, but it is short enough for only a small fraction of the
PER emitted at a given location to cross the equator into the other hemisphere.

20 ECETOC Joint Assessment of Commodity Chemicals No. 39
The atmospheric photochemical reactivity of PER is too low for it to make any significant contribution
to local urban tropospheric ozone formation and the related “photochemical smog”. The US-EPA has
therefore exempted PER from being regarded as a “VOC” (Volatile Organic Carbon).
Current global anthropogenic emissions of PER, deduced from audited production and sales data, are
estimated to be approximately 300 kt/y and to occur essentially (> 98%) in the northern hemisphere.
Broadly speaking, the observed atmospheric background concentrations and their geographical
distribution (much higher levels are observed in the northern hemisphere than in the southern
hemisphere) are consistent with these emissions data and with the assumption that reaction with the
!OH radical in the troposphere is the dominant atmospheric sink for PER. A recent modelling study
suggests that there may be a natural oceanic source of approximately 100 kt PER/y.
In the northern hemisphere there is a marked seasonal variation of the background PER
concentrations. These are lowest after a period of high “oxidising power” of the atmosphere (high !OH
concentrations), which occurs in the summer months.
A number of laboratory studies carried out under “simulated atmospheric conditions” have enabled
various reaction products to be identified: phosgene, trichloroacetyl chloride (TCAC), dichloroacetyl
chloride, tetrachloroethylene epoxide, carbon oxides, formic acid, hydrogen chloride, chlorine, carbon
tetrachloride and chloroform. Of these products, phosgene and TCAC are the most commonly
reported ones. Such studies should, however, be interpreted with great caution and deviations from
actual tropospheric conditions should be taken into account when postulating likely breakdown
pathways in the real atmosphere.
Thus, experiments carried out in the presence of chlorine scavengers demonstrate that TCAC is the
product of the chlorine-atom initiated oxidation pathway (which also gives rise to phosgene in 15%
yield), while the degradation initiated by the !OH radical leads exclusively to one-carbon products,
including phosgene.
From the known rate constants for reaction of PER with !OH and with Cl, and from available data on
the tropospheric abundances of these two reactive species, it is concluded that the reaction of PER
with Cl represents approximately 13% of the overall atmospheric degradation of PER. The TCAC thus
formed will be partly photolysed (giving phosgene) and partly taken up by cloud, rain and ocean water
and hydrolysed to TCA. The best estimate of the overall atmospheric yield of TCA from PER is 5%,
but there is considerable uncertainty and the value might conceivably be as low as 0.1% or as high as
33%. The concentrations of TCA observed in rainwater over Europe are broadly consistent with the
assumption that the atmospheric degradation of PER, at background concentrations, is the main
source of TCA (with a yield of 5%). However, over other parts of the globe (in particular at high
Tetrachloroethylene 21
latitudes of both hemisphere), observed TCA levels in precipitation appear to be either too high or too
low for them to be consistent with this assumption.
Simulated atmospheric degradation experiments carried out in 1975 led to the conclusion that carbon
tetrachloride (CCl4), an ozone-depleting substance, could be formed from PER, with a yield of
approximately 8%. More recent laboratory studies have confirmed the formation of CCl4, albeit in
much lower yields. They have demonstrated that CCl4 is a secondary and/or tertiary oxidation product,
arising from the photolysis of TCAC or its hydrolysis product TCA, largely through heterogeneous
reactions occurring on the walls of the reactor. CCl4 is thus a minor product of the Cl-atom initiated
degradation pathway. From information provided by the laboratory studies and the estimate of the
importance of the Cl-atom pathway in the troposphere (up to 13% yield), it is concluded that the overall
atmospheric yield of CCl4 from PER is unlikely to exceed 0.03%.
It is not meaningful to calculate an Ozone Depleting Potential for a substance with an atmospheric
lifetime as short as that of PER, the tropospheric concentration of which varies greatly with latitude,
being much higher in the northern hemisphere, where it is emitted, than in the southern hemisphere.
Nevertheless, PER contributes only approximately 1% of total current atmospheric chlorine loading
and hence plays only a minor part in ozone depletion. Part of the small fraction of PER that does
reach the stratosphere (estimated at approximately 1.6% of ground-level emissions) is degraded to
phosgene and returned to the troposphere where it is destroyed by hydrolysis. Thus not all the
chlorine contained in the PER entering the stratosphere is actually converted into ozone-depleting
species. Furthermore, the tropospheric breakdown products arising from PER (phosgene and
possibly some TCAC) contribute considerably less to stratospheric chlorine loading than PER itself.
The contribution of PER to the acidity of precipitation (“acid rain”) is less than 0.1% of the global total.
4.2.2 Aquatic Fate
A detailed discussion of the fate of PER in aquatic media, with references to the relevant literature, is
given in Appendix B. The conclusions may be summarised as follows:
The abiotic processes which may be expected, a priori, to contribute to the removal of PER from
aqueous media are: volatilisation, chemical (or photochemical) reaction and sorption. However, in
confined groundwater, neither volatilisation nor photodegradation will occur.
Owing to its high Henry's Law constant, any PER present in surface waters will partition preferentially into
the ambient air. Application of a Mackay Level 1 model leads to the conclusion that 99.45% of PER
partitions to the air compartment.
22 ECETOC Joint Assessment of Commodity Chemicals No. 39
Volatilisation from water to air is a fairly rapid process. Very short evaporation half-lives (< 1 h) have
been observed in laboratory studies. Nevertheless, it is recognised that the rate-limiting process is
diffusion in the liquid phase, so the volatilisation rate is highly dependent on mixing conditions, which
are often much more vigorous in laboratory experiments than in the real environment. In surface
waters, mixing is determined by water flow-rate and depth as well as wind speed. The evaporation
half-life of PER derived from actual field observations is of the order of 2-10 days for rivers and
1 month for lakes or ponds.
Volatilisation is nevertheless expected to be by far the dominant process for removal of PER from
surface waters, since known chemical or photochemical reactions of PER in the aquatic environment
(such as direct photolysis or hydrolysis) appear to be exceedingly slow compared to evaporation.
However, it has not been possible, for lack of reliable data, to assess the significance of reactions of
PER in aquatic media with various reactive species of photochemical origin such as hydrated electron,
!OH radical, alkylperoxy or alkoxy radicals, excited molecular oxygen, superoxide ion, etc.).
The removal of PER from aqueous media by sorption onto soils, sediments or suspended matter is
discussed in Section 4.2.3 and in Appendix B (Section B.3).
4.2.3 Fate in Soils and Sediments
Due to its high vapour pressure and moderately low soil adsorption (Koc is 79 to 360, Table 1), PER on
the soil surface will evaporate rapidly (Wilson et al, 1981).
In soil and sediment with a partition coefficient of the order of 200 (Table 1, log Koc = 1.9 - 2.56), PER
is considered to be fairly mobile and to have the potential to contaminate large areas of groundwater
when leached by rainwater.
PER can leach rapidly through sandy soil into groundwater. Its retardation is 2.5 times that of water
(Wilson et al, 1981). In a bank filtration system tested in Switzerland (Schwarzenbach et al, 1983) and
in the Netherlands (Zoeteman et al, 1980), PER was rapidly transported to groundwater. It was
estimated that only 0.01% was adsorbed to particulate matter.
Soil/water partition coefficients for PER have been established following exposure of Agawan soil (fine
sandy loam) to aqueous solutions of 4.18-68.2 µg/l. Coefficients of 6.5 (24 h) and 7.3 (72 h) were
determined (Pignatello, 1990a,b).
Sorption capacity was established experimentally in a closed system. Twenty-two percent of a 1 µg/l
solution of PER was absorbed by bentonite clay (750 mg/l) after 30 minutes. No further sorption was
Tetrachloroethylene 23
noted. Peat moss (500 mg/l) absorbed 40% of a 1 µg/l solution of PER in 10 minutes (Dilling et al,
1975).
Measured adsorption of PER to soil appears to be higher than would be predicted from the soil organic
carbon/water partition coefficient (log Koc, Table 1), suggesting some form of adsorption to the non-
organic component of the soil (Mokrauer and Kosson, 1989; Piwoni and Banerjee, 1989).
In a study designed to simulate field conditions it was concluded that the sorption of PER to aquifer
materials was reversible at concentrations typical in natural waters (Schwarzenbach and Westall,
1981).
Once it is present in groundwater, PER can no longer be removed by volatilisation and
photochemically-driven degradation processes are not operative.
4.2.4 Biodegradation
Aerobic Conditions
PER was not biodegraded in a shake-flask, closed-bottle biodegradation procedure after a 21 day
acclimation period (adaptative transfers after 48 or 72 h) both with and without lactose. No
biodegradation was observed in a river die-away study after a 21 days of acclimation without co-
metabolite (Mudder, 1982).
Under aerobic conditions, in column experiments, no biodegradation of PER was observed over
25 weeks at 20°C, or over 2 years at 22-23°C, using a bacterial inoculum from a primary sewage
effluent (Bouwer et al, 1981a; Bouwer and McCarty, 1982).
PER was shown to be significantly biodegradable after 7 days of incubation at 25°C in the dark or
using a static-culture biodegradation test in closed vials with an enriched domestic waste. Gradual
adaptation was observed in three weekly subcultures, with degradation increasing from 30-45% to
84-87% over 7 days. The volatilisation loss from the glass-stoppered vials was 16-23% over 10 days
at 25°C (Tabak et al, 1981).
Wilson et al (1983a,b) did not find evidence of degradation of PER (initial concentration 600-800 µg/l)
in a static microcosm made up with aerobic subsurface material sampled from subsurface positions
immediately above and below a shallow water-table aquifer at sites in Oklahoma and Los Angeles.
In several studies using pure cultures of propylene-grown Xanthobacter sp. and ammonia-oxidising
bacteria or using mixed-cultured methane-utilising microbes, degradation of several chlorinated

24 ECETOC Joint Assessment of Commodity Chemicals No. 39
ethenes (trichloroethylene, dichloroethylene, vinyl chloride) was observed; PER, however, did not
degrade under these conditions (Ensign et al, 1992; Fogel et al, 1986; Vannelli et al, 1990).
Different results were obtained by Phelps et al (1991) who claimed a 60% decrease in initial PER
concentration within 21 days in an aerobic packed-bed column. The results could not be explained by
the investigators, who suggested the presence of anaerobic "microniches" in the column bed.
Schwarzenbach et al (1983) studied the concentration profile of micropollutants during infiltration of
river water to groundwater. They found no degradation of PER during the mostly aerobic process.
During the monitoring time of one year one of the sampling wells had oxygen concentrations of
1-2 mg/l for approximately 2 months. These low oxygen concentrations were probably still too high to
create the appropriate anaerobic degradation conditions. On the other hand, a slow rate of aerobic
degradation of PER has been demonstrated in 3 different soil types (Loch et al, 1986).
Anaerobic Conditions
Under methanogenic, strictly anaerobic conditions, PER is dechlorinated to trichloroethylene, 1,2-cis-
and 1,2-trans-dichloroethylene and vinyl chloride. Theoretically, the reduction of PER can proceed to
ethane. In addition, PER was partially mineralised to carbon dioxide (Table7).
Several sources for active inocula are mentioned in the literature; contaminated aquifer, sub-surface
soil, sediment and anaerobic sludge from waste-water treatment plants. Anaerobic bacteria of two
Methanosarcina strains and strain DCB-1 have been shown to be effective in PER dechlorination
during methanogenesis, in the presence of an additional carbon substrate. It is assumed that
electrons are transferred to PER via an electron carrier involved in the biosynthesis of methane
(Fathepure and Boyd, 1988).
The dechlorination of PER is promoted by different factors:
■ the presence of methanogenic and acetogenic bacteria
■ adaptation time of several months
■ incubation over several months at 25 - 35°C
■ redox potential below −150 mV (methane producing, sulphate reducing conditions)
■ concentrations of intermediates (lower chlorinated ethylenes and ethylene) which do not suppress
methanogenic activity
■ cofactors such as electron donors, co-pollutants and carbon source.

Tetrachloroethylene 25
Conclusion
Anaerobic conditions appear to be essential for the biodegradation of PER, given the fact that almost
all studies under aerobic conditions, including microcosms of subsurface soil and methane utilising
bacteria, failed to demonstrate biodegradation.
Methanogenic bacteria are an important class of anaerobic bacteria for the biodegradation of PER by
virtue of their extreme diversity of habitat and the fact that they are likely to be present in a variety of
environments where PER occurs as a contaminant.
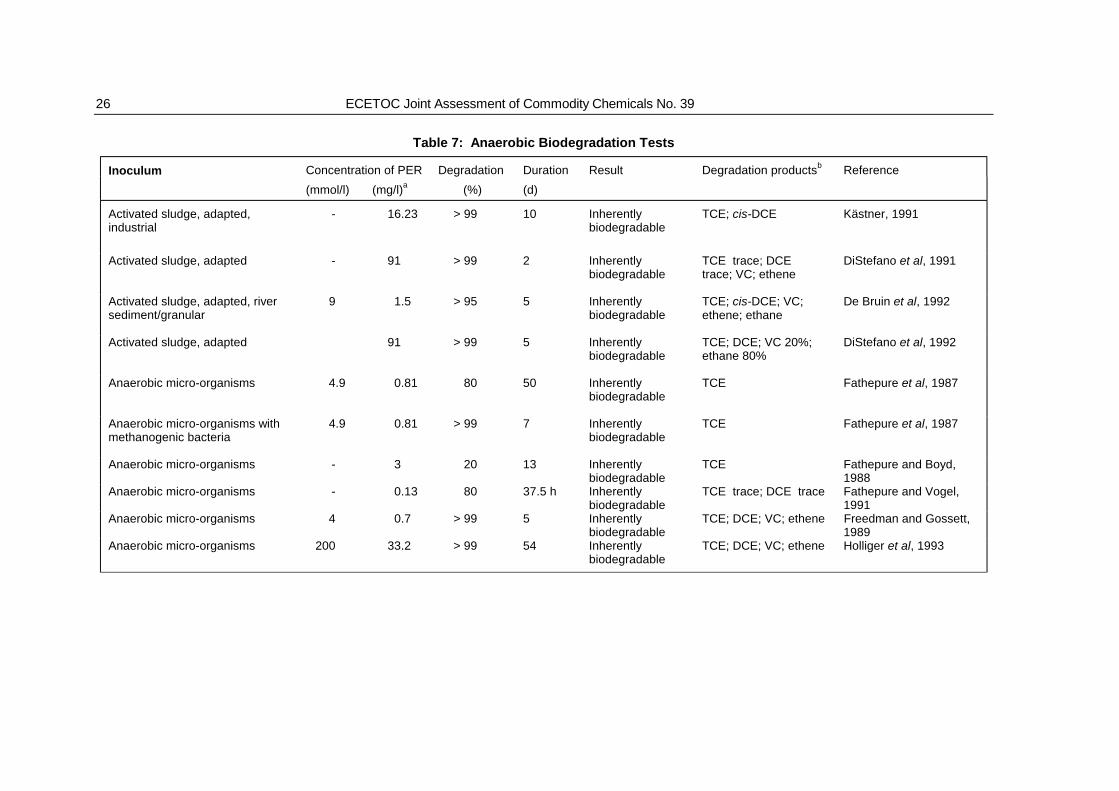
26 ECETOC Joint Assessment of Commodity Chemicals No. 39
Table 7: Anaerobic Biodegradation Tests
Concentration of PER Degradation Duration Result Degradation productsb ReferenceInoculum
(mmol/l) (mg/l)a (%) (d)
Activated sludge, adapted,industrial
- 16.23 > 99 10 Inherentlybiodegradable
TCE; cis-DCE Kästner, 1991
Activated sludge, adapted - 91 > 99 2 Inherentlybiodegradable
TCE trace; DCE trace; VC; ethene
DiStefano et al, 1991
Activated sludge, adapted, riversediment/granular
9 1.5 > 95 5 Inherentlybiodegradable
TCE; cis-DCE; VC;ethene; ethane
De Bruin et al, 1992
Activated sludge, adapted 91 > 99 5 Inherentlybiodegradable
TCE; DCE; VC 20%;ethane 80%
DiStefano et al, 1992
Anaerobic micro-organisms 4.9 0.81 80 50 Inherentlybiodegradable
TCE Fathepure et al, 1987
Anaerobic micro-organisms withmethanogenic bacteria
4.9 0.81 > 99 7 Inherentlybiodegradable
TCE Fathepure et al, 1987
Anaerobic micro-organisms - 3 20 13 Inherentlybiodegradable
TCE Fathepure and Boyd,1988
Anaerobic micro-organisms - 0.13 80 37.5 h Inherentlybiodegradable
TCE trace; DCE trace Fathepure and Vogel,1991
Anaerobic micro-organisms 4 0.7 > 99 5 Inherentlybiodegradable
TCE; DCE; VC; ethene Freedman and Gossett,1989
Anaerobic micro-organisms 200 33.2 > 99 54 Inherentlybiodegradable
TCE; DCE; VC; ethene Holliger et al, 1993
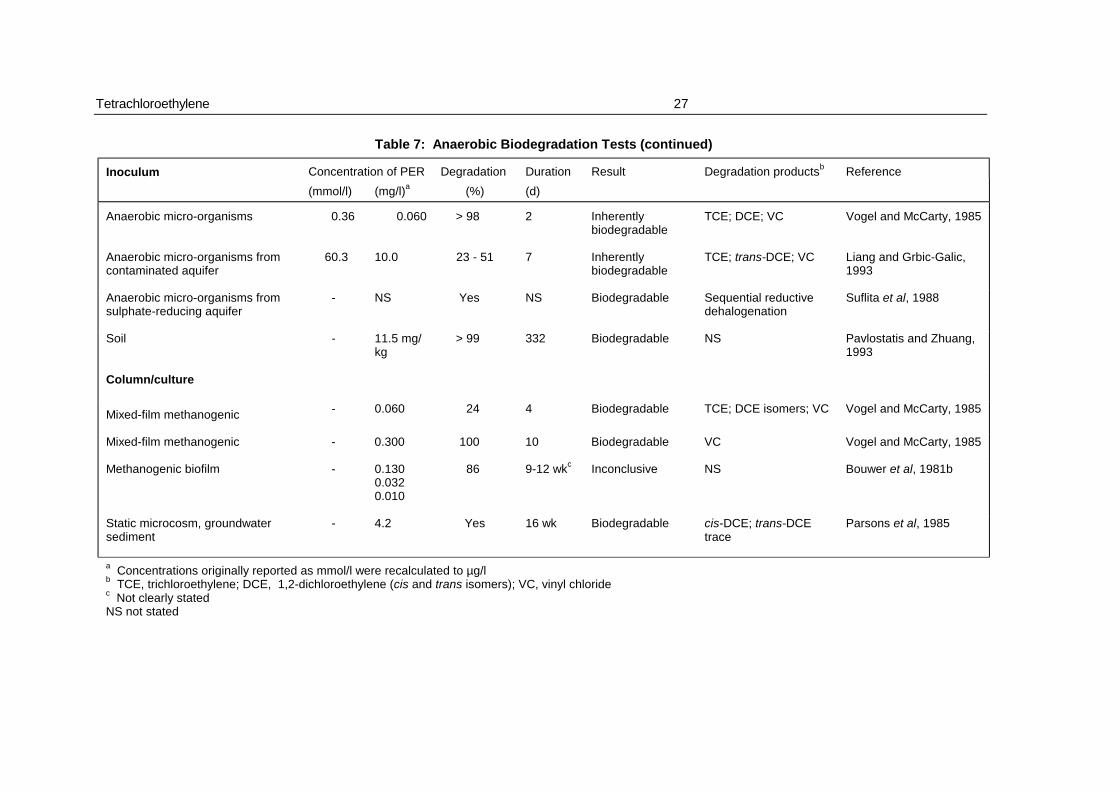
Tetrachloroethylene 27
Table 7: Anaerobic Biodegradation Tests (continued)
Concentration of PER Degradation Duration Result Degradation productsb ReferenceInoculum
(mmol/l) (mg/l)a (%) (d)
Anaerobic micro-organisms 0.36 0.060 > 98 2 Inherentlybiodegradable
TCE; DCE; VC Vogel and McCarty, 1985
Anaerobic micro-organisms fromcontaminated aquifer
60.3 10.0 23 - 51 7 Inherentlybiodegradable
TCE; trans-DCE; VC Liang and Grbic-Galic,1993
Anaerobic micro-organisms fromsulphate-reducing aquifer
- NS Yes NS Biodegradable Sequential reductivedehalogenation
Suflita et al, 1988
Soil - 11.5 mg/kg
> 99 332 Biodegradable NS Pavlostatis and Zhuang,1993
Column/culture
Mixed-film methanogenic - 0.060 24 4 Biodegradable TCE; DCE isomers; VC Vogel and McCarty, 1985
Mixed-film methanogenic - 0.300 100 10 Biodegradable VC Vogel and McCarty, 1985
Methanogenic biofilm - 0.1300.0320.010
86 9-12 wkc Inconclusive NS Bouwer et al, 1981b
Static microcosm, groundwatersediment
- 4.2 Yes 16 wk Biodegradable cis-DCE; trans-DCEtrace
Parsons et al, 1985
a Concentrations originally reported as mmol/l were recalculated to µg/lb TCE, trichloroethylene; DCE, 1,2-dichloroethylene (cis and trans isomers); VC, vinyl chloridec Not clearly statedNS not stated
28 ECETOC Joint Assessment of Commodity Chemicals No. 39
4.2.5 Bioaccumulation
Given the octanol-water partition coefficient of 2.53-2.88 (log Pow in Table 1), no significant
bioaccumulation of PER is expected. Its volatility and high depuration rate will reduce the probability
that bioaccumulation will occur.
There are only few experimental data concerning the bioconcentration of PER. In freshwater fish,
bioconcentration factors ranged from 40 in rainbow trout (Oncorhynchus mykiss) (Neely et al, 1974) to
49 in bluegill sunfish (Lepomis macrochirus) (Barrows et al, 1980). The depuration rate (t1/2) in the
bluegill sunfish was < 1 day (Barrows et al, 1980). In carp (Cyprinus carpio) exposed to 0.1 mg PER/l,
a bioconcentration factor (BCF) of 26 to 77 was determined after 56 days (CITI, 1992). Kenaga
(1980) proposed a theoretical BCF of 31 predicted from the water solubility.
Bioconcentration factors for PER in sea-water have been estimated to be < 100 in different biota such
as fish liver, bird's eggs and seal blubber. The concentration found in the liver of dabs was 40-
60 times higher than in the flesh (Pearson and McConnell, 1975).
PER concentrations in marine algae and plankton have been shown to be up to 180 times higher than
in sea-water (Bauer, 1981a).
There is no evidence of biomagnification of PER along the food chain.
4.2.6 Evaluation
The half-life of PER in the atmosphere is approximately 3 months.
The major degradation product is believed to be phosgene, which will be taken up by cloud, rain or
ocean water and hydrolysed to CO2 and HCl. TCAC may be a minor breakdown product. If formed, it
will be hydrolysed to TCA and HCl. The contribution of PER to the TCA levels observed in
precipitation is highly uncertain, but it may be a significant part of the total. The acids (HCl and
possibly TCA) arising from the degradation of PER will end up in rain or sea-water, but the contribution
of PER to "acid rain" will be negligible. Photolysis of TCAC may lead to extremely low overall yields of
carbon tetrachloride.
PER does not contribute significantly to tropospheric ozone formation or stratospheric ozone depletion.
In surface water, the evaporation half-life of PER varies from a few days to 1 month, depending on
water movement, depth and wind speed. Degradation, either through hydrolysis or photochemically
induced reactions, is believed to be limited.
Tetrachloroethylene 29
In sediment and soil PER is fairly mobile and can leach into ground-water. Under these conditions no
physico-chemical breakdown has been observed.
PER is not readily biodegradable under standard test conditions. Study results on the aerobic
degradation of PER are ambiguous and seem to demonstrate that PER is refractory to aerobic
degradation. Under methanogenic, strictly anaerobic conditions, dechlorination and partial
mineralisation has been observed.
Bioaccumulation of PER is limited due to its high volatility and high depuration rate. Concentrations in
aquatic organisms, with the exception of marine algae and plankton, do not exceed water
concentrations by a factor of > 100.
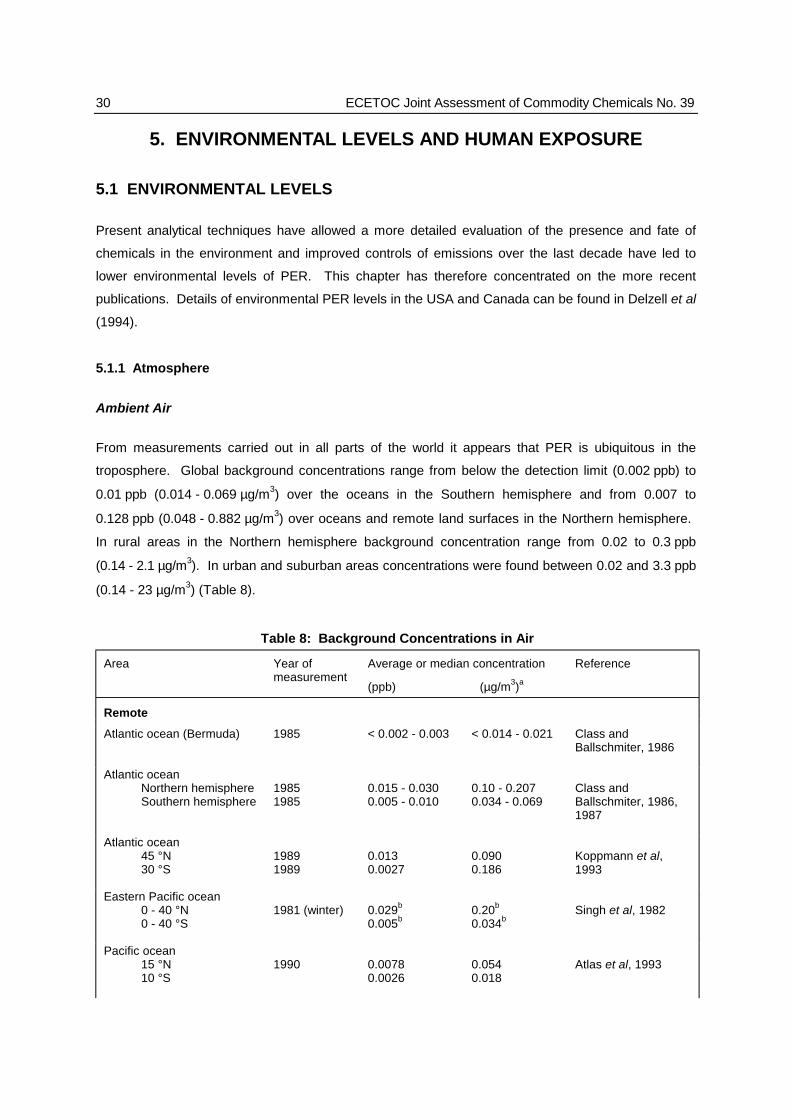
30 ECETOC Joint Assessment of Commodity Chemicals No. 39
5. ENVIRONMENTAL LEVELS AND HUMAN EXPOSURE
5.1 ENVIRONMENTAL LEVELS
Present analytical techniques have allowed a more detailed evaluation of the presence and fate of
chemicals in the environment and improved controls of emissions over the last decade have led to
lower environmental levels of PER. This chapter has therefore concentrated on the more recent
publications. Details of environmental PER levels in the USA and Canada can be found in Delzell et al
(1994).
5.1.1 Atmosphere
Ambient Air
From measurements carried out in all parts of the world it appears that PER is ubiquitous in the
troposphere. Global background concentrations range from below the detection limit (0.002 ppb) to
0.01 ppb (0.014 - 0.069 µg/m3) over the oceans in the Southern hemisphere and from 0.007 to
0.128 ppb (0.048 - 0.882 µg/m3) over oceans and remote land surfaces in the Northern hemisphere.
In rural areas in the Northern hemisphere background concentration range from 0.02 to 0.3 ppb
(0.14 - 2.1 µg/m3). In urban and suburban areas concentrations were found between 0.02 and 3.3 ppb
(0.14 - 23 µg/m3) (Table 8).
Table 8: Background Concentrations in Air
Area Year ofmeasurement
Average or median concentration
(ppb) (µg/m3)a
Reference
Remote
Atlantic ocean (Bermuda) 1985 < 0.002 - 0.003 < 0.014 - 0.021 Class andBallschmiter, 1986
Atlantic oceanNorthern hemisphereSouthern hemisphere
19851985
0.015 - 0.0300.005 - 0.010
0.10 - 0.2070.034 - 0.069
Class andBallschmiter, 1986,1987
Atlantic ocean45 °N30 °S
19891989
0.0130.0027
0.0900.186
Koppmann et al,1993
Eastern Pacific ocean0 - 40 °N0 - 40 °S
1981 (winter) 0.029b
0.005b0.20b
0.034bSingh et al, 1982
Pacific ocean15 °N10 °S
1990 0.00780.0026
0.0540.018
Atlas et al, 1993

Tetrachloroethylene 31
Hokkaido (Japan) 1979-1986 < 0.025 < 0.17 Makide et al, 1987

32 ECETOC Joint Assessment of Commodity Chemicals No. 39
Table 8: Background Concentrations in Air (continued)
Area Year ofmeasurement
Average or median concentration
(ppb) (µg/m3)a
Reference
Northern hemisphere30 - 90 °N0 - 30 °N
1982-890.0210.007
0.1450.05
Wiedmann et al, 1994
Southern hemisphere0-90 °S
1982-89 0.002 0.014 Wiedmann et al, 1994
Arctic ocean (Norway) 1981-1983 0.075 - 0.081 0.52 - 0.56 Khalil and Rasmussen,1983; Hov et al, 1984
Point Barrow (Alaska) 1981 0.056 - 0.128 0.386 - 0.882 Khalil and Rasmussen,1983
Subarctic central andeastern Canada
1990 0.012 0.083 Wofsy et al, 1994
Madeira, remote oceanicsite
1988 0.043 0.296 Frank et al, 1991
Rural
South Germany, Asch 1985 0.029 - 0.26 0.20 - 1.8 Güthner et al, 1990
Germany, Berchtesgaden 1990 0.022 (summer) 0.15 Frank et al, 1990
Germany, Black Forest 1990 0.15 (≤ 1.5)b 1.0 (≤ 10)b Frank et al, 1990
Germany, unknown < 1989 0.1 - 0.3 0.69 - 2.1 UBA, 1989
Germany, Hochgrat Alps,860 m altitude
1982 0.016b 0.11b Kirschner andBallschmiter, 1983
Netherlands, Isle ofTerschelling
1980-1981 0.1 (0.6)b 0.69 (4.1)b Guicherit andScholting, 1985
Netherlands, countryside 1991 0.02 - 0.06 0.14 - 0.41 RIVM, 1993
France, Bretagne 1985 0.02 - 0.027 0.14 - 0.186 Ballschmiter et al,1987; Hecht et al, 1987
France < 1992 0.0004 0.003 Bouchereau, 1992
Finland, countryside 1987 Not detectable - Kroneld, 1989a
Madeira 1982 0.09 - 0.027 0.62 - 0.186 Kirschner andBallschmiter, 1983
Azores, Sao Miguel, 510 maltitude
1982 0.014 0.096 Kirschner andBallschmiter, 1983
USA, 577 sites < 1986 0.16 1.1 Eichler and Mackay,1986
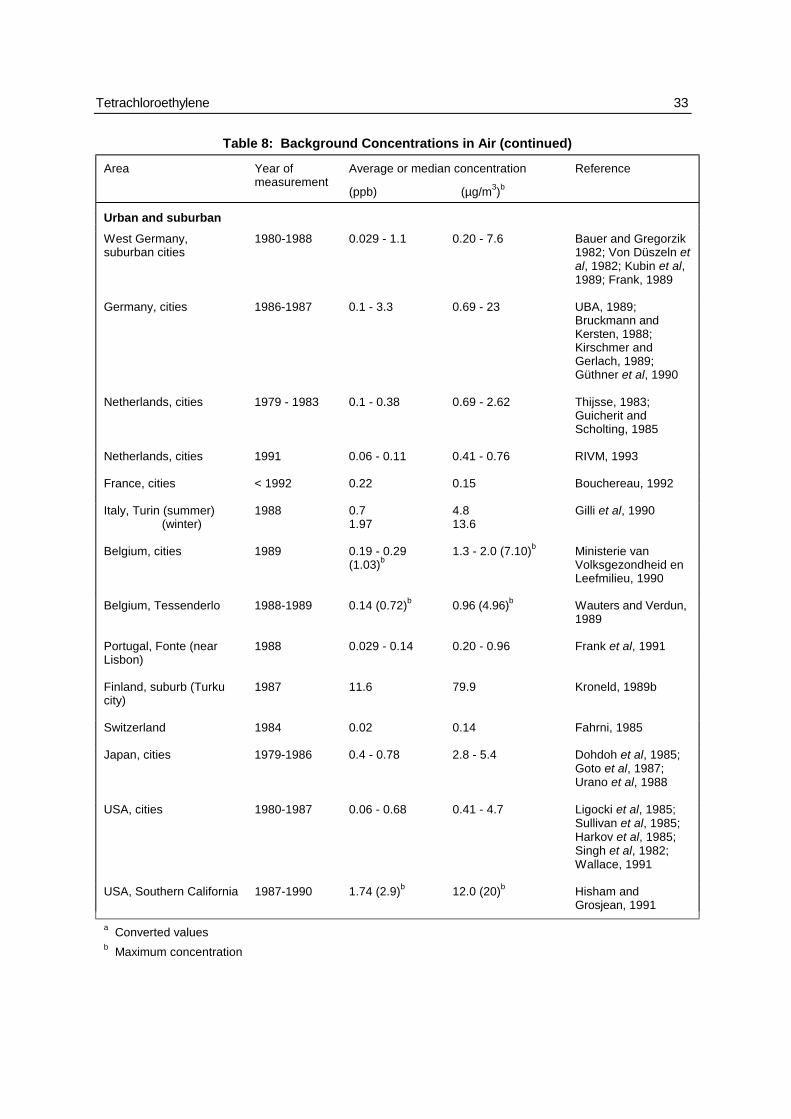
Tetrachloroethylene 33
Table 8: Background Concentrations in Air (continued)
Area Year ofmeasurement
Average or median concentration
(ppb) (µg/m3)b
Reference
Urban and suburban
West Germany,suburban cities
1980-1988 0.029 - 1.1 0.20 - 7.6 Bauer and Gregorzik1982; Von Düszeln etal, 1982; Kubin et al,1989; Frank, 1989
Germany, cities 1986-1987 0.1 - 3.3 0.69 - 23 UBA, 1989;Bruckmann andKersten, 1988;Kirschmer andGerlach, 1989;Güthner et al, 1990
Netherlands, cities 1979 - 1983 0.1 - 0.38 0.69 - 2.62 Thijsse, 1983;Guicherit andScholting, 1985
Netherlands, cities 1991 0.06 - 0.11 0.41 - 0.76 RIVM, 1993
France, cities < 1992 0.22 0.15 Bouchereau, 1992
Italy, Turin (summer)(winter)
1988 0.71.97
4.813.6
Gilli et al, 1990
Belgium, cities 1989 0.19 - 0.29(1.03)b
1.3 - 2.0 (7.10)b Ministerie vanVolksgezondheid enLeefmilieu, 1990
Belgium, Tessenderlo 1988-1989 0.14 (0.72)b 0.96 (4.96)b Wauters and Verdun,1989
Portugal, Fonte (nearLisbon)
1988 0.029 - 0.14 0.20 - 0.96 Frank et al, 1991
Finland, suburb (Turkucity)
1987 11.6 79.9 Kroneld, 1989b
Switzerland 1984 0.02 0.14 Fahrni, 1985
Japan, cities 1979-1986 0.4 - 0.78 2.8 - 5.4 Dohdoh et al, 1985;Goto et al, 1987;Urano et al, 1988
USA, cities 1980-1987 0.06 - 0.68 0.41 - 4.7 Ligocki et al, 1985;Sullivan et al, 1985;Harkov et al, 1985;Singh et al, 1982;Wallace, 1991
USA, Southern California 1987-1990 1.74 (2.9)b 12.0 (20)b Hisham andGrosjean, 1991
a Converted valuesb Maximum concentration
34 ECETOC Joint Assessment of Commodity Chemicals No. 39
Makide et al (1987) observed seasonal variations in PER concentration in remote areas, with high
levels in winter and low levels in summer. The authors suggested that these variations were related to
seasonal differences in photochemical activity or differences in longitudinal transport of air masses.
Similar findings in urban and suburban areas were reported by Gilli et al (1990).
Emissions from industrial production or use of PER may give rise to higher local ambient air
concentrations. Average levels of 12 ppb (83 µg/m3) have been measured in industrial areas in the
former West Germany (Bauer and Gregorzik, 1982). In Finland, a level of 20 ppb (138 µg/m3) of PER
was measured in industrial air (Kroneld, 1989b). In the immediate surroundings of a production plant
in England in the 1970’s, levels were 15 - 40 ppb (103 - 276 µg/m3) (Pearson and McConnell, 1975).
Concentrations of 2.9 - 6.0 ppb (20 - 41 µg/m3) and 0.15 - 0.75 ppb (1.0 - 5.2 µg/m3) were measured
near production sites in Germany (Selenka and Bauer, 1984) and in Belgium (Wauters et al, 1989),
respectively.
Relatively high ambient air levels of PER have been measured in the vicinity of waste disposal sites.
For example, in New Jersey (USA) levels > 7 ppb (> 48 µg/m3) were found close to such a site
(Harkov et al, 1985).
Measurements in the Netherlands showed that under unfavourable climatological and various
operating conditions of a dry-cleaning shop, the closest neighbours could be exposed to an average
level of up to 23 ppb (158.5 µg/m3) PER during the hours of maximum processing activity (Monster
and Smolders, 1984). PER levels were reported to be as high as 300 - 1,000 ppb (2,067 -
6,890 µg/m3) near dry-cleaning shops in the former West Germany (Czaplenski et al, 1988; Reinhard
et al, 1989). During working hours, the average concentration of PER measured immediately outside
8 dry-cleaning shops in Essen (Germany) during 1987-88 was 45 ppb (range 4 - 145 ppb) (310; range
28 - 999 µg/m3) and 11 ppb (range 1 - 49 ppb) (76; range 6.9 - 338 µg/m3) at the opposite side of the
street (Beier et al, 1989). In the USA (New York State), average concentrations of 940 µg/m3
(136 ppb) were measured outside dry-cleaning shops using an (open) transfer system,. Outside dry-
to-dry cleaners (closed), the average concentration was 240 µg/m3 (34.8 ppb) (Schreiber et al, 1993)
(Table 9).

Tetrachloroethylene 35
Table 9: Ambient Air Concentrations near Dry-Cleaning Shops
Area Year ofmeasurement
Average concentration(ppb) (µg/m3)a
Reference
Netherlands, closestneighbourhood
1981-1984 ≤ 23 160 Monster and Smolders,1984
Germany < 1988 300 - 1,000 2,067 - 6,890 Czaplenski et al, 1988
Germany, Köln 1987-1989 3 - 138 Reinhard et al, 1989
Germany, Essen,Outside: 8 dry-cleaning shopsOpposite side of the street:
1987-19884 - 1451 - 49
28 - 9996.9 - 338
Beier et al, 1989
New York Stateoutside transfer cleaner:outside dry-to-dry cleaner:
199113634.8
≤ 940≤ 240
Schreiber et al, 1993
a Converted values
Precipitation
Rainwater and snow in general contain PER at concentrations of < 0.001 - 0.115 µg/l (Table 10).
Concentrations up to 0.15 µg/l PER were found in rainwater collected close to an industrial site with
organochlorine manufacture (Pearson and McConnell, 1975).
Table 10: Background Concentrations in Rainwater
Area Year ofmeasurement
Average concentration(µg/l)
Reference
UK, rainfall 1980 < 0.01 James et al, 1980
Germany, rural rainwater 1987-1989 < 0.001 - 0.024 Herrmann, 1987; Kubin et al,1989; Renner et al, 1990
Germany, mist 1988 0.080 Kubin et al, 1989
Netherlands, 4 locations 1983 < 0.005 Van de Meent et al, 1986
Switzerland, Dübendorf,rainwater
1985-1986 < 0.01 - 0.115 Czuczwa et al, 1988
Japan, Kobe area 1982 0.050 Tamaoki et al, 1983
USA, Los Angeles, rain/snow 1982 0.021 Kawamura and Kaplan, 1983
5.1.2 Surface Water
PER is a common contaminant of surface waters, with average background concentration levels of the
order of 0.0001 - 0.0021 µg/l in the open ocean and up to 0.43 µg/l in sea-water near the coast (up to
1.4 µg/l in Japan). Concentrations of PER in rivers may be higher, e.g. in western Europe levels of
0.004 - 2.5 µg/l were found (Table 11).
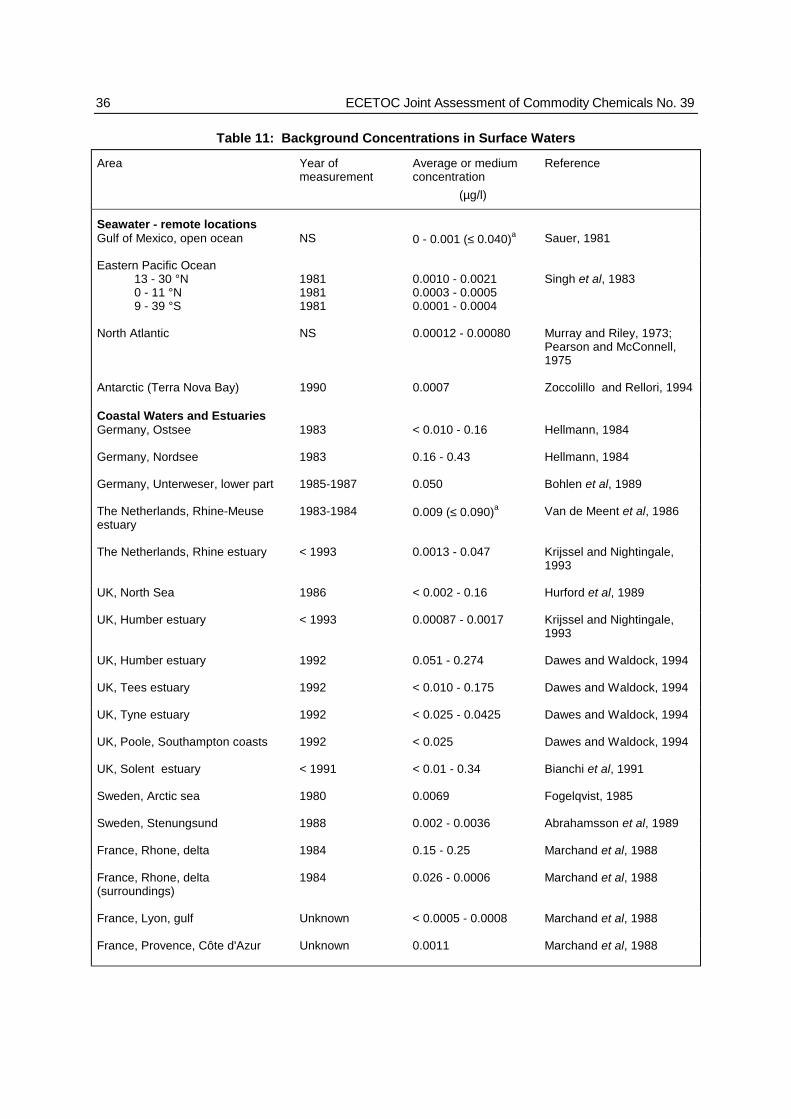
36 ECETOC Joint Assessment of Commodity Chemicals No. 39
Table 11: Background Concentrations in Surface Waters
Area Year ofmeasurement
Average or mediumconcentration
Reference
(µg/l)
Seawater - remote locationsGulf of Mexico, open ocean NS 0 - 0.001 (≤ 0.040)a Sauer, 1981
Eastern Pacific Ocean13 - 30 °N0 - 11 °N9 - 39 °S
198119811981
0.0010 - 0.00210.0003 - 0.00050.0001 - 0.0004
Singh et al, 1983
North Atlantic NS 0.00012 - 0.00080 Murray and Riley, 1973;Pearson and McConnell,1975
Antarctic (Terra Nova Bay) 1990 0.0007 Zoccolillo and Rellori, 1994
Coastal Waters and EstuariesGermany, Ostsee 1983 < 0.010 - 0.16 Hellmann, 1984
Germany, Nordsee 1983 0.16 - 0.43 Hellmann, 1984
Germany, Unterweser, lower part 1985-1987 0.050 Bohlen et al, 1989
The Netherlands, Rhine-Meuseestuary
1983-1984 0.009 (≤ 0.090)a Van de Meent et al, 1986
The Netherlands, Rhine estuary < 1993 0.0013 - 0.047 Krijssel and Nightingale,1993
UK, North Sea 1986 < 0.002 - 0.16 Hurford et al, 1989
UK, Humber estuary < 1993 0.00087 - 0.0017 Krijssel and Nightingale,1993
UK, Humber estuary 1992 0.051 - 0.274 Dawes and Waldock, 1994
UK, Tees estuary 1992 < 0.010 - 0.175 Dawes and Waldock, 1994
UK, Tyne estuary 1992 < 0.025 - 0.0425 Dawes and Waldock, 1994
UK, Poole, Southampton coasts 1992 < 0.025 Dawes and Waldock, 1994
UK, Solent estuary < 1991 < 0.01 - 0.34 Bianchi et al, 1991
Sweden, Arctic sea 1980 0.0069 Fogelqvist, 1985
Sweden, Stenungsund 1988 0.002 - 0.0036 Abrahamsson et al, 1989
France, Rhone, delta 1984 0.15 - 0.25 Marchand et al, 1988
France, Rhone, delta(surroundings)
1984 0.026 - 0.0006 Marchand et al, 1988
France, Lyon, gulf Unknown < 0.0005 - 0.0008 Marchand et al, 1988
France, Provence, Côte d'Azur Unknown 0.0011 Marchand et al, 1988
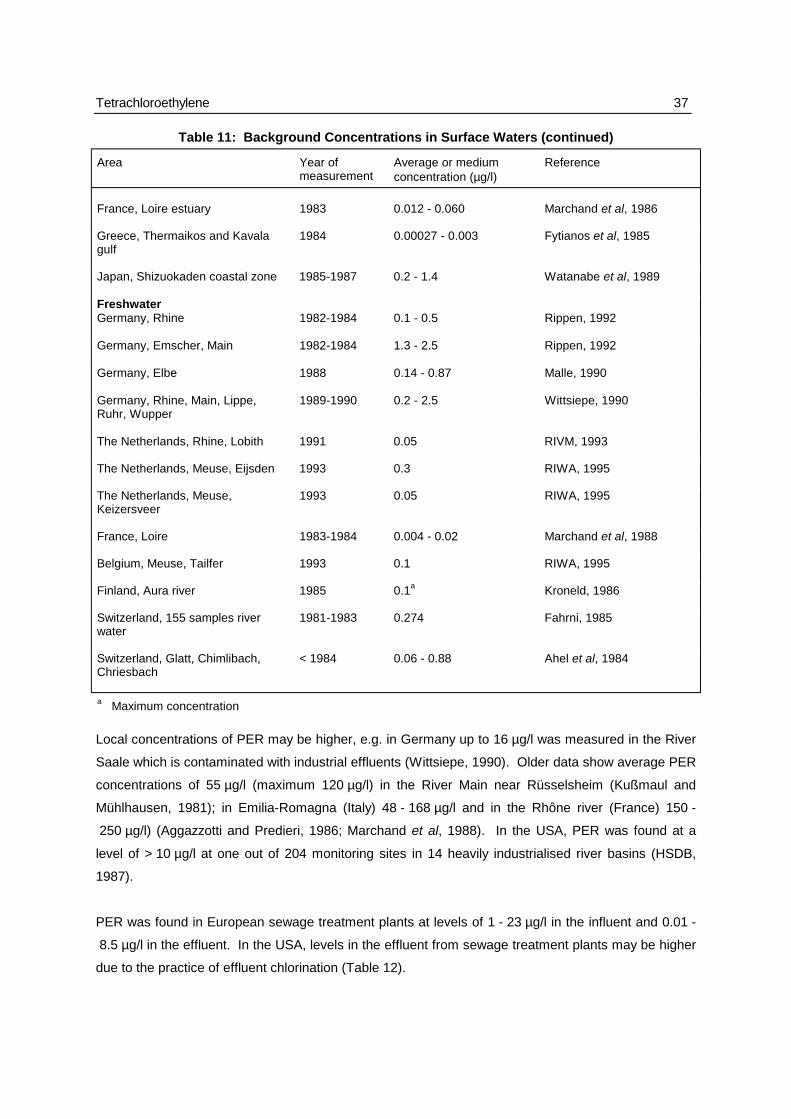
Tetrachloroethylene 37
Table 11: Background Concentrations in Surface Waters (continued)
Area Year ofmeasurement
Average or mediumconcentration (µg/l)
Reference
France, Loire estuary 1983 0.012 - 0.060 Marchand et al, 1986
Greece, Thermaikos and Kavalagulf
1984 0.00027 - 0.003 Fytianos et al, 1985
Japan, Shizuokaden coastal zone 1985-1987 0.2 - 1.4 Watanabe et al, 1989
FreshwaterGermany, Rhine 1982-1984 0.1 - 0.5 Rippen, 1992
Germany, Emscher, Main 1982-1984 1.3 - 2.5 Rippen, 1992
Germany, Elbe 1988 0.14 - 0.87 Malle, 1990
Germany, Rhine, Main, Lippe,Ruhr, Wupper
1989-1990 0.2 - 2.5 Wittsiepe, 1990
The Netherlands, Rhine, Lobith 1991 0.05 RIVM, 1993
The Netherlands, Meuse, Eijsden 1993 0.3 RIWA, 1995
The Netherlands, Meuse,Keizersveer
1993 0.05 RIWA, 1995
France, Loire 1983-1984 0.004 - 0.02 Marchand et al, 1988
Belgium, Meuse, Tailfer 1993 0.1 RIWA, 1995
Finland, Aura river 1985 0.1a Kroneld, 1986
Switzerland, 155 samples riverwater
1981-1983 0.274 Fahrni, 1985
Switzerland, Glatt, Chimlibach,Chriesbach
< 1984 0.06 - 0.88 Ahel et al, 1984
a Maximum concentration
Local concentrations of PER may be higher, e.g. in Germany up to 16 µg/l was measured in the River
Saale which is contaminated with industrial effluents (Wittsiepe, 1990). Older data show average PER
concentrations of 55 µg/l (maximum 120 µg/l) in the River Main near Rüsselsheim (Kußmaul and
Mühlhausen, 1981); in Emilia-Romagna (Italy) 48 - 168 µg/l and in the Rhône river (France) 150 -
250 µg/l) (Aggazzotti and Predieri, 1986; Marchand et al, 1988). In the USA, PER was found at a
level of > 10 µg/l at one out of 204 monitoring sites in 14 heavily industrialised river basins (HSDB,
1987).
PER was found in European sewage treatment plants at levels of 1 - 23 µg/l in the influent and 0.01 -
8.5 µg/l in the effluent. In the USA, levels in the effluent from sewage treatment plants may be higher
due to the practice of effluent chlorination (Table 12).
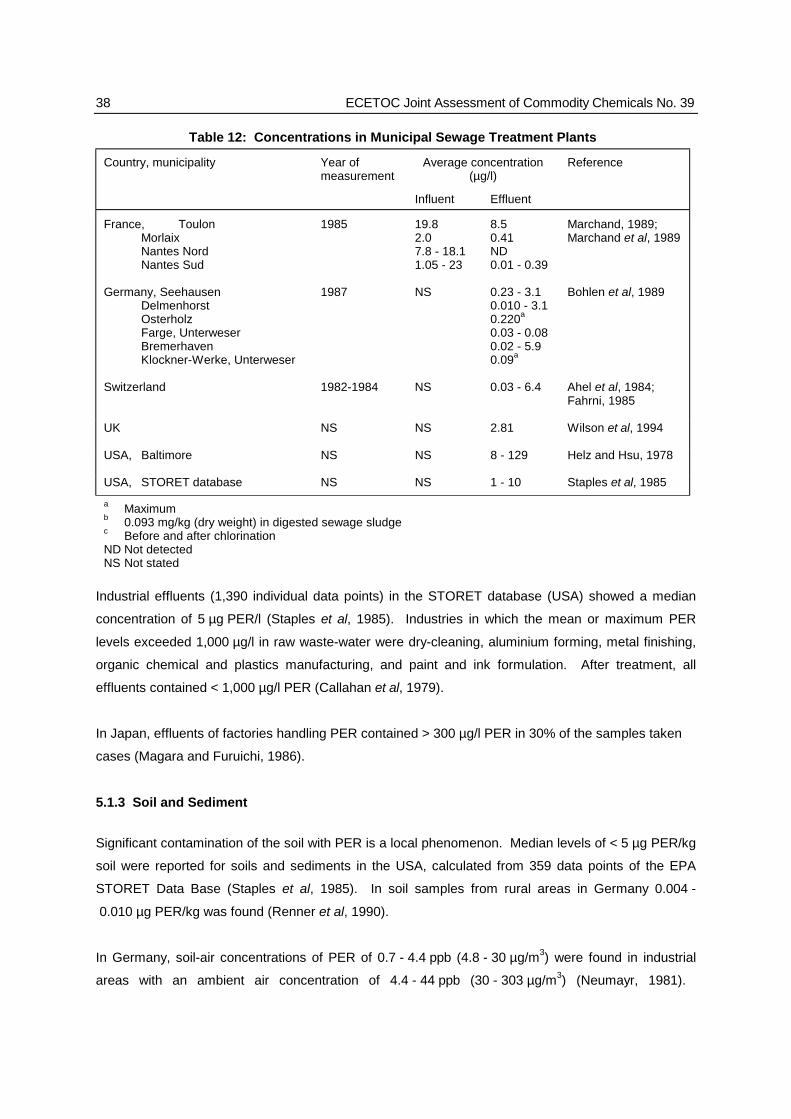
38 ECETOC Joint Assessment of Commodity Chemicals No. 39
Table 12: Concentrations in Municipal Sewage Treatment Plants
Country, municipality Year ofmeasurement
Average concentration(µg/l)
Reference
Influent Effluent
France, ToulonMorlaixNantes NordNantes Sud
1985 19.82.07.8 - 18.11.05 - 23
8.50.41ND0.01 - 0.39
Marchand, 1989;Marchand et al, 1989
Germany, SeehausenDelmenhorstOsterholzFarge, UnterweserBremerhavenKlockner-Werke, Unterweser
1987 NS 0.23 - 3.1 0.010 - 3.10.220a 0.03 - 0.080.02 - 5.90.09a
Bohlen et al, 1989
Switzerland 1982-1984 NS 0.03 - 6.4 Ahel et al, 1984;Fahrni, 1985
UK NS NS 2.81 Wilson et al, 1994
USA, Baltimore NS NS 8 - 129 Helz and Hsu, 1978
USA, STORET database NS NS 1 - 10 Staples et al, 1985
a Maximumb 0.093 mg/kg (dry weight) in digested sewage sludgec Before and after chlorinationND Not detectedNS Not stated
Industrial effluents (1,390 individual data points) in the STORET database (USA) showed a median
concentration of 5 µg PER/l (Staples et al, 1985). Industries in which the mean or maximum PER
levels exceeded 1,000 µg/l in raw waste-water were dry-cleaning, aluminium forming, metal finishing,
organic chemical and plastics manufacturing, and paint and ink formulation. After treatment, all
effluents contained < 1,000 µg/l PER (Callahan et al, 1979).
In Japan, effluents of factories handling PER contained > 300 µg/l PER in 30% of the samples taken
cases (Magara and Furuichi, 1986).
5.1.3 Soil and Sediment
Significant contamination of the soil with PER is a local phenomenon. Median levels of < 5 µg PER/kg
soil were reported for soils and sediments in the USA, calculated from 359 data points of the EPA
STORET Data Base (Staples et al, 1985). In soil samples from rural areas in Germany 0.004 -
0.010 µg PER/kg was found (Renner et al, 1990).
In Germany, soil-air concentrations of PER of 0.7 - 4.4 ppb (4.8 - 30 µg/m3) were found in industrial
areas with an ambient air concentration of 4.4 - 44 ppb (30 - 303 µg/m3) (Neumayr, 1981).
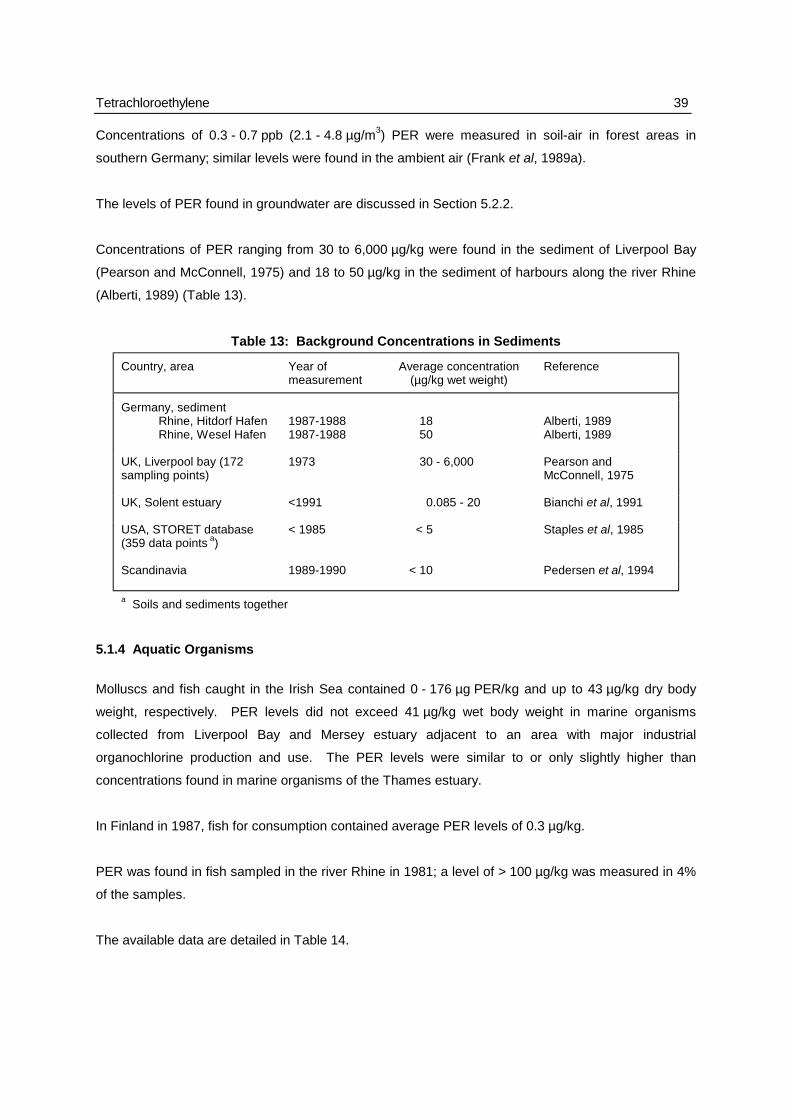
Tetrachloroethylene 39
Concentrations of 0.3 - 0.7 ppb (2.1 - 4.8 µg/m3) PER were measured in soil-air in forest areas in
southern Germany; similar levels were found in the ambient air (Frank et al, 1989a).
The levels of PER found in groundwater are discussed in Section 5.2.2.
Concentrations of PER ranging from 30 to 6,000 µg/kg were found in the sediment of Liverpool Bay
(Pearson and McConnell, 1975) and 18 to 50 µg/kg in the sediment of harbours along the river Rhine
(Alberti, 1989) (Table 13).
Table 13: Background Concentrations in Sediments
Country, area Year ofmeasurement
Average concentration(µg/kg wet weight)
Reference
Germany, sedimentRhine, Hitdorf HafenRhine, Wesel Hafen
1987-19881987-1988
1850
Alberti, 1989Alberti, 1989
UK, Liverpool bay (172sampling points)
1973 30 - 6,000 Pearson andMcConnell, 1975
UK, Solent estuary <1991 0.085 - 20 Bianchi et al, 1991
USA, STORET database(359 data points a)
< 1985 < 5 Staples et al, 1985
Scandinavia 1989-1990 < 10 Pedersen et al, 1994
a Soils and sediments together
5.1.4 Aquatic Organisms
Molluscs and fish caught in the Irish Sea contained 0 - 176 µg PER/kg and up to 43 µg/kg dry body
weight, respectively. PER levels did not exceed 41 µg/kg wet body weight in marine organisms
collected from Liverpool Bay and Mersey estuary adjacent to an area with major industrial
organochlorine production and use. The PER levels were similar to or only slightly higher than
concentrations found in marine organisms of the Thames estuary.
In Finland in 1987, fish for consumption contained average PER levels of 0.3 µg/kg.
PER was found in fish sampled in the river Rhine in 1981; a level of > 100 µg/kg was measured in 4%
of the samples.
The available data are detailed in Table 14.
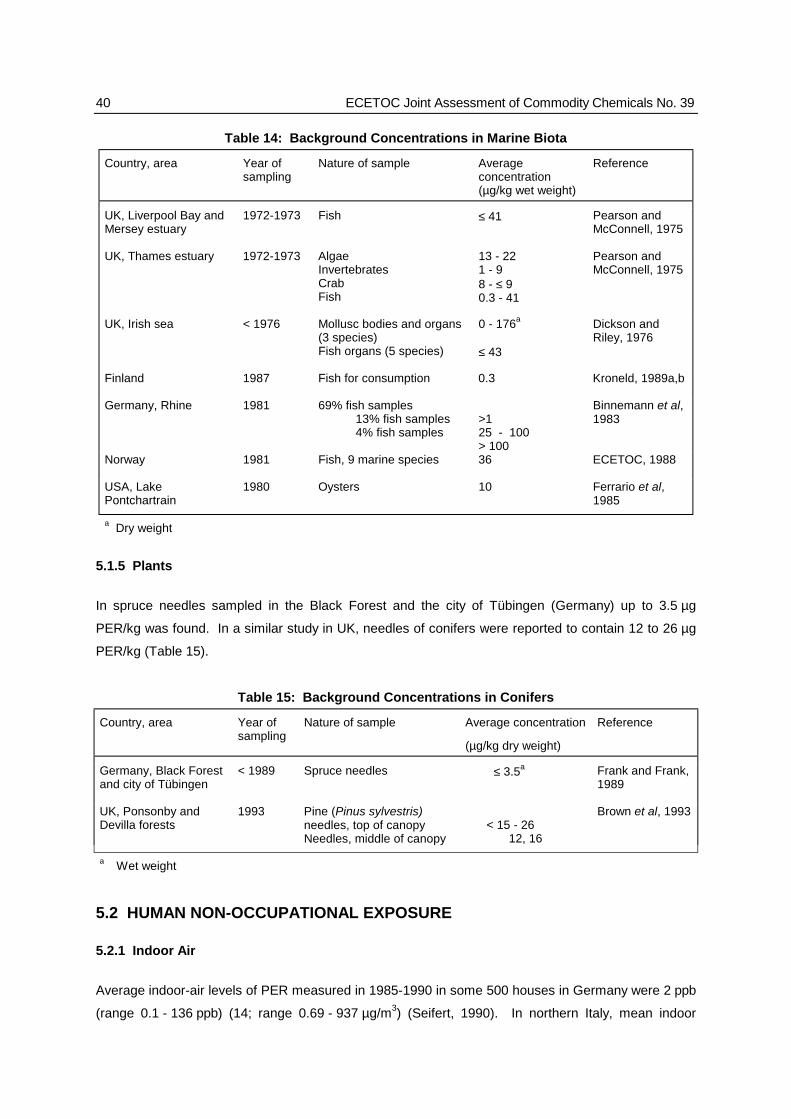
40 ECETOC Joint Assessment of Commodity Chemicals No. 39
Table 14: Background Concentrations in Marine Biota
Country, area Year ofsampling
Nature of sample Averageconcentration(µg/kg wet weight)
Reference
UK, Liverpool Bay andMersey estuary
1972-1973 Fish ≤ 41 Pearson andMcConnell, 1975
UK, Thames estuary 1972-1973 AlgaeInvertebratesCrabFish
13 - 221 - 98 - ≤ 90.3 - 41
Pearson andMcConnell, 1975
UK, Irish sea < 1976 Mollusc bodies and organs(3 species)Fish organs (5 species)
0 - 176a
≤ 43
Dickson andRiley, 1976
Finland 1987 Fish for consumption 0.3 Kroneld, 1989a,b
Germany, Rhine 1981 69% fish samples13% fish samples4% fish samples
>125 - 100> 100
Binnemann et al,1983
Norway 1981 Fish, 9 marine species 36 ECETOC, 1988
USA, LakePontchartrain
1980 Oysters 10 Ferrario et al,1985
a Dry weight
5.1.5 Plants
In spruce needles sampled in the Black Forest and the city of Tübingen (Germany) up to 3.5 µg
PER/kg was found. In a similar study in UK, needles of conifers were reported to contain 12 to 26 µg
PER/kg (Table 15).
Table 15: Background Concentrations in Conifers
Country, area Year ofsampling
Nature of sample Average concentration
(µg/kg dry weight)
Reference
Germany, Black Forestand city of Tübingen
< 1989 Spruce needles ≤ 3.5a Frank and Frank,1989
UK, Ponsonby andDevilla forests
1993 Pine (Pinus sylvestris)needles, top of canopyNeedles, middle of canopy
< 15 - 2612, 16
Brown et al, 1993
a Wet weight
5.2 HUMAN NON-OCCUPATIONAL EXPOSURE
5.2.1 Indoor Air
Average indoor-air levels of PER measured in 1985-1990 in some 500 houses in Germany were 2 ppb
(range 0.1 - 136 ppb) (14; range 0.69 - 937 µg/m3) (Seifert, 1990). In northern Italy, mean indoor
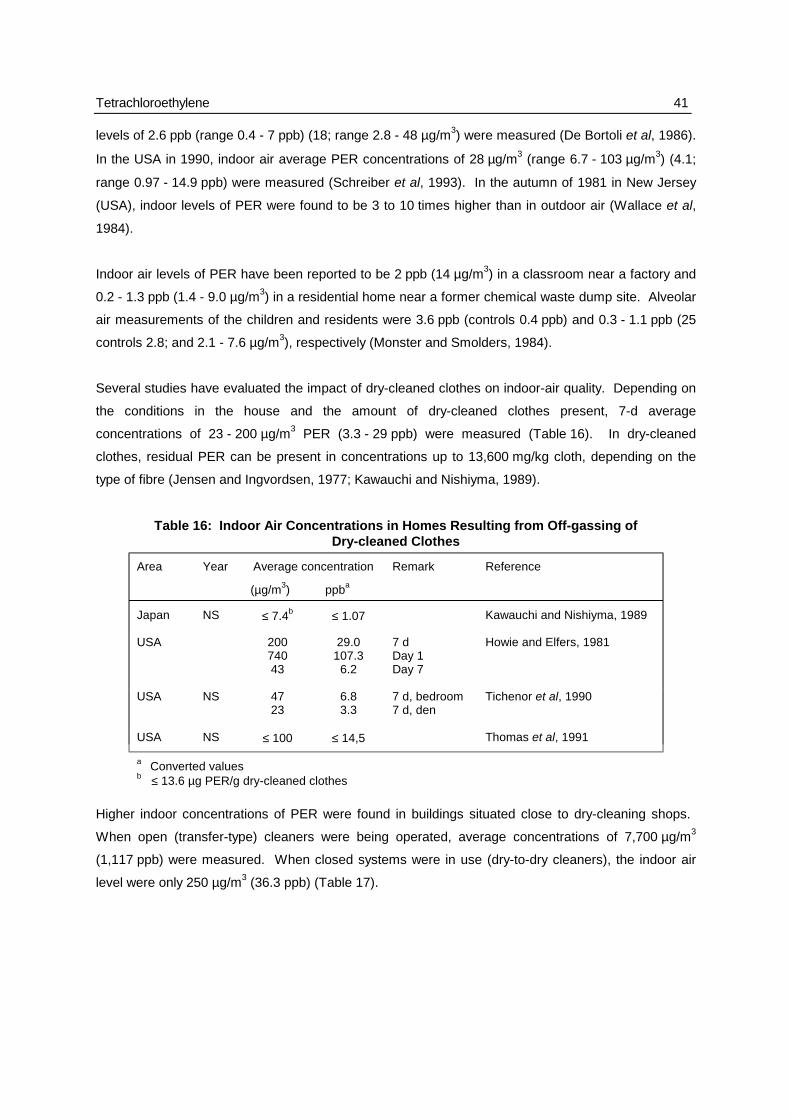
Tetrachloroethylene 41
levels of 2.6 ppb (range 0.4 - 7 ppb) (18; range 2.8 - 48 µg/m3) were measured (De Bortoli et al, 1986).
In the USA in 1990, indoor air average PER concentrations of 28 µg/m3 (range 6.7 - 103 µg/m3) (4.1;
range 0.97 - 14.9 ppb) were measured (Schreiber et al, 1993). In the autumn of 1981 in New Jersey
(USA), indoor levels of PER were found to be 3 to 10 times higher than in outdoor air (Wallace et al,
1984).
Indoor air levels of PER have been reported to be 2 ppb (14 µg/m3) in a classroom near a factory and
0.2 - 1.3 ppb (1.4 - 9.0 µg/m3) in a residential home near a former chemical waste dump site. Alveolar
air measurements of the children and residents were 3.6 ppb (controls 0.4 ppb) and 0.3 - 1.1 ppb (25
controls 2.8; and 2.1 - 7.6 µg/m3), respectively (Monster and Smolders, 1984).
Several studies have evaluated the impact of dry-cleaned clothes on indoor-air quality. Depending on
the conditions in the house and the amount of dry-cleaned clothes present, 7-d average
concentrations of 23 - 200 µg/m3 PER (3.3 - 29 ppb) were measured (Table 16). In dry-cleaned
clothes, residual PER can be present in concentrations up to 13,600 mg/kg cloth, depending on the
type of fibre (Jensen and Ingvordsen, 1977; Kawauchi and Nishiyma, 1989).
Table 16: Indoor Air Concentrations in Homes Resulting from Off-gassing ofDry-cleaned Clothes
Area Year Average concentration
(µg/m3) ppba
Remark Reference
Japan NS ≤ 7.4b ≤ 1.07 Kawauchi and Nishiyma, 1989
USA 20074043
29.0107.3
6.2
7 dDay 1Day 7
Howie and Elfers, 1981
USA NS 4723
6.83.3
7 d, bedroom7 d, den
Tichenor et al, 1990
USA NS ≤ 100 ≤ 14,5 Thomas et al, 1991
a Converted valuesb ≤ 13.6 µg PER/g dry-cleaned clothes
Higher indoor concentrations of PER were found in buildings situated close to dry-cleaning shops.
When open (transfer-type) cleaners were being operated, average concentrations of 7,700 µg/m3
(1,117 ppb) were measured. When closed systems were in use (dry-to-dry cleaners), the indoor air
level were only 250 µg/m3 (36.3 ppb) (Table 17).

42 ECETOC Joint Assessment of Commodity Chemicals No. 39
Table 17: Indoor Air Concentrations in Homes Near Dry-Cleaning Shops
Country, area Year Average concentration (ppba) (µg/m3)
Remark Reference
USA, New YorkState
1990 1,11736.3
7,700250
Above transfer cleanersAbove dry-to-dry cleaners
Schreiber et al,1993
Germany, Köln ≤ 1989 2.5 - 333 17 - 2,296 7 d, 5 homes Reinhard et al, 1989
Switzerland ≤ 1991 14.5 100 1 apartment Grob et al, 1991
a Converted values
In Italy, levels of PER ranging from 25 to 9,600 µg/m3 (3.6 - 1,392 ppb) have been found in 25 private
homes of dry-cleaners living far away from their dry-cleaning shops (Aggazzotti et al, 1994a,b). In
6 homes of dry-cleaning workers in the USA, indoor concentrations of 21 to 560 µg/m3 (3.0 - 81.2 ppb)
have been reported (Thompson and Evans, 1993).
Consumer exposure to PER may occur through the use of coin-operated Laundromats. The
concentration of PER in the air of the customer area of dry-cleaning shops equipped with coin-
operated dry cleaning machines was in the range of 36 - 39 ppm (248 - 269 mg/m3) (NIOSH, 1976;
Jensen and Ingvordsen, 1977). In another study in the USA, the average PER concentration was
9,000 µg/m3 (1,305 ppb) during the summer in 4 coin-operated laundry facilities (Michigan Department
of Public Health, 1979). In 6 coin-operated facilities in the USA, PER concentrations (average over
7 days) ranged from 900 to 10,350 µg/m3 (130.5 - 1,500 ppb) in 5 facilities and were as high as
59,340 µg/m3 (8,600 ppb) in the remaining facility (Howie and Elfers, 1981).
5.2.2 Drinking Water
A survey of all German water works from 1985-1986 showed that PER was present in 49% of the
drinking water supplies. The survey also showed that 14% of groundwater sources were
contaminated (Bauer, 1990). An older survey of 230 Dutch groundwater sources revealed that 37.5%
were contaminated; the concentration of PER had reached levels above 100 mg/l in 2 cases
(Trouwborst, 1981).
Groundwater used for drinking water in Switzerland and Italy contained concentrations of PER at
0.8 µg/l and 7.8 µg/l, respectively (Fahrni, 1985; Aggazzotti and Predieri, 1986).
PER was detected in 30% of shallow or deep drinking-water wells in urban areas of Japan; 4%
showed levels of PER in excess of 10 µg/l (Magara and Furuichi, 1986).
Details of the above studies and other data are presented in Table 18.
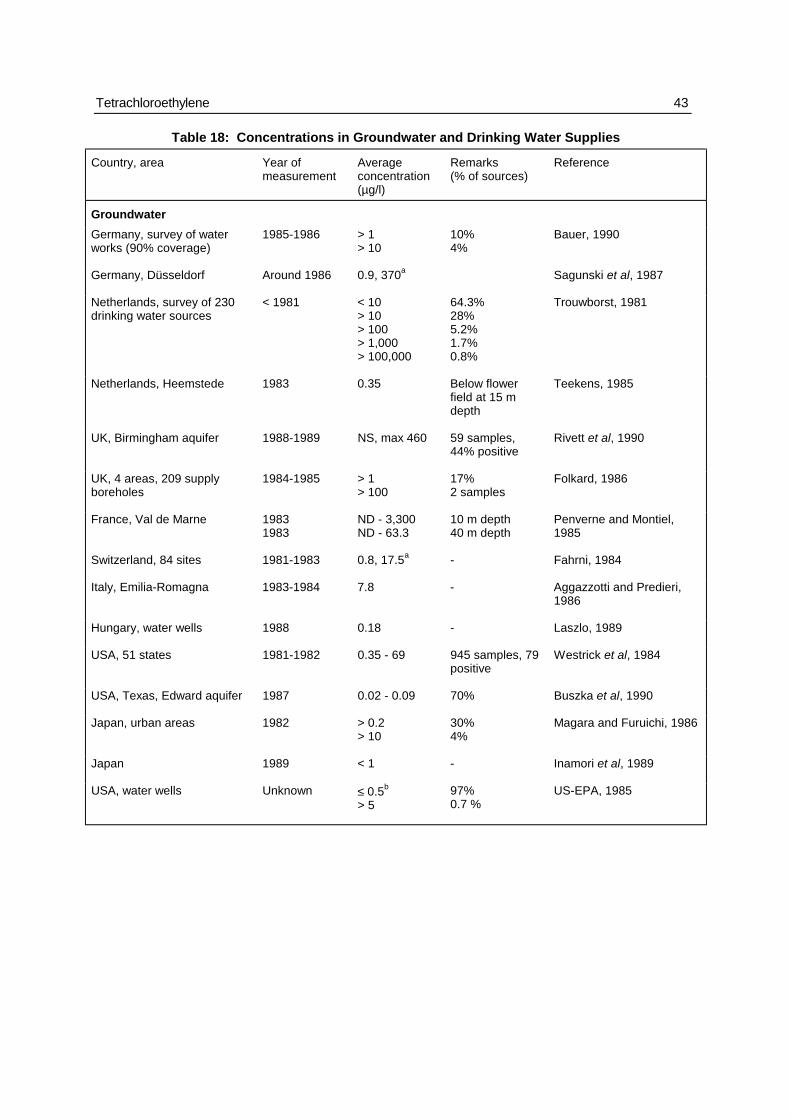
Tetrachloroethylene 43
Table 18: Concentrations in Groundwater and Drinking Water Supplies
Country, area Year ofmeasurement
Averageconcentration(µg/l)
Remarks(% of sources)
Reference
Groundwater
Germany, survey of waterworks (90% coverage)
1985-1986 > 1> 10
10%4%
Bauer, 1990
Germany, Düsseldorf Around 1986 0.9, 370a Sagunski et al, 1987
Netherlands, survey of 230drinking water sources
< 1981 < 10> 10> 100> 1,000> 100,000
64.3%28%5.2%1.7%0.8%
Trouwborst, 1981
Netherlands, Heemstede 1983 0.35 Below flowerfield at 15 mdepth
Teekens, 1985
UK, Birmingham aquifer 1988-1989 NS, max 460 59 samples,44% positive
Rivett et al, 1990
UK, 4 areas, 209 supplyboreholes
1984-1985 > 1> 100
17%2 samples
Folkard, 1986
France, Val de Marne 19831983
ND - 3,300ND - 63.3
10 m depth40 m depth
Penverne and Montiel,1985
Switzerland, 84 sites 1981-1983 0.8, 17.5a - Fahrni, 1984
Italy, Emilia-Romagna 1983-1984 7.8 - Aggazzotti and Predieri,1986
Hungary, water wells 1988 0.18 - Laszlo, 1989
USA, 51 states 1981-1982 0.35 - 69 945 samples, 79positive
Westrick et al, 1984
USA, Texas, Edward aquifer 1987 0.02 - 0.09 70% Buszka et al, 1990
Japan, urban areas 1982 > 0.2> 10
30%4%
Magara and Furuichi, 1986
Japan 1989 < 1 - Inamori et al, 1989
USA, water wells Unknown ≤ 0.5b
> 597%0.7 %
US-EPA, 1985
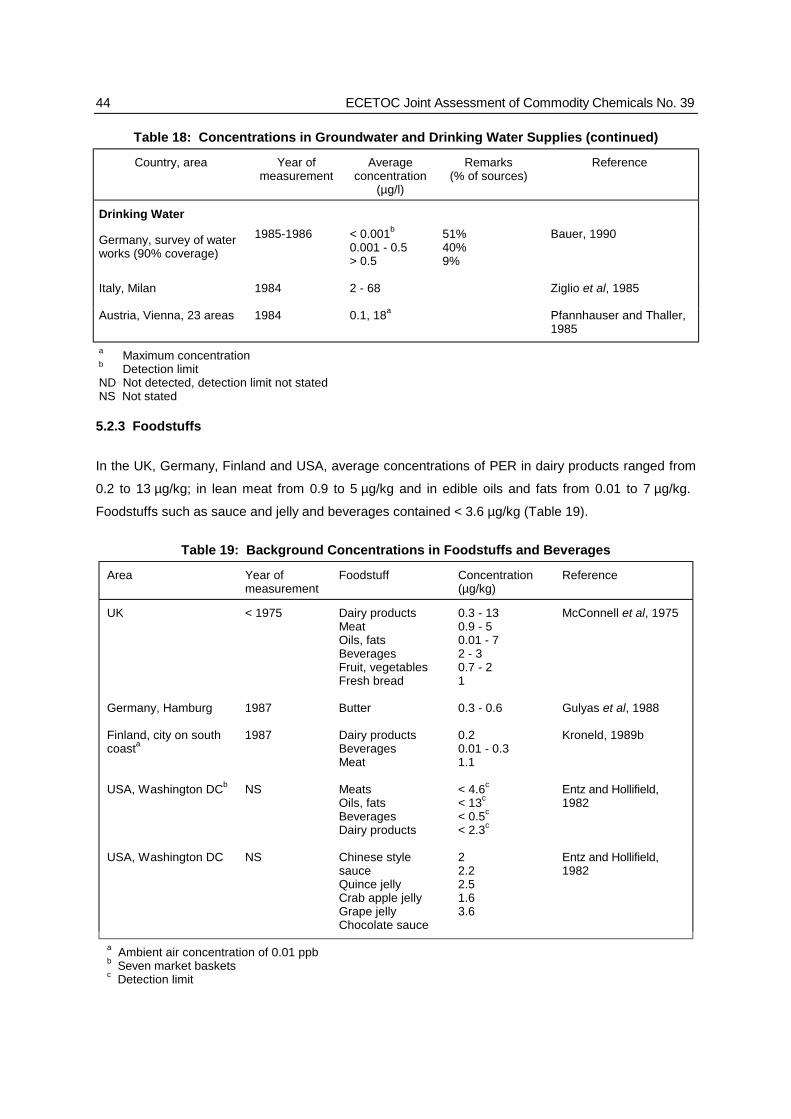
44 ECETOC Joint Assessment of Commodity Chemicals No. 39
Table 18: Concentrations in Groundwater and Drinking Water Supplies (continued)
Country, area Year ofmeasurement
Averageconcentration
(µg/l)
Remarks(% of sources)
Reference
Drinking Water
Germany, survey of waterworks (90% coverage)
1985-1986 < 0.001b
0.001 - 0.5> 0.5
51%40%9%
Bauer, 1990
Italy, Milan 1984 2 - 68 Ziglio et al, 1985
Austria, Vienna, 23 areas 1984 0.1, 18a Pfannhauser and Thaller,1985
a Maximum concentrationb Detection limitND Not detected, detection limit not statedNS Not stated
5.2.3 Foodstuffs
In the UK, Germany, Finland and USA, average concentrations of PER in dairy products ranged from
0.2 to 13 µg/kg; in lean meat from 0.9 to 5 µg/kg and in edible oils and fats from 0.01 to 7 µg/kg.
Foodstuffs such as sauce and jelly and beverages contained < 3.6 µg/kg (Table 19).
Table 19: Background Concentrations in Foodstuffs and Beverages
Area Year ofmeasurement
Foodstuff Concentration(µg/kg)
Reference
UK < 1975 Dairy productsMeatOils, fatsBeveragesFruit, vegetablesFresh bread
0.3 - 130.9 - 50.01 - 72 - 30.7 - 21
McConnell et al, 1975
Germany, Hamburg 1987 Butter 0.3 - 0.6 Gulyas et al, 1988
Finland, city on southcoasta
1987 Dairy productsBeveragesMeat
0.20.01 - 0.31.1
Kroneld, 1989b
USA, Washington DCb NS MeatsOils, fatsBeveragesDairy products
< 4.6c
< 13c
< 0.5c
< 2.3c
Entz and Hollifield,1982
USA, Washington DC NS Chinese stylesauceQuince jellyCrab apple jellyGrape jellyChocolate sauce
22.22.51.63.6
Entz and Hollifield,1982
a Ambient air concentration of 0.01 ppbb Seven market basketsc Detection limit
Tetrachloroethylene 45
In a market basket survey in the former West Germany, the total daily intake was approximately 90 µg
PER from food and beverages (Von Düszeln et al, 1982).
In Switzerland, Zimmerli et al (1982) observed seasonal variations in the PER concentration in milk
between 2.5 and 20 µg/kg during summer and winter, respectively.
Certain surveys of foodstuffs in Germany and Switzerland have shown high levels of PER in meat and
eggs. These levels were attributed to the animals having been fed on PER-contaminated forage and
the use of PER in animal feed processing (Bauer and Gregorzik, 1982; Zimmerli et al, 1982; Vieths et
al, 1987).
PER was detected in foodstuffs located in houses or supermarkets situated close to poorly operated
dry-cleaning shops where ambient air concentrations of PER were high (Reinhard et al, 1989).
Foodstuffs with a high fat content stored for several weeks under such conditions showed levels of up
to 98,000 µg/kg (Vieths et al, 1987).
Further details of these studies and other data are presented in Table 20.
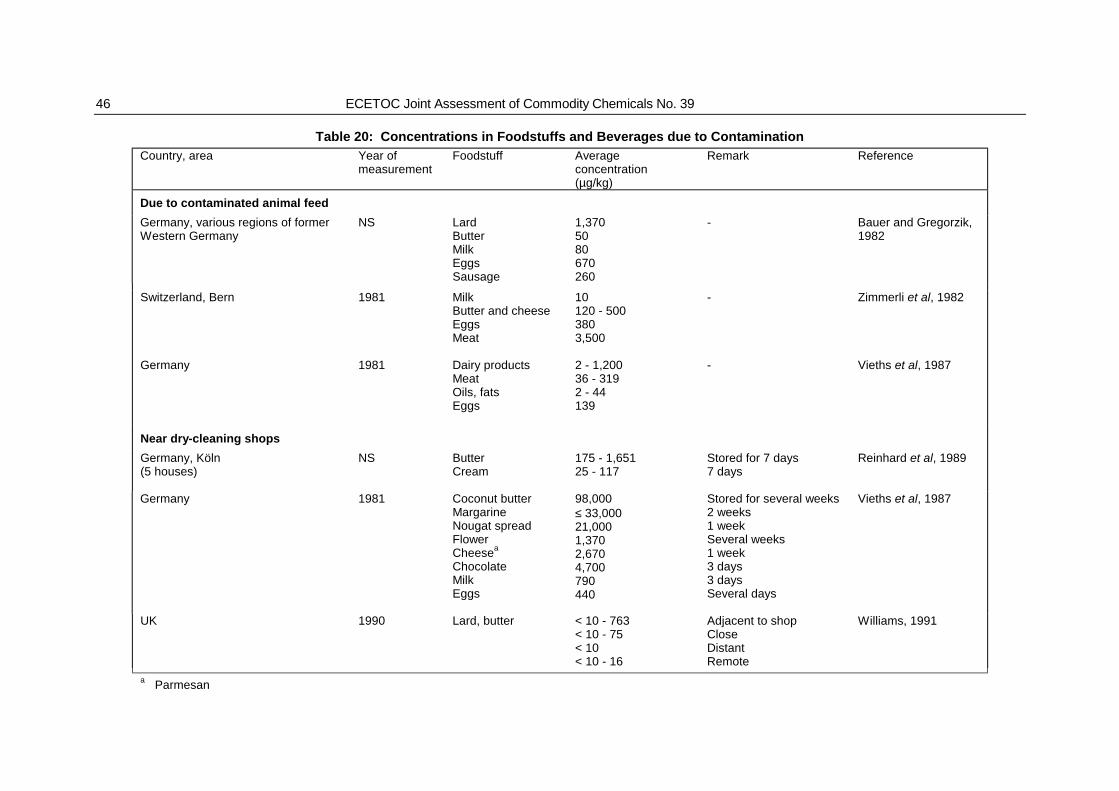
46 ECETOC Joint Assessment of Commodity Chemicals No. 39
Table 20: Concentrations in Foodstuffs and Beverages due to Contamination
Country, area Year ofmeasurement
Foodstuff Averageconcentration(µg/kg)
Remark Reference
Due to contaminated animal feed
Germany, various regions of formerWestern Germany
NS LardButterMilkEggsSausage
1,3705080670260
- Bauer and Gregorzik,1982
Switzerland, Bern 1981 MilkButter and cheeseEggsMeat
10120 - 5003803,500
- Zimmerli et al, 1982
Germany 1981 Dairy productsMeatOils, fatsEggs
2 - 1,20036 - 3192 - 44139
- Vieths et al, 1987
Near dry-cleaning shops
Germany, Köln(5 houses)
NS ButterCream
175 - 1,65125 - 117
Stored for 7 days7 days
Reinhard et al, 1989
Germany 1981 Coconut butterMargarineNougat spreadFlowerCheesea
ChocolateMilkEggs
98,000≤ 33,000 21,0001,3702,6704,700790440
Stored for several weeks2 weeks1 weekSeveral weeks1 week3 days3 daysSeveral days
Vieths et al, 1987
UK 1990 Lard, butter < 10 - 763 < 10 - 75 < 10< 10 - 16
Adjacent to shopCloseDistantRemote
Williams, 1991
a Parmesan
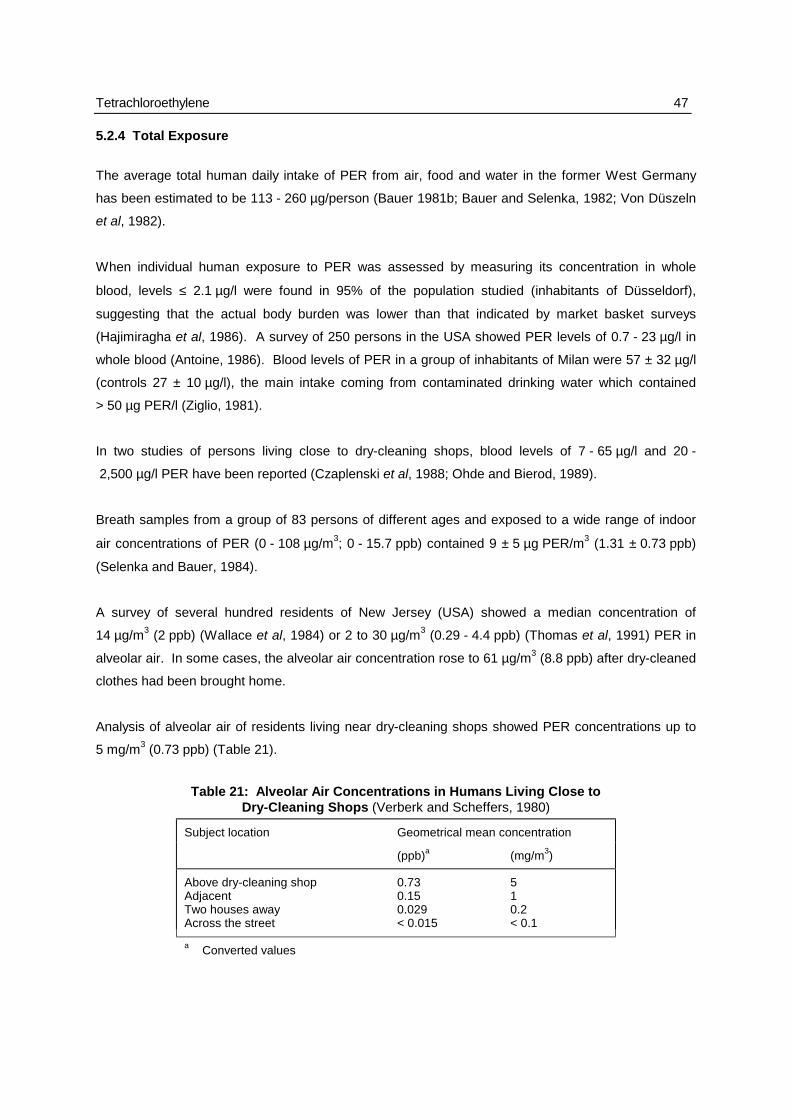
Tetrachloroethylene 47
5.2.4 Total Exposure
The average total human daily intake of PER from air, food and water in the former West Germany
has been estimated to be 113 - 260 µg/person (Bauer 1981b; Bauer and Selenka, 1982; Von Düszeln
et al, 1982).
When individual human exposure to PER was assessed by measuring its concentration in whole
blood, levels ≤ 2.1 µg/l were found in 95% of the population studied (inhabitants of Düsseldorf),
suggesting that the actual body burden was lower than that indicated by market basket surveys
(Hajimiragha et al, 1986). A survey of 250 persons in the USA showed PER levels of 0.7 - 23 µg/l in
whole blood (Antoine, 1986). Blood levels of PER in a group of inhabitants of Milan were 57 ± 32 µg/l
(controls 27 ± 10 µg/l), the main intake coming from contaminated drinking water which contained
> 50 µg PER/l (Ziglio, 1981).
In two studies of persons living close to dry-cleaning shops, blood levels of 7 - 65 µg/l and 20 -
2,500 µg/l PER have been reported (Czaplenski et al, 1988; Ohde and Bierod, 1989).
Breath samples from a group of 83 persons of different ages and exposed to a wide range of indoor
air concentrations of PER (0 - 108 µg/m3; 0 - 15.7 ppb) contained 9 ± 5 µg PER/m3 (1.31 ± 0.73 ppb)
(Selenka and Bauer, 1984).
A survey of several hundred residents of New Jersey (USA) showed a median concentration of
14 µg/m3 (2 ppb) (Wallace et al, 1984) or 2 to 30 µg/m3 (0.29 - 4.4 ppb) (Thomas et al, 1991) PER in
alveolar air. In some cases, the alveolar air concentration rose to 61 µg/m3 (8.8 ppb) after dry-cleaned
clothes had been brought home.
Analysis of alveolar air of residents living near dry-cleaning shops showed PER concentrations up to
5 mg/m3 (0.73 ppb) (Table 21).
Table 21: Alveolar Air Concentrations in Humans Living Close toDry-Cleaning Shops (Verberk and Scheffers, 1980)
Subject location Geometrical mean concentration
(ppb)a (mg/m3)
Above dry-cleaning shopAdjacentTwo houses awayAcross the street
0.730.150.029< 0.015
510.2< 0.1
a Converted values
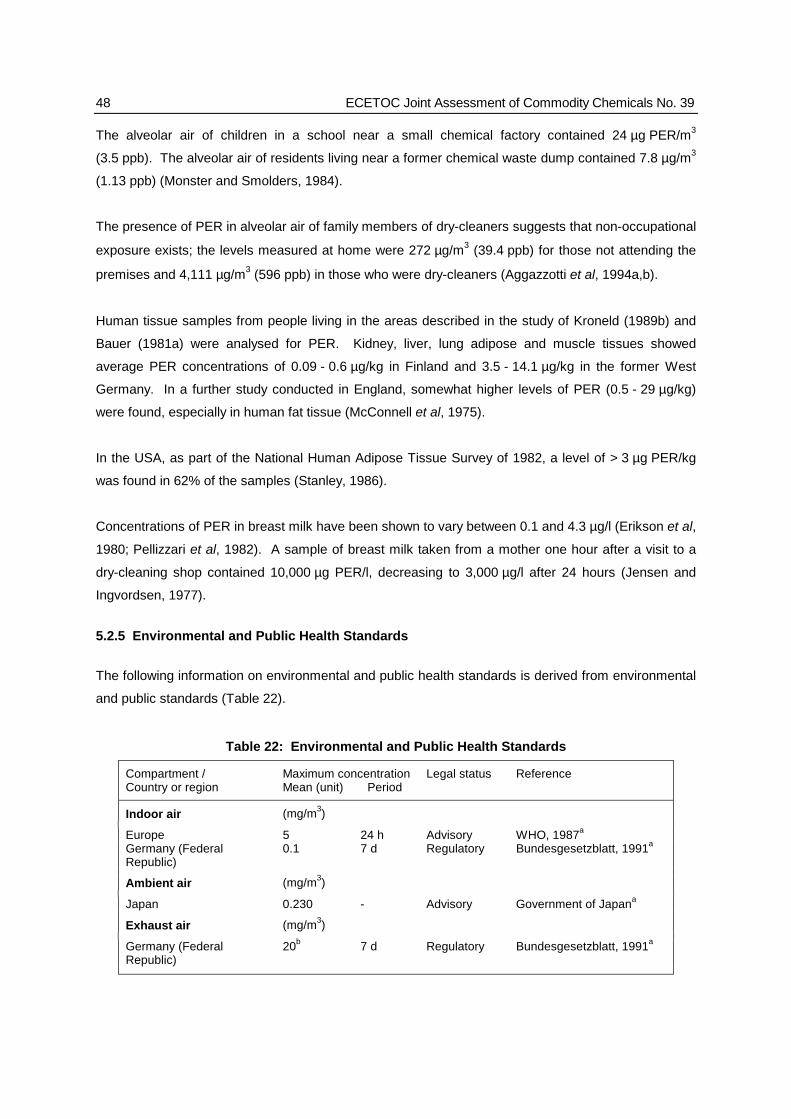
48 ECETOC Joint Assessment of Commodity Chemicals No. 39
The alveolar air of children in a school near a small chemical factory contained 24 µg PER/m3
(3.5 ppb). The alveolar air of residents living near a former chemical waste dump contained 7.8 µg/m3
(1.13 ppb) (Monster and Smolders, 1984).
The presence of PER in alveolar air of family members of dry-cleaners suggests that non-occupational
exposure exists; the levels measured at home were 272 µg/m3 (39.4 ppb) for those not attending the
premises and 4,111 µg/m3 (596 ppb) in those who were dry-cleaners (Aggazzotti et al, 1994a,b).
Human tissue samples from people living in the areas described in the study of Kroneld (1989b) and
Bauer (1981a) were analysed for PER. Kidney, liver, lung adipose and muscle tissues showed
average PER concentrations of 0.09 - 0.6 µg/kg in Finland and 3.5 - 14.1 µg/kg in the former West
Germany. In a further study conducted in England, somewhat higher levels of PER (0.5 - 29 µg/kg)
were found, especially in human fat tissue (McConnell et al, 1975).
In the USA, as part of the National Human Adipose Tissue Survey of 1982, a level of > 3 µg PER/kg
was found in 62% of the samples (Stanley, 1986).
Concentrations of PER in breast milk have been shown to vary between 0.1 and 4.3 µg/l (Erikson et al,
1980; Pellizzari et al, 1982). A sample of breast milk taken from a mother one hour after a visit to a
dry-cleaning shop contained 10,000 µg PER/l, decreasing to 3,000 µg/l after 24 hours (Jensen and
Ingvordsen, 1977).
5.2.5 Environmental and Public Health Standards
The following information on environmental and public health standards is derived from environmental
and public standards (Table 22).
Table 22: Environmental and Public Health Standards
Compartment /Country or region
Maximum concentrationMean (unit) Period
Legal status Reference
Indoor air (mg/m3)
Europe 5 24 h Advisory WHO, 1987a
Germany (FederalRepublic)
0.1 7 d Regulatory Bundesgesetzblatt, 1991a
Ambient air (mg/m3)
Japan 0.230 - Advisory Government of Japana
Exhaust air (mg/m3)
Germany (FederalRepublic)
20b 7 d Regulatory Bundesgesetzblatt, 1991a
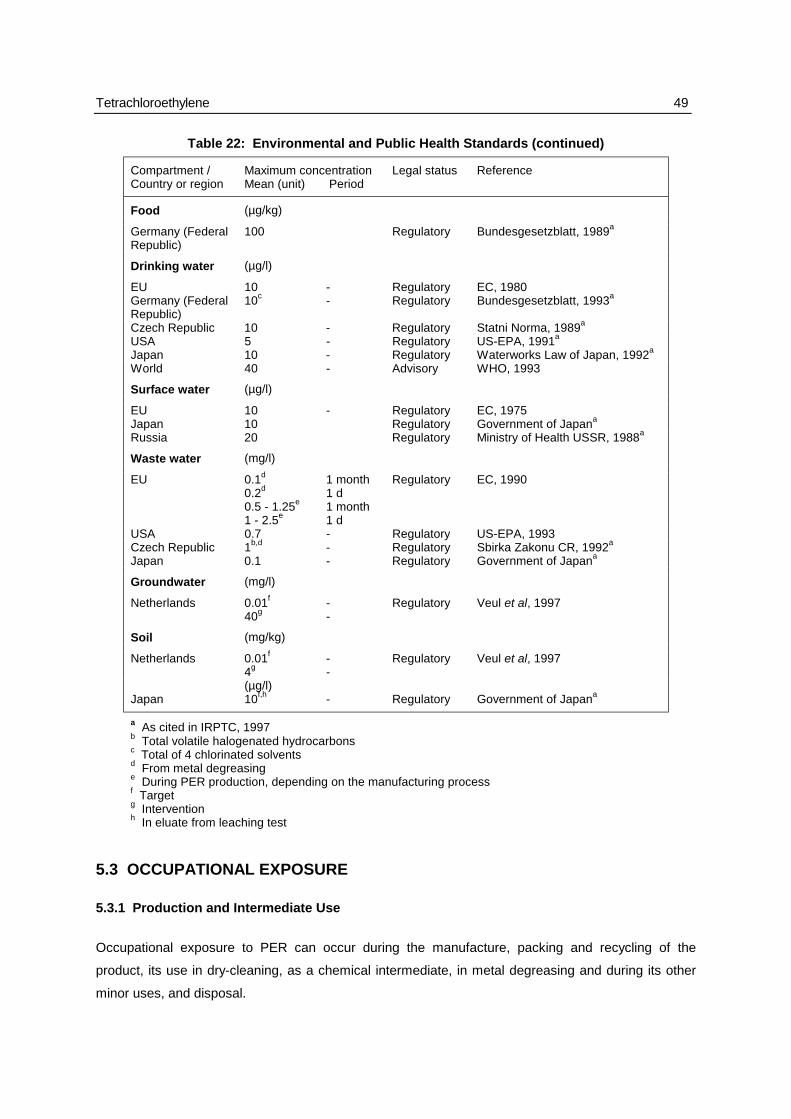
Tetrachloroethylene 49
Table 22: Environmental and Public Health Standards (continued)
Compartment /Country or region
Maximum concentrationMean (unit) Period
Legal status Reference
Food (µg/kg)
Germany (FederalRepublic)
100 Regulatory Bundesgesetzblatt, 1989a
Drinking water (µg/l)
EU 10 - Regulatory EC, 1980Germany (FederalRepublic)
10c - Regulatory Bundesgesetzblatt, 1993a
Czech Republic 10 - Regulatory Statni Norma, 1989a
USA 5 - Regulatory US-EPA, 1991a
Japan 10 - Regulatory Waterworks Law of Japan, 1992a
World 40 - Advisory WHO, 1993
Surface water (µg/l)
EU 10 - Regulatory EC, 1975Japan 10 Regulatory Government of Japana
Russia 20 Regulatory Ministry of Health USSR, 1988a
Waste water (mg/l)
EU 0.1d
0.2d
0.5 - 1.25e
1 - 2.5e
1 month1 d1 month1 d
Regulatory EC, 1990
USA 0.7 - Regulatory US-EPA, 1993Czech Republic 1b,d - Regulatory Sbirka Zakonu CR, 1992a
Japan 0.1 - Regulatory Government of Japana
Groundwater (mg/l)
Netherlands 0.01f
40g--
Regulatory Veul et al, 1997
Soil (mg/kg)
Netherlands 0.01f
4g--
Regulatory Veul et al, 1997
(µg/l)Japan 10f,h - Regulatory Government of Japana
a As cited in IRPTC, 1997b Total volatile halogenated hydrocarbonsc Total of 4 chlorinated solventsd From metal degreasinge During PER production, depending on the manufacturing processf Targetg Interventionh In eluate from leaching test
5.3 OCCUPATIONAL EXPOSURE
5.3.1 Production and Intermediate Use
Occupational exposure to PER can occur during the manufacture, packing and recycling of the
product, its use in dry-cleaning, as a chemical intermediate, in metal degreasing and during its other
minor uses, and disposal.
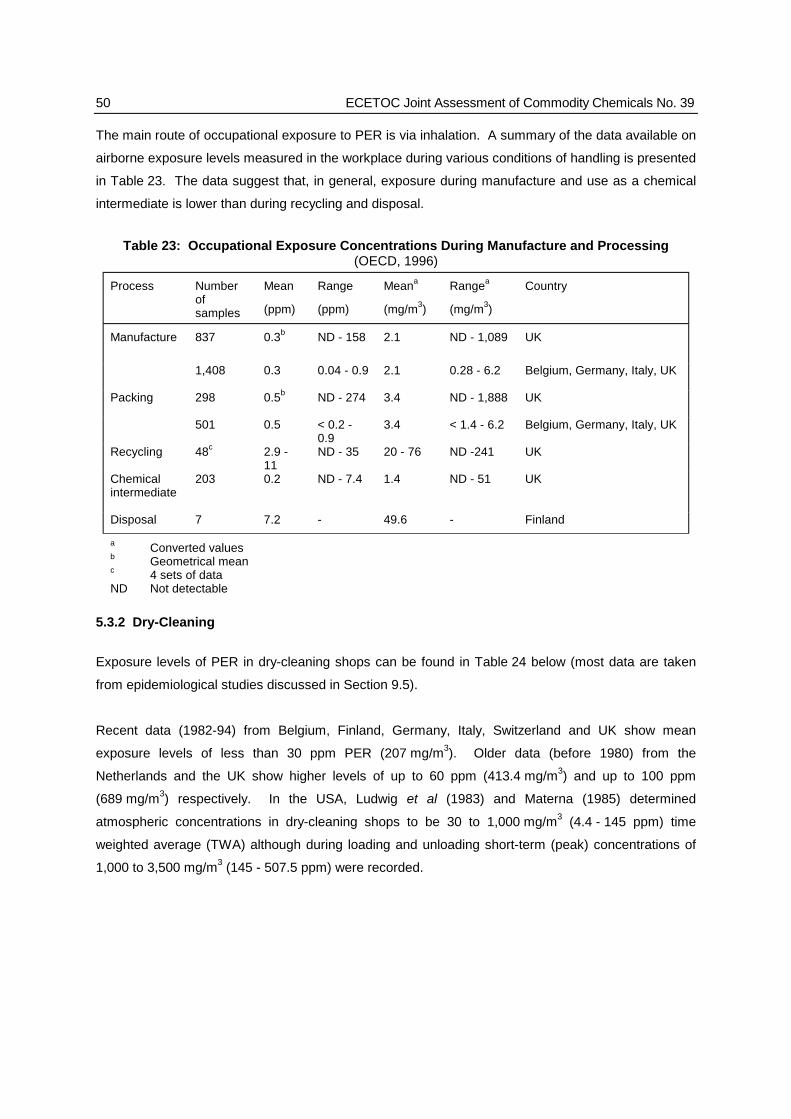
50 ECETOC Joint Assessment of Commodity Chemicals No. 39
The main route of occupational exposure to PER is via inhalation. A summary of the data available on
airborne exposure levels measured in the workplace during various conditions of handling is presented
in Table 23. The data suggest that, in general, exposure during manufacture and use as a chemical
intermediate is lower than during recycling and disposal.
Table 23: Occupational Exposure Concentrations During Manufacture and Processing(OECD, 1996)
Process Numberofsamples
Mean
(ppm)
Range
(ppm)
Meana
(mg/m3)
Rangea
(mg/m3)
Country
Manufacture 837 0.3b ND - 158 2.1 ND - 1,089 UK
1,408 0.3 0.04 - 0.9 2.1 0.28 - 6.2 Belgium, Germany, Italy, UK
Packing 298 0.5b ND - 274 3.4 ND - 1,888 UK
501 0.5 < 0.2 -0.9
3.4 < 1.4 - 6.2 Belgium, Germany, Italy, UK
Recycling 48c 2.9 -11
ND - 35 20 - 76 ND -241 UK
Chemicalintermediate
203 0.2 ND - 7.4 1.4 ND - 51 UK
Disposal 7 7.2 - 49.6 - Finland
a
b
c
ND
Converted valuesGeometrical mean4 sets of dataNot detectable
5.3.2 Dry-Cleaning
Exposure levels of PER in dry-cleaning shops can be found in Table 24 below (most data are taken
from epidemiological studies discussed in Section 9.5).
Recent data (1982-94) from Belgium, Finland, Germany, Italy, Switzerland and UK show mean
exposure levels of less than 30 ppm PER (207 mg/m3). Older data (before 1980) from the
Netherlands and the UK show higher levels of up to 60 ppm (413.4 mg/m3) and up to 100 ppm
(689 mg/m3) respectively. In the USA, Ludwig et al (1983) and Materna (1985) determined
atmospheric concentrations in dry-cleaning shops to be 30 to 1,000 mg/m3 (4.4 - 145 ppm) time
weighted average (TWA) although during loading and unloading short-term (peak) concentrations of
1,000 to 3,500 mg/m3 (145 - 507.5 ppm) were recorded.
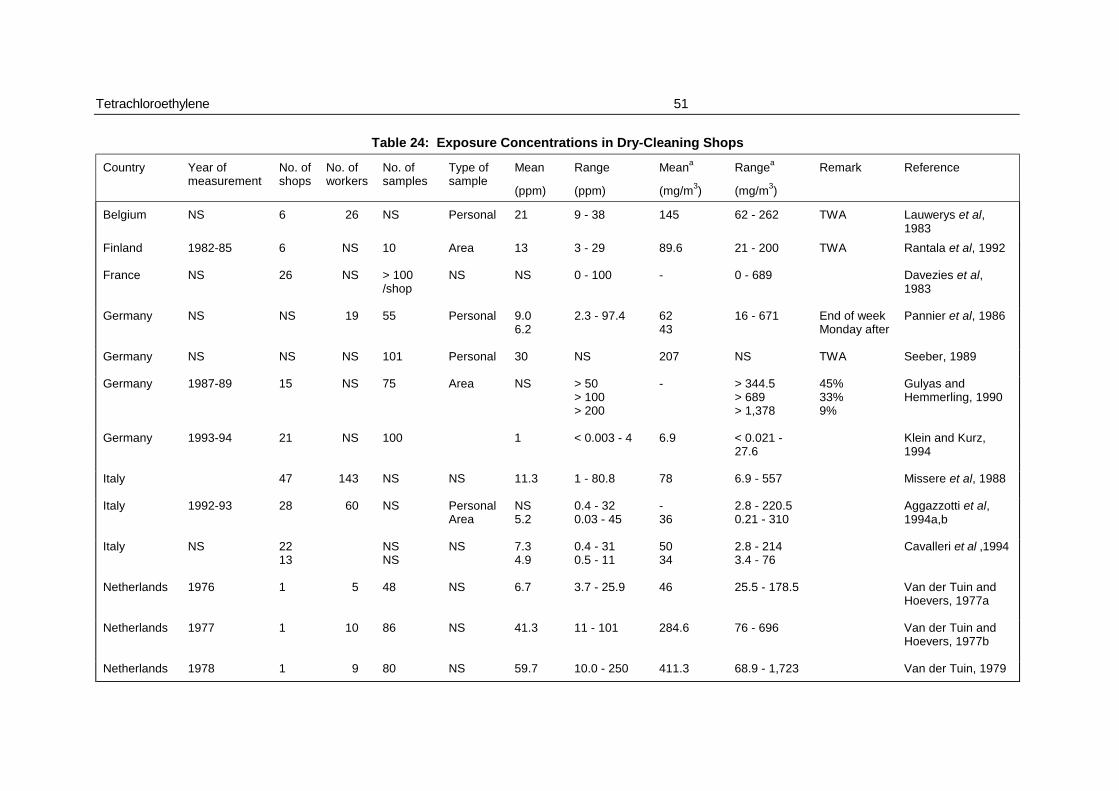
Tetrachloroethylene 51
Table 24: Exposure Concentrations in Dry-Cleaning Shops
Country Year ofmeasurement
No. ofshops
No. ofworkers
No. ofsamples
Type ofsample
Mean
(ppm)
Range
(ppm)
Meana
(mg/m3)
Rangea
(mg/m3)
Remark Reference
Belgium NS 6 26 NS Personal 21 9 - 38 145 62 - 262 TWA Lauwerys et al,1983
Finland 1982-85 6 NS 10 Area 13 3 - 29 89.6 21 - 200 TWA Rantala et al, 1992
France NS 26 NS > 100/shop
NS NS 0 - 100 - 0 - 689 Davezies et al,1983
Germany NS NS 19 55 Personal 9.06.2
2.3 - 97.4 6243
16 - 671 End of weekMonday after
Pannier et al, 1986
Germany NS NS NS 101 Personal 30 NS 207 NS TWA Seeber, 1989
Germany 1987-89 15 NS 75 Area NS > 50> 100> 200
- > 344.5> 689> 1,378
45%33%9%
Gulyas andHemmerling, 1990
Germany 1993-94 21 NS 100 1 < 0.003 - 4 6.9 < 0.021 -27.6
Klein and Kurz,1994
Italy 47 143 NS NS 11.3 1 - 80.8 78 6.9 - 557 Missere et al, 1988
Italy 1992-93 28 60 NS PersonalArea
NS5.2
0.4 - 320.03 - 45
-36
2.8 - 220.50.21 - 310
Aggazzotti et al,1994a,b
Italy NS 2213
NSNS
NS 7.34.9
0.4 - 310.5 - 11
5034
2.8 - 2143.4 - 76
Cavalleri et al ,1994
Netherlands 1976 1 5 48 NS 6.7 3.7 - 25.9 46 25.5 - 178.5 Van der Tuin andHoevers, 1977a
Netherlands 1977 1 10 86 NS 41.3 11 - 101 284.6 76 - 696 Van der Tuin andHoevers, 1977b
Netherlands 1978 1 9 80 NS 59.7 10.0 - 250 411.3 68.9 - 1,723 Van der Tuin, 1979

52 ECETOC Joint Assessment of Commodity Chemicals No. 39
Table 24: Exposure Concentrations in Dry-Cleaning Shops (continued)
Country Year ofmeasurement
No. ofshops
No. ofworkers
No. ofsamples
Type ofsample
Mean
(ppm)
Range
(ppm)
Meana
(mg/m3)
Rangea
(mg/m3)
Remark Reference
Netherlands NS 3 23 46 Personal 7.2 -51.7b
4.6 - 158.7c 49.6 - 356a 32 - 1,093.4b Monster et al, 1983
Switzerland NS 10 NS (1 week) NS 18.5 NS 127.5 - Boillat et al, 1986
Switzerland NS 1 NS NS NS 1.5 NS 10 - Grob et al, 1991
UK NS 5 NS 14 NS < 20< 30< 100
2.7 - 245 < 138< 207< 689
18.6 - 1,688 43%64%79%
OECD, 1996
UK 1990-91 81 NS 405 Personal 22.5 0 - 360 155 0 - 2,480 Edmondson andPalin, 1989
UK NS 90 NS 333 Personal < 30< 50< 100
NS < 207< 344.5< 689
- 74%88%97%
Shipman andWhim, 1980
UK NS 41 NS 160 Personal < 30< 50< 100
NS < 207< 344.5< 689
- 53%76%93%
Shipman andWhim, 1980
USA NS 44 NS 323 Personal 5.7 – 76 0.1 - 366 39 - 523.6 0.69 - 2,522 TWA Ludwig et al, 1983
USA 1982 37 NS 37 Personal 28.2 -86.6
3.0 - 303 194.3 - 597 20.7 - 2,088 TWA Materna, 1985
a
b
c
TWANS
Converted valuesReported as 300 - 2,150 µmol/m3Reported as 190 - 6,600 µmol/m3Time-weighted averageNot stated
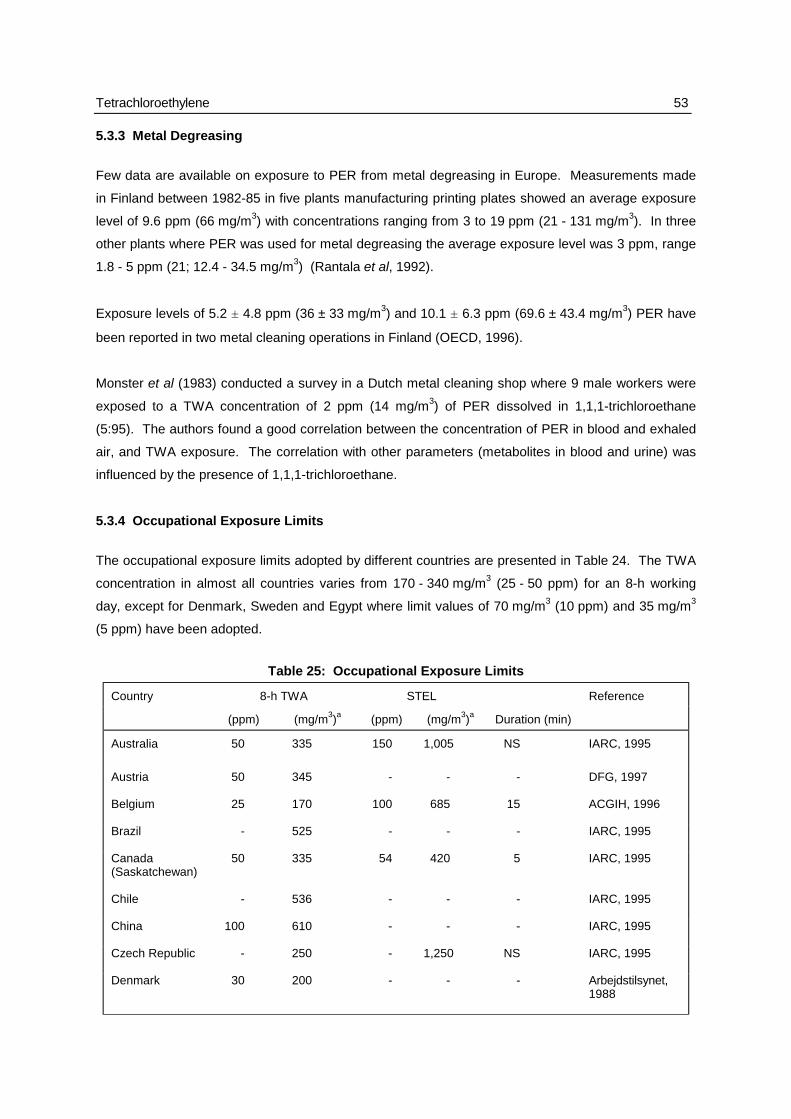
Tetrachloroethylene 53
5.3.3 Metal Degreasing
Few data are available on exposure to PER from metal degreasing in Europe. Measurements made
in Finland between 1982-85 in five plants manufacturing printing plates showed an average exposure
level of 9.6 ppm (66 mg/m3) with concentrations ranging from 3 to 19 ppm (21 - 131 mg/m3). In three
other plants where PER was used for metal degreasing the average exposure level was 3 ppm, range
1.8 - 5 ppm (21; 12.4 - 34.5 mg/m3) (Rantala et al, 1992).
Exposure levels of 5.2 ± 4.8 ppm (36 ± 33 mg/m3) and 10.1 ± 6.3 ppm (69.6 ± 43.4 mg/m3) PER have
been reported in two metal cleaning operations in Finland (OECD, 1996).
Monster et al (1983) conducted a survey in a Dutch metal cleaning shop where 9 male workers were
exposed to a TWA concentration of 2 ppm (14 mg/m3) of PER dissolved in 1,1,1-trichloroethane
(5:95). The authors found a good correlation between the concentration of PER in blood and exhaled
air, and TWA exposure. The correlation with other parameters (metabolites in blood and urine) was
influenced by the presence of 1,1,1-trichloroethane.
5.3.4 Occupational Exposure Limits
The occupational exposure limits adopted by different countries are presented in Table 24. The TWA
concentration in almost all countries varies from 170 - 340 mg/m3 (25 - 50 ppm) for an 8-h working
day, except for Denmark, Sweden and Egypt where limit values of 70 mg/m3 (10 ppm) and 35 mg/m3
(5 ppm) have been adopted.
Table 25: Occupational Exposure Limits
Country 8-h TWA STEL Reference
(ppm) (mg/m3)a (ppm) (mg/m3)a Duration (min)
Australia 50 335 150 1,005 NS IARC, 1995
Austria 50 345 - - - DFG, 1997
Belgium 25 170 100 685 15 ACGIH, 1996
Brazil - 525 - - - IARC, 1995
Canada(Saskatchewan)
50 335 54 420 5 IARC, 1995
Chile - 536 - - - IARC, 1995
China 100 610 - - - IARC, 1995
Czech Republic - 250 - 1,250 NS IARC, 1995
Denmark 30 200 - - - Arbejdstilsynet,1988
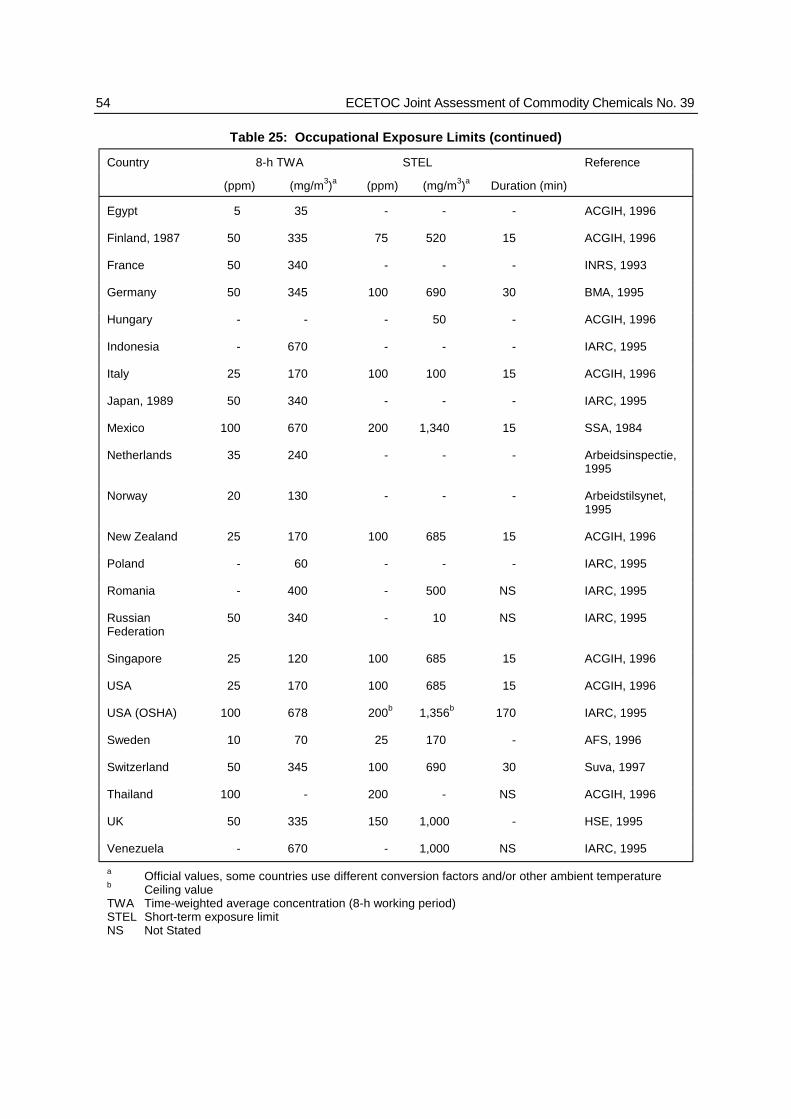
54 ECETOC Joint Assessment of Commodity Chemicals No. 39
Table 25: Occupational Exposure Limits (continued)
Country 8-h TWA STEL Reference
(ppm) (mg/m3)a (ppm) (mg/m3)a Duration (min)
Egypt 5 35 - - - ACGIH, 1996
Finland, 1987 50 335 75 520 15 ACGIH, 1996
France 50 340 - - - INRS, 1993
Germany 50 345 100 690 30 BMA, 1995
Hungary - - - 50 - ACGIH, 1996
Indonesia - 670 - - - IARC, 1995
Italy 25 170 100 100 15 ACGIH, 1996
Japan, 1989 50 340 - - - IARC, 1995
Mexico 100 670 200 1,340 15 SSA, 1984
Netherlands 35 240 - - - Arbeidsinspectie,1995
Norway 20 130 - - - Arbeidstilsynet,1995
New Zealand 25 170 100 685 15 ACGIH, 1996
Poland - 60 - - - IARC, 1995
Romania - 400 - 500 NS IARC, 1995
RussianFederation
50 340 - 10 NS IARC, 1995
Singapore 25 120 100 685 15 ACGIH, 1996
USA 25 170 100 685 15 ACGIH, 1996
USA (OSHA) 100 678 200b 1,356b 170 IARC, 1995
Sweden 10 70 25 170 - AFS, 1996
Switzerland 50 345 100 690 30 Suva, 1997
Thailand 100 - 200 - NS ACGIH, 1996
UK 50 335 150 1,000 - HSE, 1995
Venezuela - 670 - 1,000 NS IARC, 1995
a Official values, some countries use different conversion factors and/or other ambient temperatureb Ceiling valueTWA Time-weighted average concentration (8-h working period)STEL Short-term exposure limitNS Not Stated

Tetrachloroethylene 55
5.3.5 Biological Monitoring
Exposure to PER is mainly by inhalation, but it has been shown that dermal absorption can contribute.
As it is excreted partly unchanged, PER may be measured directly in exhaled air and in blood. The
main metabolites, TCA and trichloroethanol, can also be traced in blood or urine (Chapter 7).
PER has a long half-life in humans. It is therefore recommended to sample at least 2 days after
exposure and before the shift. Influences such as heavy workload, obesity or high physical activity
have to be taken into account (ACGIH, 1996).
Data on biological monitoring in exhaled air, blood or urine of workers occupationally exposed to PER
can be found in Table 26, 27 and 28.
The US ACGIH and German MAK Commission (Table 29) have recommended biological Exposure
Indices (BEI) and Tolerance Values (BAT).
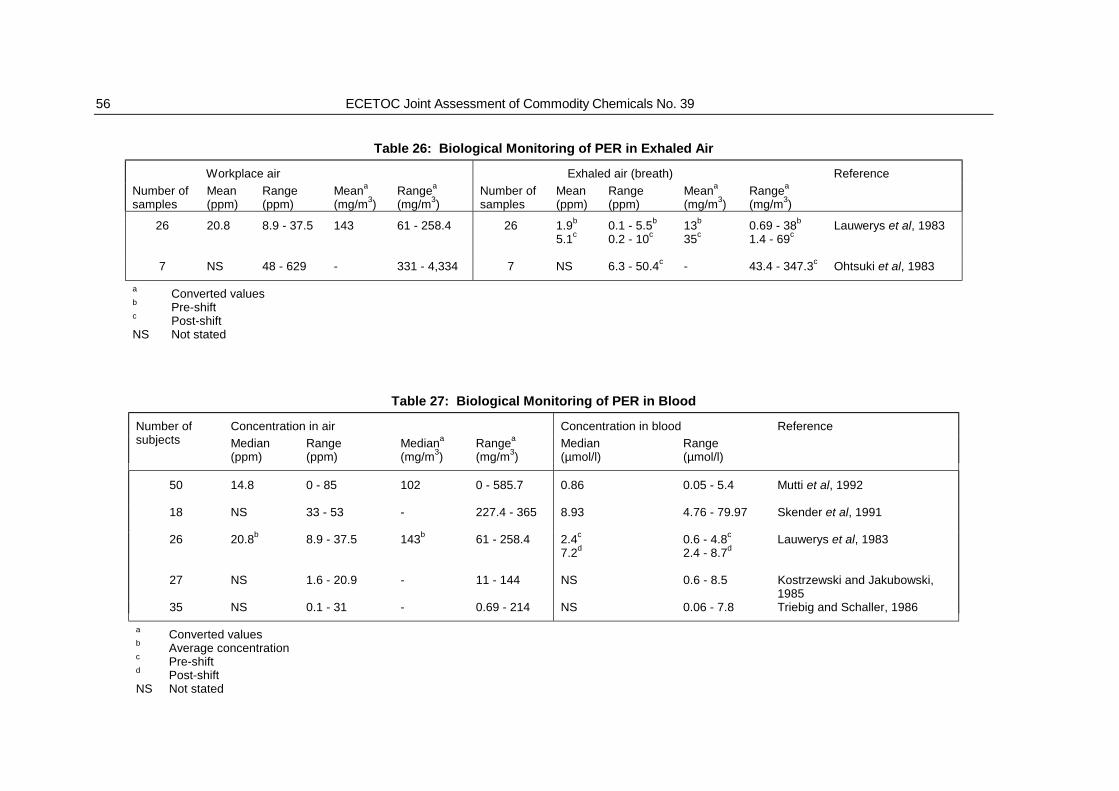
56 ECETOC Joint Assessment of Commodity Chemicals No. 39
Table 26: Biological Monitoring of PER in Exhaled Air
Workplace air Exhaled air (breath) Reference
Number ofsamples
Mean(ppm)
Range(ppm)
Meana
(mg/m3)Rangea
(mg/m3)Number ofsamples
Mean(ppm)
Range(ppm)
Meana
(mg/m3)Rangea
(mg/m3)
26 20.8 8.9 - 37.5 143 61 - 258.4 26 1.9b 5.1c
0.1 - 5.5b
0.2 - 10c13b
35c0.69 - 38b
1.4 - 69cLauwerys et al, 1983
7 NS 48 - 629 - 331 - 4,334 7 NS 6.3 - 50.4c - 43.4 - 347.3c Ohtsuki et al, 1983
a Converted valuesb Pre-shiftc Post-shiftNS Not stated
Table 27: Biological Monitoring of PER in Blood
Concentration in air Concentration in bloodNumber ofsubjects Median
(ppm)Range(ppm)
Mediana
(mg/m3)Rangea
(mg/m3)Median(µmol/l)
Range(µmol/l)
Reference
50 14.8 0 - 85 102 0 - 585.7 0.86 0.05 - 5.4 Mutti et al, 1992
18 NS 33 - 53 - 227.4 - 365 8.93 4.76 - 79.97 Skender et al, 1991
26 20.8b 8.9 - 37.5 143b 61 - 258.4 2.4c
7.2d 0.6 - 4.8c
2.4 - 8.7dLauwerys et al, 1983
27 NS 1.6 - 20.9 - 11 - 144 NS 0.6 - 8.5 Kostrzewski and Jakubowski,1985
35 NS 0.1 - 31 - 0.69 - 214 NS 0.06 - 7.8 Triebig and Schaller, 1986
a
b
c
d
NS
Converted valuesAverage concentrationPre-shiftPost-shiftNot stated

Tetrachloroethylene 57
Table 28: Biological Monitoring of PER and Its Metabolites in Urine
Number ofsubjects
Concentration in air (range) (ppm) (mg/m3)a
Concentration (µmol/l) of PERin urine
Trichloroethanolin urine (µmol/l)
TCA in urine(µmol/l)
Reference
34 0 - 400 0 - 2,756 - 0 - 394 0 - 624 Ikeda et al, 1972
18 33 - 53 227.4 - 365 - - 0.73b 0.81 - 10.81b Skender et al, 1991
40 0 - 7 0 - 48 0 - 1.3 - - Ghittori et al, 1987
61 629 max 4,334 - - Up to 1.114c Ohtsuki et al, 1983
26 8.9 - 37.5 61 - 258.4 - - 0 Lauwerys et al, 1983
35 0.1 - 31 0.69 - 214 - - 0.1 - 6.2b Triebig and Schaller, 1986
a
b
c
Converted valuesmmol/mol creatinineµmol/ total trichloro compounds
Table 29: BEI and BAT Recommended Biological Action Levels
Biological Media Biological exposure Index(BEI)
Biological tolerance value(BAT)
Sampling strategy Reference
Concentration in end-exhaled air 10 ppm (69 mg/m3) Prior to last shift of work week ACGIH, 1996
Concentration in blood 1 mg/l (6 µmol/l) Prior to last shift of work week ACGIH, 1996
TCA in urine 7 mg/l (42 µmol/l) At end of work week ACGIH, 1996
Concentration in alveolar air 9.5 ppm (65.5 mg/m3) Beginning of next shift DFG, 1997
Concentration in blood 1 mg/l (6 µmol/l) Beginning of next shift DFG, 1997
58 ECETOC Joint Assessment of Commodity Chemicals No. 39
5.4 SUMMARY OF EXPOSURE DATA
PER is widely dispersed in all environmental compartments. In the air, it has been found up to 0.1 ppb
over oceans and remote areas and up to 3 ppb (21 µg/m3)in suburban or urban air. In the proximity of
areas of production and dry-cleaning facilities, concentrations up to 40 ppb (275.6 mg/m3) and from
300 to 1,000 ppb (2,067 - 6,890 mg/m3) have been reported.
In the water compartment, background levels of PER are of the order of 0.0001 µg/l in oceans and
2.5 µg/l in fresh water (urban areas). Concentrations greater than 10 µg/l PER have been found in
water in industrialised areas as well as in municipal waste-water treatment plants.
In soils and sediments, levels reported are generally lower than 5 µg/kg but may be higher in
contaminated areas. Concentrations of PER in aquatic organisms and plants are generally below
40 µg/kg.
Average measured concentrations of PER in indoor air of the order of 10 to 20 µg/m3 (1.5 - 2.9 ppb)
have been reported. Levels up to 7,100 µg/m3 have been measured in buildings situated close to dry-
cleaning facilities. Also, customers of dry-cleaning establishments, who are potentially exposed to
PER by entering the shop and handling fabrics containing residual PER, may be exposed to
concentrations up to 700 µg/m3 (101.5 ppb).
A survey of drinking waters showed that levels were generally lower than 10 µg/l for both surface and
ground water. In some cases following environmental releases, significantly higher levels up to
1,000 µg/l (mainly in ground water) have been reported. Average concentrations of PER in foodstuffs
are reported to range from 0.2 to 13 µg/kg, although levels as high as 98,000 µg/kg have been
reported in certain circumstances, especially in products with a high fat content. A market basket
survey estimated a total daily intake of 90 µg PER/person. Estimates of the average total daily intake
of PER range from 113 to 260 µg/person.
Concentrations of PER in workplace air during its production and use as a chemical intermediate are
relatively low (0.3 to 11 ppm; 2.1 - 76 mg/m3, TWA). In dry-cleaning facilities, TWA concentrations of
PER up to 30 ppm (mean value; 207 mg/m3) have been reported.
In most industrialised countries, an occupational exposure limit for PER in the range of 25 - 50 ppm
(170 - 345 mg/m3) (8-h TWA) is recommended. In some countries, biological exposure indices (BEI)
have been proposed in order to evaluate workplace exposure.

Tetrachloroethylene 59
6. EFFECTS ON ORGANISMS IN THE ENVIRONMENT
6.1 MICRO-ORGANISMS
The EC10 for growth inhibition of the bacteria Pseudomonas putida was 51 mg PER/kg soil (wet
weight) after exposure for 16 hours (Knie et al, 1983).
Soil respiration in the presence of added glucose was inhibited by 45% following treatment with
2,000 mg/kg PER (wet weight). Nitrification was slightly affected after 28 days following treatment with
> 40 mg PER/kg (wet weight) (Vonk et al, 1986).
Treatment of brown soil with PER decreased the adenosine triphosphate (ATP) content. While there
was no effect at a concentration of 0.1 mg PER/kg soil (dry weight), there was a significant effect at
1 mg/kg and 10 mg/kg soil (dry weight). Recovery from these effects took 2 months (Kanazawa and
Filip, 1987).
Danneberg (1993) studied the effect of PER on the dehydrogenase activity in soil micro-organisms.
Two concentrations were tested: 0.5 and 5 mg/kg soil (dry weight). On day 0 an increase (42 - 62%)
of the dehydrogenase activity was found; on day 14 there was a decrease (11 - 18%) and on day 28 a
further increase (6 - 13%). The data show that no consistent effect was observed.
6.2 AQUATIC ORGANISMS
6.2.1 Acute Toxicity
The high volatility of PER presents experimental difficulties in conducting aquatic toxicity tests. Flow-
through systems or closed static systems are necessary to maintain exposure concentrations and
conduct adequate toxicity studies. These conditions have not always been met (for details see tables
below).
Growth inhibition has been observed in methanogenic bacteria; the EC50 was 22 mg PER/l. Other
bacteria are less sensitive with an EC50 of 89 to 1,904 mg/l. Exposure of certain protozoa, rotatoria
and oligochaeta to PER revealed effects on growth when exposed to 13 mg/l and higher. PER was
lethal when tested on midge larvae (Tanytarsus dissimilis) at 31 mg/l (Table 30).
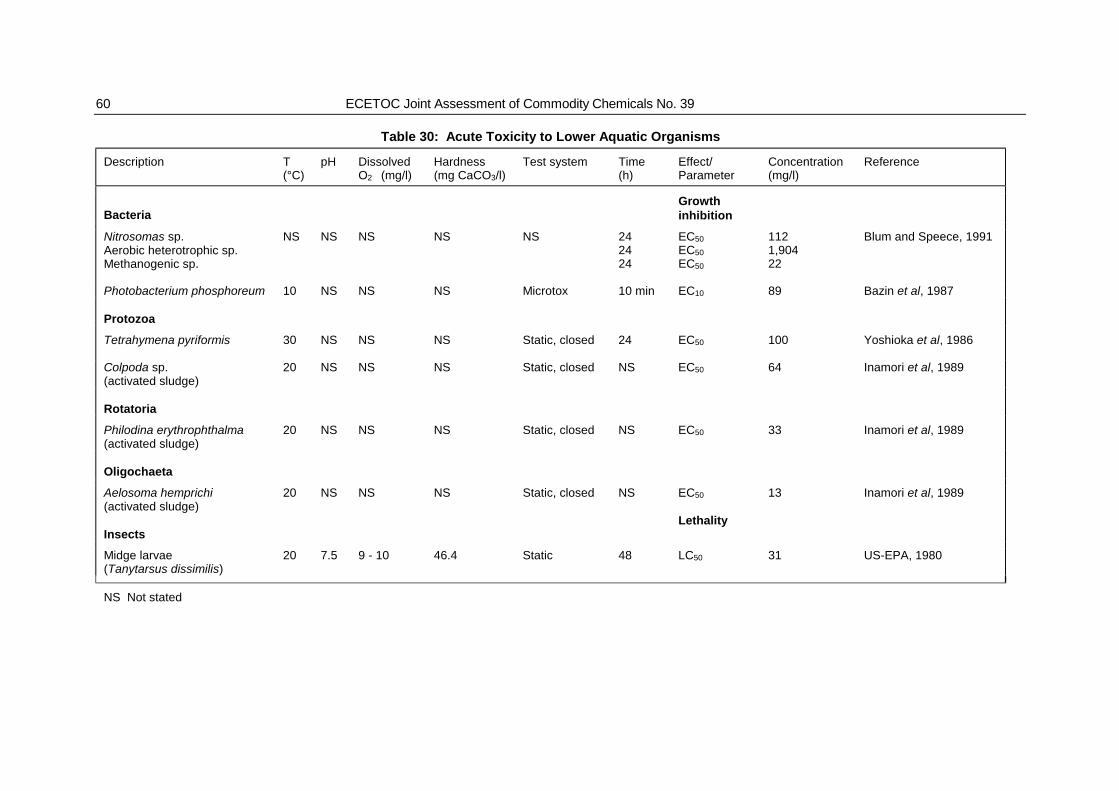
60 ECETOC Joint Assessment of Commodity Chemicals No. 39
Table 30: Acute Toxicity to Lower Aquatic Organisms
Description T(°C)
pH DissolvedO2 (mg/l)
Hardness(mg CaCO3/l)
Test system Time(h)
Effect/Parameter
Concentration(mg/l)
Reference
BacteriaGrowthinhibition
Nitrosomas sp.Aerobic heterotrophic sp.Methanogenic sp.
NS NS NS NS NS 242424
EC50
EC50
EC50
1121,90422
Blum and Speece, 1991
Photobacterium phosphoreum 10 NS NS NS Microtox 10 min EC10 89 Bazin et al, 1987
Protozoa
Tetrahymena pyriformis 30 NS NS NS Static, closed 24 EC50 100 Yoshioka et al, 1986
Colpoda sp.(activated sludge)
20 NS NS NS Static, closed NS EC50 64 Inamori et al, 1989
Rotatoria
Philodina erythrophthalma(activated sludge)
20 NS NS NS Static, closed NS EC50 33 Inamori et al, 1989
Oligochaeta
Aelosoma hemprichi(activated sludge)
20 NS NS NS Static, closed NS EC50 13 Inamori et al, 1989
InsectsLethality
Midge larvae(Tanytarsus dissimilis)
20 7.5 9 - 10 46.4 Static 48 LC50 31 US-EPA, 1980
NS Not stated
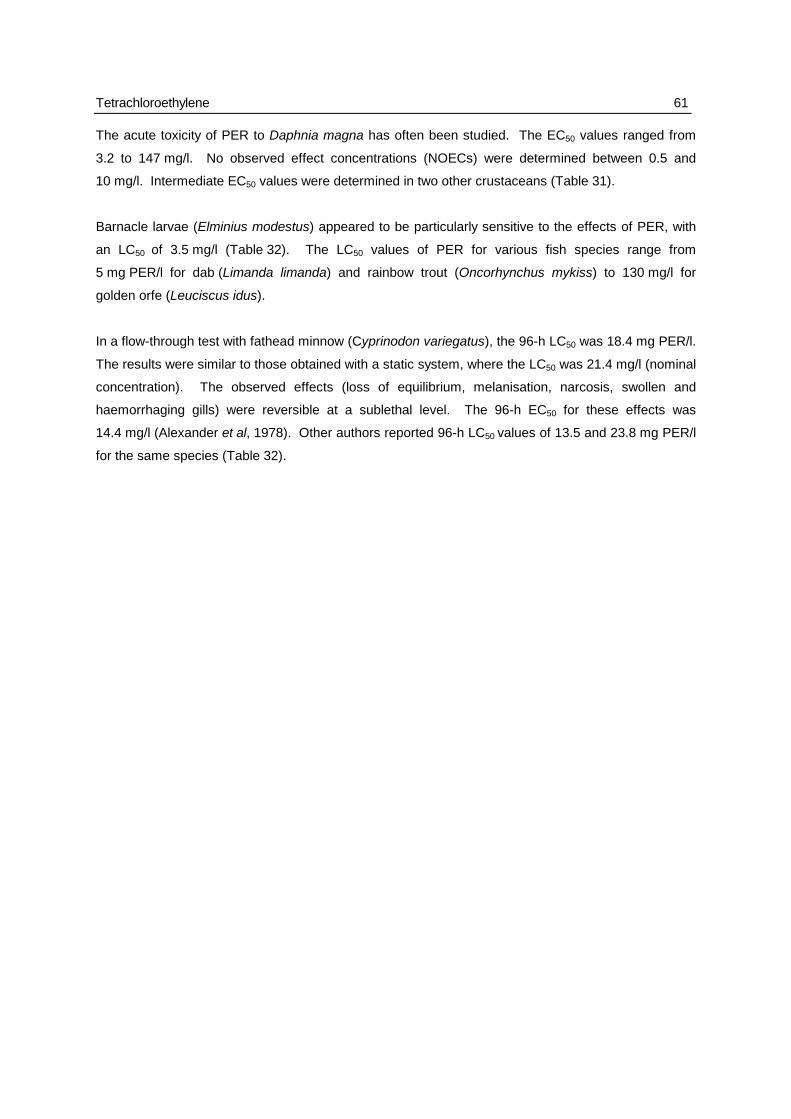
Tetrachloroethylene 61
The acute toxicity of PER to Daphnia magna has often been studied. The EC50 values ranged from
3.2 to 147 mg/l. No observed effect concentrations (NOECs) were determined between 0.5 and
10 mg/l. Intermediate EC50 values were determined in two other crustaceans (Table 31).
Barnacle larvae (Elminius modestus) appeared to be particularly sensitive to the effects of PER, with
an LC50 of 3.5 mg/l (Table 32). The LC50 values of PER for various fish species range from
5 mg PER/l for dab (Limanda limanda) and rainbow trout (Oncorhynchus mykiss) to 130 mg/l for
golden orfe (Leuciscus idus).
In a flow-through test with fathead minnow (Cyprinodon variegatus), the 96-h LC50 was 18.4 mg PER/l.
The results were similar to those obtained with a static system, where the LC50 was 21.4 mg/l (nominal
concentration). The observed effects (loss of equilibrium, melanisation, narcosis, swollen and
haemorrhaging gills) were reversible at a sublethal level. The 96-h EC50 for these effects was
14.4 mg/l (Alexander et al, 1978). Other authors reported 96-h LC50 values of 13.5 and 23.8 mg PER/l
for the same species (Table 32).
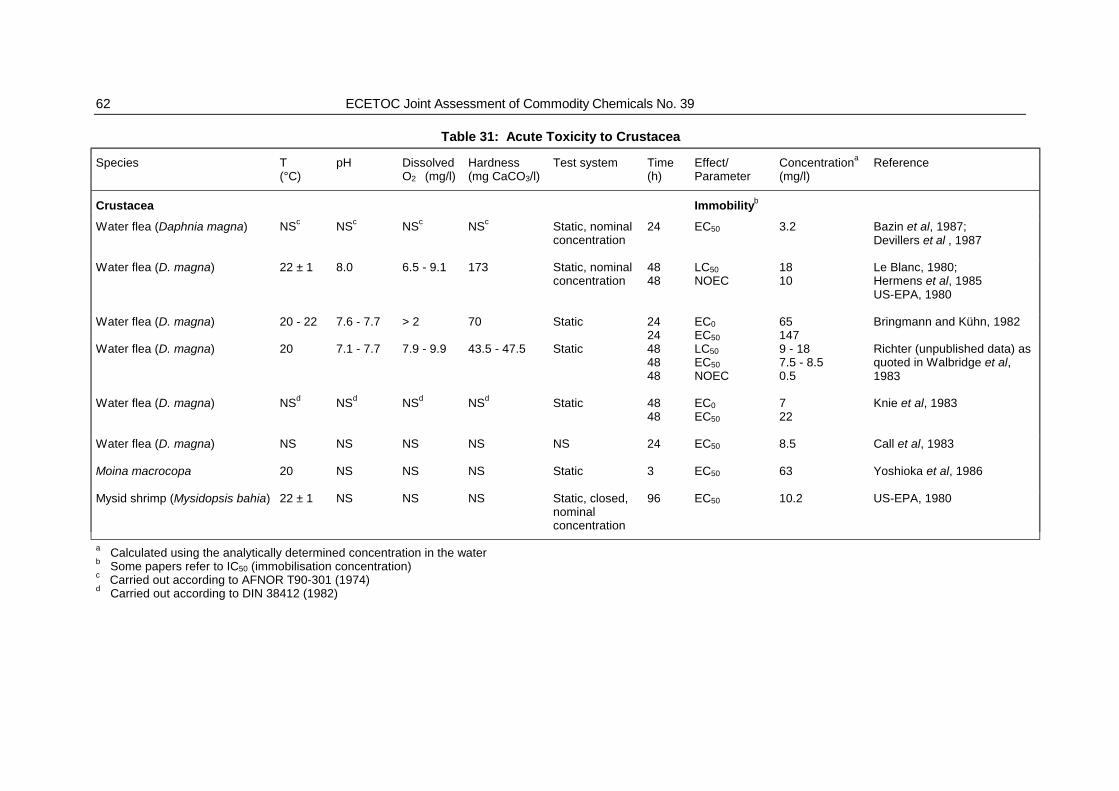
62 ECETOC Joint Assessment of Commodity Chemicals No. 39
Table 31: Acute Toxicity to Crustacea
Species T(°C)
pH DissolvedO2 (mg/l)
Hardness(mg CaCO3/l)
Test system Time(h)
Effect/Parameter
Concentrationa
(mg/l)Reference
Crustacea Immobilityb
Water flea (Daphnia magna) NSc NSc NSc NSc Static, nominalconcentration
24 EC50 3.2 Bazin et al, 1987;Devillers et al , 1987
Water flea (D. magna) 22 ± 1 8.0 6.5 - 9.1 173 Static, nominalconcentration
4848
LC50
NOEC1810
Le Blanc, 1980;Hermens et al, 1985US-EPA, 1980
Water flea (D. magna) 20 - 22 7.6 - 7.7 > 2 70 Static 2424
EC0
EC50
65147
Bringmann and Kühn, 1982
Water flea (D. magna) 20 7.1 - 7.7 7.9 - 9.9 43.5 - 47.5 Static 484848
LC50
EC50
NOEC
9 - 187.5 - 8.50.5
Richter (unpublished data) asquoted in Walbridge et al,1983
Water flea (D. magna) NSd NSd NSd NSd Static 4848
EC0
EC50
722
Knie et al, 1983
Water flea (D. magna) NS NS NS NS NS 24 EC50 8.5 Call et al, 1983
Moina macrocopa 20 NS NS NS Static 3 EC50 63 Yoshioka et al, 1986
Mysid shrimp (Mysidopsis bahia) 22 ± 1 NS NS NS Static, closed,nominalconcentration
96 EC50 10.2 US-EPA, 1980
a Calculated using the analytically determined concentration in the waterb Some papers refer to IC50 (immobilisation concentration)c Carried out according to AFNOR T90-301 (1974)d Carried out according to DIN 38412 (1982)
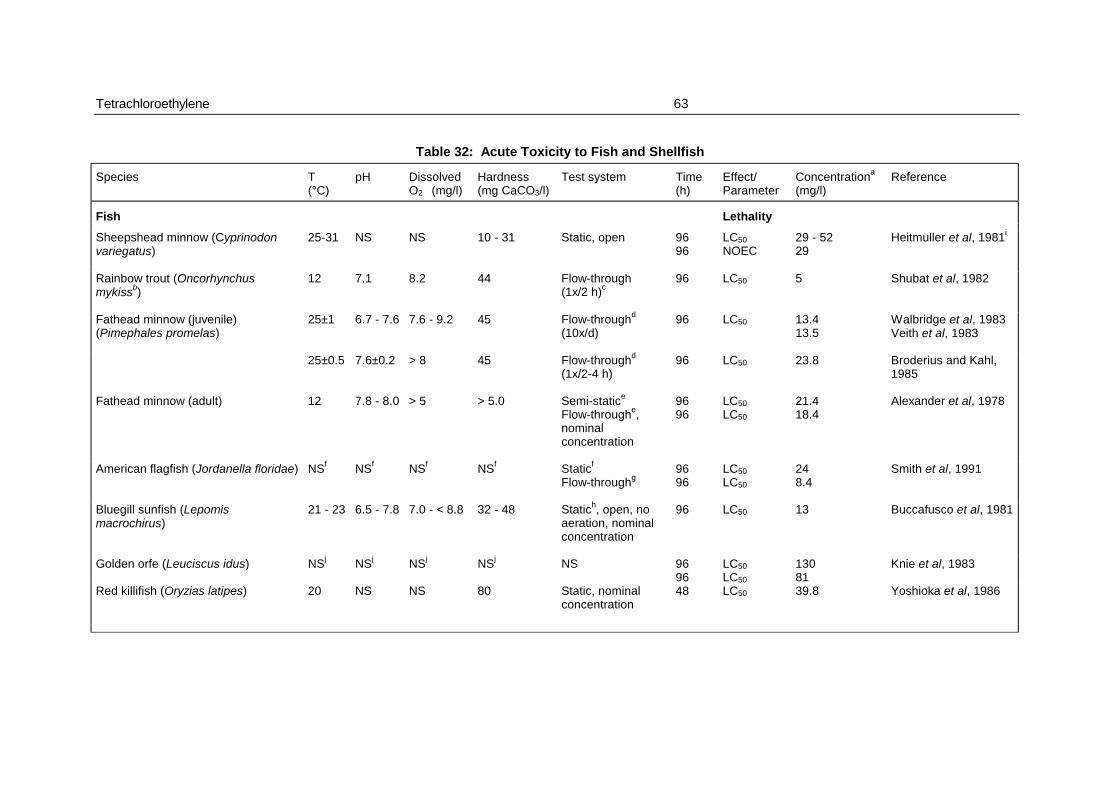
Tetrachloroethylene 63
Table 32: Acute Toxicity to Fish and Shellfish
Species T(°C)
pH DissolvedO2 (mg/l)
Hardness(mg CaCO3/l)
Test system Time(h)
Effect/Parameter
Concentrationa
(mg/l)Reference
Fish Lethality
Sheepshead minnow (Cyprinodonvariegatus)
25-31 NS NS 10 - 31 Static, open 9696
LC50
NOEC29 - 5229
Heitmuller et al, 1981i
Rainbow trout (Oncorhynchusmykissb)
12 7.1 8.2 44 Flow-through(1x/2 h)c
96 LC50 5 Shubat et al, 1982
Fathead minnow (juvenile)(Pimephales promelas)
25±1 6.7 - 7.6 7.6 - 9.2 45 Flow-throughd
(10x/d)96 LC50 13.4
13.5Walbridge et al, 1983Veith et al, 1983
25±0.5 7.6±0.2 > 8 45 Flow-throughd
(1x/2-4 h)96 LC50 23.8 Broderius and Kahl,
1985
Fathead minnow (adult) 12 7.8 - 8.0 > 5 > 5.0 Semi-statice
Flow-throughe,nominalconcentration
9696
LC50
LC50
21.418.4
Alexander et al, 1978
American flagfish (Jordanella floridae) NSf NSf NSf NSf Staticf
Flow-throughg9696
LC50
LC50
248.4
Smith et al, 1991
Bluegill sunfish (Lepomismacrochirus)
21 - 23 6.5 - 7.8 7.0 - < 8.8 32 - 48 Statich, open, noaeration, nominalconcentration
96 LC50 13 Buccafusco et al, 1981
Golden orfe (Leuciscus idus) NSj NSj NSj NSj NS 9696
LC50
LC50
13081
Knie et al, 1983
Red killifish (Oryzias latipes) 20 NS NS 80 Static, nominalconcentration
48 LC50 39.8 Yoshioka et al, 1986
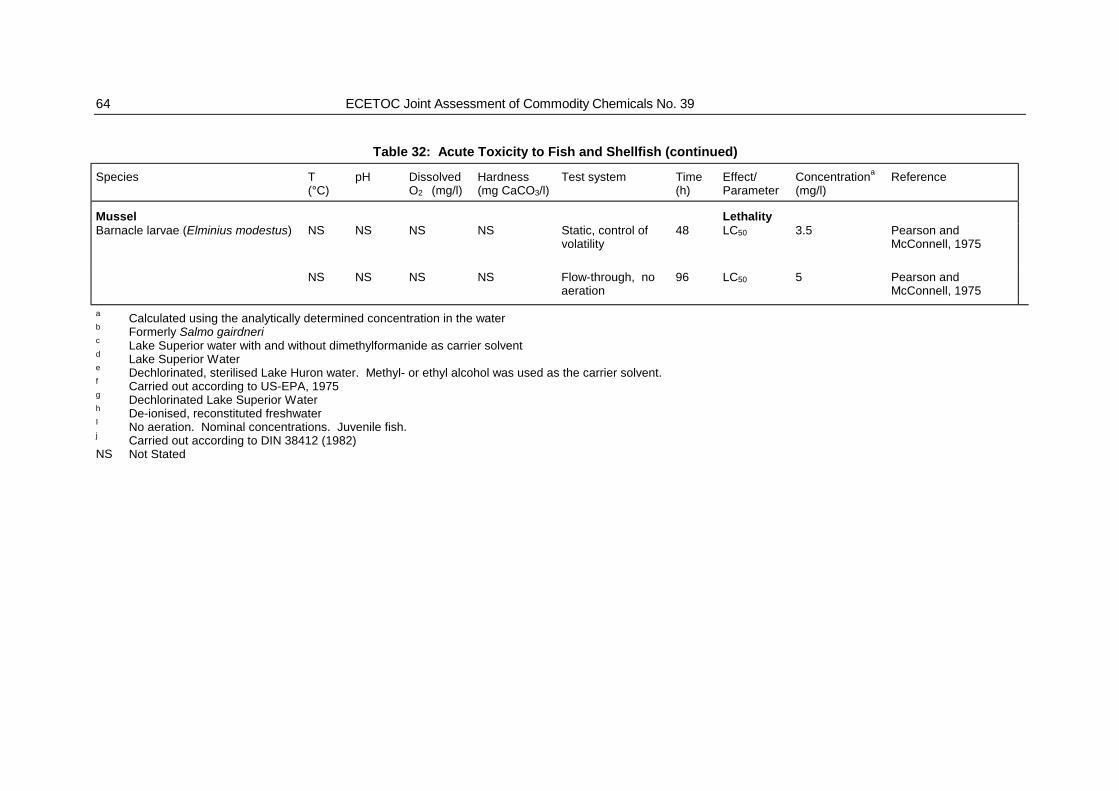
64 ECETOC Joint Assessment of Commodity Chemicals No. 39
Table 32: Acute Toxicity to Fish and Shellfish (continued)
Species T(°C)
pH DissolvedO2 (mg/l)
Hardness(mg CaCO3/l)
Test system Time(h)
Effect/Parameter
Concentrationa
(mg/l)Reference
Mussel LethalityBarnacle larvae (Elminius modestus) NS NS NS NS Static, control of
volatility48 LC50 3.5 Pearson and
McConnell, 1975
NS NS NS NS Flow-through, noaeration
96 LC50 5 Pearson andMcConnell, 1975
a
b
c
d
e
f
g
h
I
j
NS
Calculated using the analytically determined concentration in the waterFormerly Salmo gairdneriLake Superior water with and without dimethylformanide as carrier solventLake Superior WaterDechlorinated, sterilised Lake Huron water. Methyl- or ethyl alcohol was used as the carrier solvent.Carried out according to US-EPA, 1975Dechlorinated Lake Superior WaterDe-ionised, reconstituted freshwaterNo aeration. Nominal concentrations. Juvenile fish.Carried out according to DIN 38412 (1982)Not Stated

Tetrachloroethylene 65
The lowest 72-h EC50 value for growth of freshwater algae (Chlamydomonas reinhardii) was found to
be 3.64 mg PER/l (Brack and Rottler, 1994). The uptake of carbon dioxide by Phaeodactylum
tricornutum became affected from 10.5 mg/l (EC50). A decrease of 13% in 14C-uptake as a measure
for photosynthetic activity was seen in estuarine phytoplankton exposed to 2 mg/l PER, but not at
1 mg/l (Table 33).
Table 33: Acute Toxicity to Algae
Species Method Time (h) Effect/Parameter
Concentration(mg/l)
Reference
Growthinhibition
Marine
Phaeodactylumtricornutum
CO2 uptake NS EC50 10.5 Pearson and McConnell,1975
Skeletonemacostatum
Chlorophyll-acontentCell number
96 EC50 500 US-EPA, 1980
Estuarinephytoplanktona
14C uptake 4848
LOECNOEC
2.0b
1.0cErickson and Hawkins,1980
Freshwater
Selenastrumcapricornutum
Chlorophyll-acontentCell number
96 NOEC 816 US-EPA, 1980
Haematococcuspluvialis
O2 productioninhibition
4 EC10 > 36 Knie et al, 1983
Chlamydomonasreinhardii
Cell number 7272
EC50
LOEC3.641.77
Brack and Rottler, 1994
a Including Chlorophyceae, Cyanophyceae and Bacillariophyceae (23 - 37 mg/l dry weight or suspendedsolids)
b Flow-through (1 x/h)c Nominal concentrationNS Not Stated
6.2.2 Chronic Toxicity
In a 28-d reproduction study in Daphnia magna effects of exposure to PER were seen at 1.1 mg/l; the
NOEC was 0.5 mg/l. Marked differences in growth of nauplii of the brine shrimp (Artemia salina) were
observed, compared to controls, when exposed to 0.25 to 25 mg PER/l (Table 34).
In tests with larvae, fry and adults of various fish species, the lowest observed effect concentration
(LOEC) ranged from 0.1 to 5.83 mg PER/l; the LC50 for the guppy (Poecilia reticulata) was 17.8 mg/l
(Table 34).

66 ECETOC Joint Assessment of Commodity Chemicals No. 39
The chronic toxicity of PER towards two species of algae and one triclad was relatively low, with EC50
values from 8 to > 16 mg/l (Table 34).
Testing over the life cycle of the mysid shrimp (Mysidopsis bahia) resulted in a NOEC of
0.45 mg PER/l. In the same study, a LOEC of 0.84 mg/l was reported for embryos to juveniles of the
fathead minnow (Pimephales promelas). Insufficient details are available to allow an evaluation (US-
EPA, 1980).
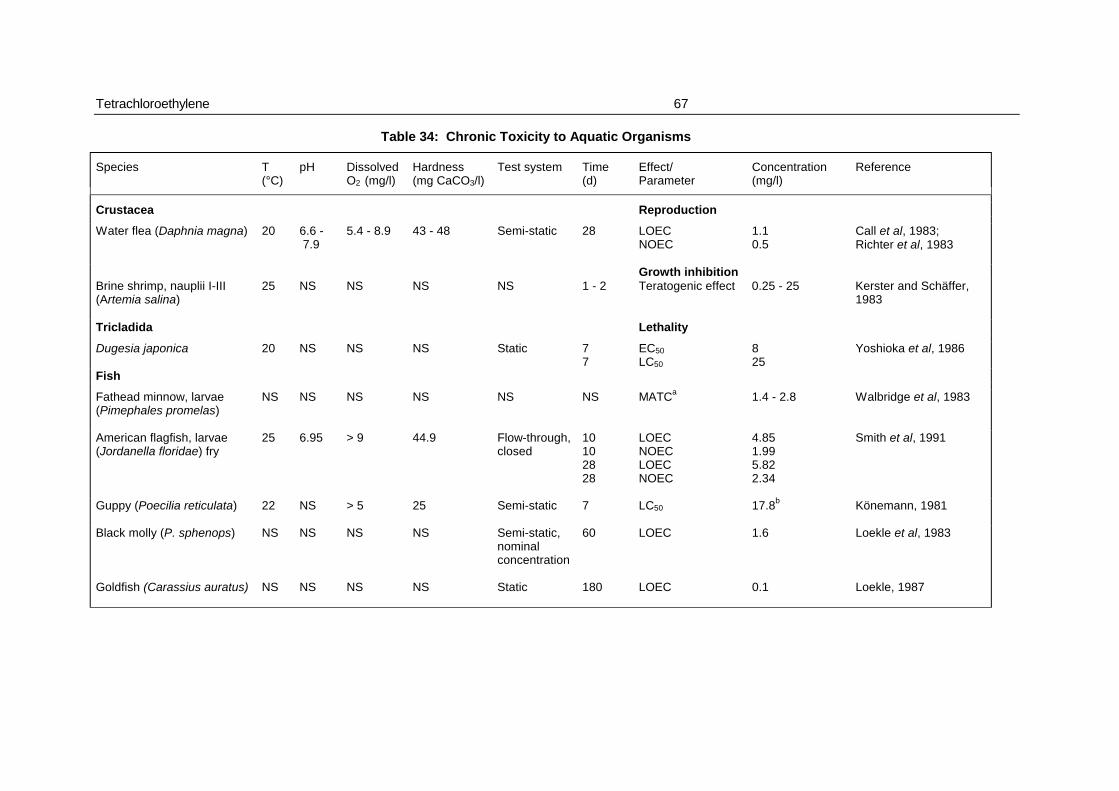
Tetrachloroethylene 67
Table 34: Chronic Toxicity to Aquatic Organisms
Species T(°C)
pH DissolvedO2 (mg/l)
Hardness(mg CaCO3/l)
Test system Time(d)
Effect/Parameter
Concentration(mg/l)
Reference
Crustacea Reproduction
Water flea (Daphnia magna) 20 6.6 - 7.9
5.4 - 8.9 43 - 48 Semi-static 28 LOECNOEC
1.10.5
Call et al, 1983;Richter et al, 1983
Growth inhibitionBrine shrimp, nauplii I-III(Artemia salina)
25 NS NS NS NS 1 - 2 Teratogenic effect 0.25 - 25 Kerster and Schäffer,1983
Tricladida Lethality
Dugesia japonica 20 NS NS NS Static 77
EC50
LC50
825
Yoshioka et al, 1986
Fish
Fathead minnow, larvae(Pimephales promelas)
NS NS NS NS NS NS MATCa 1.4 - 2.8 Walbridge et al, 1983
American flagfish, larvae(Jordanella floridae) fry
25 6.95 > 9 44.9 Flow-through,closed
10102828
LOECNOECLOECNOEC
4.851.995.822.34
Smith et al, 1991
Guppy (Poecilia reticulata) 22 NS > 5 25 Semi-static 7 LC50 17.8b Könemann, 1981
Black molly (P. sphenops) NS NS NS NS Semi-static,nominalconcentration
60 LOEC 1.6 Loekle et al, 1983
Goldfish (Carassius auratus) NS NS NS NS Static 180 LOEC 0.1 Loekle, 1987

68 ECETOC Joint Assessment of Commodity Chemicals No. 39
Table 34: Chronic Toxicity to Aquatic Organisms (continued)
Species T(°C)
pH DissolvedO2 (mg/l)
Hardness(mg CaCO3/l)
Test system Time(d)
Effect/Parameter
Concentration(mg/l)
Reference
Algae Growth inhibition
Skeletonema costatum NS NS NS NS NS 7 EC50 >16 Erickson and Freeman, 1978
Scenedesmus subspicatus NS NS NS NS NS 7 EC3 > 250 UBA, 1986
a Maximum acceptable toxicant concentration, i.e. geometric mean of NOEC and LOECb 30.9 calculated following QSARNS Not stated
Tetrachloroethylene 69
6.2.3 Ecosystems
A study was designed to determine the effects of PER on the phyto- and zooplankton community of
two experimental freshwater ponds at measured initial concentrations of 0.44 and 1.2 mg/l. A residual
concentration of 0.1 mg/l was reached after 5 days in the low-dose pond and after 36 to 38 days in the
high-dose pond. Small differences in toxic effects were seen between the low and high dose levels.
At both concentrations, a lethal effect on Daphnia was observed, the effect occurring within 4 days
(low dose) and within 3 hours to 2 days (high dose). The phytoplankton community showed an
increase in relative abundance and a decrease in species diversity. The autotrophic species,
Spirogyra sp., Microcystis flos aquae, Stichococcus bacillaris and Nitzschia acicularis, showed either a
direct or an indirect sensitivity to PER, whereas the heterotrophic and/or mixotrophic species,
Chilomonas paramecium and Actinophrys sp., increased in total numbers (Lay et al, 1984).
PER was tested for approximately 11 weeks at average measured concentrations of 0, 0.8 and
1.6 mg/l in a 1,000-litre enclosure within a natural pond. The overall biomass of plankton, algae and
microfauna increased, but populations of individual species (certain green algae, Culex, crustacea and
rotifers) decreased when compared to the control enclosure. The mean LC50 values for certain
individual species were lower than in laboratory tests. For example, the LC50 for Daphnia pulex and
Cryptomonas was 0.3 mg/l after 12 to 15 hours, effects being seen at concentrations as low as
0.01 mg/l. The productivity of phytoplankton, expressed as ATP, chlorophyll and primary production
per cell, was also significantly reduced when compared to the control population (Lay and Herrmann,
1989).
A decrease of 13% in 14C-uptake as a measure for photosynthetic activity was seen in estuarine
phytoplankton exposed to 2 mg/l PER, but not at 1 mg/l (Table 34, Erickson and Hawkins, 1980).
6.2.4 Sewage Treatment Plants
PER has been found to inhibit the anaerobic fermentation of sewage sludge by up to 50% at 3 g/kg
sludge (dry weight) (Schefer, 1981a,b) and, in a second study, up to 20% at 70 g/kg (Benson and
Hunter, 1977).
6.3 TERRESTRIAL ORGANISMS
6.3.1 Invertebrates
Two different studies were conducted with the earthworm, Eisenia foetida. The respective LC50 values
were 945 mg/kg (Römbke et al, 1991) and 100 - 320 mg/kg soil (wet weight) (Vonk et al, 1986)
(Table 33). The lower LC50 values in the latter study can be explained by the renewal of the soil (and
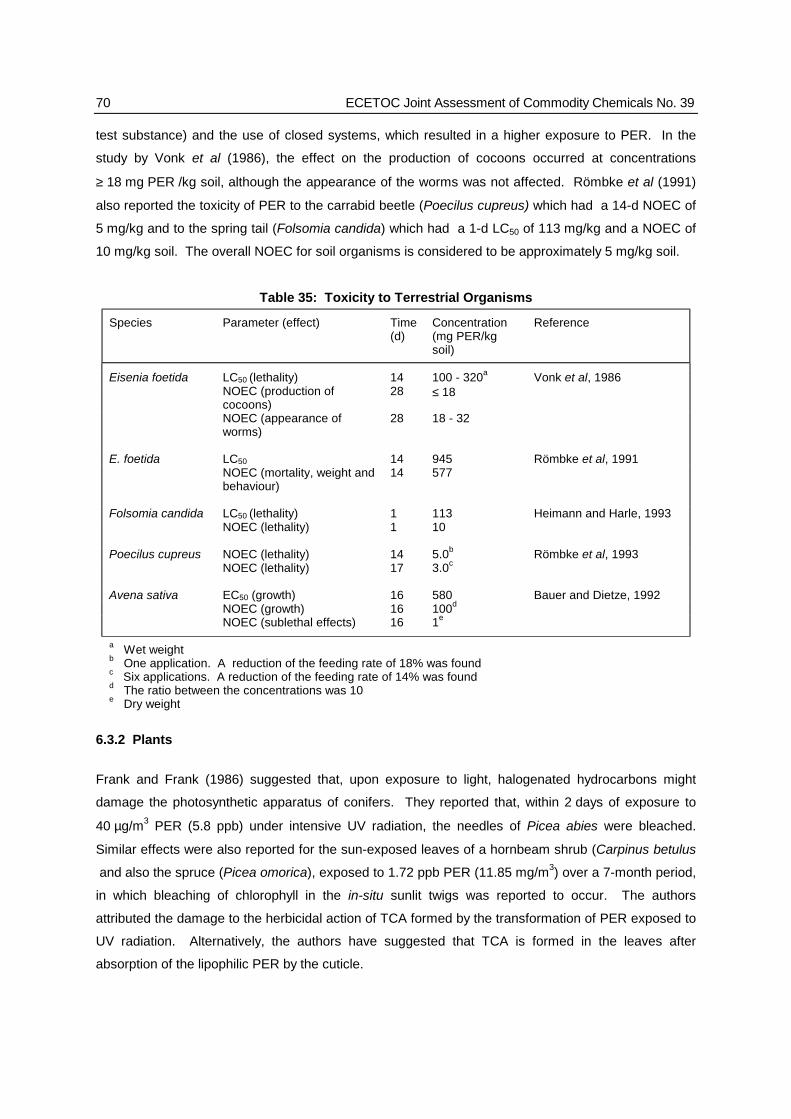
70 ECETOC Joint Assessment of Commodity Chemicals No. 39
test substance) and the use of closed systems, which resulted in a higher exposure to PER. In the
study by Vonk et al (1986), the effect on the production of cocoons occurred at concentrations
≥ 18 mg PER /kg soil, although the appearance of the worms was not affected. Römbke et al (1991)
also reported the toxicity of PER to the carrabid beetle (Poecilus cupreus) which had a 14-d NOEC of
5 mg/kg and to the spring tail (Folsomia candida) which had a 1-d LC50 of 113 mg/kg and a NOEC of
10 mg/kg soil. The overall NOEC for soil organisms is considered to be approximately 5 mg/kg soil.
Table 35: Toxicity to Terrestrial Organisms
Species Parameter (effect) Time(d)
Concentration(mg PER/kgsoil)
Reference
Eisenia foetida LC50 (lethality) 14 100 - 320a Vonk et al, 1986NOEC (production ofcocoons)
28 ≤ 18
NOEC (appearance ofworms)
28 18 - 32
E. foetida LC50 14 945 Römbke et al, 1991NOEC (mortality, weight andbehaviour)
14 577
Folsomia candida LC50 (lethality) 1 113 Heimann and Harle, 1993NOEC (lethality) 1 10
Poecilus cupreus NOEC (lethality) 14 5.0b Römbke et al, 1993NOEC (lethality) 17 3.0c
Avena sativa EC50 (growth) 16 580 Bauer and Dietze, 1992NOEC (growth) 16 100d
NOEC (sublethal effects) 16 1e
a Wet weightb One application. A reduction of the feeding rate of 18% was foundc Six applications. A reduction of the feeding rate of 14% was foundd The ratio between the concentrations was 10e Dry weight
6.3.2 Plants
Frank and Frank (1986) suggested that, upon exposure to light, halogenated hydrocarbons might
damage the photosynthetic apparatus of conifers. They reported that, within 2 days of exposure to
40 µg/m3 PER (5.8 ppb) under intensive UV radiation, the needles of Picea abies were bleached.
Similar effects were also reported for the sun-exposed leaves of a hornbeam shrub (Carpinus betulus
and also the spruce (Picea omorica), exposed to 1.72 ppb PER (11.85 mg/m3) over a 7-month period,
in which bleaching of chlorophyll in the in-situ sunlit twigs was reported to occur. The authors
attributed the damage to the herbicidal action of TCA formed by the transformation of PER exposed to
UV radiation. Alternatively, the authors have suggested that TCA is formed in the leaves after
absorption of the lipophilic PER by the cuticle.
Tetrachloroethylene 71
Further studies by Schröder and Weiss (1991) with Picea abies under normal light conditions and
exposure to 25 ppb PER (172 mg/m3) for 24 hours showed reversible effects on photosynthesis as
well as on respiration and transpiration. The pigment content of the needles was not affected.
Bauer and Dietze (1992) studied the early development of lettuce (Avena sativa, Table 33) exposed to
PER for 16 days to concentrations ranging from 1 to 1,000 mg/kg soil (dry weight). The NOECs for
growth and sublethal effects were respectively of 100 and 1 mg/kg and the 16-d EC50 (growth) as
580 mg/kg soil (dry weight).
6.4 SUMMARY
In the aquatic environment, all trophic levels show similar sensitivity to the acute toxic effects of PER,
with the lowest acute LC50 and EC50 values occurring in the range of 1 to 10 mg/l. In validated studies,
the lowest LC50 for freshwater fish (rainbow trout, Oncorhynchus mykiss) is 5 mg/l (96-h LC50), similar
values being obtained for marine fish species. LC50 values for Daphnia magna are reported from
8.5 mg PER/l. EC50 values for freshwater and marine algae are reported at higher levels (> 500 mg/l).
In fish, chronic exposure to PER does not increase its toxicity significantly. In a study with guppies
(Poecilia reticulata), the 7-d LC50 was 17.8 mg/l (estimated to be 30.9 mg/l by means of QSAR). The
survival rates of black mollies (Poecilia sphenops) exposed to 1.6 mg PER/l for 60 days was 17%.
Studies with embryos and larvae of the fathead minnow (Pimephales promelas) and American flagfish
(Jordanella floridae) resulted in effects at concentrations of 1.4 and 1.99 mg PER/l and above,
respectively.
In ecosystems in natural ponds, D. magna proved to be more sensitive to PER than under laboratory
conditions, with acute lethal concentrations around 0.3 mg/l. Chronic exposure of crustacea to PER
induced effects on reproduction at concentrations of 0.25 mg/l and above. The NOEC for PER in a
validated 28-d study in D. magna was 0.5 mg/l.
At concentrations ranging from 0.1 to 1.6 mg/l, the effects of PER on aquatic phytoplankton are limited
to a decrease in species diversity and productivity. No adverse effects on the aquatic ecosystem have
been reported at concentrations of PER below 0.1 mg/l.
Several soil organisms, including micro-organisms, invertebrates and plants, have been used to
assess the toxicity of PER after acute or prolonged exposure. Most of these studies have been
conducted in non-standard conditions. NOECs are of the order of 1 mg/kg soil (dry weight). Effects
have been reported following exposure to PER at concentrations starting from 10 mg/kg for one plant
species or 18 mg/kg for earthworms (Eisenia foetida). It is suggested that PER may have an adverse

72 ECETOC Joint Assessment of Commodity Chemicals No. 39
effect on the photosynthetic apparatus of conifers and other higher plants following exposure, for
example, to 1.7 ppb PER for 7 months.
Based on its octanol-water partition coefficient, no significant bioaccumulation of PER is expected.
Measured bioconcentration factors for PER in freshwater fish were found to be < 100 (range 26 - 77).
Bioconcentration factors in sea-water have been estimated to be < 100 in fish liver, bird's eggs and
seal blubber. Concentrations of PER in marine algae and plankton have been shown to be
< 180 times higher than the concentrations in sea-water. Thus, there is no evidence of
biomagnification of PER along the food chain.
Tetrachloroethylene 73
7. KINETICS AND METABOLISM
7.1 IN HUMANS
7.1.1 Oral
Human volunteers received 330 µg PER orally by eating 5 eggs fried in oil containing PER.
Measurement of the PER concentration in alveolar air showed that the PER was exhaled with a half-
life of approximately 6.5 hours (Selenka and Bauer, 1984).
7.1.2 Dermal
Healthy volunteers were exposed via the dermal route by immersing one thumb for 30 minutes in a
beaker of PER closed by a membrane. The concentration of PER in samples of exhaled air taken
during and up to 5 hours after exposure, was determined by means of GC; a peak concentration of
0.30 ppm (2.1 mg/m3) was measured 1 hour after exposure (Stewart and Dodd, 1964). The authors
concluded that, under the conditions of the experiment, no toxicologically significant amount of PER
could have been absorbed through the skin.
The percutaneous absorption of PER vapour was studied by exposing ten healthy volunteers to a
vapour concentration of 600 ppm (4,134 mg/m3) for 3.5 hours in a dynamic exposure chamber.
Pulmonary absorption was prevented by the use of respiratory protection. Peak PER concentrations
of approximately 800 µg/l in blood and 8 mg/m3 (1.16 ppm) in expired air were determined by GC
immediately after exposure. Exhalation kinetics were similar to those observed following inhalation
exposure (Section 7.1.3), with a three-phase elimination curve and half-lives of 1, 6 and 72 hours.
Based on the assumption that 98% of the absorbed PER is exhaled, the authors calculated an overall
percutaneous absorption of 284 pmol, i.e. 47.1 mg/person after 3.5 hours (Riihimäki and Pfäffli, 1978).
7.1.3 Inhalation
There are only limited data on the uptake and distribution of PER in humans following inhalation. An
experimental study was conducted in 17 volunteers exposed (7 h/d) by inhalation to 100 ppm PER
vapour (689 mg/m3) for 5 days (Stewart et al, 1970). The kinetic behaviour was analysed by
measuring concentrations of PER in expired air. The authors claimed that a state of equilibrium, in
which the amount of PER excreted or metabolised was equal to the absorbed amount, was not
achieved during the 5 days of exposure. Monitoring of the concentration in expired air showed that
PER was predominantly excreted unchanged via the lungs, approximately 70% of the inhaled amount
being excreted in the first 24 hours after exposure. Accumulation of PER in the body was indicated by
the fact that it took more than 14 days for the remaining 30% of inhaled PER to be excreted via the
lungs. Skender et al (1991) measured levels of PER and TCA in blood, and TCA in urine, of 18 dry-
74 ECETOC Joint Assessment of Commodity Chemicals No. 39
cleaning workers exposed to between 33 and 53 ppm PER (227.4, 365 mg/m3). Samples were taken
before work on Monday and after work on Thursday. The most reliable biological indicator of
exposure was considered to be PER in blood since TCA levels remained almost constant throughout
the working week.
The toxicokinetic behaviour of PER in humans following inhalation exposure under experimental
conditions has been studied using a simplified two-compartment model. The two compartments were
defined as (i) well perfused tissues (e.g. liver, heart) with rapid blood flow and (ii) well perfused
splanchnic tissues with slower blood flow. The duration of exposure ranged from 1 to 60 minutes and
the concentration of PER in inhaled air from 0.5 - 10 ppm (3.4 - 68.9 mg/m3). The kinetic behaviour
was recorded by measuring the concentration of PER in exhaled (alveolar) air, during and immediately
after exposure, and during a subsequent period of 10 days. Analysis of the data showed biphasic
kinetic behaviour with a rapid initial drop of alveolar PER concentrations (half-life in the order of
minutes), followed by a slow concentration decrease (half-life in the order of days). The authors
suggested that the second, slow, phase was due to PER accumulation in deeper compartments, such
as adipose tissue. Further examination revealed that the fast initial kinetic phase is again divided into
two subphases with an initial decrease of the alveolar concentration (half-life: 15 - 25 s), followed by a
stationary phase (approximately 1 - 3 min) and a subsequent concentration decrease at a slower rate
(half-life not determined). The authors claimed that this behaviour was caused by large differences in
blood circulation times for the two compartments of their model (Opdam and Smolders, 1986, 1987).
Personal monitoring of human beings exposed to atmospheric PER, by means of analysis of their
urine for total trichlorinated compounds (trichloroethanol and TCA), showed that urinary metabolite
levels increased linearly with external PER concentrations < 100 ppm (< 689 mg/m3). A plateau in
metabolite excretion in humans was apparent when the external exposure was high, indicating that
metabolic saturation occurs at approximately 100 ppm (Ikeda et al, 1972; Ohtsuki et al, 1983).
Ohtsuki et al (1983) calculated that, at the end of an 8-h shift with exposure to 50 ppm PER
(344.5 mg/m3), approximately 38% of the inhaled dose would have been exhaled unchanged and
< 2% transformed to urinary metabolites; the remaining 60% would be eliminated later. Following
inhalation, the mean half-life of exhaled PER was 79 min (Benoit et al, 1985). The half-life of TCA in
urine and blood was 65-90 hours (Monster et al, 1983).
The excretion of urinary metabolites has been studied in one male and one female dry-cleaning
worker exposed to PER at a mean concentration of 50 ppm (344.5 mg/m3) for at least 8 h/d, 5 d/wk
and in 2 females exposed to the same concentration for 4 h/d, 5 d/wk. Urine samples were taken at
the end of the work shift on a Monday afternoon and again at the end of the workshift on the following
Friday. PER was detected in urine from all 4 individuals, day 1 levels ranging from 18.7 to
26.9 nmol/mg creatinine. TCA was only detected in the urine of those exposed to PER for at least 8
h/d, day 1 levels being 21.7 and 40.7 nmol/mg creatinine. In addition, the mercapturic acid derivative,
Tetrachloroethylene 75
N-acetyl-S-(1,2,2-trichlorovinyl)-L-cysteine, was detected in the urine of all 4 individuals on day 5. The
levels detected ranged from 2.2 to 6.0 pmol/mg creatinine in those exposed for 4 h/d and from 10.4 to
14.6 pmol/mg creatinine in those exposed for at least 8 h/d. It is believed that the mercapturic acid
derivative is the consequence of the metabolism of PER by GSH transferase, as has been seen in the
rat (Birner et al, 1998).
7.2 IN EXPERIMENTAL ANIMALS
7.2.1 Dermal
The whole-body dermal absorption of PER has been investigated in rats. Animals with closely-clipped
fur were exposed to vapour concentrations of 12,500 ppm (86,130 mg/m3) for 4 hours, while breathing
fresh air through a mask. Peak blood concentrations, determined by GC, were approximately 35 µg/l
at the end of the 4-h exposure period. A physiologically-based pharmacokinetic (PBPK) model was
used to predict a dermal permeability constant of approximately 0.67 µg/cm2/h for PER, consistent
with the experimental blood concentration (McDougal et al, 1990). The authors compared the animal
data with the data on human percutaneous absorption from the study by Riihimäki and Pfäffli (1978)
(Section 7.1.2). Using the PBPK-model, a permeability constant of 0.17 µg/cm2/h for absorption of
PER through human skin was calculated. The authors concluded that, for a range of chemicals
including PER, rat skin permeability constants were consistently 2 to 4 times greater than constants for
human skin, probably due to physiological differences in the skin of the two species.
7.2.2 Inhalation
PER is metabolised in rodents by cytochrome P450 enzymes, predominantly to TCA. A number of
minor metabolites arising from this pathway have also been identified. A second, minor, pathway has
been described in the rat involving conjugation of PER with GSH and processing through the
mercapturic acid pathways leads to the excretion of mainly N-acetyl-S-(1,1,2-trichlorovinyl)-L-cysteine
in urine. Further details of the pharmacokinetics and metabolism of PER via these pathways have
been reviewed earlier (ECETOC, 1990); the metabolic pathways are shown in Figure 1.
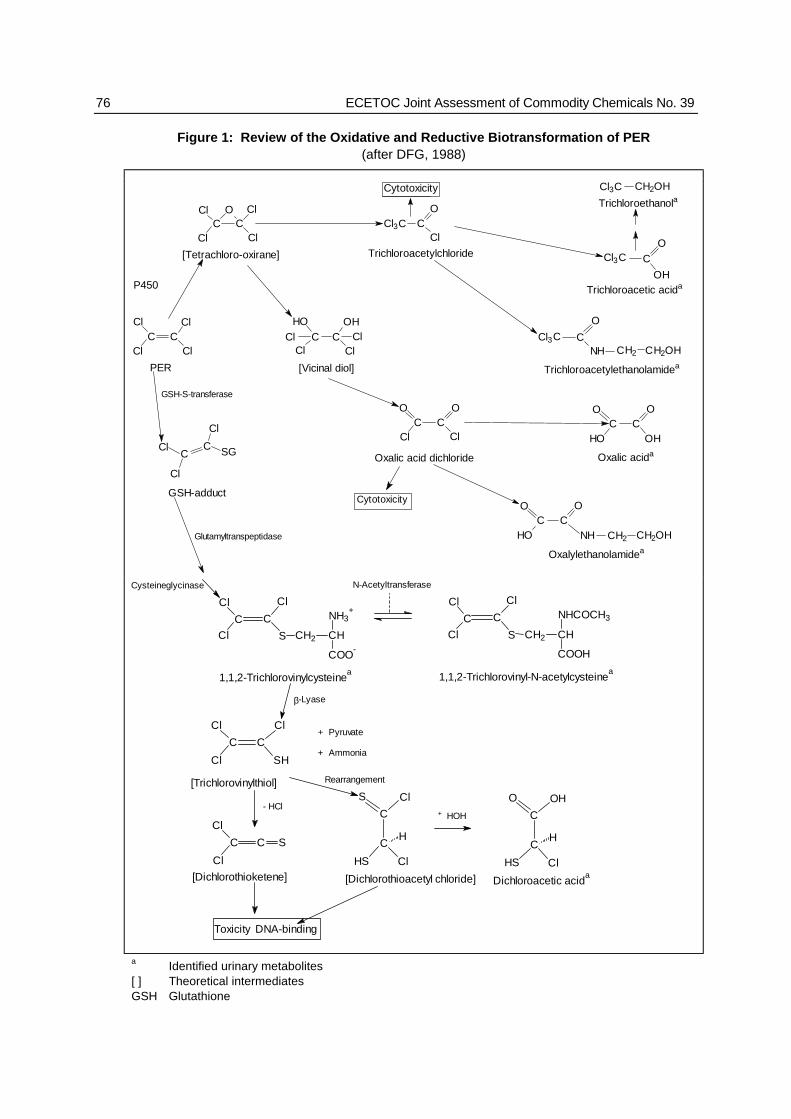
76 ECETOC Joint Assessment of Commodity Chemicals No. 39
Figure 1: Review of the Oxidative and Reductive Biotransformation of PER(after DFG, 1988)
Cl
CCl Cl
ClC
ClC
O
C
Cl3CO
C
OH
CCl3 CH2OH
[Tetrachloro-oxirane] Trichloroacetylchloride
Trichloroacetylethanolamidea
Cl3CH2OH
C
O
NH C CH2
PER
Cl
CCl
Cytotoxicity
Cl
ClC
ClC
Cl
OCl3
HO
CCl Cl
C
OH
Cl Cl
[Vicinal diol]
OC
ClC
Cl
O
C
HO
OC
OH
O
Oxalic acid dichloride Oxalic acida
C
HO
OC
O
Oxalylethanolamidea
NH CH2C H2OH
Trichloroacetic acida
GSH-adduct
GSH-S-transferase
SG
Cl
C
Glutamyltranspeptidase
Trichloroethanola
P450
Cytotoxicity
S
Cl
C
Cl
C
ClNH3
+
COO-
CH2 CH
S
Cl
C
Cl
C
ClNHCOCH3
COOH
CH2 CH
N-Acetyltransferase
1,1,2-Trichlorovinylcysteinea 1,1,2-Trichlorovinyl-N-acetylcysteine
a
Cl
C
SH
Cl
C
Cl
β-Lyase
[Trichlorovinylthiol]
+ Pyruvate
+ Ammonia
Cl
C
Cl
C S
[Dichlorothioketene]
- HCl
H
S Cl
C
HS
C
Cl
[Dichlorothioacetyl chloride]
Toxicity DNA-binding
O OH
C
HS
C
Cl
Dichloroacetic acida
H
+ HOH
Cysteineglycinase
Rearrangement
a Identified urinary metabolites[ ] Theoretical intermediatesGSH Glutathione
Tetrachloroethylene 77
Since the ECETOC (1990) review, the following studies have been published. Exposure of rats to
PER has been shown to result in the formation of dichloro- and trichloro-acetyl adducts at the lysine
residues of renal and hepatic proteins (Birner et al, 1994). The N-trichloroacetyl adduct is presumed
to be derived from trichloroacetyl chloride, an intermediary metabolite in the cytochrome P450
metabolism of PER. The N-dichloroacetyl adducts, which occurred predominantly in the kidney, were
also found following intravenous administration of the PER metabolite, S-(1,1,2-trichlorovinyl)-L-
cysteine, suggesting that these adducts are formed by the action of renal β-lyase. N-acetyl-S-(1,2,2-
trichlorovinyl)-L-cysteine has been shown to undergo S-oxidation in liver fractions from male, but not
female rats (Werner et al, 1996). The resulting sulphoxide is reported to be cytotoxic to rat renal
epithelial cells in vitro without further metabolic activation. However, at the present time, this
metabolite has not been observed in vivo and a possible contribution towards the renal toxicity of PER
in the rat has not been established.
7.3 KINETIC MODELS
Guberan and Fernandez (1974) developed a PBPK model based on the division of the body into
4 physiological compartments, i.e. a blood vessel-rich group corresponding to brain, heart etc., a
muscle group corresponding to muscles and skin, a fat group corresponding to adipose tissue and a
blood vessel-poor group composed of connective tissue. The authors predicted that an 8-h exposure
of humans to 100 ppm PER would result in a body burden of 1,000 mg of the solvent for a 70 kg
person, of which 50% would be distributed to the fat tissue. More recent multi-compartment models
which include metabolism have used the PBPK approach to describe the uptake, metabolism and
elimination of PER in a number of species (Rao and Brown, 1993; Dallas et al, 1994a,b,c).
A significant number of models of this type have been developed for cancer risk assessments (Hattis
et al, 1986; Reitz and Nolan, 1986; Bogen and McKone, 1987; Ward et al, 1988; Travis et al; 1989),
including two (Hattis et al, 1986; Travis et al, 1989) which include risk calculations (Appendix C).
Several publications have considered the precision and sensitivity of these models (Farrar et al, 1989;
Hattis et al, 1990; Bois et al, 1990; Gearhart et al, 1993). A further use of this type of model has
included a description of the lactational transfer of PER in rats (Bysczkowski and Fisher, 1994;
Bysczkowski et al, 1994) and humans (Bysczkowski and Fisher, 1995).
All these models have used data from the published literature to derive metabolic constants for either
rodents or humans. The models provide an estimate of the dose metabolised by the cytochrome
P450 pathway but do not include a description of the GSH pathway that is now known to exist in
rodents. They have concentrated on the calculation of total metabolised dose from applied dose, by
gavage or inhalation, and on extrapolation between species based on differences in physiology. None
of them yet provide a full description of the pharmacokinetic behaviour of PER, its metabolism by two
pathways, and the pharmacokinetics of the metabolites.
78 ECETOC Joint Assessment of Commodity Chemicals No. 39
7.4 EVALUATION
The major pathway of PER metabolism in all species, including humans, is cytochrome P450
mediated oxidation to TCA. Significant species differences have been observed. In both humans and
rats, the oxidative pathway appears to be saturated following exposure to atmospheric concentrations
above approximately 100 ppm, since no increase in metabolite (TCA) excretion has been found at
higher exposure concentrations. In contrast, the TCA level in the blood of mice continues to increase
with the external dose of PER, indicating that the oxidative metabolism is not saturated following
exposure to concentrations up to 400 ppm, the highest concentration tested. After oral administration,
saturation of the cytochrome P450 pathway was observed in mice at doses above 200 mg/kgbw
(roughly equivalent to 1,000 ppm/6 h; 6,890 mg/m3/6 h).
A second minor pathway involving conjugation of PER with GSH has been identified in the rat. The
resulting GSH-conjugate is metabolised to a mercapturic acid derivative, which is excreted in the
urine. This metabolite could subsequently be activated by renal β-lyase to intermediates that react with
proteins. In vitro studies have failed to provide evidence for GSH conjugation of PER in humans
(ECETOC, 1990).
It is believed that the mercapturic acid derivative seen in humans exposed to PER (Birner et al, 1998)
is the consequence of the metabolism of PER by GSH transferase, as has been seen in the rat. In
comparison, therefore, the rates of metabolism of PER by the P450 pathway, as assessed by
measuring urinary levels of TCA and trichloroethanol, were over 3 orders of magnitude higher than
those for the GST pathway in humans. In rats, the ratio of utilisation of these two pathways is
approximately 2 orders of magnitude, with the P450 pathway being dominant. The low levels of the
mercapturic acid derivative excreted suggests that this pathway accounts for only a small proportion of
the metabolism of PER in humans. Furthermore, humans metabolise PER less efficiently by GSH
conjugation than rats, supporting previous findings (Green et al, 1990) that the risk of renal toxicity in
humans from this pathway is significantly lower than that in rats.
The results of all published studies based on pharmacokinetic models are in good agreement.
Following inhalation, PER is readily absorbed and distributed in the human body and approximately
70% of the inhaled dose is excreted via the lungs in the first 24 hours after exposure. A part of the
inhaled dose is accumulated in the adipose tissue and is exhaled with a long half-life (> 10 d).
Furthermore these studies show that, due to a lack of sensitivity of the method for measuring PER
concentration in alveolar air, the amount of metabolised PER could not be quantified since no
difference between the amount of inhaled and exhaled PER was detected.
Thus, measurement of the excretion of TCA in urine would seem to be the most appropriate method
for determining the metabolised fraction of a given PER dose. This was shown in studies with
Tetrachloroethylene 79
personal monitoring of exposure to atmospheric PER accompanied by analysis of urine for total
trichlorinated compounds (trichloroethanol and TCA). At the end of an 8-h shift with exposure to 50
ppm PER, Ohtsuki et al (1983) calculated that approximately 38% of the inhaled dose would have
been exhaled unchanged and less than 2% transformed to urinary metabolites; the remaining 60%
would be eliminated later. The urinary metabolite levels increased linearly with external concentrations
of PER up to 100 ppm (689 mg/m3). Metabolite excretion was apparently reaching a plateau when the
external exposure was higher, indicating that in humans metabolic saturation occurs at approximately
100 ppm (Ikeda et al, 1972; Ohtsuki et al, 1983).
A number of kinetic models have been developed for PER, several based on a PBPK approach. The
models, in general, describe toxicological risk in terms of total metabolised dose and extrapolation
between species using species specific physiology. None of the models yet provides a full description
of the pharmacokinetic behaviour of PER and consequently are not entirely satisfactory for the
prediction of the carcinogenic or other toxicological risks to man.
80 ECETOC Joint Assessment of Commodity Chemicals No. 39
8. EFFECTS ON EXPERIMENTAL ANIMALS AND IN VITRO TEST
SYSTEMS
8.1 ACUTE TOXICITY
8.1.1 Oral
Details of the findings of lethality in acute oral toxicity studies with PER are presented in Table 36.
Table 36: Acute Oral Toxicity
Species, sex Effect /Parameter
Dose(mg/kgbw)
Remark Reference
Lethality
Rat M F
LD50 3,0053,835
Ataxia and CNS depressionpreceding death
Hayes et al, 1986
Rat M F
LD50 ≥ 2,2002,440
Tremors Withey and Hall,1975
Rat M LD50 4,460 Pozzani et al, 1959
Mouse M LD50 7,814 Wenzel and Gibson,1951
Mouse LD50 8,100 Dybing and Dybing,1946
Mouse - 6,022-7,5287,528
No deathsAll animals died within 2 - 9 h
Lamson et al, 1929
Rabbit - 4,5177,528
No deathsAll animals died within 7 - 20 h
Lamson et al, 1929
Dog - 3,000, 6,000 No deaths during 7 dobservation
Barsoum and Saad,1934
Only in a few, limited studies have the acute toxic effects other than death following oral exposure of
experimental animals to PER been described. Tremors, ataxia and depression of the CNS preceding
the death of rats exposed to high levels of PER (≥ 2,200 mg/kgbw) have been reported (Hayes et
al,1986).
There is some evidence of fatty changes in the liver (without changes in levels of relevant serum
enzymes) and of decreases in cardiac and respiratory rates in dogs receiving ≥ 286 mg /kgbw PER
(Christensen and Lynch, 1933).
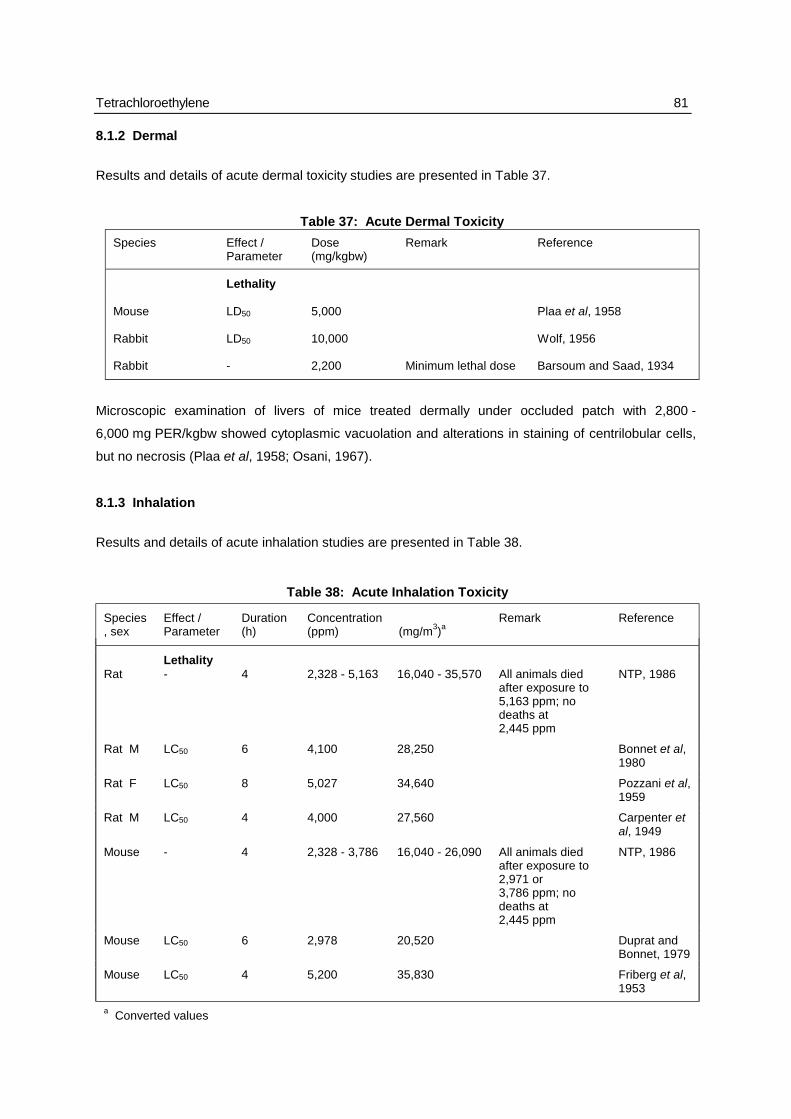
Tetrachloroethylene 81
8.1.2 Dermal
Results and details of acute dermal toxicity studies are presented in Table 37.
Table 37: Acute Dermal Toxicity
Species Effect /Parameter
Dose(mg/kgbw)
Remark Reference
Lethality
Mouse LD50 5,000 Plaa et al, 1958
Rabbit LD50 10,000 Wolf, 1956
Rabbit - 2,200 Minimum lethal dose Barsoum and Saad, 1934
Microscopic examination of livers of mice treated dermally under occluded patch with 2,800 -
6,000 mg PER/kgbw showed cytoplasmic vacuolation and alterations in staining of centrilobular cells,
but no necrosis (Plaa et al, 1958; Osani, 1967).
8.1.3 Inhalation
Results and details of acute inhalation studies are presented in Table 38.
Table 38: Acute Inhalation Toxicity
Species, sex
Effect /Parameter
Duration(h)
Concentration(ppm) (mg/m3)a
Remark Reference
LethalityRat - 4 2,328 - 5,163 16,040 - 35,570 All animals died
after exposure to5,163 ppm; nodeaths at2,445 ppm
NTP, 1986
Rat M LC50 6 4,100 28,250 Bonnet et al,1980
Rat F LC50 8 5,027 34,640 Pozzani et al,1959
Rat M LC50 4 4,000 27,560 Carpenter etal, 1949
Mouse - 4 2,328 - 3,786 16,040 - 26,090 All animals diedafter exposure to2,971 or3,786 ppm; nodeaths at2,445 ppm
NTP, 1986
Mouse LC50 6 2,978 20,520 Duprat andBonnet, 1979
Mouse LC50 4 5,200 35,830 Friberg et al,1953
a Converted values

82 ECETOC Joint Assessment of Commodity Chemicals No. 39
Animals exposed to PER by inhalation died as a consequence of respiratory failure following CNS
depression (narcotic or anaesthetic effects) (Section 8.9).
Effects on the Liver
Small increases in liver weight, slight cloudy swelling and elevated total lipids were seen in Wistar rats
24 hours after exposure to near lethal concentrations of PER (> 2,000 ppm (13,780 mg/m3) for up to
14 hours (Rowe et al, 1952). Increased levels of acetone in expired air, a possible indicator for
enhanced lipid peroxidation, occurred when Wistar rats were exposed to ≥ 110 ppm PER
(≥ 758 mg/m3) for up to 25 hours (Filser and Bolt, 1980; Filser et al, 1978, 1982).
Moderate fatty degeneration of the liver was observed in female mice at 24 hours and 72 hours
following a single 4-h exposure to PER concentrations of > 400 ppm (> 2,756 mg/m3) and at 24 hours
following a single 4-h exposure to 200 ppm (1,378 mg/m3) (Kylin et al, 1963). Increased triglyceride
levels were also observed in female mice (Cb strain) in time-course studies following 3-h exposure to
800 ppm (5,512 mg/m3); total lipids reached maximum levels at 8 hours, but were still elevated at
20 hours post-exposure. ATP levels in the liver decreased rapidly during exposure to 800 ppm,
continued to decrease until 8-h post-exposure and returned to normal levels by 20 hours (Ogata et al,
1968).
A dose-related increase in the levels of marker enzymes for hepatic damage was found in the serum
of male CD1 rats immediately following exposure to PER for 4 hours. Aspartate aminotransferase
(AST) and ornithine carbamoyl transferase (OCT) levels were increased following exposure to
500 ppm PER (3,445 mg/m3) (the lowest dose examined); alanine aminotransferase (ALT) and
glucose-6-phosphatase were elevated at levels ≥ 1,000 ppm, (6,890 mg/m3) for at least 48 hours after
cessation of the exposure (Drew et al, 1978). Significantly elevated AST levels were found in
approximately 50% of mice exposed to 3,700 ppm PER (25,490 mg/m3) for 7 - 8 hours (Kylin et al,
1963; Gehring, 1968).
Cardiac Effects
Following exposure of conscious New Zealand White rabbits to 5,200 ppm PER (35,830 mg/m3) for
1 hour, the heart became sensitised to arrhythmias induced by doses of noradrenaline (≤ 3 mg/kgbw)
(Carlson, 1975). Exposure of dogs to concentrations of 5,000 or 10,000 ppm PER (34,450 or
68,900 mg/m3) for 10 minutes did not result in cardiac sensitisation to adrenaline (Reinhardt et al,
1973).

Tetrachloroethylene 83
8.1.4 Intraperitoneal
Results are presented in Table 39.
Table 39: Acute i.p. Toxicity
Species, sex Effect /Parameter
Dose(mg/kgbw)
Reference
Lethality
Mouse LD50 4,600 Klaassen and Plaa, 1966
LD50 5,700 Gehring, 1968
Dog LD50 3,200 Klaassen and Plaa, 1967
Minor histopathological changes (enlarged hepatocytes with cellular infiltration and vacuolation) have
been shown in the livers of Sprague-Dawley rats, guinea pigs and dogs following i.p. doses of 2 -
4 g PER/kgbw. Serum levels of liver enzymes were increased in the rat (≥ 400 mg/kgbw), mouse,
guinea pig (≥ 200 mg/kgbw) and in the dog (Klaassen and Plaa, 1966, 1967; Gehring, 1968;
DiVincenzo and Krasavage, 1974). Toxic effects on the kidney have been reported at high i.p. dose
levels in the mouse and the dog (Plaa and Larson, 1965; Klaassen and Plaa, 1966, 1967).
Histopathological examination of Swiss mice treated with 3,800 mg/kgbw (a near-lethal dose) showed
swelling of the proximal convoluted tubules in all animals, with more than 50% of the tubules affected
in 67% of the animals. Protein was seen in the urine of mice 24 hours after dosing with 3.8 or
7.5 g PER/kgbw (Plaa and Larson, 1965).
8.1.5 Intravenous
Results are presented in Table 40.
Table 40: Acute i.v. Toxicity
Species,sex
Effect /Parameter
Dose(mg/kgbw)
Remark Reference
Lethality
Dog - 85 Minimal lethal dose; death due torespiratory failure
Barsoum and Saad, 1934
Cat - 81.4 Median lethal dose Hobara et al, 1981
Superoxide dismutase (SOD) activity was markedly reduced in heart, lung and liver, spleen, kidney,
brain, muscle, small intestine and pancreas of dogs anaesthetised by pentobarbitone following i.v.
injection of 50 mg PER/kgbw. There were no significant changes in the blood levels of this enzyme
(Hobara et al, 1981).
84 ECETOC Joint Assessment of Commodity Chemicals No. 39
Studies in the dog, rabbit and cat showed that single i.v. doses of PER (10 - 24 mg/kgbw) caused a
sensitising effect to noradrenaline-induced cardiac arrhythmias (Kobayashi et al, 1982).
8.1.6 Summary
PER exhibits low acute toxicity by all routes of administration, excepting the i.v. route. Death is due to
respiratory failure following CNS depression.
Effects on the liver of various animal species occur at ≥ 200 ppm (1,378 mg/m3) by inhalation and at
≥ 400 mg/kgbw i.p. Renal effects in mice are seen following high parenteral doses (> 3,000 mg/kgbw
i.p.).
Cardiac sensitisation to catecholamine-induced arrhythmias is observed in rabbits, but not in dogs,
following exposure by inhalation to 5,200 ppm PER (35,830 mg/m3) and in the rabbit, dog and cat
following i.v. administration of 10 - 24 mg/kgbw.
8.2 IRRITATION, SENSITISATION AND IMMUNOTOXICITY
8.2.1 Skin Irritation
PER was reported to be a severe irritant to the skin of rabbits following application of 0.5 ml under an
occlusive dressing for 24 hours (Duprat et al, 1976). A study in New Zealand White rabbits, carried
out according to the then current OECD and EEC guidelines and using a semi-occlusive dressing also
showed severe skin irritation. The primary irritation index for PER in this latter study was 5.7 on a
scale of 0 to 8 (Van Beek, 1990).
Application of 1 ml of PER to the guinea pig skin under an occlusive dressing for more than
15 minutes caused severe karyolysis, oedema, spongiosis and pseudo-eosinophilic infiltration at the
site of application (Kronevi et al, 1981).
8.2.2 Respiratory Irritation
The respiratory irritation potential of PER was investigated in rats exposed to approximately
10,000 ppm (68,900 mg/m3) for 25 minutes (Janssen, 1990). Respiratory frequencies were measured
before, during and after exposure in a protocol similar to that proposed by Alarie (1981). No decrease
in respiratory rate was found and it was concluded that under the test conditions PER was not irritating
to the respiratory tract. On the contrary, an increase of the respiratory rate was found and interpreted
as being due to a systemic effect on the nervous systems.

Tetrachloroethylene 85
8.2.3 Eye Irritation
Liquid PER was irritant when instilled into the rabbit eye (Torkelsson and Rowe, 1981). Application of
PER (0.1 ml) to the rabbit eye caused a mild to medium discharge with epithelial damage that was
reversible (Duprat et al, 1976). The authors concluded that PER was a mild eye irritant.
8.2.4 Sensitisation
Skin Sensitisation
The skin sensitising potential of PER was investigated in a group of 9 male guinea-pigs using the split
adjuvant technique. No skin sensitisation was observed in any of the test animals (Rao et al, 1981).
Respiratory Sensitisation
No data are available.
8.2.5 Effects on the Immune Function
Following an aerosol challenge of viable Streptococcus zooepidemicus, a group of 140 female CD1
mice that had been previously exposed to 50 ppm PER (344.5 mg/m3) for 3 hours showed a
significant increase in mortality when compared to controls. A corresponding decrease in pulmonary
resistance to inhaled Klebsiella pneumonia was also observed. No effects were seen in mice exposed
to 25 ppm PER (172 mg/m3) for 3 hours, either as a single exposure or following 5 daily exposures
(Aranyi et al, 1986). The significance of these findings for human health hazard assessment is
unclear.
Rats exposed to 2.8 ppm PER (19 mg/m3) continuously for 94 days gave a negative result in the
haemagglutination test suggesting the absence of an immunological response to PER
(Bonashevskaya et al, 1977; Tsulaya et al, 1977).
8.2.6 Evaluation
PER is a severe skin irritant when applied under occlusive or semi-occlusive dressings; it is a mild eye
irritant. PER is not a skin sensitiser and no significant effects on the immune function have been
described.

86 ECETOC Joint Assessment of Commodity Chemicals No. 39
8.3 SUBCHRONIC TOXICITY
8.3.1 Oral
Details of subchronic oral toxicity studies are given in Table 41.
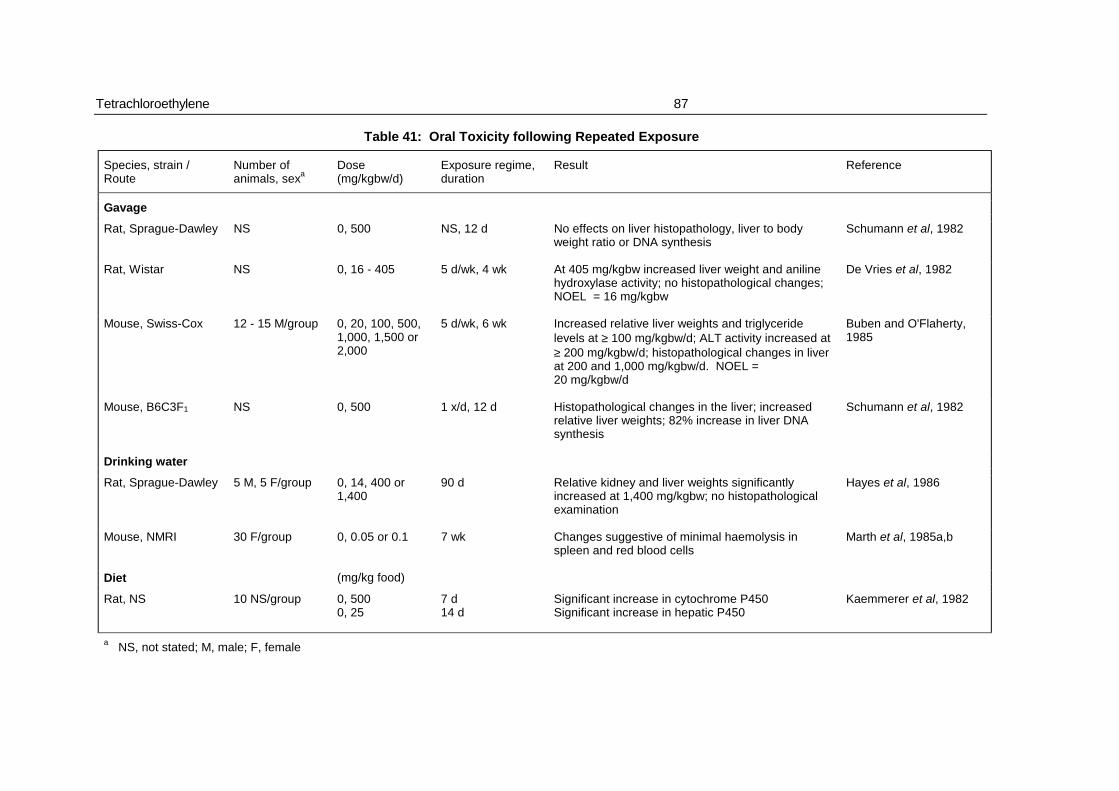
Tetrachloroethylene 87
Table 41: Oral Toxicity following Repeated Exposure
Species, strain /Route
Number ofanimals, sexa
Dose(mg/kgbw/d)
Exposure regime,duration
Result Reference
Gavage
Rat, Sprague-Dawley NS 0, 500 NS, 12 d No effects on liver histopathology, liver to bodyweight ratio or DNA synthesis
Schumann et al, 1982
Rat, Wistar NS 0, 16 - 405 5 d/wk, 4 wk At 405 mg/kgbw increased liver weight and anilinehydroxylase activity; no histopathological changes;NOEL = 16 mg/kgbw
De Vries et al, 1982
Mouse, Swiss-Cox 12 - 15 M/group 0, 20, 100, 500,1,000, 1,500 or2,000
5 d/wk, 6 wk Increased relative liver weights and triglyceridelevels at ≥ 100 mg/kgbw/d; ALT activity increased at≥ 200 mg/kgbw/d; histopathological changes in liverat 200 and 1,000 mg/kgbw/d. NOEL =20 mg/kgbw/d
Buben and O'Flaherty,1985
Mouse, B6C3F1 NS 0, 500 1 x/d, 12 d Histopathological changes in the liver; increasedrelative liver weights; 82% increase in liver DNAsynthesis
Schumann et al, 1982
Drinking water
Rat, Sprague-Dawley 5 M, 5 F/group 0, 14, 400 or1,400
90 d Relative kidney and liver weights significantlyincreased at 1,400 mg/kgbw; no histopathologicalexamination
Hayes et al, 1986
Mouse, NMRI 30 F/group 0, 0.05 or 0.1 7 wk Changes suggestive of minimal haemolysis inspleen and red blood cells
Marth et al, 1985a,b
Diet (mg/kg food)
Rat, NS 10 NS/group 0, 5000, 25
7 d14 d
Significant increase in cytochrome P450Significant increase in hepatic P450
Kaemmerer et al, 1982
a NS, not stated; M, male; F, female

88 ECETOC Joint Assessment of Commodity Chemicals No. 39
Gavage
No effects on liver histology, relative liver weights or hepatic DNA synthesis were reported in Sprague-
Dawley rats following oral dosing with 500 mg/kgbw/d for 12 days (Schumann et al, 1982).
Increased relative liver weights and increased liver aniline hydroxylase activity (without
histopathological changes) were observed in Wistar rats following oral dosing with 405 mg/kgbw/d for
4 weeks. No effects on the liver were observed in rats receiving 16 mg/kgbw/d (De Vries et al, 1982).
Buben and O'Flaherty (1985) administered PER in corn oil by gavage to groups of Swiss-Cox mice at
several doses up to 2,000 mg/kgbw/d for 6 weeks. Statistically significant, dose-related increases
occurred in relative liver weights and liver triglyceride levels at doses of 100 mg/kgbw/d or more.
Alanine aminotransferase (ALT) activity was significantly increased at doses of 200 mg/kgbw/d and
above. Maximal levels in triglyceride and ALT activity were reached following 1,000 mg/kgbw/d.
Glucose-6-phosphatase activity in the liver was significantly decreased following 500 mg/kgbw/d.
Histological examination of mice receiving 200 or 1,000 mg/kgbw/d groups showed severe
degenerative changes in the liver with evidence of nuclear disintegration at both dose levels.
Following 1,000 mg/kgbw/d, centrilobular necrosis was seen in some livers. The NOEL for all effects
was 20 mg/kgbw/d.
Schumann et al (1982) reported (unspecified) histological changes in the liver of the B6C3F1 mouse,
as well as a significant (25%) increase in liver to body weight ratio and an 82% increase in DNA
synthesis, suggesting cytotoxicity after 12 oral doses of 500 mg/kgbw/d PER.
Drinking Water
PER was administered via the drinking water to male and female Sprague-Dawley rats at estimated
daily doses of 0, 14, 400 or 1,400 mg/kgbw/d for 90 consecutive days. The dosing solutions were
made in de-inonised water with 4% polyoxylated emulsion. There were no treatment-related
mortalities. Body weights were significantly lower in both sexes in the higher dose groups. Relative
liver and kidney weights were significantly increased in males receiving 400 mg/kgbw/d, and in both
sexes receiving 1,400 mg/kgbw/d. Gross examination of tissues revealed no abnormalities (Hayes et
al, 1986). In view of the low solubility of PER in water, the exact dose received by each group is not
clear. Because of the uncertainties in the study design, it was judged inappropriate to use this study to
derive a NOEL.
Changes suggestive of slight haemolysis were apparent in spleen and red blood cells of NMRI mice
(30 females/group) following administration of 0.05 or 0.1 mg/kgbw of PER in the drinking water
(Marth et al, 1985a,b). The results are inconsistent with other findings.
Tetrachloroethylene 89
Diet
Rats were administered PER in the diet at 25 mg/kg (14 d) and 500 mg/kg (7 d). The only effects
noted were an increase in cytochrome P450 levels and an increase in thrombin and prothrombin time
(Kaemmerer et al, 1982).
8.3.2 Dermal
No data are available.
8.3.3 Inhalation
Subchronic inhalation toxicity studies are detailed in Table 42.
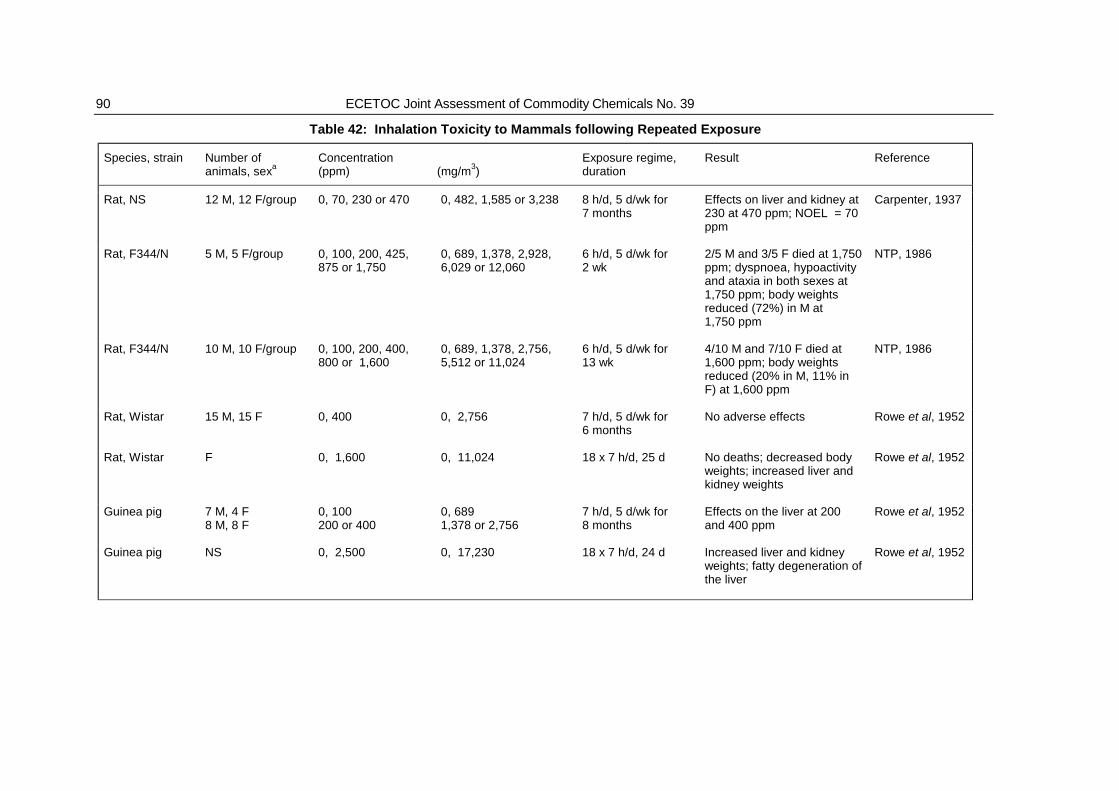
90 ECETOC Joint Assessment of Commodity Chemicals No. 39
Table 42: Inhalation Toxicity to Mammals following Repeated Exposure
Species, strain Number ofanimals, sexa
Concentration(ppm) (mg/m3)
Exposure regime,duration
Result Reference
Rat, NS 12 M, 12 F/group 0, 70, 230 or 470 0, 482, 1,585 or 3,238 8 h/d, 5 d/wk for7 months
Effects on liver and kidney at230 at 470 ppm; NOEL = 70ppm
Carpenter, 1937
Rat, F344/N 5 M, 5 F/group 0, 100, 200, 425,875 or 1,750
0, 689, 1,378, 2,928,6,029 or 12,060
6 h/d, 5 d/wk for2 wk
2/5 M and 3/5 F died at 1,750ppm; dyspnoea, hypoactivityand ataxia in both sexes at1,750 ppm; body weightsreduced (72%) in M at1,750 ppm
NTP, 1986
Rat, F344/N 10 M, 10 F/group 0, 100, 200, 400,800 or 1,600
0, 689, 1,378, 2,756,5,512 or 11,024
6 h/d, 5 d/wk for13 wk
4/10 M and 7/10 F died at1,600 ppm; body weightsreduced (20% in M, 11% inF) at 1,600 ppm
NTP, 1986
Rat, Wistar 15 M, 15 F 0, 400 0, 2,756 7 h/d, 5 d/wk for6 months
No adverse effects Rowe et al, 1952
Rat, Wistar F 0, 1,600 0, 11,024 18 x 7 h/d, 25 d No deaths; decreased bodyweights; increased liver andkidney weights
Rowe et al, 1952
Guinea pig 7 M, 4 F8 M, 8 F
0, 100200 or 400
0, 6891,378 or 2,756
7 h/d, 5 d/wk for8 months
Effects on the liver at 200and 400 ppm
Rowe et al, 1952
Guinea pig NS 0, 2,500 0, 17,230 18 x 7 h/d, 24 d Increased liver and kidneyweights; fatty degeneration ofthe liver
Rowe et al, 1952

Tetrachloroethylene 91
Table 42: Inhalation Toxicity to Mammals following Repeated Exposure (continued)
Species, strain Number ofanimals, sexa
Concentration(ppm) (mg/m3)
Exposure regime,duration
Result Reference
Mouse, B6C3F1 5 M, 5 F/group 0, 100, 200, 425,875 or 1,750
0, 689, 1,378, 2,928,6,029 or 12,060
6 h/d, 5 d/wk for2 wk
No deaths; dyspnoea,hypoactivity anaesthesia andataxia, slightly decreasedbody weights at 1,750 ppm
NTP, 1986
Mouse, B6C3F1 10 M, 10 F/group 0, 100, 200, 400,800 or 1,600
0, 689, 1,378, 2,756,5,512 or 11,024
6 h/d, 5 d/wk for13 wk
2/10 M and 4/10 F died;slightly reduced body weights(M); effects on liver andkidney at ≥ 200 ppm
NTP, 1986
Mouse, NS F 0, 200 0, 1,378 4 h/d, 5 d/wk for 1,2, 4 or 8 wk
Fatty degenerative changesin the liver
Kylin et al, 1965
Mouse, NMRI 10 M, 10 F/group 0, 9, 37, 75 or 150
150
2254509001,8003,600
0, 62, 255, 517 or 1,034
1,034
1,5503,1016,20112,40024,800
Continuous, 30 d
Continuous for 4, 8,14, 30 or 120 d
16 h/d for 30 d8 h/d for 30 d4 h/d for 30 d2 h/d for 30 d1 h/d for 30 d
Increased liver weights at allconcentrationsHistopathological changes inliver ≥ 75 ppm
Kjellstrand et al,1984
Rabbit NS 2,280 15,710 45 d Increased plasma andurinary levels ofcorticosterone and catecholamines
Mazza andBrancaccio,1971
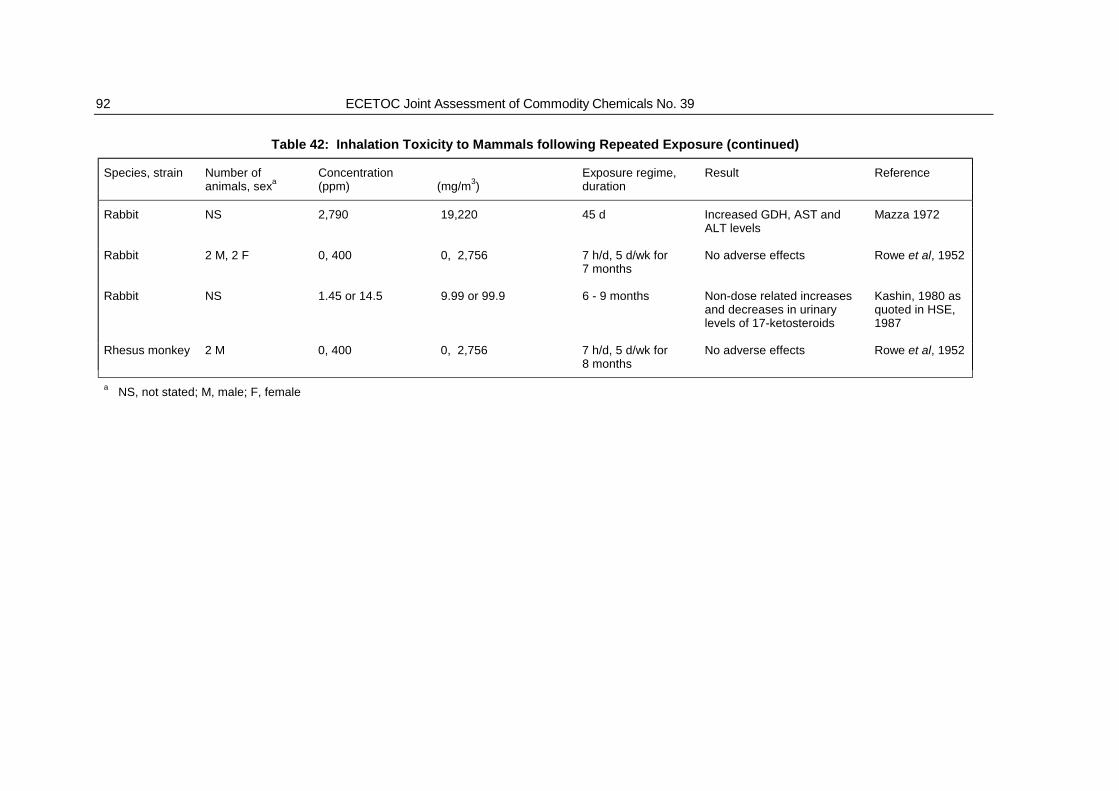
92 ECETOC Joint Assessment of Commodity Chemicals No. 39
Table 42: Inhalation Toxicity to Mammals following Repeated Exposure (continued)
Species, strain Number ofanimals, sexa
Concentration(ppm) (mg/m3)
Exposure regime,duration
Result Reference
Rabbit NS 2,790 19,220 45 d Increased GDH, AST andALT levels
Mazza 1972
Rabbit 2 M, 2 F 0, 400 0, 2,756 7 h/d, 5 d/wk for7 months
No adverse effects Rowe et al, 1952
Rabbit NS 1.45 or 14.5 9.99 or 99.9 6 - 9 months Non-dose related increasesand decreases in urinarylevels of 17-ketosteroids
Kashin, 1980 asquoted in HSE,1987
Rhesus monkey 2 M 0, 400 0, 2,756 7 h/d, 5 d/wk for8 months
No adverse effects Rowe et al, 1952
a NS, not stated; M, male; F, female
Tetrachloroethylene 93
Target organs for repeated inhalation exposure to PER are the liver, the kidney, the lungs and the
CNS (Section 8.9).
Effects on the Liver
Carpenter (1937) exposed albino rats to PER vapour concentrations of 0, 70, 230 or 470 ppm (0, 482,
1,585, 3,238 mg/m3) for 7 months. All animals survived, with growth being comparable to that of the
controls. Following exposure to 470 ppm, rats showed cloudy and congested livers, but no necrosis or
fatty degenerative changes. Reduced hepatic glycogen storage was observed in animals exposed to
230 ppm. A NOEL of 70 ppm (482 mg/m3) was reported.
Rowe et al (1952) exposed guinea pigs to 100, 200 or 400 ppm PER (689, 1,378, 2,756 mg/m3), and
Wistar rats, rabbits and rhesus monkeys to 400 ppm PER (2,756 mg/m3) for 6 - 8 months. No
adverse effects were seen at any exposure level in albino rats, rabbits and monkeys. In guinea pigs
exposed to 400 ppm, a significant growth reduction, increased liver weight, increased amounts of fat
and esterified cholesterol, and moderate centrilobular fatty degeneration of the liver with slight
cirrhosis were observed. Centrilobular fatty degeneration (without evidence of cirrhosis) and
increased hepatic levels of total lipid and esterified cholesterol were also observed following exposure
to 200 ppm. In addition, female guinea pigs exposed to 200 ppm showed a significant growth
reduction and an increased liver weight. Liver effects in animals exposed to 100 ppm were minimal
and of questionable biological significance.
No effects on kidney pathology or on serum indices of kidney function were observed in rats, guinea
pigs, rabbits and monkeys after exposure to 400 ppm PER (2,756 mg/m3) for 6 months.
Female albino mice (single strain) were exposed to 200 ppm PER (1,378 mg/m3) for 1, 2, 4 or
8 weeks. Fatty degenerative changes in the liver were observed which increased in severity with
increasing exposure (Kylin et al, 1965).
Kjellstrand et al (1984) exposed NMRI mice continuously to 0, 9, 37, 75 or 150 ppm PER (0, 62, 255,
517 or 1,034 mg/m3) for 30 days. Further groups of males and females were continuously exposed to
150 ppm PER for either 4, 8, 14, 30 or 120 days, followed by a recovery period of either 5, 30 or 120
days, or received 30 intermittent daily exposures to PER from 225 ppm (1,550 mg/m3) (16 h/d) to
3,600 ppm (24,800 mg/m3) (1 h/d). Liver weights were significantly increased in all groups of exposed
mice without a recovery period and in 6/10 groups of exposed mice with a recovery period. Kidney or
spleen weights were not affected. The increase in liver weight is considered to be an adaptive
change. Pathological changes in the liver (cell hypertrophy and cytoplasmic vacuolation)
(enlargement, vacuolisation of hepatocytes) were reported following exposure to PER at
concentrations as low as 9 ppm but were most pronounced following exposure to either 75 or 150 ppm
94 ECETOC Joint Assessment of Commodity Chemicals No. 39
PER. These effects were not seen in mice that were exposed to 150 ppm PER and allowed to recover
from the effects. Levels of plasma butyryl cholinesterase (BCE) were significantly elevated following
exposure to 37, 75 and 150 ppm PER, activity returning to normal when measured 30 d after
cessation of exposure. The significance of the increased serum BCE activity in this study is unclear.
NTP (1986) conducted inhalation toxicity studies in which B6C3F1 mice and F344/N rats were exposed
to various concentrations up to 1,750 ppm PER (12,060 mg/m3) for 2 weeks. Dyspnoea, hypoactivity
and ataxia were observed following exposure to the highest concentration in both species. In addition,
hyperactivity and anaesthesia were observed in mice exposed to the highest concentration.
Cytoplasm vacuolation of the hepatocytes was observed in male mice exposed to 875 ppm and in
male and female mice exposed to 1,750 ppm.
In another study, NTP (1986) exposed B6C3F1 mice and F344/N rats to concentrations up to
1,600 ppm of PER (11,024 mg/m3) for 13 weeks. No adverse histopathological effects were observed
in either species exposed to the lowest concentration. Liver enlargement occurred in mice exposed to
concentrations above 200 ppm. Minimal to mild leukocytic infiltration, centrilobular necrosis and bile
stasis were observed in mice following exposure to 400 - 1,600 ppm. Mild congestion of the liver was
observed in rats exposed to 200 - 800 ppm (1,378 - 5,512 mg/m3).
Effects of PER on serum levels of liver enzymes were investigated in the rat and rabbit. In the rabbit,
increases in glutamate dehydrogenase (GDH), aspartate transaminase (AST) and alanine
transaminase (ALT) were recorded following exposures of 2,790 ppm (19,220 mg/m3) for 45 days
(Mazza, 1972).
A dose-related increase in mixed function oxidase (MFO) activity was observed following 10 days of
continuous exposure of rats to 50 - 200 ppm (344.5 - 1,378 mg/m3). No change in MFO activity was
observed following 240 hours continuous exposure of Wistar rats (6 males/group) to 50, 100 or 200
ppm (Koizumi et al, 1983). Cytochrome P450 levels in the liver of male Sprague-Dawley rats were
unchanged after 4 daily 6-h exposures to 200 ppm PER (Henschler and Bonse, 1977).
Effects on the Kidney
Carpenter (1937) reported histological changes in the kidney of albino rats after exposure to 230 and
470 ppm PER (1,585 and 3,238 mg/m3) for 7 months. Changes included light granular swelling
following exposure to the lower concentration, which increased to cloudy swelling, desquamation and
increased renal secretion following exposure to the higher concentration. There was no evidence of
pathological changes in the kidneys of exposed rats. In addition, no change in urinary total nitrogen,
total sulphatase, albumin or bilirubin was observed in either of the exposed groups.
Tetrachloroethylene 95
Rowe et al (1952) reported increased kidney weights in female Wistar rats after 18 exposures over
25 days to 1,600 ppm PER (11,024 mg/m3). In the guinea pig, an increase in kidney weight and slight
to moderate cloudy swelling of the tubular epithelium was reported after 18 exposures over 24 days to
2,500 ppm (17,230 mg/m3).
No changes occurred in the kidneys of mice exposed to 200 ppm PER (1,378 mg/m3) for up to
8 weeks (Kylin et al, 1965).
Nuclear enlargement of the tubular epithelial cells was noted in B6C3F1 mice exposed (6 h/d, 5 d/wk)
to 200 ppm PER (1,378 mg/m3) for 13 weeks, but not when exposed to lower concentrations (NTP,
1986).
Effects on the Lungs
Epithelial proliferation in the bronchi, bronchioles and alveoli and increased macrophage infiltration
were observed in rats following continuous exposure to 0.6 and 2.8 ppm PER (4.1 and 19 mg/m3) for
94 days or continuous exposure to 184 to 404 ppm PER (1,268 - 2,784 mg/m3) for 7 days
(Bonashevskaya et al, 1977; Tsulaya et al, 1977). A further evaluation of the results is not possible
due to the lack of details provided, although it is possible that the exposed rats could have suffered
from a chronic pulmonary infection.
Increased 3H-thymidine incorporation into lung DNA was observed in rats following exposure (6h/d,
5 d/wk to 120 ppm (827 mg/m3) for 6 weeks (Duprat et al, 1979).
Other Effects
After subchronic exposure of rats to PER, there were no changes in red or white blood cell count in
albino rats (strain not specified) at atmospheric concentrations up to 7,000 ppm (48,230 mg/m3)
(8 h/d) for up to 50 days or in male Wistar rats after 10 days of continuous exposure up to 200 ppm
PER (1,378 mg/m3) (Carpenter, 1937; Koizumi et al, 1983).
Slight, non-statistically significant increases in plasma and urinary levels of corticosterone and
catechol amines were observed in rabbits exposed to 2,280 ppm PER (15,710 mg/m3) for 45 days
(Mazza and Brancaccio, 1971). Minor, non-dose related increases and decreases in urinary levels of
17-ketosteriods were observed in rabbits exposed to 1.45 or 14.5 ppm PER (9.99 - 99.9 mg/m3) for
6 - 9 months (Kashin, 1980 as quoted in HSE, 1987). The significance of these findings for human
health hazard assessment is unclear.

96 ECETOC Joint Assessment of Commodity Chemicals No. 39
8.3.4 Intraperitoneal
Hepatic effects of intraperitoneal (i.p.) doses of PER included increased liver weight and histological
changes (slight fatty accumulation, reduced glycogen levels) in Wistar rats after 3 i.p. injections (every
other day) of 2,250 mg/kgbw. There were no changes in hepatic total lipids, cholesterol, phospholipid
or triglyceride levels. Small increases were noted in serum AST. A reduction in alkaline phosphatase
levels, which was probably related to the reported peritonitis, was seen in both sexes. There were no
changes in serum alanine transaminase or cholinesterase activity and no effects on blood levels of
total lipid, phospholipid, total cholesterol, free fatty acid, glycogen, and glucose or serum
albumin/globulin ratio. No hepatic effects were observed after 37 i.p. injections at 750 mg/kgbw (Ikeda
et al, 1969).
8.3.5 Summary
The NOEL and LOEL values for the subchronic toxicity studies are given in Table 43.
Inhalation
Target organs for toxicity after repeated inhalation exposure to PER are the liver, the kidney, the lungs
and the CNS (Section 8.9).
Effects of PER on the liver were more pronounced in the mouse than in the rat, the guinea pig or the
rabbit. These included increased liver weight, increased levels of lipids and cytochrome P450 and
changes in serum levels of GDH, AST, ALT and BCE. In most studies, liver enlargement was not
accompanied by histopathological changes.
The NOEL for liver effects on the basis of histological criteria in 6 - 8 month studies was 400 ppm
(2,756 mg/m3) in the rabbit and rhesus monkey using similar criteria. In the guinea pig and the rat with
various exposure regimes, the LOEL was 200 ppm (1,378 mg/m3), and the NOEL was 100 ppm
(689 mg/m3).
In a 90-d study in the mouse performed to current day standards, the LOEL for liver and kidney effects
was 200 ppm (1,378 mg/m3) and the NOEL was 100 ppm (689 mg/m3). In a second study in the
mouse exposed continuously for 30 days, minor histopathological changes in the liver were observed
at concentrations ≥ 75 ppm (517 mg/m3). These changes were likely to be a consequence of the high
rate of metabolism of PER to TCA in the mouse (ECETOC, 1990).
Increased kidney weight and histological changes in the kidney were reported following repeated
exposure to high concentrations PER in the rat (1,600 ppm; 11,024 mg/m3) and in the guinea pig
(2,500 ppm; 17,230 mg/m3). There were no adverse effects in the kidneys of guinea pigs, rabbits or
Tetrachloroethylene 97
rhesus monkeys following exposure to concentrations up to 400 ppm (2,756 mg/m3), and no adverse
effects in the kidneys of mice following exposure to concentrations up to 200 ppm (1,378 mg/m3). The
LOEL for kidney effects in rats was 230 ppm (1,585 mg/m3).
Taking into account all of the information, a clear NOEL following repeated inhalation of 100 ppm PER
(intermittent exposures) has been demonstrated in a wide range of species, on the basis of
histological criteria for all critical organs in studies of up to 8 months duration. Changes in liver weight
have been observed in mice following continuous exposure to lower concentrations (≥ 75 ppm) of
PER. This effect is likely to be specific to the mouse. Furthermore, such adaptive responses in the
mouse liver are well described and are not considered to be of significance to human health hazard
assessment.
Oral
Liver effects (increased triglyceride levels, increased weight) were apparent in mice orally receiving
100 mg/kgbw/d. The NOEL in mice was 20 mg/kgbw/d. In rats to which PER (500 mg/kgbw/d for 12
d) was administered orally, no effects were observed on the liver in terms of histological changes,
weight and DNA synthesis. In a further study, rats receiving 405 mg/kgbw/d PER for 4 weeks showed
increases in liver weight and enzyme activity, but there were no histopathological changes.
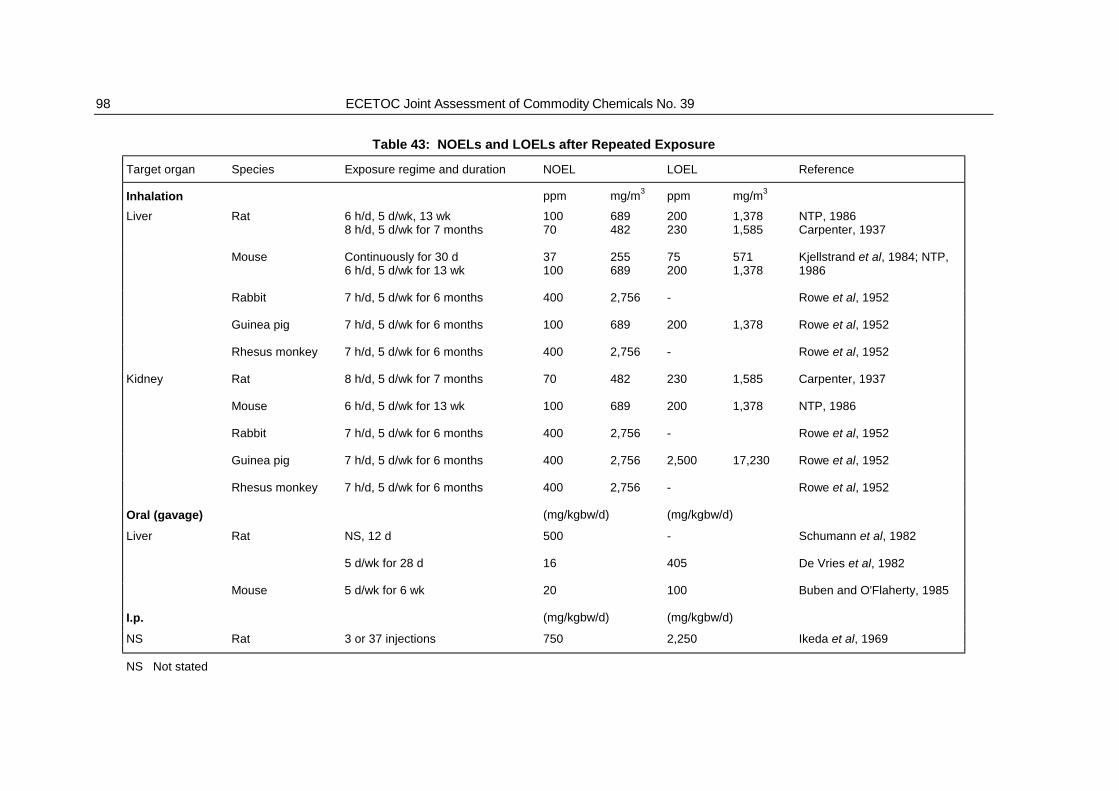
98 ECETOC Joint Assessment of Commodity Chemicals No. 39
Table 43: NOELs and LOELs after Repeated Exposure
Target organ Species Exposure regime and duration NOEL LOEL Reference
Inhalation ppm mg/m3 ppm mg/m3
Liver Rat 6 h/d, 5 d/wk, 13 wk8 h/d, 5 d/wk for 7 months
10070
689482
200230
1,3781,585
NTP, 1986Carpenter, 1937
Mouse Continuously for 30 d6 h/d, 5 d/wk for 13 wk
37100
255689
75200
5711,378
Kjellstrand et al, 1984; NTP,1986
Rabbit 7 h/d, 5 d/wk for 6 months 400 2,756 - Rowe et al, 1952
Guinea pig 7 h/d, 5 d/wk for 6 months 100 689 200 1,378 Rowe et al, 1952
Rhesus monkey 7 h/d, 5 d/wk for 6 months 400 2,756 - Rowe et al, 1952
Kidney Rat 8 h/d, 5 d/wk for 7 months 70 482 230 1,585 Carpenter, 1937
Mouse 6 h/d, 5 d/wk for 13 wk 100 689 200 1,378 NTP, 1986
Rabbit 7 h/d, 5 d/wk for 6 months 400 2,756 - Rowe et al, 1952
Guinea pig 7 h/d, 5 d/wk for 6 months 400 2,756 2,500 17,230 Rowe et al, 1952
Rhesus monkey 7 h/d, 5 d/wk for 6 months 400 2,756 - Rowe et al, 1952
Oral (gavage) (mg/kgbw/d) (mg/kgbw/d)
Liver Rat NS, 12 d
5 d/wk for 28 d
-
405
Schumann et al, 1982
De Vries et al, 1982
Mouse 5 d/wk for 6 wk
500
16
20 100 Buben and O'Flaherty, 1985
I.p. (mg/kgbw/d) (mg/kgbw/d)
NS Rat 3 or 37 injections 750 2,250 Ikeda et al, 1969
NS Not stated
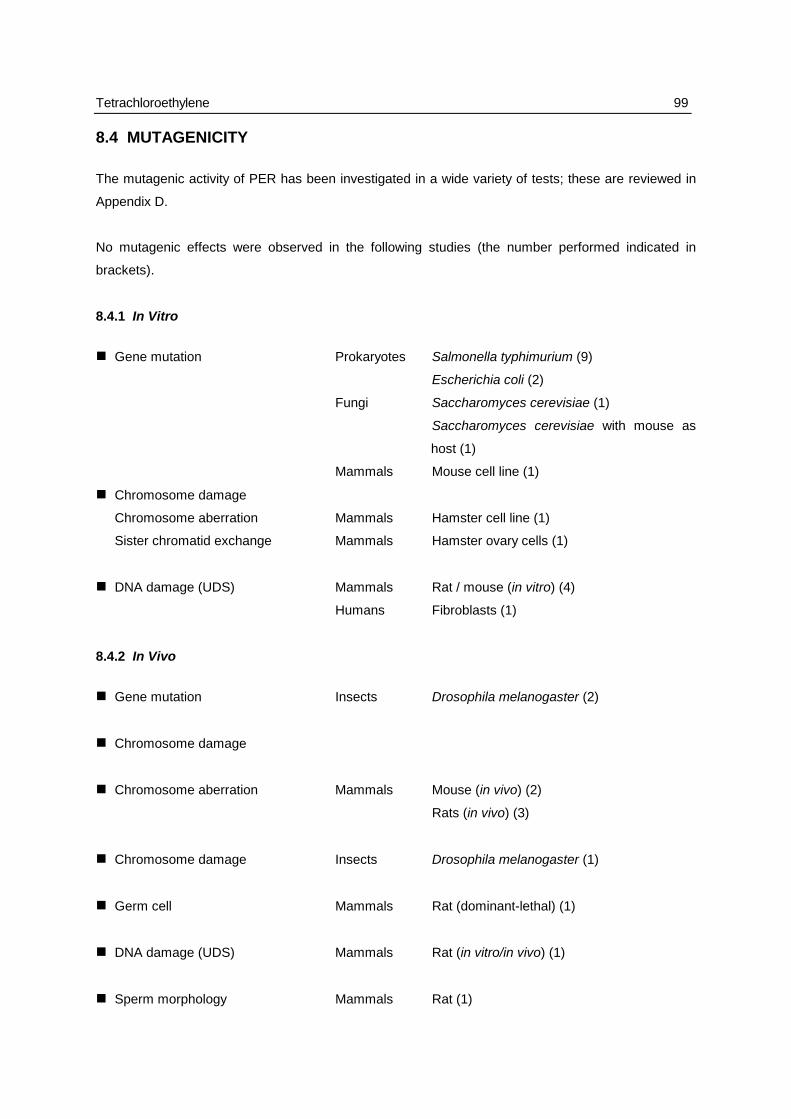
Tetrachloroethylene 99
8.4 MUTAGENICITY
The mutagenic activity of PER has been investigated in a wide variety of tests; these are reviewed in
Appendix D.
No mutagenic effects were observed in the following studies (the number performed indicated in
brackets).
8.4.1 In Vitro
! Gene mutation Prokaryotes Salmonella typhimurium (9)
Escherichia coli (2)
Fungi Saccharomyces cerevisiae (1)
Saccharomyces cerevisiae with mouse as
host (1)
Mammals Mouse cell line (1)
! Chromosome damage
Chromosome aberration Mammals Hamster cell line (1)
Sister chromatid exchange Mammals Hamster ovary cells (1)
! DNA damage (UDS) Mammals Rat / mouse (in vitro) (4)
Humans Fibroblasts (1)
8.4.2 In Vivo
! Gene mutation Insects Drosophila melanogaster (2)
! Chromosome damage
! Chromosome aberration Mammals Mouse (in vivo) (2)
Rats (in vivo) (3)
! Chromosome damage Insects Drosophila melanogaster (1)
! Germ cell Mammals Rat (dominant-lethal) (1)
! DNA damage (UDS) Mammals Rat (in vitro/in vivo) (1)
! Sperm morphology Mammals Rat (1)
100 ECETOC Joint Assessment of Commodity Chemicals No. 39
Weakly positive or equivocal results were obtained from a number of tests on technical and
commercial grade material or in non-validated test systems. The presence of mutagenic stabilisers in
the samples of PER tested is the most likely explanation for the weakly positive findings and therefore
confounds the interpretation of these results. The significance of some of the studies could not be
judged because of inadequate reporting, the lack of appropriate controls or the unconventional test-
system used. Positive results were obtained only at concentrations of PER that were toxic to the
organisms or cells and no dose dependence was established.
PER exposure did not produce significant DNA damage or binding. The conflicting results in different
cell transformation systems and the different response between mouse and rat in a sperm morphology
test are more likely to be due to the inherent properties of the test system than to an expression of the
genotoxicity of PER. Negative results were obtained when pure PER was tested in a range of more
reliable and better validated studies.
It is concluded from an overall assessment of the available data from a range of in vivo and in vitro
assays, taking into account the quality of conduct and reporting of the studies, that PER is non-
mutagenic.
8.5 CHRONIC TOXICITY
8.5.1 Oral
Groups of 50 male and 50 female B6C3F1 mice received PER (administered 5 d/wk as a solution in
corn oil) at TWA doses of 536 and 1,072 mg/kgbw/d (males) and 386 and 772 mg/kgbw/d (females)
for 78 weeks, followed by an observation period without treatment of 12 weeks. Groups of 20
untreated and 20 corn oil treated mice of each sex served as controls. The mortality rate in treated
mice was high early in the study and toxic nephropathy was observed in nearly all treated mice but not
in the controls (NCI, 1977).
Groups of 50 male and 50 female Osborne-Mendel rats received PER (administered as a solution in
corn oil) at TWA doses of approximately 475 and 950 mg/kgbw/d for 78 weeks followed by an
observation period without treatment of 32 weeks. Groups of 20 untreated and 20 corn oil treated rats
of each sex served as controls. Toxic nephropathy occurred in more than 85% of the treated male
and in 50 - 82% of the treated female rats. Survival rate was low in the treated rats (NCI, 1977).
Groups of 40 male and 40 female Sprague-Dawley rats received (1x/d, 4-5 d/wk) by gavage 500 mg
PER/kgbw (15% v/v in olive oil) for 104 weeks. The rats were observed for their lifetime. A group of
50 male and 50 female rats served as controls and were administered similar volumes of olive oil.
Renal damage (cytomegaly and/or karyomegaly in renal tubular cells) was observed in 32.5% of the
treated male rats, but not in the female rats (Maltoni and Cotti, 1986).
Tetrachloroethylene 101
8.5.2 Inhalation
Groups of 50 male and 50 female B6C3F1 mice were exposed (8 h/d, 5 d/wk) to PER by inhalation at
either 100 or 200 ppm (689 or 1,378 mg/m3) for 2 years. Further groups of 50 male and 50 female
B6C3F1 mice served as controls. Both groups of exposed male mice showed a small, but significant,
increase in mortality compared to control groups as did the female mice exposed to 200 ppm PER. All
groups of exposed mice showed evidence of toxic effects in both the kidney (tubular cell karyomegaly,
casts and nephrosis) and the liver (necrosis). Lung congestion was also observed in the exposed
male mice. No NOEL could be determined in the study (NTP, 1985).
Groups of 50 male and 50 female F344/N rats were exposed (8 h/d, 5 d/wk) to PER by inhalation at
either 200 or 400 ppm (1,378 or 2,756 mg/m3) for 2 years. Further groups of 50 male and 50 female
F344/N rats served as controls. A small, but significant, increase in mortality was observed in male
rats exposed to 400 ppm PER when compared with controls. All groups of exposed rats showed
evidence of toxic effects in the kidney (tubular cell hyperplasia and nuclear enlargement). Vascular
thromboses were observed in the nasal cavity of both male and female rats exposed to PER along
with squamous metaplasia in the male. Other effects reported included hyperplasia of the adrenal
medulla in exposed males, hyperplasia of the adrenal cortex in exposed females and forestomach
ulceration in males exposed to 400 ppm PER. No NOEL could be determined from the study (NTP,
1985).
Groups of 96 male and 96 female Sprague-Dawley rats were exposed (6 h/d, 5 d/wk) to PER at either
300 or 600 ppm (2,067 or 4,134 mg/m3) for 12 months, following which they were observed for a
further 18 months. No significant effects were reported following an analysis of blood and urine
parameters and a full pathological examination. A slight increase in mortality was observed in male
rats exposed to 600 ppm PER when compared to controls. Mortality was slightly greater in high-dose
males than in the controls. This was thought to be due to an earlier onset of spontaneous chronic
renal disease (Rampy et al, 1978). This study suggested that the NOEL for PER in Sprague-Dawley
rats is at least 600 ppm for 12 months exposure.
8.5.3 Evaluation
The principal target organ in both rats and mice following chronic exposure to PER by inhalation and
by gavage is the kidney. Effects have been observed following exposure for 2 years at concentrations
equal to or greater than 100 ppm (689 mg/m3) (mouse) or 200 ppm (1,378 mg/m3) (rat). Following
administration by gavage, effects on the kidney were observed at doses of approximately
400 mg/kgbw/d and above when administered for at least 78 weeks. No NOEL has been determined
for kidney toxicity following life-time exposure to PER either by gavage or by inhalation in the rat or the
mouse.
102 ECETOC Joint Assessment of Commodity Chemicals No. 39
Other target organs following inhalation of PER include the liver and lung in the mouse and the nasal
epithelium, the adrenal gland and the forestomach in the rat.
8.6 CARCINOGENICITY
The chronic toxicity of PER in laboratory animals, in particular its carcinogenic activity, and the
implications for human health have been extensively evaluated over the past decade (IPCS, 1984;
RIVM, 1984; US-EPA, 1985; Gezondheidsraad, 1985; IARC, 1987; HSE, 1987; Werkgroep
Deskundigen, 1987; DFG, 1988; ECETOC, 1990). Other draft regulatory documents exist.
8.6.1 Oral
The carcinogenicity of PER administered by gavage has been examined in two experiments in rats
and one in mice.
Groups of 50 male and 50 female B6C3F1 mice received during 5 d/wk TWA doses of 536 and
1,072 mg PER/kgbw/d (males) and 386 and 772 mg/kgbw/d (females) for 78 weeks, followed by an
observation period without treatment of 12 weeks. PER was administered as a solution in corn oil.
Groups of 20 untreated and 20 corn oil treated mice of each sex served as controls. The incidence of
hepatocellular carcinoma was approximately 10% in both sexes in untreated and in vehicles control
mice and 40% and 65% in low-dose and 40% and 56% in high-dose female and male mice
respectively. The mortality rate was high early in the study and toxic nephropathy was observed in
nearly all treated mice but not in the controls (NCI, 1977).
Osborne-Mendel rats (50 males and 50 females/group) received (5 d/wk) TWA doses of
approximately 475 and 950 mg PER/kgbw/d for 78 weeks followed by an observation period of
32 weeks. PER was administered as a solution in corn oil. Groups of 20 untreated and 20 corn oil
treated rats of each sex served as controls. Toxic nephropathy occurred in more than 85% of the
treated male and in 50-80% of the treated female rats. It was not observed in control rats. PER did
not increase the incidence of tumours in rats, although a low survival rate prevented the investigators
from drawing definitive conclusions (NCI, 1977).
Sprague-Dawley rats (2 groups of 50 males and 50 females) received (1 x/d, 4-5 d/wk) by gavage
500 mg PER/kgbw (15% v/v in olive oil) for 104 weeks. The rats were observed for their lifetime.
Control groups of 50 male and 50 female rats were administered similar volumes of olive oil. Renal
damage (cytomegaly and/or karyomegaly in renal tubular cells) was observed in 32.5% of the treated
male rats, but not in the female rats. The incidence of benign and malignant tumours in the treated
groups was not increased when compared with the controls (Maltoni and Cotti, 1986).
Tetrachloroethylene 103
8.6.2 Dermal
Two groups of 30 male and 30 female Ha:ICR Swiss mice received (3 x/wk) either 18 or 54 mg of
PER in 0.2 ml acetone on the shaven dorsal skin for the duration of the experiment (imprecisely
specified by authors, but at least 440 days). A third group received a single application of 163 mg of
PER followed after 2 weeks by 5 mg of phorbol myristate acetate (PMA) in 0.2 ml acetone, (3 x/wk) for
at least 428 days. There were 3 control groups: PMA alone, acetone alone, and no treatment. PER
did not initiate nor induce dermal tumours or tumours at other sites (Van Duuren et al, 1979).
8.6.3 Inhalation
Two groups of 96 male and 96 female Sprague-Dawley rats were exposed (6 h/d, 5 d/wk) to 300 or
600 ppm PER (2,067, 4,134 mg/m3) for 12 months. A control group consisted of 192 male and
192 female rats. The surviving rats were killed 31 months after the start of the study. Clinical signs of
toxicity were not observed and mean body weights were similar in all groups. Mortality was slightly
greater in high-dose males than in the controls. This was thought to be due to earlier onset of
spontaneous chronic renal disease. PER did not increase the incidence of tumours in the rat under
these exposure conditions (Rampy et al, 1978).
Groups of 50 male and 50 female F344/N rats or B6C3F1 mice were exposed (6 h/d, 5 d/wk) to PER
by inhalation for 103 weeks at atmospheric concentrations of 200 or 400 ppm (1,378 or 2,756 mg/m3)
(rats) or 100 or 200 ppm (689 or 1,378 mg/m3) (mice) respectively. Groups of 50 male and 50 female
rats or mice served as controls. A statistically significant increase in the incidence of heptacellular
carcinoma was observed in treated mice for both sexes accompanied by non-significant increases in
the incidence of renal tubular cell adenoma and adenocarcinoma (a tumour rarely found in control
animals) in male rats. The authors reported a statistically significant increase in mononuclear cell
leukaemia for both male and female F344/N rats. The statistical analysis was based on an evaluation
of the stages of development of the leukaemia; a method that has not been fully evaluated. The
incidence of mononuclear cell leukaemia in the concurrent F344/N control rats, in both males and
females, was higher than the historical incidences reported by the NTP. In view of the high and
spontaneous incidence of this tumour in the F344/N rat, it is concluded that the increased tumour
incidence in the treated groups was not associated with exposure to PER. This conclusion has been
reached by other competent reviewers of the study (HSE, 1987; NTP, 1986 see comments of the Peer
Review Committee).
8.6.4 Intraperitoneal Studies
Groups of 20 male A/St mice (6-8 wk of age) received (3 x/wk) i.p. injections of PER in tricaprylin. The
groups received 14 injections of 80 mg/kgbw or 24 injections of 200 mg/kgbw or 48 injections of
400 mg/kgbw (concentration and volume not given). The 50 control mice were injected with tricaprylin
104 ECETOC Joint Assessment of Commodity Chemicals No. 39
only. A positive control group received 1 single i.p. injection of urethane (1,000 mg/kgbw). The mice
were killed 24 weeks after the first injection. Special attention was given to the occurrence of lung
adenomas. The number of lung tumours was not increased in the groups injected with PER, whereas
an increased incidence was seen in the positive control group (Theiss et al, 1977).
8.6.5 Tumour Promotion
A rat liver foci bioassay was performed using N,N-diethyl-nitrosamine (DENA) as an initiator and PER
as a promoter (protocol described by Pereira et al, 1982). DENA was injected i.p. into male Sprague-
Dawley rats 24 hours after a partial hepatectomy. PER (1,100 mg/kgbw/d) administered (1 x/d,
5 d/wk) by gavage for 7 weeks, did not increase the number of foci/cm2 nor the total foci area/cm2 at
3 d (Lundberg et al, 1987) or 10 d (Lundberg et al, 1987; Holmberg et al, 1986) following the last dose
of test compound. The studies thus provided no evidence for tumour promotion in the liver.
A liver foci bioassay was conducted in Osborne-Mendel rats using DENA as initiator. Glutamyl-
transpeptidase (GGT) was used as an index of pre-neoplastic change. The incidence of GGT foci
was significantly increased by PER and the extent of the increase was similar whether or not DENA
was used (Milman et al, 1988). The significance of the liver foci bioassay and its predictive value for
humans are uncertain.
In a pulmonary tumour promotion assay in strain A mice, PER was without promoting activity (Theiss
et al, 1977).
Metabolite: Trichloroacetic Acid
In a study in mice in which the tumour promoting ability of PER was compared with that of its
metabolite, a group of 22 male B6C3F1 mice received TCA in their drinking water at a concentration of
5 g/l for 61 weeks. Seven out of the 22 treated animals developed hepatocellular carcinomas, and
8 developed hepatocellular adenomas. In a control group of 22 male mice receiving 2 g/l NaCl in their
drinking water, 2 developed hepatocellular adenomas although no hepatocellular carcinomas were
observed. This study provides some evidence for the hepatocarcinogenic effect of TCA, a metabolite
of PER, in the mouse (Herren-Freund et al, 1987).
Tetrachloroethylene 105
8.6.6 Evaluation
In summary, PER has been shown to be carcinogenic in male and female B6C3F1 mice, causing
hepatocellular carcinomas following oral and inhalation exposure. It is concluded that this response is
due to metabolism of PER to TCA, which has been shown to cause hepatocellular carcinomas in male
B6C3F1 mice when administered in their drinking water. PER also caused an increase in the
incidence of renal tubular cell tumours in male F344/N rats in one study. Increased incidences of
mononuclear cell leukaemia were observed in treated male and female F344/N rats but not in
Osborne-Mendel or Sprague-Dawley rats. Mononuclear cell leukaemia is known to have a high and
variable incidence in F344/N rats, this being a strain specific effect.
There is no convincing evidence from a number of assay systems to suggest that PER acts as a
tumour promoter.
8.7 MECHANISMS OF TUMOUR FORMATION
A considerable body of work has been conducted to examine the mechanisms by which PER causes
liver tumours in the mouse and kidney tumours in the rat. These studies have been extensively
reviewed in ECETOC (1990).
There is good evidence that mouse liver tumours are due to metabolism of PER to TCA which, itself,
has been shown to be a rodent hepatocarcinogen. The mechanism of action of TCA as a liver
carcinogen has been shown to involve peroxisome proliferation, a non-genotoxic mechanism of action
common to a number of rodent liver carcinogens. Species differences in the metabolism of PER to
TCA also explains why PER does not cause liver tumours in the rat.
Although PER causes the development of liver tumours in mice, the mechanism involved is unlikely to
occur in humans because:
! the formation of TCA in humans is limited by the saturation of the oxidative pathway at atmospheric
concentrations of PER above 100 ppm (689 mg/m3); doses above this level are required to
produce neoplasia in mice;
! TCA does not induce peroxisome proliferation in human hepatocytes in vitro, confirming a general
observation that humans are not susceptible to the hepatotoxic and hepatocarcinogenic effects of
peroxisome proliferators such as TCA.
The kidney tumours observed in male rats may arise from one or more of three potential mechanisms.
They may be a consequence of the sex specific protein droplet nephropathy developed in male rats
exposed to PER. In addition, (i) sustained chronic toxicity to the kidney and/or (ii) hepatic GSH-
106 ECETOC Joint Assessment of Commodity Chemicals No. 39
conjugation and subsequent activation of cysteine conjugate by renal β-lyase, may have further
contributed to the development of the renal tumours.
These mechanisms are probably specific to the rat or, at the very most, only operative following
exposure to very high concentrations of PER for prolonged periods of time. Although mercapturic acid
derivatives have been formed, at different rates, in the urine of both rats and humans, GSH-
conjugation has not been detected in human liver samples. Protein droplet nephropathy is a species
and sex specific event exclusively observed in the male rat. Sustained chronic toxicity will only occur
following exposure to high concentrations of PER over a prolonged period of time.
Thus, interspecies comparisons of the mechanisms of toxicity and carcinogenicity indicate that the
liver tumours in mice and kidney tumours in rats are unlikely to occur in humans. It may be concluded,
therefore, that it is inappropriate to use these tumour incidences as the basis for risk assessment in
humans. Some support for this view is obtained from the negative results obtained from a number of
epidemiological studies.
8.8 REPRODUCTIVE TOXICITY, EMBRYOTOXICITY AND TERATOGENICITY
8.8.1 Reproductive Toxicity
Details of reproductive toxicity studies are explained in Table 44.
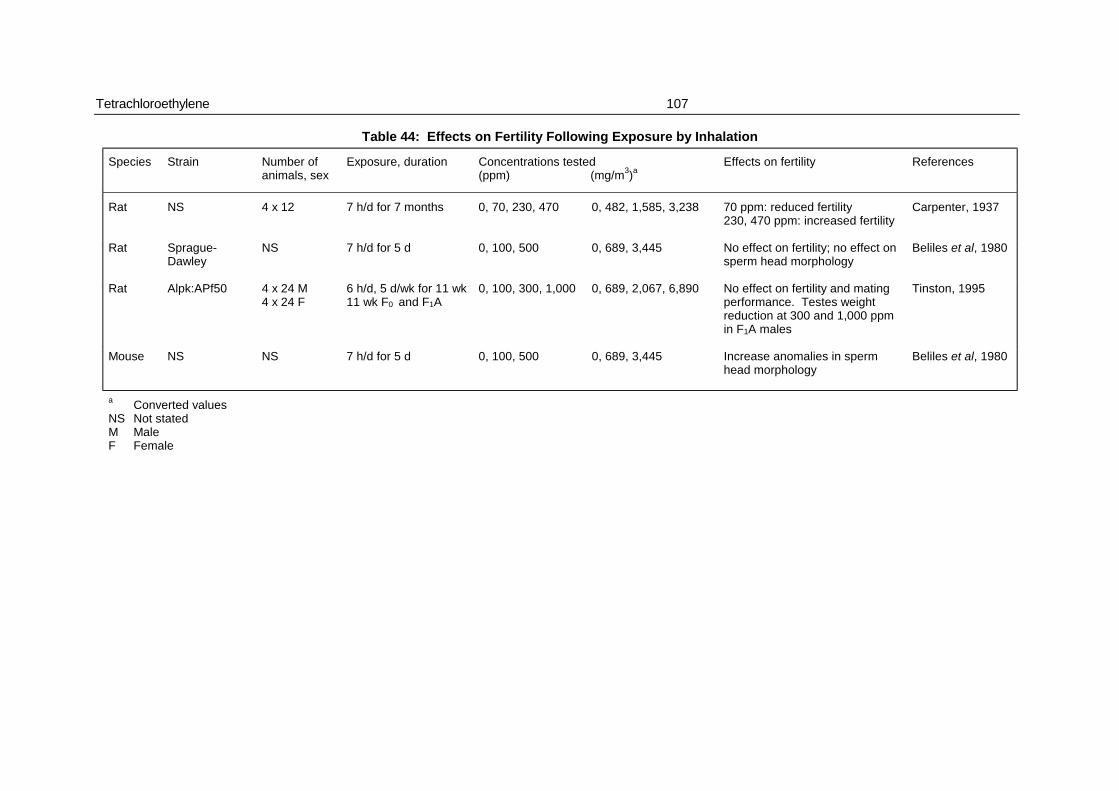
Tetrachloroethylene 107
Table 44: Effects on Fertility Following Exposure by Inhalation
Species Strain Number ofanimals, sex
Exposure, duration Concentrations tested(ppm) (mg/m3)a
Effects on fertility References
Rat NS 4 x 12 7 h/d for 7 months 0, 70, 230, 470 0, 482, 1,585, 3,238 70 ppm: reduced fertility230, 470 ppm: increased fertility
Carpenter, 1937
Rat Sprague-Dawley
NS 7 h/d for 5 d 0, 100, 500 0, 689, 3,445 No effect on fertility; no effect onsperm head morphology
Beliles et al, 1980
Rat Alpk:APf50 4 x 24 M4 x 24 F
6 h/d, 5 d/wk for 11 wk11 wk F0 and F1A
0, 100, 300, 1,000 0, 689, 2,067, 6,890 No effect on fertility and matingperformance. Testes weightreduction at 300 and 1,000 ppmin F1A males
Tinston, 1995
Mouse NS NS 7 h/d for 5 d 0, 100, 500 0, 689, 3,445 Increase anomalies in spermhead morphology
Beliles et al, 1980
a Converted valuesNS Not statedM MaleF Female
108 ECETOC Joint Assessment of Commodity Chemicals No. 39
No adverse effects on reproduction in albino rats were reported following exposure to PER at
concentrations up to 470 ppm (3,238 mg/m3) for 7 months. The design of the study was severely
limited when compared to current standards and no statistical information was presented (Carpenter,
1937).
Beliles et al (1980) exposed rats and mice to 0 (controls), 100 or 500 ppm of technical grade (91.4%
purity) PER (0, 689, 3,445 mg/m3) for 5 consecutive days. An increased proportion of sperm with
aberrant morphology was found in mice, but not in rats, exposed to 500 ppm during week 4 after
exposure (19.7% versus 6% in controls). In a dominant lethal assay performed on the rats used in the
study, no adverse effect was observed, including any effect on male fertility.
A multi-generation inhalation study has been conducted in the rat (Tinston, 1995). Groups of 24 male
and 24 female (F0 parents) weanling Alpk:APfSD rats were exposed by inhalation to 0 (control), 100,
300 or 1,000 ppm PER (0, 689, 2,067, 6,890 mg/m3) for 11 weeks prior to being housed for mating
for up to 21 days. Following mating, the males were exposed daily until termination and the females
were exposed daily until day 20 of gestation. One litter (F1A) was produced in the first generation
when the dams, together with their litters, were exposed daily from day 6 to day 29 post partum. The
second generation (F1) parents were selected from the F1A litters on day 29 post partum and were
exposed to PER for at least 11 further weeks prior to mating. Two litters (F2A and F2B) were produced
in the second generation.
There were no effects on fertility or reproductive performance of male or female rats in any of the
exposed groups from either generation. Exposure to 1,000 ppm PER resulted in reduction of parental
bodyweight gain during both the pre-pairing and lactation periods in both generations and during
pregnancy in the second generation. A similar but less marked effect on parental bodyweight was
seen in males and females exposed to 300 ppm PER. Histopathological changes were confined to
kidneys of both sexes in both generations exposed to 1,000 ppm PER, but no significant changes
were seen at 300 or 100 ppm. Exposure to either 300 or 1,000 ppm PER was also associated with
poor growth of the F1A and F2A animals (confirmed in the F2B offspring). Furthermore, the proportion
of pups born alive and pup survival rate were reduced at 1,000 ppm. No treatment-related
histopathological changes were seen in the testes of males of any generation although, in the F1
parental generation, a statistically significant, dose-related weight reduction of the testes was observed
in males exposed to 300 and 1,000 ppm PER. There was no effect on the weight of the testes of the
males of the F0 parental generation nor in the F1 and F2 males.
An F2C generation was obtained after mating the PER-exposed F1 male rats to stock (non exposed)
female. No effects were seen in these pups.
Tetrachloroethylene 109
The NOEL in this study was higher than 1,000 ppm (6,890 mg/m3) for mating performance and fertility
and was 100 ppm (689 mg/m3) for other reproductive and for the non-reproductive parameters.
8.8.2 Developmental Toxicity
A number of teratology studies have been conducted in the rat, mouse, rabbit and chicken; details are
given in Tables 45 and 46.
Schwetz et al (1975a,b) exposed groups of pregnant rats and mice to 0 or 300 ppm PER (0,
2,067 mg/m3). Foetuses were examined on day 21 (rat) or 18 (mouse) of gestation. No teratogenic
effects were observed in either species although some signs of maternal toxicity occurred, i.e.
increased liver weight in mice and slight decrease in bodyweight in rats. In mice, increased incidences
of subcutaneous oedema, delayed ossification of skull bones and sternebrae, but no major
malformations, were observed. There was a decrease in foetal bodyweight in rats and mice and a
slight increase in the incidence of foetal resorption in rats.
Beliles et al (1980) exposed groups of pregnant rats and rabbits to 0 or 500 ppm PER (0,
3,445 mg/m3). One half were exposed 3 weeks prior to mating. All rats were exposed during
gestation on days 0 - 18 or 6 - 18. All rabbits were exposed during gestation on days 0 - 21 or 7 - 21.
No evidence of maternal toxicity was observed and no teratogenic effects were reported in rats or
rabbits although foetal skeletal ossification anomalies were described in rats. In rats exposed to 500
ppm PER, a slight increase in the incidence of resorptions was observed when compared to the
control group. However, although the difference was statistically significant, it has probably no
biological significance because an unusually low incidence of resorptions occurred in the control
group.
Hardin et al (1981) exposed pregnant rats and pregnant rabbits to 0 or 500 ppm PER (0, 3,445 mg/m3)
during the first 19 (rat) or 24 (rabbit) days of gestation. No effects were reported in the foetuses nor in
the dams of either species. Due to many similarities, it would appear that the study reported by Hardin
et al is part of the study reported by Beliles et al above.
In a behavioural teratology study (Table 44), Nelson et al (1979) exposed rats to 0, 100 or 900 ppm
PER (0, 689, 6,201 mg/m3) on days 7 - 13 or 14 - 20 of gestation. A number of behavioural tests were
performed on one male and one female pup of each litter for each test on days 4 - 56 postnataly. In
addition, histological examination of the pups' brains was performed and dopamine and acetylcholine
levels in the brain were measured on days 0 and 21 of age. Frank maternal toxicity was observed
following exposure to 900 ppm PER. Inconsistent results were obtained in the behavioural tests and
decreases in the levels of both dopamine and acetylcholine were noted in the pups born from dams

110 ECETOC Joint Assessment of Commodity Chemicals No. 39
exposed to 900 ppm PER. However, in those exposed to 100 ppm PER, no effects were observed in
the dams or the pups.
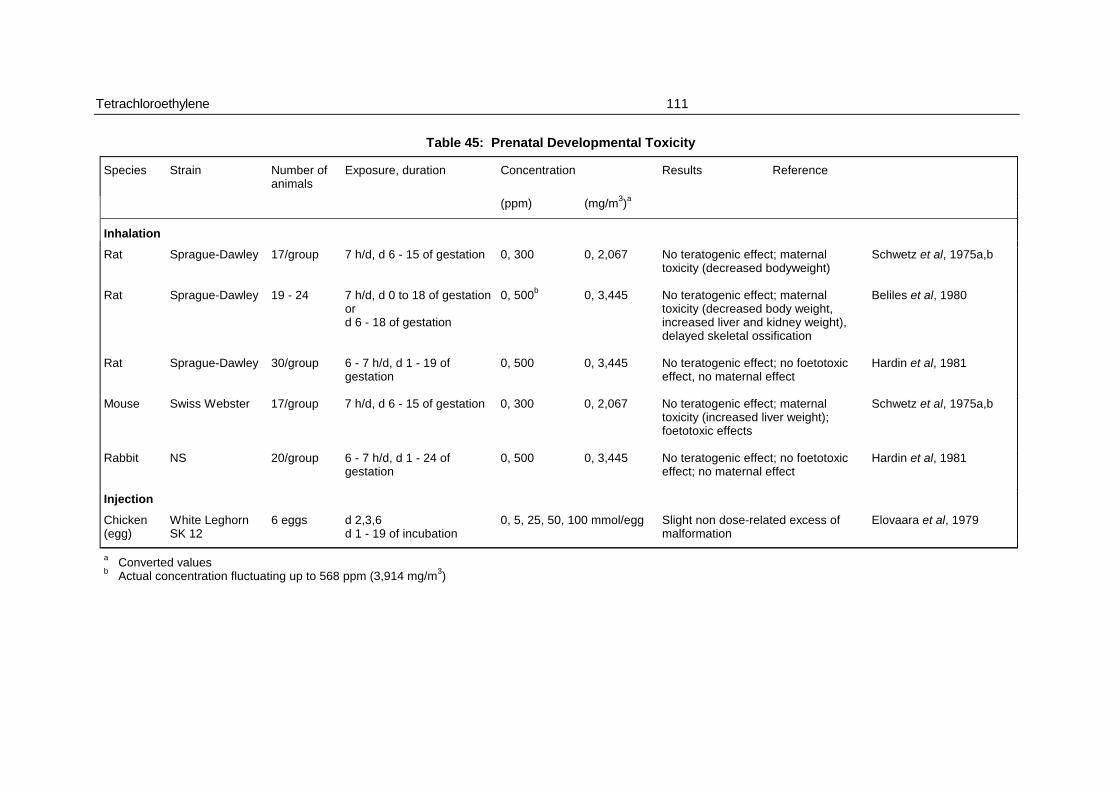
Tetrachloroethylene 111
Table 45: Prenatal Developmental Toxicity
Species Strain Number ofanimals
Exposure, duration Concentration Results Reference
(ppm) (mg/m3)a
Inhalation
Rat Sprague-Dawley 17/group 7 h/d, d 6 - 15 of gestation 0, 300 0, 2,067 No teratogenic effect; maternaltoxicity (decreased bodyweight)
Schwetz et al, 1975a,b
Rat Sprague-Dawley 19 - 24 7 h/d, d 0 to 18 of gestationord 6 - 18 of gestation
0, 500b 0, 3,445 No teratogenic effect; maternaltoxicity (decreased body weight,increased liver and kidney weight),delayed skeletal ossification
Beliles et al, 1980
Rat Sprague-Dawley 30/group 6 - 7 h/d, d 1 - 19 ofgestation
0, 500 0, 3,445 No teratogenic effect; no foetotoxiceffect, no maternal effect
Hardin et al, 1981
Mouse Swiss Webster 17/group 7 h/d, d 6 - 15 of gestation 0, 300 0, 2,067 No teratogenic effect; maternaltoxicity (increased liver weight);foetotoxic effects
Schwetz et al, 1975a,b
Rabbit NS 20/group 6 - 7 h/d, d 1 - 24 ofgestation
0, 500 0, 3,445 No teratogenic effect; no foetotoxiceffect; no maternal effect
Hardin et al, 1981
Injection
Chicken(egg)
White LeghornSK 12
6 eggs d 2,3,6d 1 - 19 of incubation
0, 5, 25, 50, 100 mmol/egg Slight non dose-related excess ofmalformation
Elovaara et al, 1979
a Converted valuesb Actual concentration fluctuating up to 568 ppm (3,914 mg/m3)
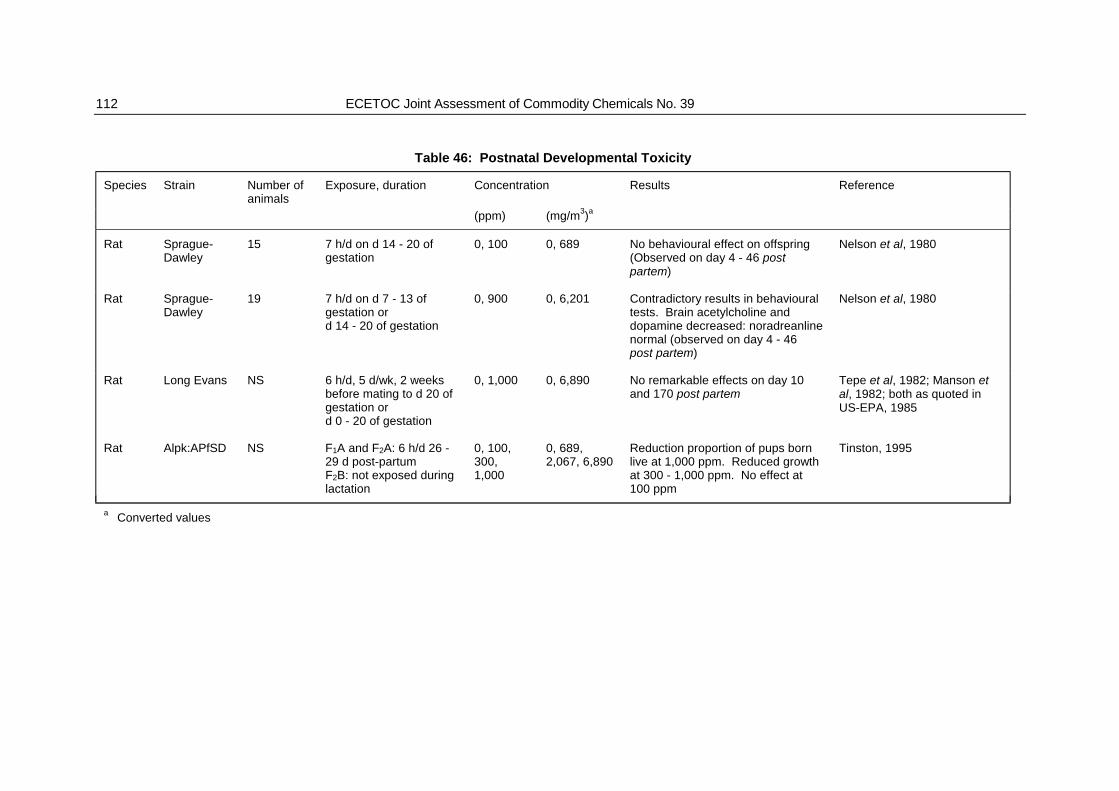
112 ECETOC Joint Assessment of Commodity Chemicals No. 39
Table 46: Postnatal Developmental Toxicity
Species Strain Number ofanimals
Exposure, duration Concentration Results Reference
(ppm) (mg/m3)a
Rat Sprague-Dawley
15 7 h/d on d 14 - 20 ofgestation
0, 100 0, 689 No behavioural effect on offspring(Observed on day 4 - 46 postpartem)
Nelson et al, 1980
Rat Sprague-Dawley
19 7 h/d on d 7 - 13 ofgestation ord 14 - 20 of gestation
0, 900 0, 6,201 Contradictory results in behaviouraltests. Brain acetylcholine anddopamine decreased: noradreanlinenormal (observed on day 4 - 46post partem)
Nelson et al, 1980
Rat Long Evans NS 6 h/d, 5 d/wk, 2 weeksbefore mating to d 20 ofgestation ord 0 - 20 of gestation
0, 1,000 0, 6,890 No remarkable effects on day 10and 170 post partem
Tepe et al, 1982; Manson etal, 1982; both as quoted inUS-EPA, 1985
Rat Alpk:APfSD NS F1A and F2A: 6 h/d 26 - 29 d post-partumF2B: not exposed duringlactation
0, 100,300,1,000
0, 689,2,067, 6,890
Reduction proportion of pups bornlive at 1,000 ppm. Reduced growthat 300 - 1,000 ppm. No effect at100 ppm
Tinston, 1995
a Converted values

Tetrachloroethylene 113
Another behavioural teratology study was cited by US-EPA (1985) (Tepe et al, 1982; Manson et al,
1982; both as quoted in US-EPA, 1985). Pregnant rats were exposed to 0 or 1,000 ppm PER (0,
6,890 mg/m3) for 2 weeks before mating until day 20 of gestation or on days 0 - 20 of gestation. Both
maternal and embryo-toxicity were observed (unspecified skeletal and soft tissue anomalies).
Neurobehavioral testing of the pups on days 10 and 170 after birth did not reveal treatment-related
effects.
Elovaara et al (1979) described effects of PER on developing chicken embryos. The test substance
was injected three times into the air space of fertilised chicken eggs at doses lower than the LD50 (5 -
100 mmol/egg). After 19 days of incubation, the rate of macroscopic malformation (9;8%) was higher
in the PER-treated group than in the controls treated with olive oil (3.5%), but it was lower than with
other chlorinated solvents such as trichloroethylene and 1,1,1-trichloroethane.
The multi-generation study by Tinston (1995) is reported in Section 8.8.1.
8.8.3 Summary
PER had no effect on the fertility of rats and mice although there was evidence of aberrant sperm
morphology in mice (but not in rats) and lower testicular weight in rats exposed to high levels of PER
(500 ppm and above; ≥ 3,445 mg/m3). Pre- and post-natal toxic effects to the pups were found in a 2-
generation study in rats exposed by inhalation up to 1,000 ppm PER (6,890 mg/m3). A NOEL of
100 ppm (689 mg/m3) was established in that study and previous studies in rats and mice.
PER has been shown to induce foetotoxic effects but no teratogenic effects at high dose levels in
several animal species, with the mouse being the most sensitive species. Because these foetal
effects always appeared at dose levels which induced toxic effects in the dams during gestation, they
are considered to be associated with maternal toxicity due either to PER or its metabolite, TCA.
8.9 NEUROBEHAVIOURAL EFFECTS AND NEUROTOXICITY
Anaesthetic Effects
Exposure to high atmospheric concentrations of PER causes CNS depression in all species studied. A
single 8-h exposure of rats to 2,750 ppm PER (18,950 mg/m3) initially caused anaesthesia, but after
6 exposures to this concentration, rats developed a tolerance to the effect (Carpenter, 1937).
Anaesthesia has also been reported in the mouse, rabbit and dog (Lamson et al, 1929; Friberg et al,
1953; Truhaut et al, 1972).
Wistar rats exposed to ≥ 6,000 ppm PER (41,340 mg/m3) for a few minutes or to 3,000 ppm
(20,670 mg/m3) for several hours showed unresponsiveness to external stimuli. Responsiveness was
114 ECETOC Joint Assessment of Commodity Chemicals No. 39
retained during exposure to 2,000 ppm (13,780 mg/m3) for 14 hours. Frequent loss of response to
external stimuli was also observed in Wistar rats during repeated exposure (18 x 7 h) to 2,500 ppm
PER (17,230 mg/m3) for 25 days. Following exposure to 1,600 ppm (11,024 mg/m3), drowsiness and
signs of stimulation of the cholinergic system were observed. Rabbits and guinea pigs showed signs
of CNS depression (anaesthetic effects) following exposure to 2,500 ppm PER. There were no effects
in these species or in rhesus monkeys, following exposure to 400 ppm PER (2,756 mg/m3) (Rowe et
al, 1952).
Behaviour
Ataxia was reported after a single 4-h exposure of female CFE rats to 2,300 ppm PER
(15,850 mg/m3). In the same study, a lack of effect on conditioned avoidance escape response was
observed in animals exposed (4 h/d, 5 d/wk) to 2,300 ppm for 2 weeks. No effects on the ability to
perform a conditioned avoidance task were observed following exposure to 1,150 ppm PER
(7,924 mg/m3) (Goldberg et al, 1964).
Increased open field activity (ambulation) was observed in a group of 10 male Sprague-Dawley rats
during the first 6 hours following 1 hour of exposure to 200 ppm PER (1,378 mg/m3), but 17 hours later
no effects were seen (Savolainen et al, 1977).
In a swimming immobilisation test conducted immediately following exposure to 596 - 820 ppm PER
(4,106 - 5,650 mg/m3) for 4 hours, mice showed significantly reduced duration of immobility within the
test period (3 min). Assessments were not made at later time periods (De Ceaurritz et al, 1983).
Using a Doppler radar unit, the motor activity of mice was recorded 1 hour before, during and 2 hours
after inhalation of 90 - 3,600 ppm PER (620 - 24,800 mg/m3) for 1 hour. The motor activity was
increased during exposure at all concentrations, although only slightly in mice exposed to 90 ppm
PER. No increased motor activity was recorded 2 hours after exposure (Kjellstrand et al, 1985).
Male and female F344/N rats were exposed (6 h/d, 5 d/wk) by inhalation to 0, 50, 200 or 800 ppm
PER (0, 344.5, 1,378, 5,512 mg/m3) for 13 weeks and evaluated for neurotoxicity during the first
week post-exposure by means of a functional observation battery (FOB). In addition, flash evoked
potential (FEP) tests were made of the visual, auditory and somatosensory systems, the velocity of
caudal nerves was evaluated and neuropathology examined. An FOB was also conducted monthly
during the exposure period. No treatment-related alterations were observed (Mattsson et al, 1998).
Neurochemistry
Cholinesterase activity, protein, RNA and GSH levels in the brain did not show any significant changes
after 5 daily exposures (6 h/d) of male Sprague-Dawley rats to 200 ppm PER (1,378 mg/m3)

Tetrachloroethylene 115
(Savolainen et al, 1977). However, due to the small number of animals used, the results of this study
cannot be fully evaluated.
Biochemical analysis of mid-brain amino acid content in Sprague-Dawley rats (5 - 6 males/group)
showed a dose-dependent increase in glutamine, threonine and serine (combined) following
continuous exposure to 200, 400 or 800 ppm PER (1,378, 2,756, 5,512 mg/m3) for 1 month. A small
reduction in acetylcholine levels in the striatum was observed following exposure to 800 ppm PER. No
effects were seen following exposure to 400 ppm or below (Honma et al, 1980a,b).
Mongolian gerbils (6 exposed and 7 control animals) continuously exposed to 120 ppm PER
(827 mg/m3) for 12 months had changes in fatty acid composition of ethanolamine phosphoglycerides
in the cerebral cortex and hippocampus. According to the authors, these changes represented an
increase in the fatty acids derived from linoleic acid with a corresponding decrease in those derived
from linoleic acid and may be due to cell membrane effects. No changes were detected in the weight
of whole brain, hippocampus or cerebral cortex, or levels of cholesterol, phospholipids or cerebrosides
in these areas (Kyrklund et al, 1984).
Brain amino acid and GSH concentrations were also determined in this study. Treatment-related
effects included decreases in taurine content in the hippocampus and posterior part of the cerebellar
vermis and increased glutamine content in the hippocampus. The uptake of glutamate and
γ-aminobutyric acid (GABA) into the cerebellum and hippocampus was unaffected by exposure to PER
(Briving et al, 1986).
After continuous exposure of Mongolian gerbils to 320 ppm PER (2;205 mg/m3) for 3 months, a slight
but statistically significant decrease in brain weight was reported (Kyrklund et al, 1987). Body weights
were similarly decreased and small changes in the pattern of fatty acids in the brain were observed.
Some of these changes were inconsistent with the earlier findings (Kyrklund et al, 1984). Their
toxicological significance is uncertain. Continuous exposure for 3 months to 60 ppm PER (413.4 -
2,205 mg/m3) led to a slight decrease of DNA concentrations in the frontal cerebral cortex, but not to
differences in DNA or protein content in other areas of the brain, or to differences in body or brain
weight (Karlsson et al, 1987). No toxicological significance can be attributed to the decreased DNA
levels.
In another study with groups of Mongolian gerbils (4/dose/sex), an increase in the levels of S-100, an
astroglial protein, was observed in the brain after a 3-month continuous exposure to 60 or 320 ppm
PER (413.4 mg/m3) followed by a 4-month post-exposure period (Rosengren et al, 1986). There were
no significant changes in body or brain weights. Decreased DNA concentration in the frontal cerebral
cortex was the only effect associated with exposure to PER. The authors claimed that their results
were consistent with astroglial hypertrophy and/or proliferation in the hippocampus, and atrophy of the
116 ECETOC Joint Assessment of Commodity Chemicals No. 39
cerebral frontal cortex. However, the DNA levels reported appeared to be within the normal
background levels. As no histopathological examination was conducted and given the non-validated
status of the assays, no conclusions can be drawn from this study.
Kyrklund et al (1988, 1990) reported effects on the lipid and fatty acid composition of the brain of
Sprague-Dawley rats (8 males/group) after continuous exposure to 320 ppm PER (2,205 mg/m3) for
30 or 90 days. The 90-d exposure period was followed by a 30-d recovery period. A slight decrease
in the contents of cholesterol and phospholipids of the cerebral cortex was reported. Changes in the
pattern of long-chain unsaturated fatty acids were reported after 30 and 90 days of exposure, but most
changes returned to normal values during the 30-d recovery period. No effects of exposure to PER on
whole brain weights were observed.
In a study by Wang et al (1993), rats were continuously exposed to 300 ppm PER (2,067 mg/m3) for
4 weeks or to 600 ppm (4,134 mg/m3) for 4 or 12 weeks. Following exposure to 600 ppm, in particular
after 12 weeks of exposure, statistically significant decreases in body weight gain, in total brain and
some brain region weights were observed. DNA and protein contents of the frontal cerebral cortex
and brain stem, but not of the hippocampus, were decreased following exposure to 600 ppm,
statistically significant after 12 weeks of exposure. The levels of both glial and one of 2 neuronal cell
marker proteins were lower in exposed animals than in controls. The toxicological significance of
these findings not clear.
Neurophysiology
In an acute neurophysiological range-finding study, Albee et al (1991) exposed male F344/N rats to
800 ppm PER (5,512 mg/m3). The animals showed significant pharmacological alterations in flash
evoked potentials, electro-encephalograms and somatosensory evoked potentials that were recorded
during the 4 hours of 4 daily exposures. The goal of this study was to identify a neurofunctional
maximum tolerated dose for a subsequent 13-wk neurotoxicity study.
In the 13-wk study (Mattson et al, 1998), groups of 14 male and 14 female F344/N rats were exposed
(6 h/d, 5 d/wk) by inhalation at to concentrations of 0, 50, 200 or 800 ppm PER (0, 344.5, 1,378,
5,512 mg/m3) for 13 weeks and were evaluated for neurotoxicity during the first week post-exposure
by FOB, by FEP testing of the visual, auditory and somatosensory systems, by conduction velocity
evaluation of caudal nerves, and by neuropathology. The only effect possibly related to treatment was
in the FEP recorded from the visual cortex, which had a somewhat greater amplitude in rats exposed
to 800 ppm PER. No toxicological significance was attributed to this finding. No treatment-related
alterations were observed in the flash evoked potentials recorded from the cerebellum, or in the
auditory, somatosensory or caudal nerve evoked potentials at any of the exposure levels. No
treatment-related lesions were noted during histopathological examination of tissues of the central and

Tetrachloroethylene 117
peripheral nervous system. The No-Observed Adverse Effect Level NOAEL derived from this study is
800 ppm.
8.9.1 Summary
Investigations of effects on the nervous system have been conducted mainly in the rat, with additional
studies in the rabbit, guinea pig, monkey and Mongolian gerbil. PER has a depressant effect on the
CNS in the rat, rabbit and guinea pig following exposure to high atmospheric levels (2,500 ppm;
17,230 mg/m3). Minimal depressant effects were observed in the rat following exposure to 1,600 ppm
(11,024 mg/m3). Based on behaviour, a NOEL for CNS depression of 400 ppm/d PER
(2,756 mg/m3/d) for 6 months was reported in all these species, as well as in the rhesus monkey.
Slight excitatory effects (ambulation) are seen at lower concentrations (around 200 ppm). Studies in
the rat demonstrate that the CNS effects of PER are rapidly reversible and that a tolerance develops
on repeated exposures.
Behavioural and biochemical investigations have been conducted mostly in single dose level studies in
the rat and show only minor effects. Changes observed are often small and within the normal range of
the parameters in control groups. In most studies, their reversibility has not been examined and/or no
pathological assessment has been performed. Furthermore, no consistent pattern of changes has
been found and it is not certain to which degree recorded effects are toxic (adverse) or potentially
adaptive. The extent to which these parameters are susceptible to change by altered diurnal variation
due to sedative effects is unknown. The functional significance of such changes, therefore, remains
obscure.
Neither histopathological nor functional observation of rats and mice exposed chronically to PER has
provided any evidence of neurotoxicity in these species.
118 ECETOC Joint Assessment of Commodity Chemicals No. 39
9. EFFECTS ON HUMANS
9.1 ACUTE TOXICITY
In this section, the toxic effects of single human exposures to PER will be discussed. Thus, this
section also deals with what is usually considered subchronic toxicity. For CNS effects, see
Section 9.4.
9.1.1 Oral
Data on oral exposure to PER derives mainly from its clinical use as a anthelmintic drug.
Kendrick (1929) compared the use of carbon tetrachloride and PER for the treatment of hookworm in
humans, and reported vertigo, giddiness, nausea and sleepiness in approximately 50% of a study
group of 200 patients receiving doses of 4.5 or 6.0 g PER. Kendrick (1929) and Sandground (1941)
observed unconsciousness in 2 patients receiving similar doses; the effect occurred approximately
1 hour after dosing and lasted for 2 hours.
Two deaths following ingestion of PER have been reported. One occurred in a patient who was
already suffering from jaundice and had received a dose of 4.5 g PER as an anthelmintic treatment
(Goldbloom and Boyd, 1954). The second fatality was a child who died of ventricular fibrillation after
accidental ingestion of PER. No further details on the patient and doses received were given
(Lemburg et al, 1979).
Haerer and Udelman (1964) reported a state of psychosis that was induced in one man approximately
1 hour after ingestion of 7.5 g PER.
9.1.2 Dermal
Nausea, vertigo, fatigue and vomiting have been reported in a worker following dermal exposure to a
PER-water mixture. The patient recovered when exposure ceased (Method, 1946).
9.1.3 Inhalation
Garnier et al (1996) reported a fatal case of accidental inhalation of PER (estimated concentration as
high as 38,095 mg/m3 (5,520 ppm) in a 2-year old child. The child was found dead 1.5 hours after
being put to bed in a small room where curtains, freshly cleaned in a self-service coin-operated dry-
cleaning machine, had been hung by a window to air. It was reported that the machine had been
operated incorrectly and that the curtains were still wet with solvent (PER) when they were taken back
home. PER concentrations found in the body were high, namely 79 mg/kg in brain and 31 mg/kg in
Tetrachloroethylene 119
heart tissues, as well as 46 mg/kg in lungs and 68 mg/l in blood. The urine contained 0.4 mg PER/l,
1.7 mg trichloroethanol/l and 0.9 mg TCA/l.
Garnier et al (1996) further reported 28 non-fatal intoxication cases observed in the Paris Anti-poison
Centre between 1989 and 1995 following inhalation of PER due to improper use of similar, self-
service, coin-operated, dry-cleaning machines. (The author also refers to similar cases that occurred
in Denmark during the 1970s.) In most cases, the dry-cleaning machine was overloaded with
absorbent fabrics not recommended for dry-cleaning, such that clothes and fabrics were still wet with
solvent when removed from the machine. Thus, PER could evaporate from the cleaned articles into
vehicles during their transportation and into homes, producing unknown but presumably high indoor
concentrations. Symptoms in exposed children and adults included headache, dizziness, drowsiness,
vomiting and inebriety and loss of consciousness lasting from a few minutes up to 5 hours. All effects
were reported to be reversible after either a few minutes or up to several hours. In the most severe
case, BOCCRF (1995) measured TCA concentrations of 4.9 mg/l in blood and 13 mg/g creatinine in
urine; trichloroethanol concentrations were 55.1 mg/l in blood and 26.4 mg/g creatinine in urine.
Effects on the Liver
Autopsy of several cases of fatal poisoning with PER revealed fatty degeneration of the liver was
found (Trense and Zimmermann, 1969; Lukaszewski, 1979; Levine et al, 1981; McCarthy and Jones,
1983).
Hughes (1954) and Meckler and Phelps (1966) reported a case of acute hepatitis (jaundice, enlarged
liver and abnormal tests of liver function) following exposure to PER.
Following non-fatal poisoning with PER, several authors observed palpable hepatomegaly and raised
serum markers for liver damage (SGOT, SGPT), 10 times as high as the normal value. Recovery
time appeared to be dose-dependent, with liver enlargement resolving completely 10 weeks after
exposure to low concentrations, but persisting for over 6 months after higher exposures (Meckler and
Phelps, 1966; Saland, 1967; Montalto and Mari, 1971; Einhorn, 1972; Hake and Stewart, 1977; Ferrau
et al, 1980). Liver histology was normal after 7 months in one instance, but in a second case cirrhosis
was diagnosed 14 months after the poisoning (Meckler and Phelps, 1966; Ferrau et al, 1980).
Other Systemic Effects
Pulmonary congestion was autopsied in several cases, following inhalation of high concentrations of
PER (Trense and Zimmermann, 1969; Levine, 1981; McCarthy and Jones, 1983). In a further case,
Lukaszewski (1979) also described fatty degeneration of the brain, together with degenerative
changes in the kidneys.
120 ECETOC Joint Assessment of Commodity Chemicals No. 39
Renal dysfunction and secondary pulmonary oedema following inhalation of PER (doses not stated)
have been reported (Trense and Zimmermann, 1969; Einhorn, 1972; Montalto and Mari, 1971; Hake
and Stewart, 1977; Patel et al, 1977; Levine et al, 1981; McCarthy and Jones, 1983).
9.1.4 Summary
The principle effects from inhalation of PER by humans are symptoms associated with CNS
depression (Section 9.3). In addition, cases of acute hepatitis, reversible and dose dependent liver
damage (palpable hepatomegaly and raised serum markers) are reported. Delayed effects include
renal dysfunction and secondary pulmonary oedema.
One case of fatal ventricular fibrillation has been reported in a child exposed to high concentrations of
PER.
9.2 HUMAN SKIN, RESPIRATORY AND EYE IRRITATION AND SENSITISATION
9.2.1 Skin Irritation
Stewart and Dodd (1964) reported that individuals experienced a mild burning sensation on their
thumbs following their immersion in a solution of PER for 5-10 minutes. After the thumbs were
withdrawn, the burning sensation persisted without a decrease in intensity for 10 minutes before
gradually subsiding after 1 hour. A marked erythema was present in all cases and subsided between
1 and 2 hours post-exposure.
Hammerling Gold (1969) reported that prolonged or repeated skin contact with liquid PER causes
defattening of the skin with dermatitis, dryness, roughness and cracking.
Morgan (1969) reported an accident where a container with liquid PER was spilled over a worker,
soaking his clothes. The worker became anaesthetised by the vapour and remained unconscious for
0.5 hours. He suffered from skin erythema and blistering (30% of skin surface).
Ling and Lindsay (1971) reported severe skin burns when an individual, losing consciousness, fell into
a pool of PER. The burns gradually healed within 3 weeks following exposure.
A case of exfoliative dermatitis due to PER has been reported, but no further details were given
(Nicolis and Helwig, 1973).
Burns following prolonged PER contact have been reported in 3 other cases (Meyer, 1973; Hake and
Stewart, 1977; Metz et al, 1982).
Tetrachloroethylene 121
Redmond and Schappert (1987) reported irritant contact dermatitis associated with residual PER (0.83
to 32.01 mg/kg) in dry-cleaned garments that had been encased in sealed plastic bags.
9.2.2 Respiratory Irritation
Exposure of human volunteers to PER vapour at a concentration of 1,060 ppm (7,300 mg/m3) caused
marked irritation of the upper respiratory tract. The effect was mild in volunteers exposed to
concentrations of 600 ppm PER (4,134 mg/m3) and was confined to mild nasal irritation at 216 ppm
(1,488 mg/m3) for 2 hours (Rowe et al, 1952).
9.2.3 Eye Irritation
Human volunteers exposed to PER vapour concentrations of 280 ppm (1,929 mg/m3) and above
experienced substantial irritation of the eyes and mucous membranes. Following exposure to lower
concentrations (> 100 ppm; 689 mg/m3) only mild symptoms of irritation of the eyes and nose were
reported (Rowe et al, 1952; Stewart et al, 1961, 1970). At 20 ppm (138 mg/m3) for 90 minutes, no
irritation was reported (Wayne and Orcutt, 1960).
9.2.4 Skin Sensitisation
Skin sensitisation was reported in a worker occupationally exposed to PER. A closed 48-h patch test
with 1% PER in olive oil produced a positive response in this subject (Vail, 1974).
9.2.5 Respiratory System Sensitisation
Boulet (1988) reported one case of occupational asthma after regular exposure for short periods of
time to PER originating from dry-cleaned linen. After complete recovery, the patient was challenged
again with PER, and he presented cough and dyspnoea.
9.2.6 Summary and Evaluation
The effects of PER on the skin range from a mild to moderate burning sensation when direct contact
occurs for 5 - 10 minutes. Marked erythema can occur after prolonged exposure and blistering might
occur if, for example, PER was trapped against the skin under clothing or in shoes. Exposure to PER
vapour at concentrations above 100 ppm (689 mg/m3) causes irritation of the eyes and respiratory
tract. Single reports of sensitisation of the skin or the respiratory system have been published. These
reports are of such low frequency, that PER would not be considered to be a skin or respiratory
sensitiser.
122 ECETOC Joint Assessment of Commodity Chemicals No. 39
9.3 EFFECTS ON THE CENTRAL NERVOUS SYSTEM
9.3.1 Volunteer Studies
Details of the available studies in human volunteers are summarised in Table 47.
Rowe et al (1952) exposed human volunteers to PER at concentrations ranging from 106 to
1,060 ppm (730 - 7,300 mg/m3) for periods from a few minutes up to 8 hours (no control group).
Following exposure to 216 ppm (1,488 mg/m3) and above, reversible signs of CNS depression were
observed, which increased in severity with higher levels of exposure. The most frequently reported
subjective complaints of CNS depression were, in order of increasing severity: light-headedness,
dizziness, drowsiness, headache, nausea, fatigue and impaired co-ordination. Exposure to 280 ppm
(1,929 mg/m3) for up to 2 hours or 600 ppm (4,134 mg/m3) for 10 minutes resulted in a loss of motor
co-ordination in groups of 4 subjects. Exposure to 106 ppm (730 mg/m3) for 1 hour showed no
significant adverse CNS effects.
Stewart et al (1961) exposed groups of healthy male volunteers (6/group) to either 101 ppm PER
(696 mg/m3) for 183 minutes, or to 194 ppm (1,337 mg/m3) for 83 or 187 minutes; there was no
control group. The findings in this study were comparable to those reported by Rowe et al (1952).
Exposure to 101 ppm (696 mg/m3) resulted in slight eye irritation and slight light-headedness but not in
significant adverse CNS effects.
In another study, Stewart et al (1970) exposed (7 h/d) 5 healthy males to a mean concentration of
101 ppm PER (696 mg/m3) for 5 days. Symptoms such as mild eye and throat irritation, light-
headedness and mild headache were reported. Five objective tests of CNS performance were
conducted either every 60 minutes during the exposure or 5 hours post-exposure; none showed any
abnormality except the Romberg test of balance (conducted hourly during the exposure), which was
abnormal in 3 of the 5 subjects within the first 3 hours of exposure. No control subjects were included
in this study.
Stewart et al (1977) exposed (5.5 h/d, 5 d/wk) 12 volunteers (6 males and 6 females) to 0.25 or
100 ppm PER (1.72 or 689 mg/m3) for 11 weeks in which subjects were also given diazepam and/or
alcohol in combination with an exercise regime. A battery of neurological and behavioural tests was
conducted to evaluate the effects of exposure: Romberg balance test, Flanagan co-ordination test,
eye saccade velocity measurement, the Lorr-McNair mood scale and a rotary pursuit test. In addition,
EEGs were recorded during exposure. The only effect attributed to PER was a slight but significant
change in Flanagan co-ordination scores when the values on control days were combined with those
following receipt of placebo-diazepam, but not when scores following exposure to PER were
compared with controls. The authors concluded that exposure to PER at concentrations up to
100 ppm (689 mg/m3) had no consistent effects on test performance.
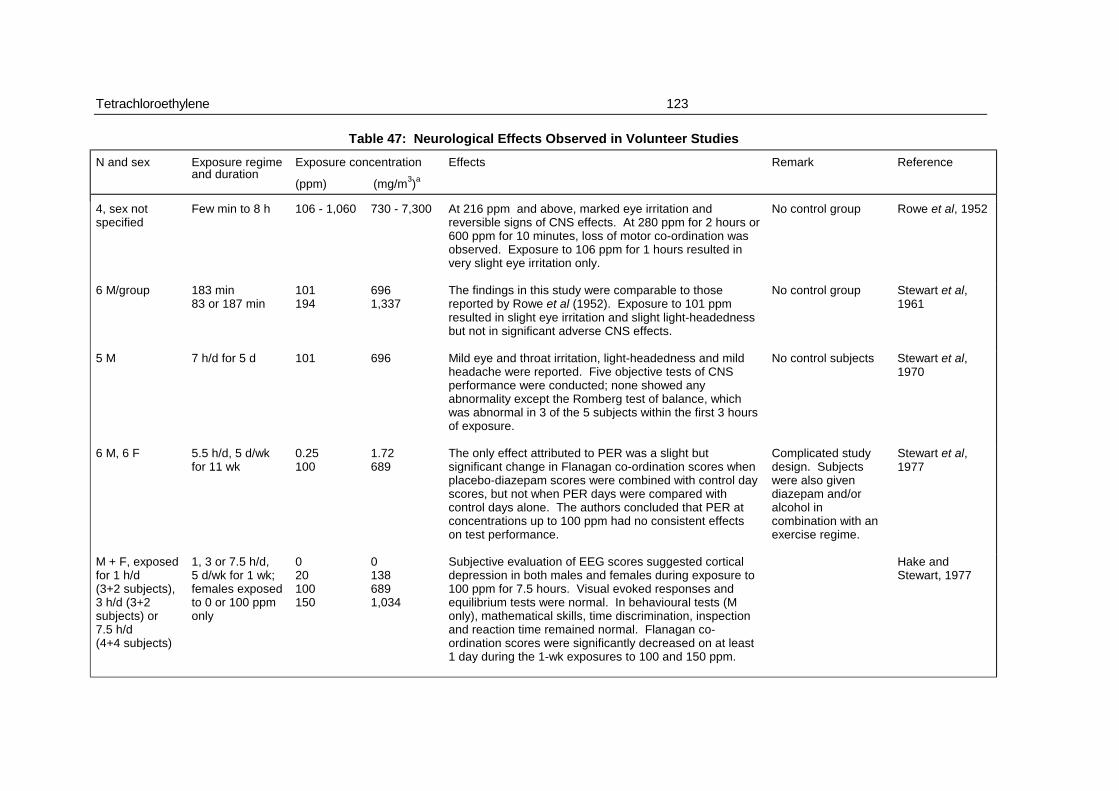
Tetrachloroethylene 123
Table 47: Neurological Effects Observed in Volunteer Studies
N and sex Exposure regimeand duration
Exposure concentration
(ppm) (mg/m3)a
Effects Remark Reference
4, sex notspecified
Few min to 8 h 106 - 1,060 730 - 7,300 At 216 ppm and above, marked eye irritation andreversible signs of CNS effects. At 280 ppm for 2 hours or600 ppm for 10 minutes, loss of motor co-ordination wasobserved. Exposure to 106 ppm for 1 hours resulted invery slight eye irritation only.
No control group Rowe et al, 1952
6 M/group 183 min83 or 187 min
101194
6961,337
The findings in this study were comparable to thosereported by Rowe et al (1952). Exposure to 101 ppmresulted in slight eye irritation and slight light-headednessbut not in significant adverse CNS effects.
No control group Stewart et al,1961
5 M 7 h/d for 5 d 101 696 Mild eye and throat irritation, light-headedness and mildheadache were reported. Five objective tests of CNSperformance were conducted; none showed anyabnormality except the Romberg test of balance, whichwas abnormal in 3 of the 5 subjects within the first 3 hoursof exposure.
No control subjects Stewart et al,1970
6 M, 6 F 5.5 h/d, 5 d/wkfor 11 wk
0.25100
1.72689
The only effect attributed to PER was a slight butsignificant change in Flanagan co-ordination scores whenplacebo-diazepam scores were combined with control dayscores, but not when PER days were compared withcontrol days alone. The authors concluded that PER atconcentrations up to 100 ppm had no consistent effectson test performance.
Complicated studydesign. Subjectswere also givendiazepam and/oralcohol incombination with anexercise regime.
Stewart et al,1977
M + F, exposedfor 1 h/d(3+2 subjects),3 h/d (3+2subjects) or7.5 h/d(4+4 subjects)
1, 3 or 7.5 h/d,5 d/wk for 1 wk;females exposedto 0 or 100 ppmonly
020100150
01386891,034
Subjective evaluation of EEG scores suggested corticaldepression in both males and females during exposure to100 ppm for 7.5 hours. Visual evoked responses andequilibrium tests were normal. In behavioural tests (Monly), mathematical skills, time discrimination, inspectionand reaction time remained normal. Flanagan co-ordination scores were significantly decreased on at least1 day during the 1-wk exposures to 100 and 150 ppm.
Hake andStewart, 1977
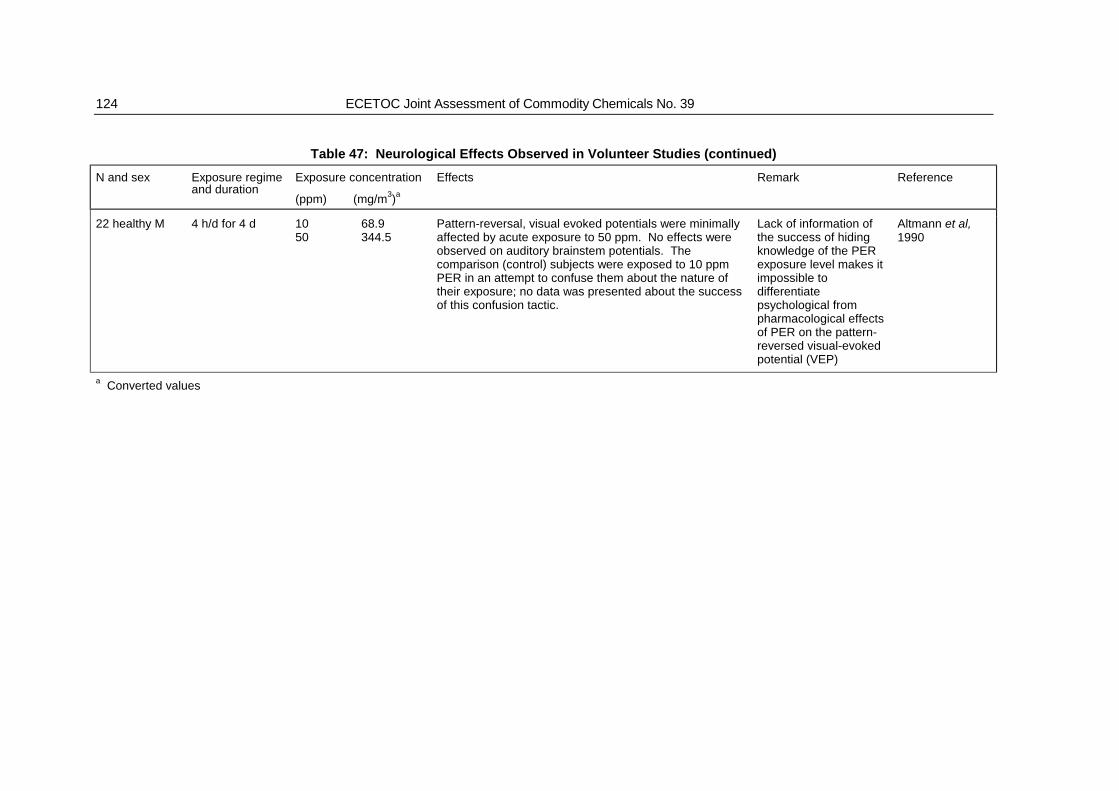
124 ECETOC Joint Assessment of Commodity Chemicals No. 39
Table 47: Neurological Effects Observed in Volunteer Studies (continued)
N and sex Exposure regimeand duration
Exposure concentration
(ppm) (mg/m3)a
Effects Remark Reference
22 healthy M 4 h/d for 4 d 1050
68.9344.5
Pattern-reversal, visual evoked potentials were minimallyaffected by acute exposure to 50 ppm. No effects wereobserved on auditory brainstem potentials. Thecomparison (control) subjects were exposed to 10 ppmPER in an attempt to confuse them about the nature oftheir exposure; no data was presented about the successof this confusion tactic.
Lack of information ofthe success of hidingknowledge of the PERexposure level makes itimpossible todifferentiatepsychological frompharmacological effectsof PER on the pattern-reversed visual-evokedpotential (VEP)
Altmann et al,1990
a Converted values
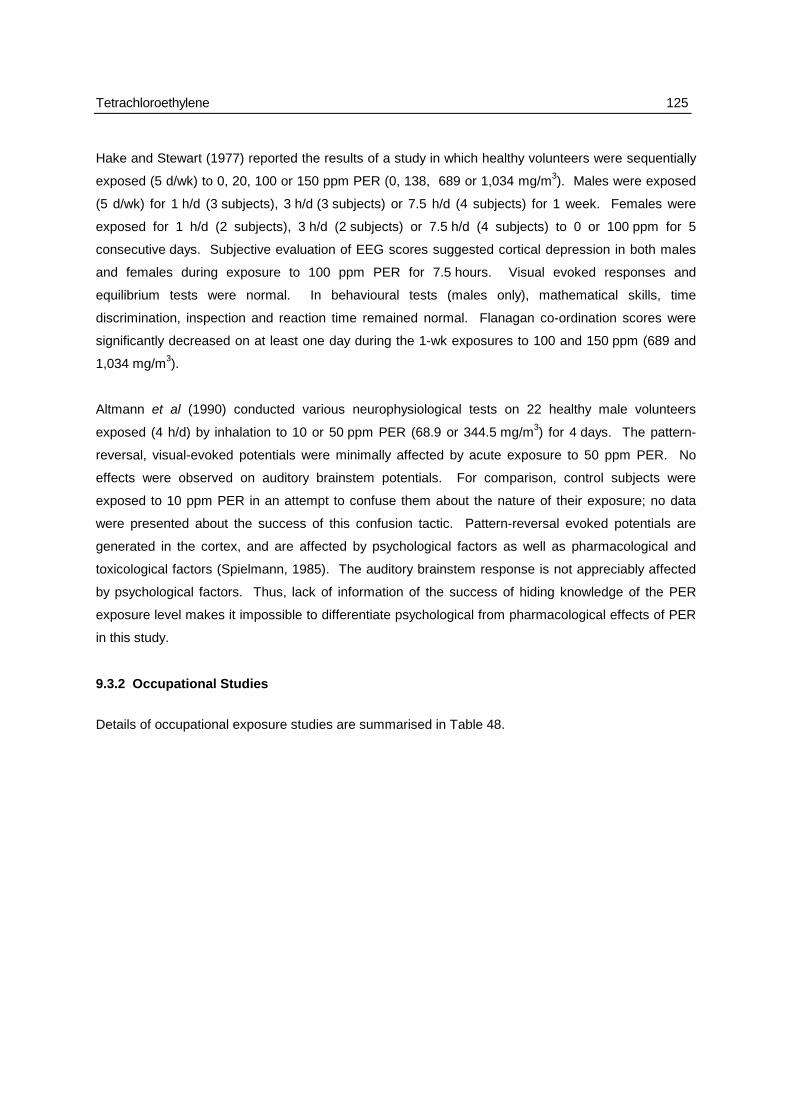
Tetrachloroethylene 125
Hake and Stewart (1977) reported the results of a study in which healthy volunteers were sequentially
exposed (5 d/wk) to 0, 20, 100 or 150 ppm PER (0, 138, 689 or 1,034 mg/m3). Males were exposed
(5 d/wk) for 1 h/d (3 subjects), 3 h/d (3 subjects) or 7.5 h/d (4 subjects) for 1 week. Females were
exposed for 1 h/d (2 subjects), 3 h/d (2 subjects) or 7.5 h/d (4 subjects) to 0 or 100 ppm for 5
consecutive days. Subjective evaluation of EEG scores suggested cortical depression in both males
and females during exposure to 100 ppm PER for 7.5 hours. Visual evoked responses and
equilibrium tests were normal. In behavioural tests (males only), mathematical skills, time
discrimination, inspection and reaction time remained normal. Flanagan co-ordination scores were
significantly decreased on at least one day during the 1-wk exposures to 100 and 150 ppm (689 and
1,034 mg/m3).
Altmann et al (1990) conducted various neurophysiological tests on 22 healthy male volunteers
exposed (4 h/d) by inhalation to 10 or 50 ppm PER (68.9 or 344.5 mg/m3) for 4 days. The pattern-
reversal, visual-evoked potentials were minimally affected by acute exposure to 50 ppm PER. No
effects were observed on auditory brainstem potentials. For comparison, control subjects were
exposed to 10 ppm PER in an attempt to confuse them about the nature of their exposure; no data
were presented about the success of this confusion tactic. Pattern-reversal evoked potentials are
generated in the cortex, and are affected by psychological factors as well as pharmacological and
toxicological factors (Spielmann, 1985). The auditory brainstem response is not appreciably affected
by psychological factors. Thus, lack of information of the success of hiding knowledge of the PER
exposure level makes it impossible to differentiate psychological from pharmacological effects of PER
in this study.
9.3.2 Occupational Studies
Details of occupational exposure studies are summarised in Table 48.

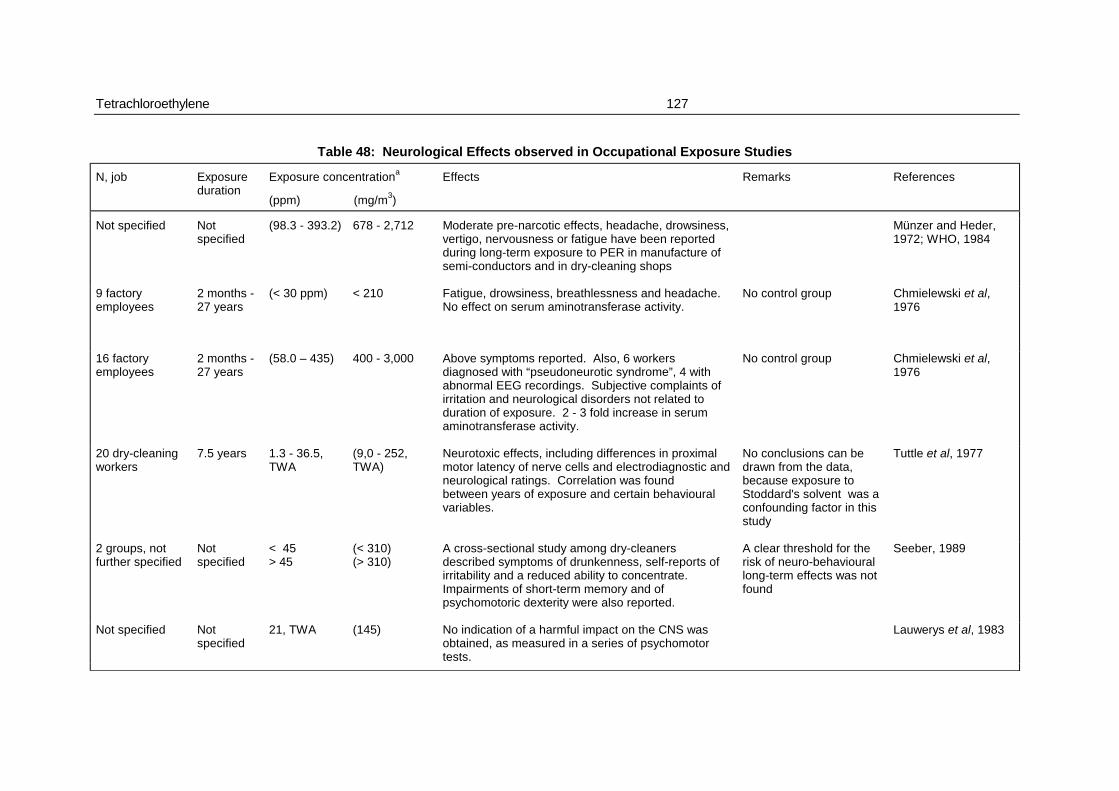
Tetrachloroethylene 127
Table 48: Neurological Effects observed in Occupational Exposure Studies
N, job Exposureduration
Exposure concentrationa
(ppm) (mg/m3)
Effects Remarks References
Not specified Notspecified
(98.3 - 393.2) 678 - 2,712 Moderate pre-narcotic effects, headache, drowsiness,vertigo, nervousness or fatigue have been reportedduring long-term exposure to PER in manufacture ofsemi-conductors and in dry-cleaning shops
Münzer and Heder,1972; WHO, 1984
9 factoryemployees
2 months -27 years
(< 30 ppm) < 210 Fatigue, drowsiness, breathlessness and headache. No effect on serum aminotransferase activity.
No control group Chmielewski et al,1976
16 factoryemployees
2 months -27 years
(58.0 – 435) 400 - 3,000 Above symptoms reported. Also, 6 workersdiagnosed with “pseudoneurotic syndrome”, 4 withabnormal EEG recordings. Subjective complaints ofirritation and neurological disorders not related toduration of exposure. 2 - 3 fold increase in serumaminotransferase activity.
No control group Chmielewski et al,1976
20 dry-cleaningworkers
7.5 years 1.3 - 36.5,TWA
(9,0 - 252,TWA)
Neurotoxic effects, including differences in proximalmotor latency of nerve cells and electrodiagnostic andneurological ratings. Correlation was foundbetween years of exposure and certain behaviouralvariables.
No conclusions can bedrawn from the data,because exposure toStoddard's solvent was aconfounding factor in thisstudy
Tuttle et al, 1977
2 groups, notfurther specified
Notspecified
< 45> 45
(< 310)(> 310)
A cross-sectional study among dry-cleanersdescribed symptoms of drunkenness, self-reports ofirritability and a reduced ability to concentrate. Impairments of short-term memory and ofpsychomotoric dexterity were also reported.
A clear threshold for therisk of neuro-behaviourallong-term effects was notfound
Seeber, 1989
Not specified Notspecified
21, TWA (145) No indication of a harmful impact on the CNS wasobtained, as measured in a series of psychomotortests.
Lauwerys et al, 1983
128 ECETOC Joint Assessment of Commodity Chemicals No. 39
Table 48: Neurological Effects observed in Occupational Exposure Studies (continued)
N, job Exposureduration
Exposure concentrationa
(ppm) (mg/m3)
Effects Remarks References
A 68-year-oldman, who hadowned a dry-cleaning shop
> 30 years Notspecified
- The man had suffered a complete loss of hair andfinger nails in 1982 and had been sent to a clinic witha history of memory impairment that could have beendue to progressive dementia (Alzheimer's Disease). Serum levels of PER appeared to be 15 times higherthan that of the general population.Neuropsychological testing performed some monthsafter the initial medical diagnosis of probableAlzheimer's Disease failed to confirm a significantcognitive impairment, thus questioning the initialdiagnosis.
The authors concludedthat the observedsymptoms may havebeen occupationallyrelated
Freed and Kandel,1988
45 dry-cleaners,103 people livingclose to dry-cleaning shopsand 106unexposedcontrols
Not specified Notspecified
- Self-reports were made of drowsiness, nervousness,enhanced fatigue, decrease in the ability toconcentrate, memory disturbances and increasedperspiration among the exposed groups. Levels ofPER in the blood were increased in the dry-cleaners(147 - 416 µg/l) and in the people living close to dry-cleaning shops (average value 13 µg/l) compared tothe controls (average value 1 µg/l).
The authors concludedthat following exposure toapproximately 50 ppmPER (344.5 mg/m3),reversible psychomotoriceffects occur in humans.
Winneke et al, 1989
7 males, 50females5 males, 39females(all 101 dry-cleaners)
141 d127 d
(12.1)(52.8)
83.4363.8
Statistically significant differences were observedbetween the exposure groups and the controls (20males/64 females) in perceptual speed, digitreproduction, digit symbol, choice reaction andcancellation tests. No dose-related differences werefound between the low and the high exposure group. In 5 of the 8 categories the high-exposure groupperformed better than the low-exposure group. Giventhat the high-exposure level was 4 times greater thanthe low exposure levels, this is strongly suggestive ofdifferences from factors other than PER.
This study is anexploratory analysis (i.e.hypothesis generating),and it should beconsidered as such
Seeber, 1989
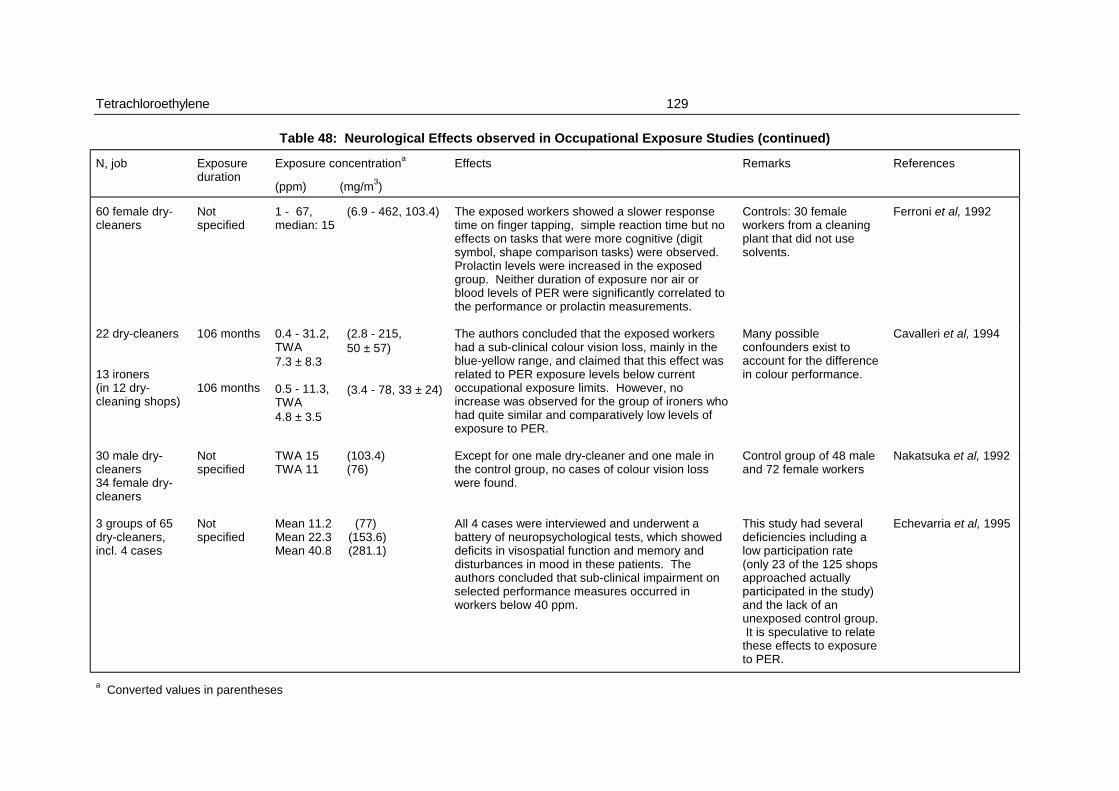
Tetrachloroethylene 129
Table 48: Neurological Effects observed in Occupational Exposure Studies (continued)
N, job Exposureduration
Exposure concentrationa
(ppm) (mg/m3)
Effects Remarks References
60 female dry-cleaners
Notspecified
1 - 67,median: 15
(6.9 - 462, 103.4) The exposed workers showed a slower responsetime on finger tapping, simple reaction time but noeffects on tasks that were more cognitive (digitsymbol, shape comparison tasks) were observed. Prolactin levels were increased in the exposedgroup. Neither duration of exposure nor air orblood levels of PER were significantly correlated tothe performance or prolactin measurements.
Controls: 30 femaleworkers from a cleaningplant that did not usesolvents.
Ferroni et al, 1992
22 dry-cleaners
13 ironers(in 12 dry-cleaning shops)
106 months
106 months
0.4 - 31.2,TWA7.3 ± 8.3
0.5 - 11.3,TWA4.8 ± 3.5
(2.8 - 215, 50 ± 57)
(3.4 - 78, 33 ± 24)
The authors concluded that the exposed workershad a sub-clinical colour vision loss, mainly in theblue-yellow range, and claimed that this effect wasrelated to PER exposure levels below currentoccupational exposure limits. However, noincrease was observed for the group of ironers whohad quite similar and comparatively low levels ofexposure to PER.
Many possibleconfounders exist toaccount for the differencein colour performance.
Cavalleri et al, 1994
30 male dry-cleaners34 female dry-cleaners
Notspecified
TWA 15TWA 11
(103.4)(76)
Except for one male dry-cleaner and one male inthe control group, no cases of colour vision losswere found.
Control group of 48 maleand 72 female workers
Nakatsuka et al, 1992
3 groups of 65dry-cleaners,incl. 4 cases
Notspecified
Mean 11.2Mean 22.3Mean 40.8
(77)(153.6)(281.1)
All 4 cases were interviewed and underwent abattery of neuropsychological tests, which showeddeficits in visospatial function and memory anddisturbances in mood in these patients. Theauthors concluded that sub-clinical impairment onselected performance measures occurred inworkers below 40 ppm.
This study had severaldeficiencies including alow participation rate(only 23 of the 125 shopsapproached actuallyparticipated in the study)and the lack of anunexposed control group. It is speculative to relatethese effects to exposureto PER.
Echevarria et al, 1995
a Converted values in parentheses

130 ECETOC Joint Assessment of Commodity Chemicals No. 39
Moderate pre-narcotic effects (headache, drowsiness, vertigo, nervousness or fatigue) have been
reported during long-term exposure to concentrations ranging from 678 - 2,712 mg PER/m3 (98.3 -
393.2 ppm) in the manufacture of semi-conductors and in dry-cleaning shops (Münzer and Heder,
1972; WHO, 1984).
Chmielewski et al (1976) reported fatigue, drowsiness, breathlessness and headache in a group of 9
factory workers exposed to low concentrations of PER (< 210 mg/m3, < 30 ppm).
In another factory, Chmielewski et al (1976) identified 6 subjects diagnosed with “pseudoneurotic
syndrome” and 4 subjects with abnormal EEG recordings among 16 workers exposed to
400-3,000 mg PER/m3 (58.0 - 435 ppm) for periods ranging from 2 months to more than 20 years.
Subjective complaints of neurological disorders such as irritability did not appear to be related to the
duration of exposure.
Tuttle et al (1977) examined 18 dry-cleaners, with an average exposure of 7.5 years to a TWA level of
1.3 - 36.5 ppm PER (9.0 - 252 mg/m3), and 9 controls in a behavioural/neurological test battery.
Differences were reported between exposed and control workers in electrodiagnostic rating scores but
limited correlation existed between years of exposure and some behavioural variables. However, no
definite conclusions can be drawn from the data, because exposure to Stoddard's solvent (a mixture
of hydrocarbons) was a confounding factor in this study.
A cross-sectional study among dry-cleaners described symptoms of drunkenness, self-reports of
irritability and a reduced ability to concentrate. Impairments of short-term memory and of psychomotor
dexterity were also reported. Subjects were divided into 2 groups: those who were exposed to PER at
concentrations below 45 ppm and those exposed to concentrations above 45 ppm (310 mg/m3). No
clear threshold for the risk of neurobehavioral long-term effects was found (Seeber, 1989).
A group of dry-cleaners exposed to 21 ppm PER (145 mg/m3) showed no indications of effects on the
CNS when measured in a series of psychomotor tests, compared to a group of control subjects
(Lauwerys et al, 1983).
Freed and Kandel (1988) described a case of a 68-year-old man who had owned a dry-cleaning shop
for over 30 years. In 1981, he was forced to invest in new ventilation equipment (because his
operation was found to have unacceptable vapour levels). He suffered a complete loss of hair and
finger nails in 1982 and had a history of memory impairment that could have been due to progressive
dementia (Alzheimer's Disease). His serum level of PER was 745 µg/l, i.e. 15 times higher than that
of the general population (< 50 µg/l). Neuropsychological testing performed some months after the
initial medical diagnosis of probable Alzheimer's Disease failed to confirm a significant cognitive
Tetrachloroethylene 131
impairment, thus questioning the initial diagnosis. The authors concluded that the observed
symptoms might have been occupationally related.
Winneke et al (1989) studied 45 dry-cleaners, 103 people living close to dry-cleaning shops and
106 unexposed controls. Self-reports were made of drowsiness, nervousness, enhanced fatigue,
decrease in the ability to concentrate, memory disturbances and increased perspiration among the
exposed groups. Levels of PER in the blood were increased in the dry-cleaners (147 - 416 µg/l) and in
the people living close to dry-cleaning shops (average value 13 µg/l) compared to the controls
(average value 1 µg/l). The authors concluded that following exposure to approximately 50 ppm PER
(344,5 mg/m3), reversible psychomotor effects occurred in humans.
Seeber (1989) studied 101 dry-cleaners, of which 57 workers (7 males, 50 females) were exposed to
83.4 mg PER/m3 (12.1 ppm) for 141 days (average values) and 44 workers (5 males, 39 females) to
363.8 mg/m3 (52.8 ppm) for 127 days (average values). The CNS effects of PER exposure were
evaluated using a number of psychological tests. Age, gender, daily consumption of alcohol and
intellectual level was taken into consideration in this study. Statistically significant differences were
observed between the exposure groups and the controls (20 males/64 females) in perceptual speed,
digit reproduction, digit symbol, choice reaction and cancellation tests. No dose-related differences
were found between the low and the high exposure group. In 5 of the 8 categories the high exposure
group performed better than the low exposure group. Since the high exposure level was 4 times
greater than the low exposure levels, this is strongly suggestive of differences from factors other than
PER. Alcohol consumption was not found to affect the exposure-related group differences. The
statistical method (multiple t-tests) used by the author is an inappropriate method of analysis as it
inflates the overall Type I error rate. The author himself cautions the reader against "over-
interpretation" of the data. This study is an exploratory (hypothesis generating) analysis, and it should
not be considered as definitive.
Ferroni et al (1992) conducted a cross-sectional study in 60 females working in dry-cleaning shops.
The control group consisted of 30 female workers from a cleaning plant that did not use solvents.
Prolactin blood levels were measured just prior to the performance of a battery of neurobehavioral
tests (finger tapping, simple reaction times, digit symbol and shape comparison tests). Exposure
levels to PER varied from 1 to 67 ppm (median 15 ppm) (6.9 - 462; 103.4 mg/m3). The exposed
workers showed a slower response time on finger tapping and simple reaction time but no effects on
tasks that were more cognitive (digit symbol, shape comparison tasks) were observed. Prolactin
blood levels were increased in the exposed group. However, neither duration of exposure nor air or
blood levels of PER was significantly correlated to the performance or prolactin blood levels.
In a colour vision study by Cavalleri et al (1994), 22 dry-cleaners and 13 ironers from 12 dry-cleaning
shops were compared to a paired number of controls. The mean 8-h TWA level of PER for the dry-
132 ECETOC Joint Assessment of Commodity Chemicals No. 39
cleaners was 7.3 ± 8.3 ppm (range 0.4 - 31.2 ppm) (50 ± 57; 2.8 - 215 mg/m3) and 4.8 ± 3.5 ppm
(range 0.5 - 11.3 ppm) (33 ± 24; 3.4 - 78 mg/m3) for the ironers; the mean exposure period was
106 months. The authors concluded that the exposed workers had a sub-clinical colour vision loss,
mainly in the blue-yellow range, and claimed that this effect was related to exposure to PER. The
"colour confusion index" for this group was significantly increased compared to the controls. However,
no increase was observed for the group of ironers who had quite similar but low levels of exposure to
PER. This study lacks sufficient information about how subjects were actually tested. If not tested in a
random or counterbalanced order, then small but significant differences may be due to a group effect
that is independent of exposure. Many possible confounders (e.g. non double-blind study, differential
knowledge of controls and exposed subjects) could account for the difference in colour performance,
and the data from Cavalleri et al do not support the authors’ conclusion that exposure to low levels of
PER causes loss of colour vision.
The results of Cavalleri et al are also in contrast to the findings of the study by Nakatsuka et al (1992)
in which 30 men and 34 women working in the dry-cleaning industry were screened for colour vision
loss using the same test. Mean (8-h TWA) exposure levels of PER were 15 ppm (103.4 mg/m3) for
males and 11 ppm (76 mg/m3) for females. The control group consisted of 48 male and 72 female
workers from the same factories. Except for one male dry-cleaner and one male in the control group,
no colour vision loss was found.
Echevarria et al (1995) reported 4 case studies of neurobehavioral effects of PER. The 4 patients
were referred by physicians for neuropsychological evaluation for possible solvent encephalopathy. All
were interviewed and underwent a battery of neuropsychological tests, which showed deficits in
visospatial function and memory and disturbances in mood in these patients. The diagnostic criterion
used by the physicians was that PER was the major source of toxicant exposure, although no
exposure levels were available for these patients. This form of logic is error prone as the "solvents
syndrome" is non-specific and depends almost entirely on elimination of alternate causes. The
association of these effects to exposure to PER is speculative.
The same authors (Echevarria et al, 1995) reported an epidemiological evaluation of neurobehaviour
of 65 dry-cleaners. PER was analysed in breath and air in order to classify the subjects into low-,
moderate- and high-exposure groups with mean air levels of 11.2, 22.3 and 40.8 ppm (77, 153.6 and
281.1 mg/m3), respectively. The authors concluded that sub-clinical impairment on selected
performance measures occurred in workers exposed to levels below 40 ppm (275.6 mg/m3). This
study had several deficiencies including a low participation rate (only 23 of the 125 shops approached
actually participated in the study) and the lack of an unexposed control group. The methods did not
specify how to avoid bias by the subject's knowledge of exposure, the intent of the study or the
presumed level of exposure. It is likely that employees were aware of potential health issues as
occupational exposure limits had been reduced from 50 to 25 ppm (344.5 - 172 mg/m3) at the time the

Tetrachloroethylene 133
study was conducted. Partitioning the subjects into 3 exposure groups also caused an unbalanced
representation of jobs (e.g. counter clerks most often in the low-exposure group), suggesting that the
test results were confounded by occupation. There were other major differences between subjects at
different exposure levels (age, vocabulary, and years on job). The likelihood of uncorrected
differences affecting the data are made more plausible since the performance decrements (in tests for
visual reproduction, pattern recognition and pattern memory) are small and considered to be sub-
clinical. Given that confounding factors were not controlled and that the effects reported were small, it
cannot be concluded that PER was the source of group differences in performance.
Summary and Evaluation
In humans, acute and chronic exposure to PER have been shown to produce effects on the CNS that
are reversible and of a neuro-pharmacological nature. After single exposures, the threshold for these
effects is around 100 - 200 ppm (689 - 1,378 mg/m3).
There are isolated reports that suggest that chronic exposure to low levels of PER can lead to
significant effects on the CNS. However, these reports are limited and potentially confounded by other
factors. They do not establish a clear causal relation between exposure to PER and chronic damage
to the CNS.
9.3.3 Non-Occupational Studies
Moderate pre-narcotic to severe anaesthetic effects have been frequently reported in humans acutely
exposed to presumed high concentrations of PER from evaporation from clothes and fabrics following
generally improperly used self-service coin-operated dry-cleaning machines (Garnier et al, 1996)
(Section 9.1.3).
Altmann et al (1995) studied the effects on the CNS of chronic low-level exposure to PER in subjects
living (mean residential time of 10.6 years) in the neighbourhood of dry-cleaning shops.
Neurobehavioral tests were performed using a German version of the NES battery. Additionally,
pattern reversed visual-evoked potentials (VEPs) were recorded. The authors claim a statistically
significant difference between the exposed subjects and the controls for the NES test for vigilance,
simple reaction time and visual memory. The mean indoor air concentration measured in the
residences was 1.36 mg PER/m3 (0.197 ppm). There are no data are available to evaluate dose-
response relationship and it is doubtful whether the control group was adequate. Job satisfaction,
personality, hobbies, diet, unfavourable work conditions and other variables that can affect the results
of such a study had not been taken into account.

134 ECETOC Joint Assessment of Commodity Chemicals No. 39
9.4 MUTAGENICITY
Studies on lymphocytes from 10 factory workers occupationally exposed to PER for periods ranging
from 3 months to 18 years showed no significant dose-related differences from controls in numerical
or structural chromosomal aberrations, SCE rate, the proportion of M2 and M3 metaphases and
mitotic index (Ikeda et al, 1980). The study is of limited value because the workers studied were not
matched to the control group with regard to age, sex, race or social-economic status. No indication
was available of the medical histories of the subjects.
The frequency of sister chromatid exchanges (SCE) was studied in 27 men and women (both smokers
and non-smokers) exposed to PER in dry-cleaning shops and 19 men and women exposed to PER,
and also to trichloroethylene, during their manufacture. Increases in SCE were reported in males from
both groups who were smokers. No increases were reported in the non-smokers (Seiji et al, 1990).
The Task Force concluded that the effect of smoking could not be ruled out as a causative agent for
this effect
Böttger et al (1990) found a slight, but statistically significant, increase in chromosome aberrations in
peripheral lymphocytes of 7 volunteers exposed (4 h/d) to 50 ppm PER (344.5 mg/m3) for 4 days. The
frequency of these chromosome aberrations was comparable to those found in 6 volunteers before
and after exposure to 10 ppm PER (68.9 mg/m3). This study is of limited value because of the small
number of exposed people and the lack of a suitable control group. In addition, no information was
provided about age, sex, smoking or health status of the volunteers (e.g. alcohol consumption).
9.5 CARCINOGENICITY
9.5.1 Epidemiology
Estimates of the number of individuals in the USA potentially exposed to PER vary from 0.5 million
(NIOSH, 1978 as quoted in Santodonato et al, 1985) to 1.6 million (NIOSH, 1977 as quoted in Brown
and Kaplan, 1987). There are no epidemiological studies of populations in the USA exposed
exclusively to PER but studies of some relevance have been performed among workers in the dry-
cleaning and laundry industries; a single study has been performed in which PER was used in metal
cleaning. Additional studies are available from Scandinavia, in which exposure to PER (along with
solvents) occurred in the dry-cleaning and metal cleaning industries.
Studies in the Laundry and Dry-Cleaning Industry
PER was introduced into the dry-cleaning industry in the late 1930s but did not replace other synthetic
solvents, such as carbon tetrachloride, trichloroethylene and benzene (used for spot cleaning) until
early in the 1950s. Prior to 1960, petroleum derivatives were still the dominant solvents used. By
Tetrachloroethylene 135
1977, at least 73% of the dry-cleaning shops in the USA were using PER as the main solvent; a
similar figure (75%) has been estimated for 1987 (HSIA, 1989). The use of multiple and mixed
solvents for dry-cleaning makes it difficult to draw conclusions from epidemiological studies about
possible associations between exposure to any single solvent, including PER, and the incidence of
cancer. In addition, none of the studies reported have given good estimates of the extent of exposure
to PER.
Many of the epidemiology studies involve both dry-cleaning and laundry workers. The assumption
made is that laundry workers do not have regular occupational exposure to solvents. Dry-cleaning
workers are exposed to solvents of many types, including PER. Typical levels of exposure to PER are
described in Section 5.3.2 and Table 23.
Cohort Mortality Studies
Investigators at the US National Cancer Institute conducted a retrospective cohort mortality study of
members of a union of dry-cleaning workers in Missouri, United States (Blair et al, 1986, 1990). The
union had 11,062 members between 1945 and 1978, but the study was restricted to 5,790 persons
who had held membership for one year or more. After exclusion of 425 members for whom
information on race, sex, date of birth or date of entry was unavailable, analysis was restricted to 5,365
members (407 white males, 912 black males, 2,565 white females and 1,481 black females). The
members were followed-up from entry to the unions or 1 January 1948 (whichever came later) until
1 January 1979. The vital status of 88% of the cohort was achieved. No measurements were made
of the exposure of study members to PER. Instead, subjects were assigned a relative exposure score
based on the job(s) they held within the industry. Based on published data, cleaners were estimated
to have had the highest average exposures. Counter workers, pressers, sewers and maintenance
workers were estimated to have had similar levels of average exposure, which were approximately
one sixth of the average level of exposure of the cleaners. Cleaners and maintenance workers were
estimated to have had the highest peak exposure levels, which were approximately an order of
magnitude higher than those of other workers. The investigation considered that a member first
employed as a dry cleaner after 1960 would be more likely to have been exposed to PER than those
first employed before 1960. However, data were provided only for the entire cohort; SMRs were
stated to have been similar for workers first employed before 1960 and those first employed after that
date.
The SMR for all causes of death was 90 based on 1,129 deaths (compared to expected numbers
based on general US mortality rates), significantly lower than expected. However, deaths due to all
cancers were significantly elevated (SMR = 120; 95% CI 100 - 130; 294 deaths). Significant
excesses were reported for oesophageal cancer (SMR = 210; 95% CI 110 - 360; 13 deaths) and
cervical cancer (SMR = 170; 95% CI 100 - 200; 21 deaths). The excess of oesophageal cancer was
136 ECETOC Joint Assessment of Commodity Chemicals No. 39
due to raised mortality in black men (11 of 13 deaths; SMR = 350). Non-significant excesses occurred
for lung cancer (SMR = 130; 95% CI 90 - 170; 47 deaths), bladder cancer (SMR = 170; 95% CI 70 -
330; 8 deaths) and lymphosarcoma and reticulosarcoma (SMR = 170; 95% CI 70 - 340; 7 deaths).
There was no excess of cancers of the liver or the kidney.
No association between the level of exposure and mortality from all cancers, cervical cancer,
oesophageal and bladder cancer was observed. However, a significant exposure response trend for
all lymphatic and haematopoietic cancer was reported which was entirely due to an excess of such
cancers in cleaners, the highest exposed group of workers (5 observed and 1.3 expected deaths).
Analyses by duration, peak and cumulative trend did not uncover any significant trends, although the
sub-group with the highest level of cumulative exposure was reported to have an elevated death rate
from oesophageal cancer (SMR = 280), but the number of deaths in this sub-group was not reported.
SMRs of 90 and 30 were reported for the low and medium cumulative exposure categories,
respectively. Proportional mortality among the same workers was reported in a previous study (Blair
et al, 1979).
An updating of an earlier cohort mortality study in the USA (Kaplan, 1980; Brown and Kaplan, 1987)
included 1,701 dry-cleaning workers in dry-cleaning unions in four cities in California, Illinois, Michigan
and New York (Ruder et al, 1994). Employees who had worked for at least one year before 1960 at a
shop using PER as the primary solvent, and who were not known to have been exposed to carbon
tetrachloride, were eligible for inclusion. A survey in 1977-79 (Brown and Kaplan, 1987) reported
geometric mean, TWA, concentrations of 22 ppm PER (151.6 mg/m3) for operators and 3 ppm PER
(21 mg/m3) for other workers. Other solvents used for spot cleaning were not detected in the
samples. The vital status of 95% of subjects was determined as at 31 December 1990. The period of
observation started on 1 January 1940 or one year after employment in a PER shop, whichever was
later. The investigators were able to determine a sub-cohort of 625 subjects who had only worked in
dry-cleaning shops where PER was the primary solvent. The mean duration of employment in dry-
cleaning up to 31 December 1990 was 6.4 years for subjects in the PER only group and 11.4 years for
those also exposed to other solvents; the latter group had a mean duration of 6.0 years employment in
shops where PER was the primary solvent. Expected deaths were calculated using general US
mortality rates.
Deaths from all causes were slightly elevated (SMR = 101; 95% CI 94 - 109; 769 deaths) and cancer
deaths overall were in excess (SMR = 123; 95% CI 107 - 141, 209 deaths). There were significant
elevations of oesophageal cancer (SMR = 214; 95% CI 102 - 394, 10 deaths), cancers of the colon
and small intestine (SMR = 156; 95% CI 102 - 229; 26 deaths) and bladder cancer (SMR = 254;
95% CI 116 - 482; 9 deaths). Excesses of pancreatic cancer (SMR = 166; 95% CI 93 - 275;
15 deaths), lung cancer (SMR = 118; 95% CI 85 - 159, 43 deaths) and cervical cancer (SMR = 180;
95% CI 86 - 331, 10 deaths) were also reported. There were also 3 cancers of the tongue
Tetrachloroethylene 137
(SMR = 354; 95% CI 73 - 1040) and 4 kidney cancers (SMR = 146; 95% CI 116 - 482). Only one
cancer of the liver and bilary tract was reported (4.8 expected). When the analysis was restricted to
workers with a 20-year latency since first employment and a length of employment ≥ 5 years, the
SMRs were increased for cancers at all sites (SMR = 150; 95% CI 120 - 190; 83 deaths) and in
particular, for oesophageal cancer (SMR = 540; 95% CI 230 - 1100; 8 deaths) and bladder cancer
(SMR = 650; 95% CI 280 - 1320; 8 deaths). However, there was no excess of lung cancer in this
group (SMR = 91; 95% CI 50 - 160; 12 deaths). In the PER-only sub-cohort, there was only a slight
excess of all cancers (SMR = 101; 95% CI 76 - 132; 54 deaths). A non-significant excess of
oesophageal cancer (SMR = 264; 95% CI 72 - 676; 4 deaths) was reported in the PER-only sub-
cohort and all of these workers had a 20-year latency and ≥ 5 years duration (SMR = 717; 95% CI
192 -1982). It was not stated whether cervical cancer was in excess in the PER-only sub-cohort, but
an excess of cancer of the female genital organs was reported (SMR = 157; 95% CI 68 - 310;
8 deaths). There were no deaths from bladder cancer in the PER-only sub-cohort (1.0 expected
deaths) and only 1 kidney cancer death (0.9 expected deaths).
Other Laundry and Dry-cleaning Studies
Several studies of proportional mortality amongst dry cleaners have also been reported. Katz and
Jowett (1981) reported a proportional mortality study of 671 deaths of white females who had worked
at laundries and dry-cleaning shops in Wisconsin (USA) between 1963 and 1977. Nakamura (1985)
reported a proportional mortality study of 1,711 deaths between 1971 and 1980 of members of the
All-Japan Laundry and Dry-cleaning Association. Duh and Asal (1984) reported on a proportional
analysis of the causes of death of 440 laundry and dry-cleaning workers which occurred between 1975
and 1981 in Oklahoma (USA). None of these studies provides sufficient information to distinguish
between laundry workers and dry-cleaning workers. In addition, Nakamura (1985) reported that in
recent years only 30% of dry-cleaning was done using PER and Duh and Asal (1984) noted that
petroleum solvents accounted for more than 50% of the dry-cleaning solvents used in Oklahoma.
Lynge (1994) updated an earlier study (Lynge and Thygesen, 1990) of cancer incidence among
10,600 persons enumerated in the 1970 Danish population census and who were stated to be
employed in the “laundries, cleaning and dyeing” industries. Lynge (1994) reported a Standardised
Incidence Ratio (SIR) of 270 for liver cancer in women (95% CI 150 - 450; 14 cases). Three cases
were observed in men (2.5 expected). Lynge and Thygesen (1990) had earlier reported no increase in
kidney cancer incidence in this cohort of laundry and dry-cleaning workers.
A nested case-control study of the 17 cases of primary liver cancer and 16 cases of renal cell
carcinoma was later performed (Lynge et al, 1995). Five referents for each case were randomly
selected from the cohort, the cases being matched on age, gender, occupation and location at the
time of diagnosis. All 17 primary liver cancer patients and 13/16 renal cell carcinoma patients had
138 ECETOC Joint Assessment of Commodity Chemicals No. 39
worked in laundries at the time of the census, whereas only 74% and 84% of the respective referents
had worked in laundries. The relative risk of renal cell cancer was 0.7 (95% CI 0.2 - 2.6) and hence,
there was no elevated risk of liver cancer or renal cell cancer associated with work in the dry-cleaning
industry.
Laundry and dry-cleaning workers in the Swedish population at the time of the 1960 census have also
been followed up for cancer incidence (Malker and Weiner, 1984; McLaughlin et al, 1987). The results
provide little information about the possible effects of exposure to PER because it is not possible to
separate dry cleaners from laundry workers and because the level of exposure of dry cleaners to PER
is not known. However, the SIR for cancer of the liver and bilary passages cancer was reported as
120 (95% CI 70 - 180; 16 observed) by Malker and Weiner (1984) for the follow-up period 1961-73.
McLaughlin et al (1987) reported results for renal cancer for the follow-up period 1961-1979. The SIR
was 99 (95% CI 60 - 160; 18 cases) in men and 86 (95% CI 60 - 130; 25 cases) in women.
Other Cohort Studies
Anttila et al (1995) studied a cohort of 3,974 persons in Finland who were biologically monitored for
occupational exposure to three halogenated hydrocarbons (3,089 for trichloroethylene, 849 for PER
and 271 for 1,1,1-trichloroethane) during 1965-83. The cohort was followed-up for incident cancer
cases through 1992, and the expected numbers were calculated on the basis of Finnish national rates.
The median measured level of PER in blood during 1974-83 was 0.7 µmol/l in men and 0.4 µmol/l in
women. On average, 3.2 measurements/ individual were made for PER in blood. A total of 31 cancer
cases were observed in the sub-cohort exposed to PER (SIR = 90; 95% CI 61 - 130). Increased risks
were seen for cancers at some sites, but none was significant. There were 2 cases of cervical cancer
(SIR = 320; 95% CI 39 - 1160) and 3 cases of NHL (SIR = 380; 95% CI 22 - 656).
Spirtas et al (1991) analysed a cohort of 14,457 civilian employees who had worked for at least one
year at an airforce base in Utah (USA) between 1 January 1952 and 31 December 1956. The cohort
was followed until 31 December 1982 and vital status was ascertained for 97%. The study subjects
maintained and overhauled aircraft and missiles, cleaning and repairing small parts. The study was
conducted in response to concerns about adverse health symptoms reported by around 120 workers
in one building at the base and preliminary evidence of a raised proportion of deaths from neoplasms
of lymphatic and haematopoietic tissue, especially multiple myeloma. Of the 14,457 cohort members,
10,256 were classified as having been exposed to mixed solvents and 851 to PER. Mortality findings
in the sub-cohort exposed to PER were only presented for two cancer sites; multiple myeloma and
non-Hodgkin's lymphoma (NHL). These analyses showed 2 deaths from multiple myeloma in women
(0.12 expected) and 4 deaths from NHL in men and women (SMR = 315, 95% CI 86 - 609).
Olsen et al (1989) studied a cohort of 2,610 white men employed for one or more years in a chemical
company in Louisiana (USA). PER was one of many chemicals produced in the 16 production plants
Tetrachloroethylene 139
at the site. The cohort was followed-up between 1.1.56 and 1.1.81 and vital status was ascertained
for 98.9% of the cohort. All cause mortality was significantly reduced (SMR = 56; 95% CI 42 - 75;
48 deaths) and overall cancer mortality was also reduced (SMR = 76; 95% CI 38 - 140; 11 deaths),
both in comparison with local rates. There was a significant increase in mortality from leukaemia and
aleukaemia (3 observed, 0.61 expected), but these were all of different types and occurred in men
with different employment histories. No information was provided about the proportion of employees
that had been exposed to PER or their levels of exposure.
Case-Control Studies
Liver and Biliary Tract Cancer
Hardell et al (1984) conducted a study of 98 patients with liver cancer and 200 matched controls from
the Umea region of Sweden. One patient reported exposure to PER. Bond et al (1990) conducted a
case-control study nested in a cohort of 21,347 workers employed at chemical plants in Michigan
(USA). The cases consisted of 44 men who had died between 1940 and 1982 and whose death
certificates mentioned liver or bilary duct cancer. A total of 6,259 men in the cohort had died between
1940 and 1982. A random sample of 1,888 men was selected as controls and employment records
searched for potential exposure to PER and 10 other chemicals. Six of the liver and bilary duct cancer
cases were exposed to PER giving an odds ratio of 1.8 (95% CI 0.8 - 4.3).
Lymphoma
Hardell et al (1981) studied 169 patients with malignant lymphoma and 338 controls in the Umea
region of Sweden. One patient reported exposure to PER.
Brain Cancer
Heineman et al (1994) reported findings from a case-control study of 300 white men who had died
from astrocytic brain tumours and a matched group of 320 deceased controls. Heineman et al (1994)
originally undertook to study 741 white men who had died from astrocytic brain tumours, but it was
only possible to obtain interviews from the next of kin of these cases and a hospital diagnosis of
astrocytic brain cancer could only be confirmed for 300 of these. Exposure to 6 solvents was
assessed on the basis of a job exposure matrix. A total of 111 of the 300 astrocytic brain tumour
cases had job titles that were compatible with exposure to PER (odds ratio = 1.2; 95% CI 0.8 - 16).
Multiple Sites
Siematycki (1991) studied men aged 33 - 70 years in Montreal (Canada) during 1979-85. A total of
3,730 men with cancer at 21 sites and 533 population controls were interviewed about their

140 ECETOC Joint Assessment of Commodity Chemicals No. 39
occupations and their exposure to 293 agents and mixtures assessed. The estimated prevalence of
exposure to PER was approximately 1%. Only the odds ratio for prostatic cancer was significantly
elevated for substantial exposure to PER (odds ratio = 3.2; 95% CI 1.1 - 9.3; 8 cases).
Ill-Defined Exposure
A case-control study of renal cell carcinoma patients evaluated exposure to degreasing solvents, the
most common of which were reported to be PER, 1,1,1-trichloroethane, trichloroethylene and
methylene chloride. In addition, dry-cleaning has been evaluated for possible associations with
several types of cancer in case-control studies. The studies addressed cancers of the colon
(Frederiksson et al, 1989), liver (Suarez et al, 1989), lung (Brownson et al, 1993), kidney (Asal et al,
1988; McCredie and Stewart, 1993) and bladder (Schoenberg et al, 1984). However, these studies
provide inadequate information about the exposure to PER and are not discussed further.
Studies of Drinking Water
Several studies have been conducted of cancer occurrence in populations exposed to drinking water
contaminated by PER (Isacson et al, 1985; Lagakos et al, 1986; Vartainen et al, 1993; Cohn et al,
1994). These studies are difficult to interpret because of a number of methodological problems, in
particular, co-exposure to trichloroethylene and other compounds (IARC, 1995). However, none of
these studies reported any elevations of cancer incidence that could be related to PER exposure.
Aschengrau et al (1993) studied residents of 5 towns in Massachusetts where PER from the lining of
distribution pipes had contaminated the drinking water. Results were presented for study groups
consisting of 61 people with cancer of the urinary bladder and 852 controls, 35 people with kidney
cancer and 777 controls and 34 people with leukaemia and 737 controls. Six other types of cancer
were studied but not reported. Results were presented only for “high” exposure defined as exposure
to PER at or above the 90th percentile. None of the kidney cancer cases had “high” exposure to PER
but odds ratios of 4.0 (95% CI 0.65 - 25; 4 cases) and 8.3 (95% CI 1.5 - 45; 2 cases) were reported
for urinary bladder cancer and leukaemia, respectively, in people with “high” exposure to PER.
9.5.2 Summary
Three cohort studies provide the most relevant data for assessing the relationship between exposure
to PER and cancer risk (Blair et al, 1990; Ruder et al, 1994; Anttila et al, 1995). All three studies
contain a sub-cohort whose exposure was principally to PER and all contain some information about
exposure to PER. However, Blair et al provided no detailed findings for the post-1960 sub-cohort who
would have been predominantly exposed to PER. The limitations of only these three studies will be
discussed in detail.
Tetrachloroethylene 141
Exposure assessment is the main weakness of the three cohort studies which provided the most
relevant epidemiological data (Blair et al, 1990; Ruder et al, 1994; Anttila et al, 1995). In the study
reported by Ruder et al (1994), the only information about the exposure of the cohort to PER is
provided by a 1977-1979 survey of a random sample of facilities (still in business). No attempt was
made to calculate measures of exposure for individual workers. Blair et al (1990) estimated qualitative
indices of solvent exposure based on other published data. For the post 1960 sub-cohort, the solvent
exposure indices provide a primary estimate of exposure to PER. The cohort studied by Anttila is the
only group of workers for which individual measurements were available for all cohort members.
However, only one blood-PER sample was analysed for 61% of the workers and fewer than 3 samples
for 79% of the workers. In addition, it is not known when these workers were first exposed to PER,
how long they were exposed and in what circumstances. Some of the sub-cohort of workers
monitored for blood-PER will also have been exposed to other halogenated hydrocarbons as
approximately 5.6% of the study population were monitored for at least two solvents. The authors
noted that the biological monitoring data did not allow a reliable internal comparison within the cohort.
Other than factors such as gender, race and calendar year of follow-up, none of the investigators
collected data on determinants of mortality for the various cancers of interest. Of greatest concern is
the possibility that dry cleaners and the general US and Finnish populations differ with respect to risk
factors for the incidence of one or more types of cancer (i.e. the possibility of confounding). Blair et al
(1990) note that there is evidence that dry cleaners may smoke more than members of other
occupations and may also consume more alcohol; alcohol use often parallels tobacco use.
A further limitation of these studies is their low power to detect changes in cancer incidence for
specified cancer sites. It is not known how many dry-cleaning workers in the cohort studied by Blair et
al (1990) started work after 1960, when PER was the predominant exposure. However, it is probable
that less than 50% started work after 1960, since the mean entry date for the whole cohort was 1956.
Thus, the 3 cohorts which contain sub-cohorts of workers who were predominantly exposed to PER
(Anttila et al, 1995; Ruder et al, 1994; Blair et al, 1990) probably contain fewer than 4,000 workers.
Less than 1,000 of these have been monitored for cancer incidence.
In two other cohort studies, exposure was to other chemicals as well as to PER (Olsen et al, 1989;
Spirtas et al, 1991). One of these studies (Spirtas et al, 1991) was conducted because of concerns
about a proportionate excess of deaths from cancer from the lymphatic and haematopoietic tissue,
especially multiple myeloma. Spirtas et al (1991) only reported findings for multiple myeloma and NHL
in the sub-cohort with exposure to PER; limited weight should be attached to the findings given the a
priori concerns. Olsen et al (1989), provided no information about the proportion of workers exposed
to PER and their level of exposure.
142 ECETOC Joint Assessment of Commodity Chemicals No. 39
The incidence of cancer in two cohorts of dry-cleaning and laundry workers derived from census
records has been studied (Malker and Weiner, 1984; Lynge, 1994; McLaughlin et al, 1997). These do
not allow any evaluation of the carcinogenic risk because it is not possible to distinguish those who
worked in dry-cleaning from those who worked in laundries. A nested case-control study of liver and
renal cancer was conducted in one of these cohorts (Lynge et al, 1995), and this study provides some
information about risks associated with dry-cleaning work. The proportional mortality studies of
workers engaged in dry-cleaning work also provide little information about the carcinogenic risk of
PER exposure because of a lack of information about PER exposure and the high proportion of
workers exposed to other solvents.
A number of case-control studies have been conducted which have evaluated exposure to PER (as
opposed to dry-cleaning work). The major limitation of the case-control studies is the lack of
information provided about the exposure of cases. The limitations of the drinking water studies have
been well described by IARC (1995).
9.5.3 Evaluation
Table 49 summarises the data from the three most relevant studies (Blair et al, 1990; Ruder et al,
1994; Anttila et al, 1995). In the case of the study by Ruder et al (1994), separate results are given for
the sub-cohorts who either only been employed in dry cleaning shops where PER was the primary
solvent (PER-only) or had worked in both PER and other solvent shops (PER-plus).
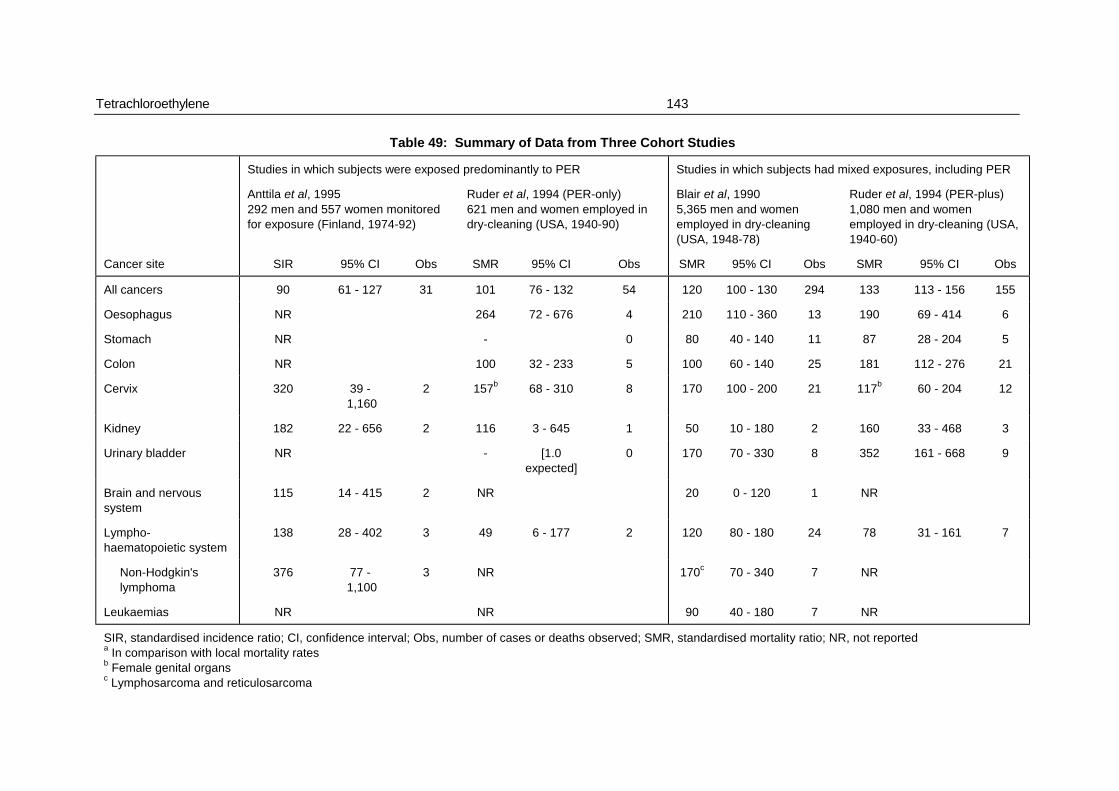
Tetrachloroethylene 143
Table 49: Summary of Data from Three Cohort Studies
Studies in which subjects were exposed predominantly to PER Studies in which subjects had mixed exposures, including PER
Anttila et al, 1995292 men and 557 women monitoredfor exposure (Finland, 1974-92)
Ruder et al, 1994 (PER-only)621 men and women employed indry-cleaning (USA, 1940-90)
Blair et al, 19905,365 men and womenemployed in dry-cleaning(USA, 1948-78)
Ruder et al, 1994 (PER-plus)1,080 men and womenemployed in dry-cleaning (USA,1940-60)
Cancer site SIR 95% CI Obs SMR 95% CI Obs SMR 95% CI Obs SMR 95% CI Obs
All cancers 90 61 - 127 31 101 76 - 132 54 120 100 - 130 294 133 113 - 156 155
Oesophagus NR 264 72 - 676 4 210 110 - 360 13 190 69 - 414 6
Stomach NR - 0 80 40 - 140 11 87 28 - 204 5
Colon NR 100 32 - 233 5 100 60 - 140 25 181 112 - 276 21
Cervix 320 39 - 1,160
2 157b 68 - 310 8 170 100 - 200 21 117b 60 - 204 12
Kidney 182 22 - 656 2 116 3 - 645 1 50 10 - 180 2 160 33 - 468 3
Urinary bladder NR - [1.0expected]
0 170 70 - 330 8 352 161 - 668 9
Brain and nervoussystem
115 14 - 415 2 NR 20 0 - 120 1 NR
Lympho-haematopoietic system
138 28 - 402 3 49 6 - 177 2 120 80 - 180 24 78 31 - 161 7
Non-Hodgkin's lymphoma
376 77 - 1,100
3 NR 170c 70 - 340 7 NR
Leukaemias NR NR 90 40 - 180 7 NR
SIR, standardised incidence ratio; CI, confidence interval; Obs, number of cases or deaths observed; SMR, standardised mortality ratio; NR, not reporteda In comparison with local mortality ratesb Female genital organsc Lymphosarcoma and reticulosarcoma
144 ECETOC Joint Assessment of Commodity Chemicals No. 39
In the two cohorts of dry cleaners (Blair et al, 1990; Ruder et al, 1994), mortality from oesophageal
cancer was elevated by approximately a factor of two. In the former study, the excess of oesophageal
cancer was restricted to black male workers (8 observed, 2.9 expected). Only 1 death (0.7 expected)
was observed in a worker with high exposure; a further 3 oesophageal cancer deaths occurred in
workers whose exposure was unknown. Ruder et al (1994) reported that the magnitude of the risk
increased in workers in the PER-only sub-cohort who had more than 20 latency-years and at least
5 years of employment in PER shops (SMR = 717, 95% CI 192-1982; 4 deaths). Ruder et al (1994)
did not report results for males in the PER-only sub-cohort. However, the excess of oesophageal
cancer in males in the full cohort was smaller (5 observed, 3.1 expected) than the excess in females
(5 observed,1.5 expected), although the authors noted that their exposures would have been expected
to have been higher. Anttila et al (1995) did not report the incidence of oesophageal cancer in the
sub-cohort monitored for PER, but in the whole cohort there was only one case of oesophageal cancer
(2.4 expected) and this case occurred within 10 years of the first biomonitoring test result.
The potential for confounding is particularly great when studying oesophageal cancer given the very
strong associations between this disease and the combination of cigarette smoking and alcohol
consumption. There is evidence that in the USA, cigarette smoking is more common in dry cleaners
than other occupational groups (Sterling and Weinkam, 1976; Walrath et al, 1985). The increased
levels of lung cancer and emphysema reported by Blair et al (1990) support this view, but there was no
increased risk of lung cancer in long term workers in the cohort studied by Ruder et al (1994).
Furthermore, there was no evidence of an increased mortality risk from cirrhosis of the liver, although
there is evidence that the level of alcohol consumption needed to increase the risk of oesophageal
cancer, is well below that required for cirrhosis (Pottern et al, 1981; Yu et al, 1988). Nevertheless, the
unusual pattern of findings in the three studies, the lack of biological plausibility and the potential for
confounding, all suggest that there is insufficient evidence to establish a causative link between PER
exposure and oesophageal cancer.
Excesses of cervical cancer were reported by all three of the most informative studies (Blair et al,
1990; Ruder et al, 1994; Anttila et al, 1995). However, the largest excess reported by Blair et al (1990)
was found in the group of counter workers at pick-up stations who had little or no exposure
(SMR = 210; 7 observed). The SMR for workers with medium and high exposure was 133 (11
observed) and was not statistically significant. Blair et al (1990) noted that these data suggest that
socio-economic factors and non-occupational factors may be involved. In the cohort of dry cleaners
studied by Ruder et al (1994), there was a non-significant excess of cervical cancer. However, there
was no obvious relationship between the risk of cervical cancer and time since first employment in a
PER shop and duration of work in a PER shop. There was insufficient exposure data to examine the
dose-response relationship. Overall, there was little indication that the excess of cervical cancers
reported by Ruder et al (1994) was related to PER exposure. A small excess of cervical cancers was
Tetrachloroethylene 145
also seen in the small group of PER exposed workers studied by Anttila (1995) (2 observed, 0.63
expected). No other information is presented about these 2 cases of cervical cancer.
Anttila et al (1995) reported an excess of NHL in the sub-cohort of workers monitored for PER in blood
(3 observed, 0.80 expected); these were the only cases of cancer of the lympho-haematopoietic
tissues (2.2 expected). Blair et al (1990) did not provide results for NHL as a cause of death, but
reported a non-significant excess of deaths due to lymphosarcoma and reticulosarcoma (7 observed,
4.2 expected). However, there was a deficit of deaths in the category of other lymphatic causes which
includes other lymphomas categorised as NHL, as well as multiple myeloma (4 observed, 5.8
expected). There was no excess of deaths due to lymphosarcoma and reticulosarcoma in the cohort
studied by Ruder et al (1994) and no excess of deaths due to other lymphatic/haematopoietic cancers.
Thus, the two studies of cohorts of dry cleaners provide little support for the finding by Anttila et al
(1995) of an increased risk of NHL. An excess of NHL was also reported in the cohort studied by
Spirtas et al (1991) (4 observed, 1.3 expected) but this finding carries less weight because of the a
priori reasons for studying this group of aircraft maintenance workers.
Bladder cancer deaths were elevated in the two cohorts of dry cleaners, but neither excess appeared
to be related to PER exposure. As in the case of cervical cancer, Blair et al (1990) reported the
largest excess in the group of workers with little or no exposure to PER (3 observed, 1.1 expected). In
workers with medium or high exposure, there were 5 cases (3.4 expected). Overall, the excess was
not statistically significant in this cohort. Ruder et al (1994) reported a significant excess of bladder
cancer deaths (9 observed, 3.5 expected) but all 9 deaths were in workers in the PER-plus group, i.e.
workers who had worked in dry-cleaning shops where the predominant solvent was not PER. In the
PER-only group, there were no bladder cancer deaths (1.0 expected). No cases of bladder cancer
were listed by Anttila et al (1995) in the workers monitored for blood-PER. There was no excess of
bladder cancers in the full cohort of workers exposed to halogenated hydrocarbons studied by Anttila
et al (1995) (5 observed, 6.9 expected).
Mortality from primary tumours of the liver, the tumour most clearly related to PER in mice, was lower
than expected in both dry-cleaning cohorts (e.g. SMR 68, 95% CI 20 - 170, Blair et al 1990). Ruder et
al (1994) reported only one death due to cancer of the liver and bile ducts (4.76 expected) and Blair et
al (1990) reported 5 deaths versus 7.3 expected. No cases were reported by Anttila et al (1995) in
workers monitored for PER in blood. As noted earlier, the excess of liver cancers in the group of
laundry and dry-cleaning workers studied by Lynge (1994) has since been demonstrated to have no
relationship with dry-cleaning work (Lynge et al, 1995). The suggestive findings for kidney tumours in
some strains of rat are given little support by the epidemiology data. Anttila et al (1995) reported a
small excess of kidney tumours in workers monitored for blood-PER (2 observed, 1.1 expected).
There was a small excess of deaths due to kidney cancer in the cohort of dry cleaners studied by
146 ECETOC Joint Assessment of Commodity Chemicals No. 39
Ruder et al (1994) (4 observed, 2.74 expected), but the excess was confined to the PER-plus group
(with mixed exposure).
The excess of mononuclear cell leukaemia in the F344 rat is considered to be of no significance for
humans (Section 8.6.6). Although there were some small excesses of some sub-types of lympho-
haematopoietic cancer in particular studies, there was no consistency between studies.
Overall, the epidemiological studies of greatest relevance are insufficient in both their design and
outcome to demonstrate a relationship between exposure to PER and the occurrence of cancer in
humans.
9.6 REPRODUCTIVE TOXICITY
A review of possible mechanisms by which PER might influence reproduction has been published
(Van der Gulden and Zielhuis, 1989).
9.6.1 Fertility
An overview of the data related to fertility is on Table 50.
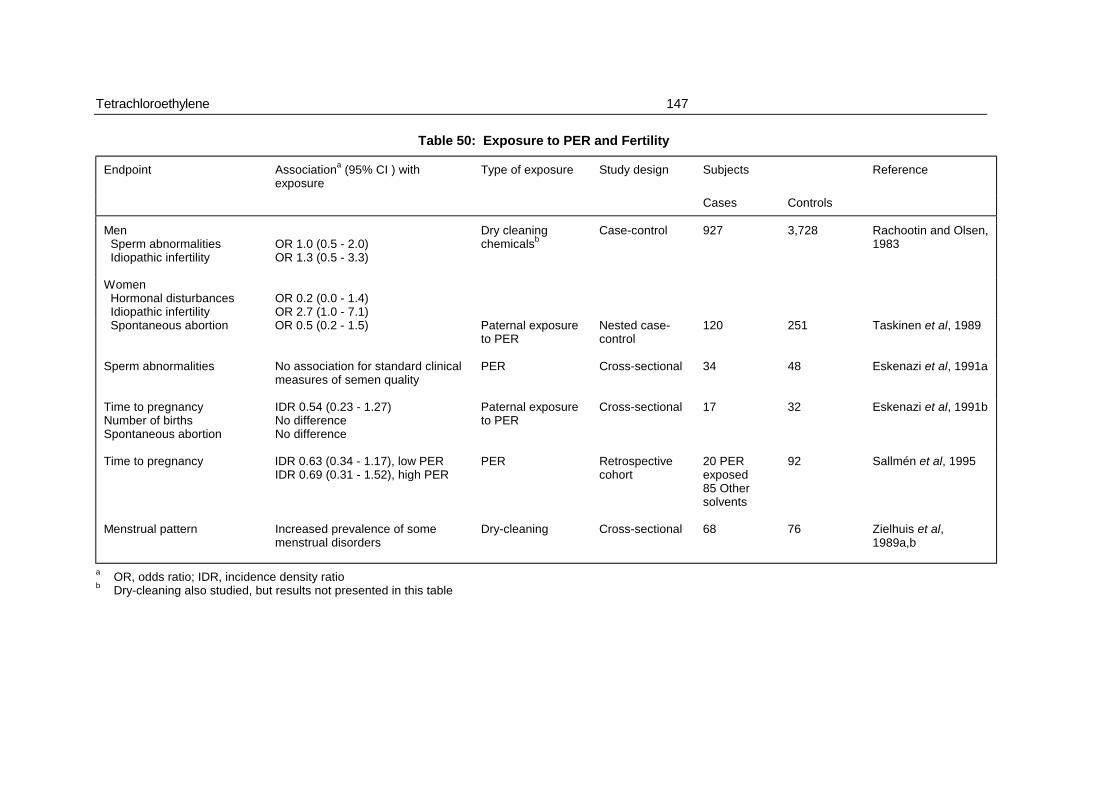
Tetrachloroethylene 147
Table 50: Exposure to PER and Fertility
Endpoint Associationa (95% CI ) withexposure
Type of exposure Study design Subjects Reference
Cases Controls
Men Sperm abnormalities Idiopathic infertility
OR 1.0 (0.5 - 2.0)OR 1.3 (0.5 - 3.3)
Dry cleaningchemicalsb
Case-control 927 3,728 Rachootin and Olsen,1983
Women Hormonal disturbances Idiopathic infertility
OR 0.2 (0.0 - 1.4)OR 2.7 (1.0 - 7.1)
Spontaneous abortion OR 0.5 (0.2 - 1.5) Paternal exposureto PER
Nested case-control
120 251 Taskinen et al, 1989
Sperm abnormalities No association for standard clinicalmeasures of semen quality
PER Cross-sectional 34 48 Eskenazi et al, 1991a
Time to pregnancyNumber of birthsSpontaneous abortion
IDR 0.54 (0.23 - 1.27)No differenceNo difference
Paternal exposureto PER
Cross-sectional 17 32 Eskenazi et al, 1991b
Time to pregnancy IDR 0.63 (0.34 - 1.17), low PERIDR 0.69 (0.31 - 1.52), high PER
PER Retrospectivecohort
20 PERexposed85 Othersolvents
92 Sallmén et al, 1995
Menstrual pattern Increased prevalence of somemenstrual disorders
Dry-cleaning Cross-sectional 68 76 Zielhuis et al,1989a,b
a OR, odds ratio; IDR, incidence density ratiob Dry-cleaning also studied, but results not presented in this table
148 ECETOC Joint Assessment of Commodity Chemicals No. 39
Rachootin and Olsen (1983) conducted a case-control study in Denmark based on data collected from
927 infertile case couples and 3,728 fertile control couples using a self-administered questionnaire.
The two main sub-groups of infertile couples included couples with a male diagnosis of sperm
abnormalities or a female diagnosis of hormonal disturbances. These two groups were not mutually
exclusive. In addition, the investigations focused on a further sub-group of couples with idiopathic
infertility. The infertile couples were examined or treated for a problem of infertility at a hospital in
Odense, Denmark between 1977 and 1980; the control group consisted of couples who had a healthy
child born at the same hospital between 1977 and 1979. A further series of analyses were performed
for control couples in order to investigate effects on delayed conception. The exposures of 436 of the
control couples who gave birth to a healthy child after experiencing a delay in conception of over a
year were compared with those of couples who had conceived a healthy child within a year. Exposure
to dry-cleaning chemicals and work in a dry-cleaning shop were investigated, but not exposure to PER
specifically.
Information was obtained from 927 case and 3,728 control couples; associations of sub-fecundity with
chemical exposures were assessed in a sub-group of couples who were infertile for at least a year and
who resided in the catchment area of the hospital. Females reporting exposure to dry-cleaning
chemicals experienced a statistically significant increased risk of idiopathic infertility (after adjustment
for confounding factors). There was no corresponding increased risk of idiopathic infertility in males
exposed to dry-cleaning chemicals. Sperm abnormalities, hormonal disturbances and delayed
conception were also not associated with exposure to dry-cleaning chemicals. Occupational analyses
demonstrated associations in female workers between work in a dry-cleaning shop in the year prior to
hospital admission and the prevalence of hormonal disturbances and delayed conception. In males,
the prevalence of sperm abnormalities was raised in those whose longest held occupation was in a
dry-cleaning shop.
These findings were based on small numbers of exposed cases and controls while the authors
examined a large number of occupations and chemical exposures. No details were given about the
dry-cleaning chemicals to which subjects were exposed or the type of work performed in dry-cleaning
shops.
Taskinen et al (1989) conducted a case-control study nested in a cohort monitored biologically for
exposure to 6 solvents (PER, trichloroethylene, 1,1,1-trichlorethane, styrene, toluene and xylene). The
study was conducted in order to investigate the effect of paternal exposure on pregnancy outcome.
Wives with a spontaneous abortion were defined as cases (120) and women who did not have a
spontaneous abortion or congenitally malformed child during the study period, 1973-1983, were
eligible as controls (251). The father's exposure was assessed during the period of spermatogenesis
preceding the study pregnancy. No association was found between paternal exposure to PER and
spontaneous abortion (OR 0.5; 95% CI 0.2 - 1.5). However, paternal exposure to PER was only

Tetrachloroethylene 149
present in 4 cases and 17 controls and confounders were not controlled for in this analysis. Odds
ratios adjusted for potential confounders (including maternal factors) were calculated for different
levels of exposure to halogenated hydrocarbons but these showed no evidence of an exposure effect.
One small study has investigated the influence of PER on the menstrual cycle (Zielhuis et al, 1989a,b).
A self-administered questionnaire was used to obtain information on the menstrual disorders in dry-
cleaners and laundry workers. Only women who did not use contraceptive pills were eligible for
inclusion and the authors compared 68 female dry-cleaning workers, with 76 female workers in
laundries. Mean cycle lengths in the two groups were similar and the women were able to predict their
menstrual cycle with equal accuracy. Significantly increased risks of dysmenorrhea, unusual cycle
lengths, menorrhagia and pre-menstrual syndrome were reported in dry-cleaning workers. The
authors concluded that these findings did not have any real practical consequences because of the
small size of the study and the lack of exposure data. They also concluded that these findings support
the hypothesis that PER may affect the hormone system, but no information was collected about the
exposure to PER of dry-cleaning workers.
Eskenazi et al (1991a) examined the association of semen quality with expired air levels of PER as an
index of exposure in 34 workers exposed to PER (dry-cleaners and laundry workers who performed
dry-cleaning work) and 48 laundry workers who were unexposed to PER. On average the dry-cleaning
workers as well as the laundry workers had semen which was within normal limits. The average
number of spermatozoa did not differ, but in both groups 25% of the men were oligospermic
(< 20 million sperm/cc). The average of motile sperm for both groups was barely within normal limits.
A slightly larger proportion of dry-cleaners (44%) than of laundry workers (31%) had less than 60%
motile sperm. The difference was not statistically significant. However, more laundry workers (63%)
than dry cleaners (50%) had greater than 40% abnormally shaped sperm. This difference was also
not statistically significant. No significant associations were found between any of the three measures
of exposure and the standard clinical measures of semen quality, but PER exposed men were more
likely to produce sperm with a tendency to swim with greater amplitude of lateral head displacement.
Eskenazi et al (1991b) reported on a study of the pregnancy outcomes of the female partners of the
dry-cleaning workers and laundry workers who participated in the study of semen quality described
above (Eskenazi et al, 1991a). Twenty of the dry-cleaning workers exposed to PER and 36
unexposed laundry workers had female partners with whom they currently lived. Telephone interviews
were conducted with 17 partners of dry-cleaning workers and 32 partners of unexposed laundry
workers. The investigation compared fertility ratios, rates of spontaneous abortion and time to
pregnancy. An analysis of births showed that the wives of dry-cleaning workers and laundry workers
had higher fertility rates when compared to expected numbers of births calculated using birth
probabilities specific to race, birth cohort, parity and age. Dry-cleaning workers had slightly higher
standardised fertility ratios than laundry workers. Rates of spontaneous abortion during the years that
150 ECETOC Joint Assessment of Commodity Chemicals No. 39
their partners worked in the industry were not significantly different, although they were highest in the
wives of laundry workers. The relative likelihood of women in different exposure categories achieving
clinical pregnancy during a menstrual cycle was expressed as an incidence density ratio (IDR). Wives
of dry-cleaning workers had a pregnancy rate per cycle that was approximately half that of wives of
laundry workers, although this difference was not statistically significant. (IDR 0.54; 95% CI 0.23-
1.27). However, analyses containing measures of the PER exposure of the male partner
demonstrated little evidence of a PER exposure effect.
Sallmén et al (1995) performed a retrospective time to pregnancy study among women biologically
monitored for exposure to 6 organic solvents (PER, trichloroethylene, 1,1,1-trichlorethane, styrene,
toluene and xylene) at the Finnish Institute of Occupational Health during 1965-83. The study subjects
were participants in case-control studies of spontaneous abortion and malformations reported by
Lindbohm et al (1990). The same pregnancy for each woman as in the spontaneous abortion study
described above (Taskinen et al, 1989) was selected for the fertility study; a registered spontaneous
abortion for the cases and a birth for the controls. Additionally, 30 controls from the malformation
study of Kyyrönen et al (1989) (Section 9.6.3) were included. Out of 335 eligible women, 235 replied
and this number was reduced to 197 after application of exclusion criteria. The number of menstrual
cycles that women required before becoming pregnant was used as a measure of fertility. Time to
pregnancy data were collected 8-18 years after the pregnancies. The women were classified into
exposure categories on the basis of work description and the use of solvents as reported in
questionnaires and indicated by biological exposure measurements. Menstrual cycle-specific
exposure assessments were used in analyses that were adjusted for a range of potential confounding
factors.
More than half of the subjects (105) were exposed to organic solvents during their time to pregnancy
and nearly a quarter (46) were highly exposed, which was defined as handling solvents daily or
1-4 d/wk, supported by evidence of clear occupational exposure. Exposure to organic solvents was
significantly associated with decreased fecundity after adjustment for potential confounders (IDR 0.41;
95% CI 0.27 - 0.62 and IDR 0.69; 95% CI 0.48 - 0.99 for high and low exposure, respectively).
Compared to subjects not exposed to solvents, decreased fecundity was also observed for the
7 women with high exposure to PER and the 13 women with low exposure to PER, although this was
not statistically significant (IDR 0.69; 95% CI 0.31 - 1.52 and IDR 0.63; 95% CI 0.34 - 1.17 for high
and low exposure to PER, respectively). Ten of the 20 women exposed to PER worked in dry-
cleaning shops.
9.6.2 Pregnancy
The Finnish Hospital Discharge Register (FHDR) has been used in a series of studies to identify cases
of spontaneous abortion and healthy births and to link these to other databases containing surrogate

Tetrachloroethylene 151
information relating to exposure to PER (Hemminki et al, 1980, 1984; Lindbohm et al, 1984, 1990;
Kyyrönen et al, 1989). The studies are difficult to interpret because there is considerable overlap
between the cases in the different studies. An overview is presented in Table 51
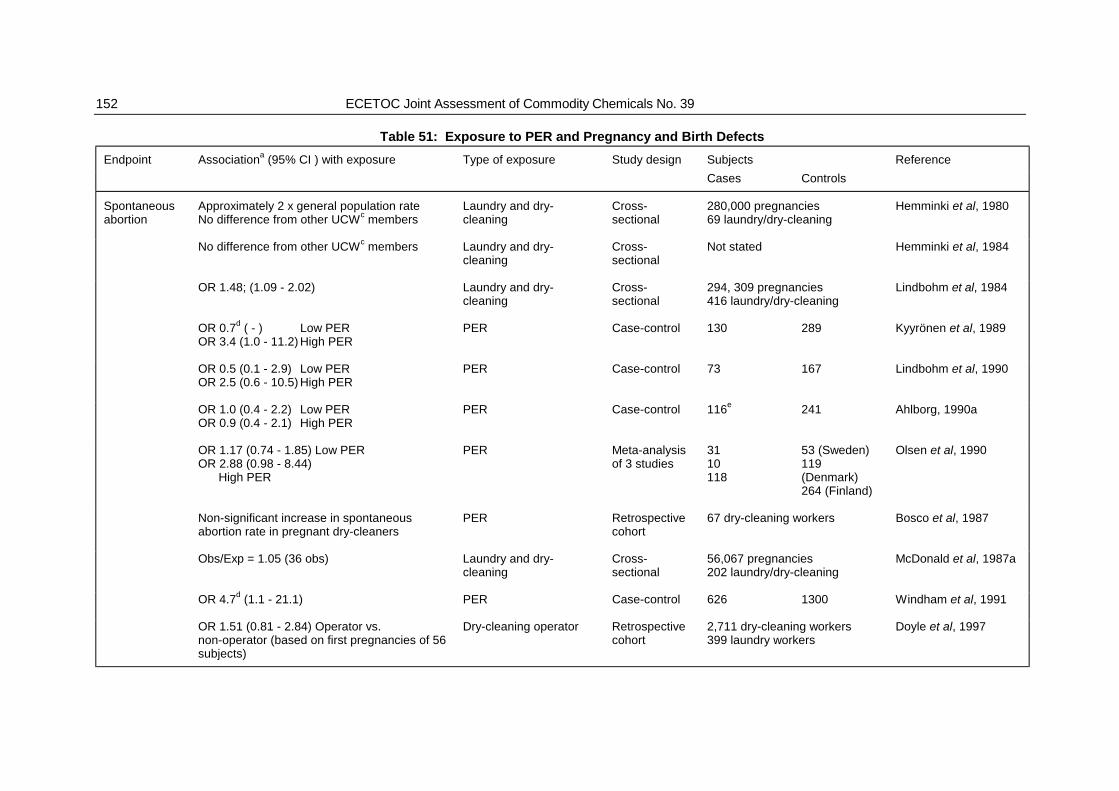
152 ECETOC Joint Assessment of Commodity Chemicals No. 39
Table 51: Exposure to PER and Pregnancy and Birth Defects
Endpoint Associationa (95% CI ) with exposure Type of exposure Study design Subjects Reference
Cases Controls
Spontaneousabortion
Approximately 2 x general population rateNo difference from other UCWc members
Laundry and dry-cleaning
Cross-sectional
280,000 pregnancies69 laundry/dry-cleaning
Hemminki et al, 1980
No difference from other UCWc members Laundry and dry-cleaning
Cross-sectional
Not stated Hemminki et al, 1984
OR 1.48; (1.09 - 2.02) Laundry and dry-cleaning
Cross-sectional
294, 309 pregnancies416 laundry/dry-cleaning
Lindbohm et al, 1984
OR 0.7d ( - ) Low PEROR 3.4 (1.0 - 11.2) High PER
PER Case-control 130 289 Kyyrönen et al, 1989
OR 0.5 (0.1 - 2.9) Low PEROR 2.5 (0.6 - 10.5) High PER
PER Case-control 73 167 Lindbohm et al, 1990
OR 1.0 (0.4 - 2.2) Low PEROR 0.9 (0.4 - 2.1) High PER
PER Case-control 116e 241 Ahlborg, 1990a
OR 1.17 (0.74 - 1.85) Low PEROR 2.88 (0.98 - 8.44)
High PER
PER Meta-analysisof 3 studies
3110118
53 (Sweden)119(Denmark)264 (Finland)
Olsen et al, 1990
Non-significant increase in spontaneousabortion rate in pregnant dry-cleaners
PER Retrospectivecohort
67 dry-cleaning workers Bosco et al, 1987
Obs/Exp = 1.05 (36 obs) Laundry and dry-cleaning
Cross-sectional
56,067 pregnancies202 laundry/dry-cleaning
McDonald et al, 1987a
OR 4.7d (1.1 - 21.1) PER Case-control 626 1300 Windham et al, 1991
OR 1.51 (0.81 - 2.84) Operator vs.non-operator (based on first pregnancies of 56subjects)
Dry-cleaning operator Retrospectivecohort
2,711 dry-cleaning workers399 laundry workers
Doyle et al, 1997
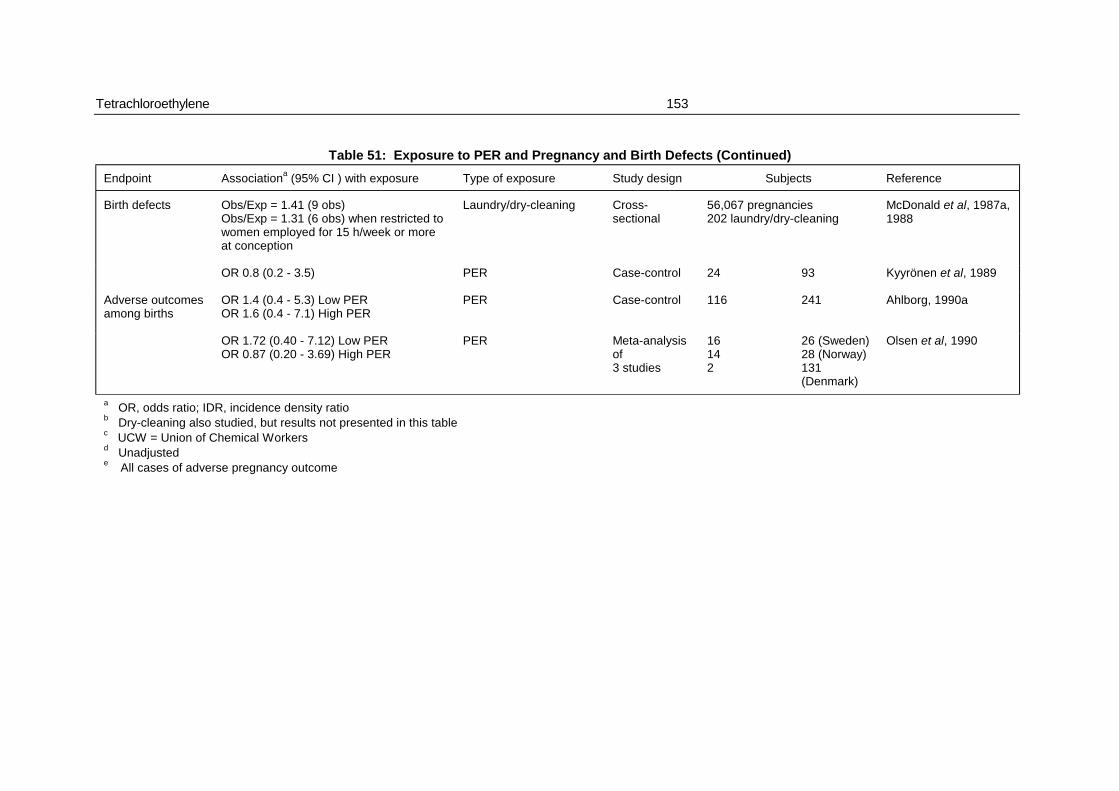
Tetrachloroethylene 153
Table 51: Exposure to PER and Pregnancy and Birth Defects (Continued)
Endpoint Associationa (95% CI ) with exposure Type of exposure Study design Subjects Reference
Birth defects Obs/Exp = 1.41 (9 obs)Obs/Exp = 1.31 (6 obs) when restricted towomen employed for 15 h/week or moreat conception
Laundry/dry-cleaning Cross-sectional
56,067 pregnancies202 laundry/dry-cleaning
McDonald et al, 1987a,1988
OR 0.8 (0.2 - 3.5) PER Case-control 24 93 Kyyrönen et al, 1989
Adverse outcomesamong births
OR 1.4 (0.4 - 5.3) Low PEROR 1.6 (0.4 - 7.1) High PER
PER Case-control 116 241 Ahlborg, 1990a
OR 1.72 (0.40 - 7.12) Low PEROR 0.87 (0.20 - 3.69) High PER
PER Meta-analysisof3 studies
16142
26 (Sweden)28 (Norway)131(Denmark)
Olsen et al, 1990
a OR, odds ratio; IDR, incidence density ratiob Dry-cleaning also studied, but results not presented in this tablec UCW = Union of Chemical Workersd Unadjustede All cases of adverse pregnancy outcome
154 ECETOC Joint Assessment of Commodity Chemicals No. 39
Hemminki et al (1980) reported an increased rate of spontaneous abortions between 1973 and 1976
in female laundry workers (including dry-cleaning workers) compared to the general population. The
FHDR was linked to the files of the Union of Chemical Workers, which provided occupational
information. However, there was no increase in the spontaneous abortion rate when compared with
that of all female members of the Finnish Union of Chemical Workers. Hemminki et al (1984)
extended the period of observation up to 1979 and reported a slightly lower rate of spontaneous
abortion in laundry and dry cleaning workers than in other Union members.
Lindbohm et al (1984) also studied births and spontaneous abortions during the same time period
(1973-6) using the FHDR. The final study material comprised 294,309 pregnancies. Information on
the occupation of women and their husbands and a number of other details was collected from the
1975 national population and housing census. After occupations with less than 30 pregnancies were
excluded, a total of 64 female and 80 male occupations were analysed. The relative risk of
spontaneous abortion for laundry work (including dry cleaning work) was statistically significant
(OR 1.48; 95% CI 1.09 - 2.02) based on 416 pregnancies in laundry workers. Adjustment was made
for age, place of residence and number of children. No information was available on other
confounding factors such as smoking, alcohol, prior abortions, medication or maternal illness. It is not
clear what proportion of the workers described as laundry workers in this study and the two earlier
studies (Hemminki et al, 1980, 1984) were dry-cleaning workers, and no conclusion can be drawn
from these studies about pregnancy outcome and exposure to PER.
Kyyrönen et al (1989) identified a study population of 5,700 female workers in laundries and/or dry-
cleaning shops from the registers of the Union of Chemical Workers and the Municipal Workers Union
of Finland for the period 1973-1983. According to the FHDR, the cohort had 3279 pregnancies
between 1973 and 1983, of which 306 had resulted in a spontaneous abortion. Women with a
spontaneous abortion were defined as cases and 3 controls were age-matched with each case. If a
woman had experienced 2 or more spontaneous abortions, only one was randomly selected. A
questionnaire was used to obtain data on exposure during the first trimester of pregnancy. The
response rate was 77.2%, but 23.9% of spontaneous abortion cases did not report exposure during
the correct pregnancy. After excluding these cases, and controls with a missing case, the final study
material consisted of 130 cases (53%) and 289 controls (43%). The proportion of cases exposed to
PER during the first trimester of pregnancy (17 cases, 13.1%) was similar to that of controls
(29 controls, 10.0%). However, a greater proportion of cases (9 cases, 6.9%) had high exposure to
PER during pregnancy than controls (6 cases, 2.1%). The odds ratio (adjusted) for high exposure to
PER was 3.4 (95% CI 1.0 - 11.2). High exposure was defined as dry-cleaning tasks > 1h/d or as
handling PER more than once a week. The odds ratio for low exposure to PER was not elevated
(OR 0.7). For 7 study subjects, biological monitoring results from the same work were available. For
6 subjects, the measurements were taken within 1 - 10 months from the first trimester of the study
pregnancy and for one subject, the measurement was taken 5 years after the study pregnancy. The
Tetrachloroethylene 155
data are of limited value for assessing the validity of self-reported exposure to PER but suggest that
some workers engaged in dry cleaning work (and hence categorised as high exposure) may have had
similar levels of exposure as pressers and packers in dry cleaning shops.
Lindbohm et al (1990) identified a cohort of women who were biologically monitored for exposure to
organic solvents between 1965 and 1983. Pregnancies between 1973 and 1983 in this group of
women were identified from the FHDR. The design of the study was similar to that of Kyyrönen et al
(1989), with each spontaneous abortion age-matched to 3 controls and exposure ascertained during
the first trimester of pregnancy. The response rate was 85.5%, but 21.6% of spontaneous abortion
cases did not report the correct pregnancy. The final study material included 73 cases of spontaneous
abortion and 167 controls. The proportion of cases exposed to organic solvents during the first
trimester of pregnancy was significantly higher than in controls (42/73 cases, 70/167 controls, OR 2.2,
95% CI 1.2 - 4.1). Eight cases and 15 controls mentioned exposure to PER (OR 1.4; 95% CI 0.5 -
4.2). The odds ratio for the low PER exposure group was 0.5 (95% CI 0.1 - 2.9) and 2.5 (95% CI
0.6 - 10.5) for the high PER exposure group. For dry-cleaning work involving exposure to PER, the
OR was 2.7 (95% CI 0.7 - 11.2, 4 cases and 5 controls), but for other work in a dry-cleaning shop, the
OR was 0.6 (95% CI 0.1 - 5.5, 1 case and 6 controls).
Ahlborg (1990a) used similar methodology to perform two case-control studies among Swedish female
laundry and dry-cleaning workers, employed for at least one month in 1973-1983. Adverse outcomes
of interest included spontaneous abortion, perinatal death, congenital malformations and birth weight
less than 1,500 g. The first study (described as the primary study) included 7,299 women from
475 workplaces who had 955 pregnancies in this period. In all, 66 cases of adverse outcome were
registered (44 spontaneous abortions). Two controls were individually matched to each case by using
the mother's age, year of pregnancy and parity. The final study material was 48 cases and
110 controls, but the author did not state what proportion of the cases were spontaneous abortion. In
the second study, 5176 female workers in laundry or dry-cleaning shops were found through the
national census of occupations. A further 755 pregnancies were identified and among these, 55
spontaneous abortions and 28 other cases of adverse outcome were found. The final study material
in this second study was 68 cases and 131 controls. The OR for spontaneous abortion in the
combined study material, for low PER exposure and high PER exposure mothers respectively, were
1.0 (95% CI 0.4 - 2.2) and 0.9 (95% CI 0.4 - 2.1).
The study by Kyyrönen et al (1989) and the primary study by Ahlborg (1990a) were part of a multi-
centre case-control study performed in Denmark, Norway, Sweden, Finland to study reproductive
hazards of women doing dry-cleaning work (Olsen et al, 1990). In addition, Kolstad et al (1990)
provided limited information about the Danish arm of the study. A common study protocol was used,
but not all of the centres could follow the same procedures in data collection. For this reason, the data
were not pooled and Olsen et al (1990) combined summary measures from each study. The most
156 ECETOC Joint Assessment of Commodity Chemicals No. 39
significant finding was an increased risk of spontaneous abortion among the most exposed women in
the Finnish data. This finding had been earlier reported by Kyyrönen et al (1989), although it should
be noted that there are differences between Olsen et al (1990) and Kyyrönen et al (1989) in respect of
the number of cases studied and especially in the exposure status of cases and controls. Olsen et al
(1990) noted that the Finnish finding was only supported by the results of other studies to a minor
degree and the combined odds ratio had confidence limits which included unity (OR 1.17, 95% CI
0.74 - 1.85 low PER and OR 2.88, 95% CI 0.98 - 8.44 high PER). There were no cases of
spontaneous abortion in the Norwegian arm of the study and the combined report of Olsen et al (1990)
adds little new information to the reports of Kyyrönen et al (1989) and Ahlborg (1990a).
Ahlborg (1990b) studied the validity of exposure data obtained by questionnaire in occupational
reproductive studies. Exposure data from self-administered questionnaires in the Swedish study
described earlier (Ahlborg, 1990a), were compared with information obtained from the employer. A
higher percentage of cases than controls did not know whether they had been exposed to PER (47%
versus 37%). However, the exposure status of cases that did not know whether they had been
exposed was similar to that of cases who stated that they did know and the same was true for
controls. Reclassification of the exposure status using data obtained from the employers raised the
OR of spontaneous abortion in high exposure workers from 0.92 to 1.24, although neither was
statistically significant.
McDonald et al (1987a) described the overall results of a large cross-sectional study of 56,067
Canadian women delivered or treated for a spontaneous abortion in 11 Montreal hospitals over the
period 1982-1984. All women were interviewed in detail regarding their occupational, social and
personnel characteristics and the results analysed in relation to spontaneous abortion, stillbirth,
congenital defect and low birth weight. Expected numbers for these 4 adverse pregnancy outcomes
were calculated adjusting for up to 8 confounding variables, such as smoking, age, alcohol, ethnic
origin, education and previous reproductive history. In this cohort, 202 pregnancies occurred in
women who were employed in laundry and/or dry-cleaning shops. For spontaneous abortions, the
observed to expected ratio was 1.05 (36 spontaneous abortions) which was not significantly increased.
Some limited information is obtained from a study by Bosco et al (1987), which collected details on
pregnancies of 67 women working in dry-cleaning shops in Rome, Italy. In all, 102 pregnancies were
reported, of which 56 had occurred during the period of their employment in dry-cleaning
establishments and 46 during the periods that they were not employed. Of the 56 pregnancies that
had occurred during employment, 5 had resulted in a spontaneous abortion, whereas only 1 of the 46
pregnancies occurring during non-employment had this outcome. This difference is not statistically
significant and the proportion of exposed pregnancies ending in spontaneous abortion is similar to that
reported in general population studies.
Tetrachloroethylene 157
In a US case-control study of spontaneous abortions, exposure to solvents was ascertained by a
computer-assisted telephone interview (Windham et al, 1991). Cases were defined as women, at
least 18 years of age, who had a spontaneous abortion by the 20th week of gestation. Two controls
per case were randomly selected among residents who had a live birth. A response rate of 80% was
achieved and 1926 subjects participated in the study (626 cases, 1,300 controls). Of the 1,361
working women that were included in analyses of occupational solvent exposure, 249 had been
exposed to solvents (20% of employed cases and 17.5% of employed controls). The adjusted OR for
any solvent exposure was 1.1 (95% CI 0.77, 1.5). Among the cases, 5 (1.1%) were exposed to PER
compared with 2 (0.2%) in the control group. The crude OR for these cases was 4.7 (95% CI ; 1.1 -
21.1). The adjusted OR for repeated exposure to PER ranged from 4.2 (95% CI 0.86 - 20.2) to 6.0
(95% CI 1.4 - 25.8). However, only one subject worked in the dry-cleaning or laundering industry and
it is unclear how the exposures to PER of the other subjects compare with those of workers in the dry
cleaning industry studied by other investigators.
Doyle et al (1997) performed a retrospective occupational cohort study of the pregnancies of women
who were currently employed or used to work in 696 dry-cleaning shops and 13 laundry units in the
UK. A total of 7,305 employees was sent a postal questionnaire of which 1,593 (21.8%) could not be
delivered. Of those delivered, 3,110 (54.5%) were returned completed by 2,711 dry-cleaning shop
workers and 399 laundry workers. The questionnaire was used to collect information about the
outcome of each pregnancy of subjects and workplace exposure. Maternal age, pregnancy order and
year of event were adjusted for in the analyses, but no information was collected on smoking habits,
alcohol consumption and whether a woman worked during pregnancy. In all, 172 workers reported a
spontaneous abortion, but only 71 of these gave permission to consult their GP to confirm the
spontaneous abortion. A total of 3,517 pregnancies were reported, of which 392 were spontaneous
abortions (foetal losses within 28 weeks of gestation). For pregnancies ending between 1980 and
1995, the risk of spontaneous abortion was 17.9% in dry-cleaning operators, 12.3% in non-operators,
15.5% in laundry workers and 13.5% in workers who were not employed in a dry-cleaning shop or
laundry during the pregnancy or 3 months before conception. The spontaneous abortion rate in dry-
cleaning operators was compared to that in non-operators. A small, but statistically significant
increase was reported in an analysis of all pregnancies completed 1980-95, but this increase was not
statistically significant when the analysis was restricted to first pregnancies to account for a possible
lack of independence among women who experienced more than one pregnancy (OR 1.51; 95% CI
0.81 - 2.84). There was no difference between dry-cleaning work and laundry work in the analysis of
first pregnancies (OR 1.03; 95% CI 0.48 - 2.21). In another analysis, the investigators reported a
significantly increased risk of spontaneous abortion in pregnancies of women who were employed as
dry-cleaning operators during pregnancy compared to unexposed pregnancies. No corresponding
increase was seen for dry-cleaning non-operators, but an elevated non-significant increase was
reported for laundry workers. However, the authors did not know the place or type of work of women
158 ECETOC Joint Assessment of Commodity Chemicals No. 39
reporting unexposed pregnancies or even whether they worked at all during the pregnancy. For this
reason, the validity of such a comparison is not clear.
9.6.3 Birth Defects
In a study described above (Section 9.6.2), McDonald (1987a) did not report any statistically significant
associations between stillbirth, congenital defects and low birth weight, and occupation in a laundry
and/or dry-cleaners. The observed to expected ratio for congenital defects was 1.41 (9 observed).
McDonald et al (1988) reported a more detailed analysis of congenital defects in a sub-set of women
studied by McDonald et al (1987a). These were women employed for 15 hours a week or more at the
time of conception. A total of 180 pregnancies occurred in women whose occupation was categorised
as laundry and dry-cleaners. The observed to expected ratio for congenital defects was 1.31
(6 observed) and this was not statistically significant. McDonald (1987b) also conducted a case-
control study in which the cases were 301 women giving birth to a child with a congenital defect in the
Montreal study described previously. The study was limited to women employed 30 or more hours a
week until at least the 13th week of gestation. The cases were individually matched with 301 women
whose children were normal. None of the cases or controls were exposed to PER.
Kyyrönen et al (1989) also studied congenital malformations in a case-control study employing similar
methodology to the spontaneous abortions study described above (Section 9.6.2). The subjects
included 24 cases of malformations and 93 controls. The odds ratio for PER exposure was 0.8
(95% CI 0.2 - 3.5).
In the study of Ahlborg (1990a), the cases also included cases of perinatal death, congenital
malformations and low birth weight. The OR for all adverse outcomes among births for low exposed
or high exposed mothers respectively, were 1.4 (95% CI 0.4 - 5.3) and 1.6 (95% CI 0.4 - 7.1).
Olsen et al (1990) summarised data from the studies of Ahlborg (1990a), Kyyrönen et al (1989) and
other study material from Norway and Denmark. They present the relative risk for congenital
malformation, stillbirth and low birth weight, according to exposure to PER in various trimesters of
pregnancy. The authors concluded that most of the results were in line with the null hypothesis. The
summary OR for all adverse outcomes among births for low and high exposed mothers (exposure
throughout pregnancy) respectively, were 1.72 (0.40, 7.12) and 0.87 (0.20 - 3.69).
Windham et al (1991) presented some information about the foetal growth of live-born controls in
relation to solvent exposure. A high odds ratio for intrauterine growth retardation was reported, but
this was based on one case exposed to PER and trichloroethylene.
Tetrachloroethylene 159
9.6.4 Evaluation
Fertility
Only one study provides information concerning the fertility of women exposed specifically to PER in
the workplace (Sallmén et al, 1995). An increased time to pregnancy was reported for women
exposed to PER, but the finding was not statistically significant and there was no difference between
low and high exposed women. Another study reported a small, but statistically-significant increased
risk of idiopathic infertility in women exposed to dry-cleaning chemicals (Rachootin and Olsen et al,
1983), but this finding has limited relevance to an assessment of effects of exposure to PER. Other
reports provide information on menstrual disorders and the effects on the sperm quality of male dry-
cleaners and the reproductive performance of their partners. However, no clinically significant effects
were reported.
Pregnancy Outcome
A series of Finnish studies have been conducted which have identified cases of spontaneous
abortions from a national hospital discharge register (Hemminki et al, 1980, 1984; Lindbohm et al,
1984, 1990; Kyyrönen et al, 1989). Only the two most recent studies assessed exposure specifically
to PER and there is considerable overlap between the cases in these two studies and the earlier
studies. Kyyrönen et al (1989) reported a significantly increased risk of spontaneous abortion in
women whose exposure to PER was assessed as high, but no increase in women with low exposure.
Lindbohm et al (1990) also reported an increased risk in women whose exposure was defined as high,
but this was not statistically significant. The study by Kyyrönen et al (1989) was part of a Scandinavian
study (Olsen et al, 1990) which also included spontaneous abortion data from Denmark and Sweden.
There was no support for the Finnish finding in the Swedish arm of the study or in an enlarged
Swedish study reported by Ahlborg (1990a), which added further cases and controls to those reported
by Olsen et al (1990). There were too few cases in the Danish arm to draw meaningful conclusions.
A recent UK study by Doyle et al (1997) employing different methodology appears to lend support to
the Kyyrönen finding. However, the investigators had no data on individual exposures to PER and
machine operator versus non-operator was used as a surrogate measure of exposure. There was no
difference in the risk of spontaneous abortion between all dry-cleaning workers and a comparison
group consisting of laundry workers but an increased risk of spontaneous abortion was reported for
dry-cleaning operators relative to non-operators. However, when the analysis was properly restricted
to the first births of subjects, the increased risk of spontaneous abortion in dry-cleaning operators
relative to non-operators was not statistically significant. The poor response rate with resultant
potential for bias and inability to adjust for confounding further reduces the weight that can be attached
to this finding.
160 ECETOC Joint Assessment of Commodity Chemicals No. 39
The study by Windham et al (1991) also reported an increased risk of spontaneous abortion in women
exposed to PER. However, it is difficult to relate these findings to the studies of Kyyrönen et al (1989)
and Doyle et al (1997) conducted in the dry-cleaning and laundry industry. Only one of the 7 subjects
exposed to PER in the study of Windham et al (1991) was employed in the dry-cleaning industry. The
other subjects were drawn from a broad industry base and some would have been exposed to other
chemicals in addition to PER. In addition, it is not possible to compare the exposure levels of subjects
in this study with those of workers in the dry-cleaning industry.
Taken together, the studies by Kyyrönen et al (1989) and Doyle et al (1997) provide suggestive
evidence of an elevated risk of spontaneous abortion in women with the highest exposures to PER in
dry-cleaning establishments. However, the study by Kyyrönen et al (1989) was conducted in an
industry where concern might have been high because of the findings of earlier studies and this may
have led to reporting bias. Similarly, there may have been heightened awareness in the population
studied by Doyle et al (1997) which, taken together with the low response rate, may have led to
reporting bias. Neither study reported an increased risk of spontaneous abortion associated with
working in a dry cleaning shop, and neither study has satisfactorily demonstrated an exposure gradient
for PER. The Windham et al (1991) study does not support the finding because only one subject (a
control) was a dry-cleaning worker and exposures are not comparable between this study and those
by Kyyrönen et al (1989) and Doyle et al (1997). Hence, it is not possible to link the increased
incidence of spontaneous abortion in the three studies to PER exposure, and the findings are capable
of explanation by bias or confounding. Thus, the evidence is insufficient to support a causative
association between PER exposure and spontaneous abortion.
Birth defects
There is no evidence from several studies of an association between exposure to PER and an
increase in the incidence of birth defects.
9.7 OTHER CHRONIC TOXIC EFFECTS
In this section, human data on chronic toxicity will be described in terms of morbidity and mortality.
9.7.1 Morbidity
Case Studies
Abedin et al (1980) reported the case of a 24-year old man with complaints of headache, dizziness
and irregular heartbeats, starting within one month of beginning to work in a dry-cleaning operation.
After 7 months of employment the ECG revealed sinus rhythm and premature beats. During a 6-d
stay in a hospital the symptoms gradually disappeared. Two weeks after returning to work the
Tetrachloroethylene 161
symptoms and complaints recurred. The level of PER in his plasma was reported to be 3,800 mg/l.
When he changed his job, his health problems resolved permanently.
Aoki et al (1989) described a 42-year old man with anosmia, who had been intermittently exposed for
16 years to PER soaked into clothes. X-ray and endoscopy of the nose showed obstruction by
oedematous swelling of the nasal mucosa of the bilateral olfactory clefts and a severe bilateral
ethmoidal sinusitis. There was no clear evidence of a causal relationship between exposure to PER
and the occurrence of this effect.
Epidemiological Studies (Table 52)
Franke and Eggeling (1969) performed a cross-sectional study of 113 workers in dry-cleaning shops,
together with environmental monitoring in 46 workplaces. Although not statistically significant, the
exposed group had more complaints of headache, irritability and insomnia than 43 control subjects.
Of the liver function tests performed, the thymol and bilirubin tests were statistically significantly
different from the controls. SGOT and SGPT levels were not statistically different from controls.
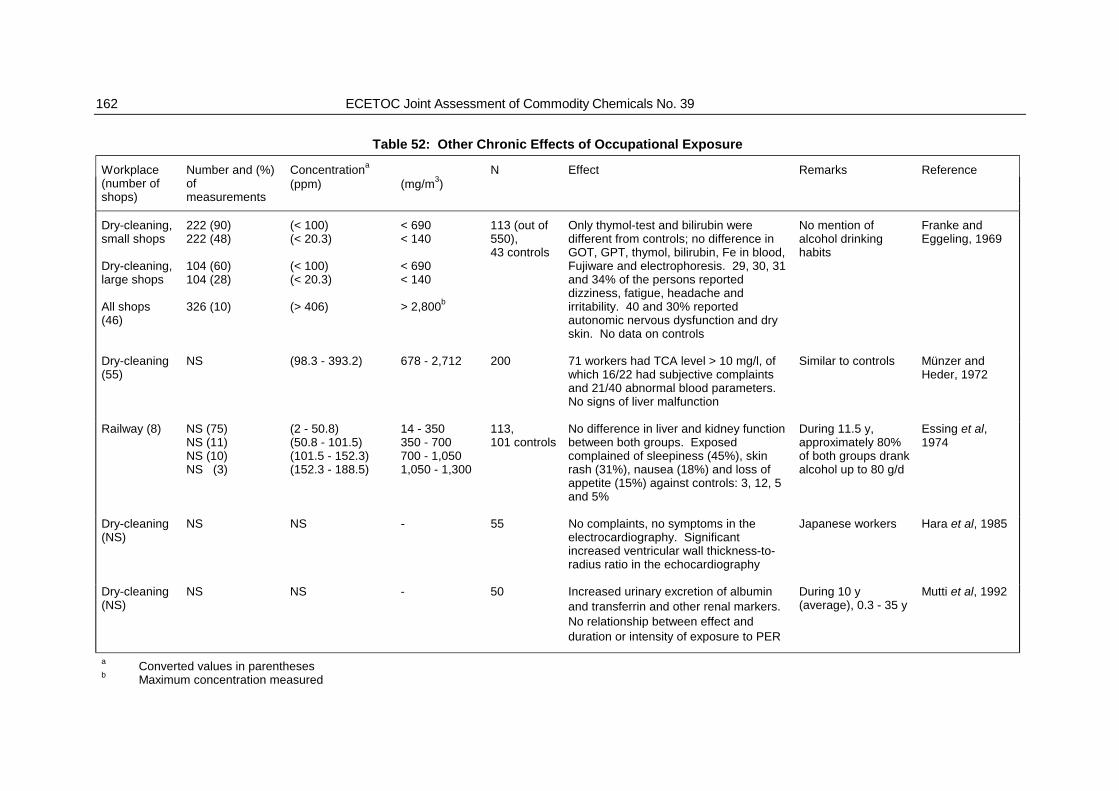
162 ECETOC Joint Assessment of Commodity Chemicals No. 39
Table 52: Other Chronic Effects of Occupational Exposure
ConcentrationaWorkplace(number ofshops)
Number and (%)ofmeasurements
(ppm) (mg/m3)N Effect Remarks Reference
Dry-cleaning,small shops
Dry-cleaning,large shops
All shops(46)
222 (90)222 (48)
104 (60)104 (28)
326 (10)
(< 100)(< 20.3)
(< 100)(< 20.3)
(> 406)
< 690< 140
< 690 < 140
> 2,800b
113 (out of550),43 controls
Only thymol-test and bilirubin weredifferent from controls; no difference inGOT, GPT, thymol, bilirubin, Fe in blood,Fujiware and electrophoresis. 29, 30, 31and 34% of the persons reporteddizziness, fatigue, headache andirritability. 40 and 30% reportedautonomic nervous dysfunction and dryskin. No data on controls
No mention ofalcohol drinkinghabits
Franke andEggeling, 1969
Dry-cleaning(55)
NS (98.3 - 393.2) 678 - 2,712 200 71 workers had TCA level > 10 mg/l, ofwhich 16/22 had subjective complaintsand 21/40 abnormal blood parameters. No signs of liver malfunction
Similar to controls Münzer andHeder, 1972
Railway (8) NS (75)NS (11)NS (10)NS (3)
(2 - 50.8)(50.8 - 101.5)(101.5 - 152.3)(152.3 - 188.5)
14 - 350350 - 700 700 - 1,050 1,050 - 1,300
113,101 controls
No difference in liver and kidney functionbetween both groups. Exposedcomplained of sleepiness (45%), skinrash (31%), nausea (18%) and loss ofappetite (15%) against controls: 3, 12, 5and 5%
During 11.5 y,approximately 80%of both groups drankalcohol up to 80 g/d
Essing et al,1974
Dry-cleaning(NS)
NS NS - 55 No complaints, no symptoms in theelectrocardiography. Significantincreased ventricular wall thickness-to-radius ratio in the echocardiography
Japanese workers Hara et al, 1985
Dry-cleaning(NS)
NS NS - 50 Increased urinary excretion of albuminand transferrin and other renal markers. No relationship between effect andduration or intensity of exposure to PER
During 10 y(average), 0.3 - 35 y
Mutti et al, 1992
a Converted values in parenthesesb Maximum concentration measured

Tetrachloroethylene 163
Münzer and Heder (1972) measured the urinary TCA levels of 200 employees (71 males and 129
females) from 55 dry-cleaning shops exposed to PER at concentrations ranging from
678 - 2,712 mg/m3 (98.3 - 393.2 ppm). From these 200 workers 71 workers (35 males and
36 females) had plasma TCA levels above 10 mg/l. Forty workers (23 males and 17 females) from
the cohort with plasma TCA levels higher than 10 mg/l were studied and 16 out of 22 from this group
reported a number of subjective complaints such as headache, vertigo, weariness, nervousness and
irritability. In 21 out of 40 subjects, abnormal blood parameters were found including increases in
blood sedimentation rate and in serum transaminases. However, in the non-exposed group of
23 males and 17 females, the same prevalence of abnormal blood parameters was found.
Essing et al (1974) investigated 113 workers with long-term exposure to solvents who were exposed
to a mean concentration of 35 to 51 ppm of PER (241 or 351.4 mg/m3), with a peak exposure of
245 ppm (1,688 mg/m3). Of these, 101 workers were known to consume alcohol on a regular basis.
Only 8 of the exposed workers had no subjective complaints. The most frequently occurring
subjective complaints among the other 105 workers were: dullness (n = 50), dermatitis (n = 40),
nausea (n = 25), loss of appetite (n = 20), undue perspiration (n ≥ 35) and decrease of libido (n = 30);
97 of the workers had abnormal liver function tests for SGOT, SGPT and bromophthalein. These
abnormal test results were not related to the intensity and duration of PER exposure, but there was an
association with the consumption of alcohol.
Takeuchi et al (1981) performed a survey of 187 workers exposed to PER from 57 companies. The
main complaints found were: olfactory disturbances, eye irritation and unsteady feeling in the head.
According to the results of some liver function tests, the liver function was slightly impaired. No details
were given of exposure or confounding factors.
Hara et al (1985) evaluated the cardiovascular status of 55 Japanese dry-cleaning workers without any
complaints. The cohort was selected with respect to the absence of a history of hypertension, the
absence of diabetes mellitus and the absence of a heavy alcohol intake. No effects were seen on the
electrocardiographic examination. However, echo-cardiography revealed a thickening of the
ventricular wall, decreased fractional shortening of the internal dimension of the left ventricle and
decreased mean velocity of circumferential fibre shortening at systole. The intensity was positively
related with the intensity of exposure. Due to a number of limitations, such as mixed exposure to
organic solvents and absence of data about the intensity of exposure, no causal relationship with
exposure to PER could be determined.
Mutti et al (1992) performed a cross sectional study of 50 workers exposed to PER in dry-cleaning
shops for an average of 10 years (0.3 - 35 years). Small, but statistically significant increases in the
urinary excretion of albumin and transferrin and other potential markers of bilary damage were
detected in exposed subjects when compared to a group of 50 controls (blood donors matched for age
164 ECETOC Joint Assessment of Commodity Chemicals No. 39
and sex). Tubular Brushborder antigen and Uromucoid were also increased, whereas the serum
α-2µ-globulin showed only slight changes. Urinary retinol binding protein and immunoglobulin levels
were not significantly increased. In 20-50% of the cohort, signs of glomerular dysfunction or tubular
damage were detected. There was no relationship between renal markers and either duration or
intensity of exposure to PER.
9.7.2 Mortality
Case History Studies
Trense and Zimmerman (1969) described a fatal case of PER intoxication after an exposure intensity
of 50 ppm to > 250 ppm (344.5 to > 1,723 mg/m3) for more than 2.5 years. The actual peak values
are likely to have been much higher due to pre-cleaning spraying of clothing with a mixture containing
39% PER and 10% isopropanol. After 2 days of influenza-like symptoms, the man was admitted to
hospital with haemoptysis, dyspnoea and perspiration; he died 4 days later. In the post-mortem, toxic
hepatosis, fatty change of heart muscle and lung oedema was diagnosed.
Epidemiological Studies
All of the studies described below have been discussed with respect to the incidence of malignant
neoplasms (Section 9.5.1).
Blair et al (1990) reported significantly reduced mortality from all causes in a cohort of dry-cleaning
workers (SMR = 90; 95% CI 90 - 100; 1,129 deaths). No results were provided for the cohort of
workers who were first employed after 1960 when PER was the predominant solvent. In the full
cohort, significantly elevated mortality was reported for emphysema (SMR = 200; 95% CI 110 - 340;
14 deaths).
Ruder et al (1994) studied another cohort of dry-cleaning workers but only reported deaths from all
causes and deaths due to selected cancers. Deaths from all causes were slightly elevated
(SMR = 101; 95% CI 94 - 109; 769 deaths). All cause mortality was lower than expected in a sub-
cohort of workers who had only worked in shops in which PER was the primary solvent (SMR = 97;
95% CI 84 - 110; 222 deaths).
Antilla et al (1995) presented limited mortality information for the cohort of workers monitored for
blood-PER. All cause mortality was significantly reduced in women (SMR = 51; 95% CI 30 - 90;
12 deaths) and lower than expected in men (SMR = 67; 95% CI 30 - 120; 10 deaths).
All cause mortality was reduced in the cohort of chemical workers studied by Olsen et al (1989)
(SMR = 56; 95% CI 42 - 75; 48 deaths). Significant deficits of deaths due to arteriosclerotic heart

Tetrachloroethylene 165
disease (10 observed and 21.9 expected) and deaths due to external causes (14 observed and 29.8
expected) were reported.
None of the other studies described in Section 9.5.1 provides information that permits an assessment
of the effect of PER exposure on mortality from causes other than cancer.
9.7.3 Evaluation
Information on morbidity from specific causes in relation to PER exposure is limited. However, all
relevant studies report mortality from all causes which was either significantly reduced or close to
expected. No causal or dose-response relations could be determined.
166 ECETOC Joint Assessment of Commodity Chemicals No. 39
10. HAZARD ASSESSMENT
10.1 ASSESSMENT OF HAZARD TO HUMAN HEALTH
10.1.1 Acute Health Effects
Although PER is of low acute toxicity, single exposure by inhalation to high vapour concentrations can
induce CNS depression, potentially leading to pre-anaesthetic effects, loss of consciousness, coma and
death if the exposed people are not removed from the contaminated area. High exposure of consumers
may occur especially after use of self-service coin-operated dry-cleaning machines.
The inhalation threshold for acute effects on the CNS was established in human volunteers at 100 -
200 ppm PER (689 - 1,378 mg/m3) for 1 hour. Evidence of loss of motor co-ordination in humans has
been obtained with exposure to 600 ppm PER (4,134 mg/m3) for 10 minutes (Rowe et al, 1952). These
effects are clearly reversible on cessation of exposure. Several cases of fatal poisoning after
accidental gross over-exposure by inhalation of PER have been reported. However, concentrations
and precise exposure durations were unknown (Levine et al, 1981; McCarthy and Jones, 1983;
Lukaszewski, 1979). Lethal inhalation concentrations following 4-h exposure of rats and mice were in
the range of 2,300 - 5,200 ppm PER (15,850 - 35,830 mg/m3) (Table 14). Inhalation of an estimated
concentration of 38,095 mg/m3 PER (5,520 ppm) for less than 90 minutes reportedly caused the death
of a 2-year old child (Garnier et al, 1996).
10.1.2 Irritation Effects
PER may cause dermal irritation if the liquid is in close contact with the skin. Dermatitis can occur on
repeated contact with liquid PER due to the skin defattening effect of the solvent.
PER vapours were reported to cause mild irritation of the eyes of human volunteers exposed to
100 ppm (689 mg/m3) for 2 hours. At 280 ppm (1,929 mg/m3), irritation became substantial (Rowe et
al, 1952).
PER vapours were reported to cause marked irritation of the upper respiratory tract of human
volunteers at a concentration of 1,060 ppm (7,300 mg/m3). Lower concentrations (216 ppm
(1,488 mg/m3) for 2 hours) induced mild irritation, which was confined to the nose (Rowe et al, 1952).
10.1.3 Chronic Toxicity
Target organs following repeated exposure in animals are the liver, kidney, lungs and CNS. In
humans, adverse effects on the CNS have been reported following repeated exposure to levels
exceeding 100 ppm PER (689 mg/m3).
Tetrachloroethylene 167
A LOAEL following repeated inhalation (up to 8 h/d, 5 d/wk) of 100 ppm PER (689 mg/m3) has been
demonstrated in a wide variety of animal species, on the basis of histological examination of all critical
organs in studies of up to 2 years duration (Section 8.3 and 8.5).
Based on the assumptions that all the inhaled PER is absorbed and an average laboratory rat weighs
0.25 kg and has a ventilation rate of 5 l/h, the total body burden for rats exposed to 100 ppm
(689 mg/m3) for 8 hours would be 0.689 mg/l x 5 l/h x 8 h/d ≈ 28 mg/d/rat, i.e. 112 mg/kgbw/d.
10.1.4 Reproductive Toxicity
PER has been shown to be foetotoxic, but not teratogenic, at maternally toxic dose levels in several
animal species. No effect on fertility was demonstrated in a 2-generation inhalation study in rats up to
1,000 ppm (6,890 mg/m3). A clear NOAEL of 100 ppm (689 mg/m3) was established for parental and
subsequent generations (Section 8.8). In humans, no persuasive evidence of an effect on
reproduction (either development or fertility) has been found (Section 9.6).
10.1.5 Genotoxicity
The overall evidence from studies conducted to assess the genotoxicity of PER, including gene
mutations, DNA damage, mutation in germ cells and chromosomal aberrations in vitro and in vivo,
indicates that it is not genotoxic (Section 8.6). Limited information in humans provides no evidence of
genotoxicity (Section 9.4).
10.1.6 Carcinogenicity
PER has been reported to increase the incidence of liver tumours in male and female mice and kidney
tumours in male rats.
Studies of the mechanism of tumour formation in rodents lead to the conclusion that the increased
incidence of liver tumours in mice is due to the metabolism of PER to TCA. TCA is known to be a
peroxisome proliferator, inducing liver enlargement and liver tumours in rodents. PER is metabolised
to TCA via the cytochrome P450 pathway, a route that is not saturated at the highest dose tested in
mice. The absence of an increased incidence of liver tumours in the rats is explained by the fact that
the oxidative pathway is saturable in rats, as it is in humans. It is predicted that liver tumours would
not occur in humans at current occupational exposure levels because of (i) saturation of the oxidative
pathway at atmospheric concentrations above 100 ppm leading to much lower blood levels of TCA
than in mice, and (ii) the absence of peroxisome proliferation and associated events in human
hepatocytes exposed to PER or TCA.
168 ECETOC Joint Assessment of Commodity Chemicals No. 39
Mechanistic studies of the tumour development in male rat kidneys have led to the conclusion that
these are due to a protein droplet nephropathy, a phenomenon specific to male rats, coupled with
sustained chronic toxicity consequent on hepatic GSH conjugation of PER (leading to the activation of
the resulting cysteine conjugate via renal β-lyase to a genetically active metabolite). Although
mercapturic acid derivatives have been formed in the urine of both rats and humans, the GSH-
conjugation pathway has not been detected in human liver samples. Thus, the kidney tumours are
considered to be caused by a mechanism that occurs in male rats only.
The observation of increased incidence of mononuclear cell leukaemia in the F344/N rat, but not in the
Osborne-Mendel nor the Sprague-Dawley rat, is considered to be of no significance for human hazard
assessment because this neoplasia is known to be of a high and variable incidence, especially in the
F344/N rat.
It is concluded that the tumour findings in rats and mice are not relevant for humans under reasonably
foreseeable circumstances of chronic exposure (Section 9.5).
Available epidemiological studies were either negative or were not sufficient to provide evidence of a
relationship between exposure to PER and cancer in humans (Section 9.7).
10.2 ASSESSMENT OF HAZARD TO ORGANISMS IN THE ENVIRONMENT
10.2.1 Aquatic Compartment
The acute toxicity of PER on aquatic organisms such as fish, crustaceans or algae has been studied
extensively. Validated studies have shown the lowest acute LC50 for freshwater fish to be 5 mg/l.
Similar values are found for salt-water fish. For Daphnia, EC50 values from 8.5 mg/l are reported.
Acute EC50 values for fresh and salt-water algae are found at higher levels (> 500 mg/l). The lowest
acute LC50 of 5 mg/l PER is considered to be representative of all aquatic trophic levels
(Section 6.2.1).
In chronic toxicity studies, the lowest NOEC for Daphnia is 0.5 mg/l (28 days), whereas fish embryo-
larval stages were resistant up to a concentration of 1.4 mg/l PER (Section 6.2.2).
Studies in ecosystems have demonstrated effects at concentrations of 0.1 mg/l and above in
microfauna. In natural ecosystems, Daphnia appear to be more sensitive than in laboratory studies,
acute lethal concentrations occurring at around 0.3 mg/l (Section 6.2.3).
Tetrachloroethylene 169
10.2.2 Terrestrial Compartment
Several soil organisms have been used for testing PER toxicity including micro-organisms,
invertebrates and plants after acute or prolonged exposure. Most of these studies have been
conducted under non-standard conditions but on the whole, NECs are of the order of 1 mg/kg soil.
Effects have been reported following exposure to PER at concentrations starting from 10 mg/kg for
one plant species or 18 mg/kg for terrestrial worms. PER and its atmospheric degradation product,
TCA, may have adverse effects on the photosynthetic apparatus of conifers and other higher plants
(Section 6.3.1-2).
10.2.3 Secondary Poisoning (“Non-Compartment Specific Exposure Relevant to the FoodChain”)
Based on its octanol-water partition coefficient, no significant bioaccumulation of PER is expected.
Measured bioconcentration factors for PER in freshwater fish were found to be < 100 (range 26 - 77,
see Section 4.2.5). Bioconcentration factors in sea-water have been estimated to be < 100 in fish
liver, bird's eggs and seal blubber. PER concentration in marine algae and plankton have been shown
to be < 180 times higher than in sea-water. Thus there is no evidence of biomagnification of PER
along the food chain.
10.3 SUMMARY OF HAZARD DATA TO BE USED FOR RISK ASSESSMENT
10.3.1 Health Effects
Following acute inhalation exposure, adverse effects on the CNS can be found in humans at
concentrations above 100 ppm PER (689 mg/m3) after 1hour exposure and at higher concentrations
over shorter time periods. At this level, reversibility will occur after removal from exposure. Mortality
has been reported following exposure to high atmospheric concentrations or accidental ingestion of
large doses of PER.
Repeated occupational exposure to levels lower than 100 ppm PER would be unlikely to cause any
adverse effects. Repeated exposure to higher concentrations may cause adverse effects on the CNS,
liver and kidney.
10.3.2 Environmental Effects
Aquatic Organisms
Results from laboratory studies of different aquatic trophic levels following of acute or chronic
exposure to PER have demonstrated a NEC of 0.5 mg/l. Under field conditions, aquatic phytoplankton
170 ECETOC Joint Assessment of Commodity Chemicals No. 39
appeared to be more sensitive to the effects of PER, a decrease in species diversity and productivity
being seen at 0.1 mg PER/l
The PNEC for the aquatic environment can be estimated to be 0.05 mg PER/l.
Terrestrial Organisms
Effects on soil micro-organisms, invertebrates and plants have demonstrated a NEC of 1 mg PER/kg
soil (dry weight). PER and its atmospheric degradation product, TCA, may have adverse effects on
the photosynthetic apparatus of conifers and other higher plants.
Secondary Poisoning
PER is neither expected to bioaccumulate nor to be subject to biomagnification along the food chain.
Secondary poisoning due to PER is, therefore, not expected to occur.

Tetrachloroethylene 171
11. FIRST AID, MEDICAL TREATMENT AND SAFE HANDLING
ADVICE
11.1 FIRST AID
Inhalation
Remove subject to fresh air; sit the subject down with the body upright. Do not induce vomiting. If
breathing is difficult, give oxygen. If not breathing (narcosis or unconscious), give mouth-to-mouth
resuscitation. Call a physician and/or transport to emergency facilities immediately.
Ingestion
Remove subject to fresh air; make subject sit down or lie down with body upright. Do not induce
vomiting. If not breathing (narcosis or unconscious), give mouth-to-mouth resuscitation. If breathing is
difficult, apply oxygen or artificial respiration. Call a physician and/or transport to emergency facilities
immediately.
Eye Contact
Irrigate immediately with plenty of water for at least 10 min with the eyelids held wide-open.
Skin Contact
Remove contaminated shoes and clothes. Wash off in flowing water or shower with soap. Provide clean
clothing.
11.2 SPECIAL FEATURES FOR MEDICAL TREATMENT
Inhalation
If aspirated, PER may be rapidly absorbed through the lungs and cause systemic effects. Immediate
medical surveillance is recommended. Never administer sympathomimetic drugs such as adrenaline
unless this is absolutely necessary, because of the risk of cardiac fibrillation. Give supportive care.
Further treatment should be based on the judgement of a physician, in response to reactions of patient.
There is no specific antidote.
172 ECETOC Joint Assessment of Commodity Chemicals No. 39
Ingestion
Since rapid absorption of aspirated PER may occur through the lungs and cause systemic effects, the
decision of whether or not to perform gastric lavage should be made by a physician. If lavage is
performed, endotracheal intubation is suggested. The danger from lung aspiration must be weighed
against toxicity when considering emptying the stomach. Induction of vomiting is not recommended
because of the risk of aspiration into the lungs, but the final decision has to be made by the physician.
11.3 SAFE HANDLING
11.3.1 Storage
PER should be stored in a dry, freshly aerated place in closed metal containers, away from direct sunlight
and away from reactive or inflammable materials. Small quantities may be stored in brown glass bottles.
Always protect against fire: no smoking, no naked flames or sparks.
Containers for spills should be installed in places where large quantities are stored (ECSA, 1989).
11.3.2 Handling Precautions and Personal Protection
PER should be used only with adequate ventilation to ensure that workplace concentrations are below
the appropriate occupational exposure limit. Local exhaust ventilation may be necessary for some
operations. When respiratory protection is required for certain operations, an approved air-purifying
respirator (organic vapour type) must be used. In confined or poorly ventilated areas, personnel should
use an approved positive-pressure supplied-air respirator. Similar requirements should be adopted
under emergency and other exceptional conditions where the exposure guideline may be greatly
exceeded.
Use impermeable gloves when contact with the solvent could occur. Neoprene gloves are
recommended for intermittent use, polyvinyl alcohol gloves are recommended for frequent or repeated
handling. Chemical goggles, a face-mask and apron should be worn if there is danger of splashing.
Avoid breathing PER vapours. They are heavier than air and will collect in low areas such as pits,
degreasers, storage tanks and other confined areas. Do not enter these areas if vapours of PER are
suspected unless special breathing apparatus is used and an observer is present for assistance.
Tetrachloroethylene 173
11.3.3 Health Surveillance and Biological Monitoring
Early detection of effects on target organs may involve: symptoms such as headache, sleepiness,
dizziness; neurological examination including tests of co-ordination; biochemical blood tests for liver and
kidney function. The results should be compared with the findings in a non-exposed control group.
To estimate the total exposure to PER over a whole working week, measurement of the following
parameters has been proposed (Biological Exposure Indices, BEI; Biologische Arbeitsstoff-Toleranz-
Werte, BAT-Werte).
! Concentration of PER in "end-exhaled" (alveolar) air (15-16 hours after last exposure, prior to last shift
of working week) should be < 10 ppm (< 69 mg/m3) (ACGIH, 1996; DFG, 1997);
! Concentration of PER in blood (15-16 hours after last exposure, prior to last shift of working week)
should be < 1 mg/l (Henschler, 1989; ACGIH, 1996);
! Concentration of TCA in urine (at end of working week) should be < 7 mg/l; this parameter has been
considered less appropriate as a specific parameter because TCA can arise as a metabolite of other
chlorinated solvents (Lauwerijs et al, 1983; Henschler, 1989).
11.4 MANAGEMENT OF SPILLAGE AND WASTE
11.4.1 Spillage
Try to contain any spillage to as small an area as possible.
Small leaks: cover immediately with sand, sand dust, paper or other absorbent material and transfer
PER-soaked absorbent into sealable metal containers for disposal. Supply fresh air. Clean the
contaminated place with water and soap.
Large spills: evacuate the area. Contain the liquid and pump or transfer to closed metal containers.
Keep out of drains and water courses.
PER vapours are heavier than air and will be slow to disperse in pits etc. below ground level, or in
enclosed vessels. If spilled, they should be removed by local or natural ventilation.
11.4.2 Waste
The preferred options are to send PER containing waste in closed metal containers to a licensed
reclaimer or to a permitted incinerator in compliance with local, state and national regulations. Dumping
into sewers, on the ground or into any body of water is strongly discouraged and may be illegal.

174 ECETOC Joint Assessment of Commodity Chemicals No. 39
Distillation of waste PER may be feasible. Small quantities may be evaporated in a fume-cupboard or in
the open air.

Tetrachloroethylene 175
APPENDIX A. ATMOSPHERIC FATE OF TETRACHLOROETHYLENE
A.1 CHEMICAL AND PHYSICAL REMOVAL PROCESSES
The atmospheric degradation of PER occurs mainly in the troposphere and is initiated principally by
reaction with hydroxyl radicals and possibly to some extent by reaction with chlorine atoms. Reaction
with other trace species and direct photolysis are believed to make only a minor contribution to the
degradation of PER. Physical removal from the troposphere by “rainout” or uptake by the oceans is
negligible compared to chemical destruction.
The mechanism and products of the degradation are discussed in Section A.3.
A.1.1 Reaction with the Hydroxyl Radical
Atkinson (1994) reviewed determinations of the rate constant for reaction of PER with the hydroxyl
radical:
CCl2=CCl2 + !!!!OH → HOCCl2CCl2!!!! (Eq. A.1)
and recommended the value kOH = 9.64 x 10⁻¹² exp (–1209/T) cm3 molecule–1 s–1, where T is the
absolute temperature in K.
The tropospheric lifetime of PER (i.e. the time required for the concentration to fall to 1/e of its initial
value, if all sources of PER are abruptly stopped) with respect to removal by reaction with hydroxyl
radicals (τOH) can be estimated using the method recommended by Prather and Spivakovsky (1990), i.e.
by scaling the lifetime to that of the reference compound 1,1,1-trichloroethane, by means of the equation:
τOH = τOH,r x (kOH,r at 277 K) / (kOH at 277 K) (Eq. A.2)
where τOH,r is the lifetime of 1,1,1-trichloroethane (5.9 y, according to IPCC, 1996) and kOH,r is the rate
constant for the reaction of 1,1,1-trichloroethane with the OH radical (6.7 x 10⁻¹⁵ cm3 molecule–1 s–1 at
277 K, according to DeMore et al, 1994). This equation leads to a calculated lifetime τOH for PER equal
to 0.32 years, i.e. 3.9 months.
A.1.2 Reaction with the Chlorine Atom
A detailed study of the reaction of PER with the chlorine atom:
CCl2=CCl2 + Cl!!!! → CCl3CCl2!!!! (Eq. A.3)
has been published, together with a review of previous determinations (Nicovich et al, 1996). The rate
constant is found to be kCl = 4 x 10–11 cm3 molecule–1 s–1 at 277 K and 1 bar (1,000 hPa). This is roughly
176 ECETOC Joint Assessment of Commodity Chemicals No. 39
300 times greater than the rate constant kOH for reaction of PER with the hydroxyl radical under the same
conditions.
It is important to determine the relative contributions of reactions (A.1) and (A.3) to the atmospheric
degradation of PER, since they lead to different breakdown products, as will be discussed in Section
A.3. The relative rates of reactions (A.1) and (A.3) will depend not only on the ratio of their rate
constants, but also on the relative atmospheric concentrations of chlorine atoms and hydroxyl radicals.
While the levels of the latter have been fairly well established by modelling and measurement, no
direct tropospheric measurements of chlorine-atom concentrations have been performed and only
indirect evidence is available.
A number of recent studies have indicated that chlorine atoms are much more abundant in the marine
boundary layer (up to roughly 1.5 km altitude over the oceans) than in the rest of the troposphere (see,
for example: Graedel and Keene, 1995; Maben et al, 1995; Wingenter et al, 1996; and Singh et al,
1996a,b). From the available evidence it would appear likely that levels of chlorine atoms are high
enough relative to hydroxyl radicals for reaction (A.3) to be faster than reaction (A.1) in this boundary
layer. For example, Wingenter et al, 1996 report a [Cl!!!!]/[!!!!OH] molar ratio of 0.1, so that, taking into
account the rate constant ratio of reaction (A.3) to reaction (A.1) of 300, the addition of the chlorine
atom would be locally 30 times faster than that of the hydroxyl radical.
On the scale of the whole atmosphere, however, the situation is very different. Rudolph et al (1996)
calculated the rate of removal of PER by reaction with the hydroxyl radical, using as input observed
mean tropospheric distributions and seasonal cycles of PER together with model-derived hydroxyl
fields. The “budget” of PER (removal by chemical destruction compared to anthropogenic input) was
then balanced by assuming an additional sink due to reaction with chlorine atoms. It was concluded
that the latter sink is small or nil. Thus, for the troposphere of the northern hemisphere, where most of
the PER is emitted and degraded, and for which the budget calculation can therefore be performed
with greater certainty than for the southern hemisphere, it was concluded that the mean chlorine atom
concentration may be close to zero and is at most 500 molecules cm–3.
Aucott (1997) presented a similar budget analysis, taking into account also the possibility of natural
production of PER in the oceans (see Abrahamsson et al, 1995a,b). Aucott assumed anthropogenic
emissions of 438 kt/y, mainly in the northern hemisphere, and obtained a best fit between calculated
and observed concentrations for an oceanic source-strength of approximately 100 kt/y and a global-
mean tropospheric chlorine-atom concentration of close to 500 molecules cm–3.
From the conclusions presented by Rudolph et al (1996) and Aucott (1997), and taking the average
hydroxyl radical concentration as 106 molecules cm–3 (Prinn et al, 1995), one can conclude that
reaction of PER with the chlorine atom is likely to be approximately (500/106) x 300 = 0.15 times as

Tetrachloroethylene 177
fast as reaction with the hydroxyl radical, leading to a yield of 13% for the Cl-atom initiated degradation
pathway.
Finally, Singh et al (1996b) carried out similar calculations. They adopted an estimate of
anthropogenic emissions taken from McCulloch and Midgley (1996), namely 395 kt/y (1989-1990
average), together with an additional ocean source of 35 kt/y, derived from measurements of over-
saturation of PER in sea-water and assumed to be distributed as 40% in the northern hemisphere and
60% in the southern hemisphere. Singh et al (1996b) concluded that in a “mean case” calculation
scenario, the Cl-atom concentration would be lower than 100 molecules cm–3 and that “on average
98% of measured C2Cl4 is accounted for by OH and at best 2% loss can be attributed to Cl.” Singh et
al (1996b) also derived an “upper limit” estimate of 30% removal of PER by reaction with chlorine
atoms, resulting from an unlikely combination of extreme values of various parameters used as input
to the model calculations. This latter scenario corresponded to a Cl-atom abundance of 1,000
molecules cm–3. Singh et al (1996b) recognised that any errors were likely to be random rather than
additive in nature and that a more reasonable upper limit to the Cl-atom concentration would be 500
molecules cm–3, in agreement with the conclusions of Rudolph et al (1996) and Aucott (1997), so it is
assumed henceforth in this assessment that the fraction of PER reacting with Cl is approximately
13%.
A.1.3 Other Processes
Other reactive species (NO3, O3, O1D, O3P, HO2) present in the troposphere are unlikely to react with
PER at rates approaching those of hydroxyl radicals or chlorine atoms, based on their known
abundances and rate constants for reaction with PER (Franklin, 1994; Wiedmann et al, 1994).
Gas-phase photolysis may make a significant contribution, in addition to reaction with the hydroxyl
radical, to the degradation of the small fraction of PER which reaches the stratosphere (Kindler et al,
1995). The lifetime of PER with respect to photolysis was calculated by Krüger et al (1987) to be
approximately 3 years at an altitude of 20 km (stratosphere), but would be very much longer at
tropospheric altitudes, so photolysis would be negligible in the troposphere.
On account of its high vapour pressure, PER will not partition to any appreciable extent onto particulate
matter present in the atmosphere. Heterogeneous (photo)catalytic degradation is therefore not
envisioned here as a possible sink.
Besemer et al (1984) concluded, on the basis of a methodology developed by Cupitt (1980), that “rainout”
of PER is a negligible tropospheric removal process compared to chemical degradation. This conclusion
has also been stated by Wiedmann et al, 1994. Furthermore, the latter authors presented data
suggesting that uptake by the oceans is either small or completely negligible.

178 ECETOC Joint Assessment of Commodity Chemicals No. 39
A.2 OVERALL LIFETIME, BUDGET CALCULATIONS, LONG-RANGETRANSPORT
As stated above, the calculated lifetime of PER with respect to reaction with the hydroxyl radical in the
troposphere is 0.32 years. Allowing for a possible small contribution to degradation by reaction with the
chlorine atom (assumed yield 13%; see Section A.1.2), the calculated overall lifetime could be somewhat
lower, approximately 0.28 years.
The atmospheric lifetime of PER can also be deduced, in an independent manner, from observed
atmospheric concentrations and assumed or estimated atmospheric emission fluxes. The following
overall lifetimes were obtained in this manner: 0.38 years (Class and Ballschmiter, 1987), 0.38 years
(Kindler et al, 1995) and 0.45 years (Wang et al, 1995).
Other authors have performed similar “budget” calculations, but proceeded somewhat differently: they
predicted the atmospheric concentrations of PER from assumed or estimated emission fluxes and
degradation rates and then compared the calculated concentrations with the observed ones (Derwent
and Eggleton, 1978; Altshuller, 1980; Koppmann et al, 1993; Wiedmann et al, 1994; Kindler et al, 1995;
McCulloch and Midgley, 1996).
Broadly speaking, all these budget analyses demonstrate that the observed atmospheric background
concentrations and their geographical distribution are consistent with the assumption that reaction with
the hydroxyl radical in the troposphere is the dominant atmospheric sink for PER. As discussed in
Section A.1.2, the modelling studies of Rudolph et al (1996), Aucott (1997) and Singh et al (1996b)
demonstrate that the reaction with Cl is likely to be a minor sink and that there may be a rather significant
natural input of PER into the atmosphere from the oceans.
The above-mentioned calculations were performed with atmospheric models of varying degrees of
sophistication (one-, two-, multi-compartment, or global 2-dimensional models) and with input parameters
(emission fluxes, atmospheric concentrations, inter-compartment exchange times, etc.) which have
become increasingly better defined in recent years. Thus, for example, the global anthropogenic
emission fluxes of PER and their geographical distribution have recently been deduced from audited
production and sales data provided by members of trade associations in the USA, Europe and Japan,
together with estimates for other countries (McCulloch and Midgley, 1996).
The overall lifetime of PER (0.3 - 0.4 y) is relatively long compared to the intra-hemispheric mixing time of
approximately 1 month, so transport can occur to regions far removed from the emission source. It is,
however, fairly short relative to the inter-hemispheric transport time of 1 - 1.5 years, resulting in higher
concentrations in the northern hemisphere, where > 98% of the emissions occur (McCulloch and
Midgley, 1996).
Tetrachloroethylene 179
The existence of higher background concentrations in the northern hemisphere (average approximately
10 - 20 pptv; 68.9 - 138 ng/m3) than in the southern hemisphere (average approximately 2 - 3 pptv; 14 -
21 ng/m3) is well documented (Singh et al, 1983; Class and Ballschmiter, 1987; Koppmann et al, 1993;
Wiedmann et al, 1994; Wang et al, 1995; Rudolph et al, 1996).
The lifetimes given above are average ones. The spatially and temporally varying “oxidising power” of
the atmosphere (change in the OH concentration as the intensity of sunlight and water content vary)
leads to a geographical and seasonal variation of the lifetime of PER and its concentration, particularly
marked in the northern hemisphere (Singh et al, 1977; Makide et al, 1987; Koppmann et al, 1993; Wang
et al, 1995; Rudolph et al, 1996; Yokouchi et al, 1996). This can lead to a longer lifetime - and hence a
greater potential for long-range transport - when the oxidising power of the atmosphere is low, e.g. in the
winter months.
A.3 DEGRADATION MECHANISM AND NATURE OF PRODUCTS FORMED A.3.1 Simulated Atmospheric Studies
A number of studies have been carried out with PER under “simulated atmospheric conditions” in order
to attempt to determine the nature of the products formed and elucidate the degradation mechanism.
The products observed by different authors are summarised in Table A.1.
It must be emphasised that great caution is required in interpreting the data provided by simulated
atmospheric experiments. An analysis of the validity of such experiments, for predicting both the
atmospheric lifetime and the nature of the breakdown products, is given by Dilling (1982). Deviations
from actual tropospheric conditions must be taken into account in order to propose likely breakdown
pathways in the real environment, as discussed below.
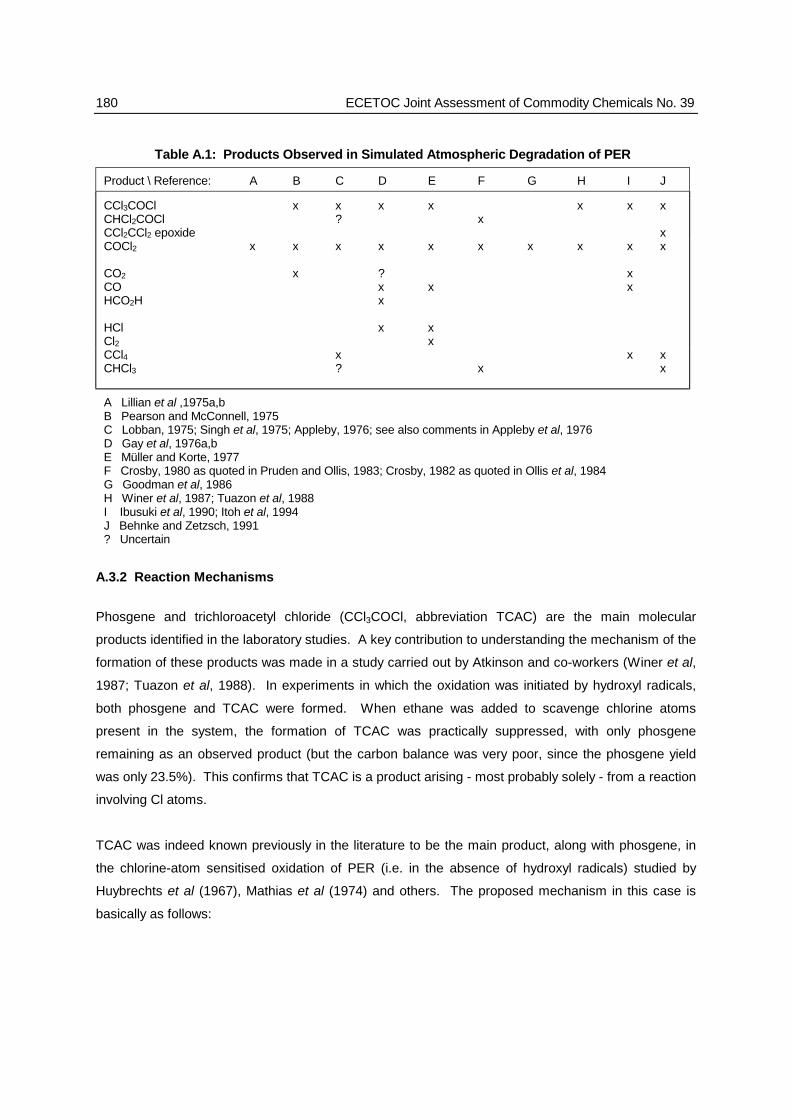
180 ECETOC Joint Assessment of Commodity Chemicals No. 39
Table A.1: Products Observed in Simulated Atmospheric Degradation of PER
Product \ Reference: A B C D E F G H I J
CCl3COClCHCl2COClCCl2CCl2 epoxide
x x?
x xx
x x x
xCOCl2
CO2
COHCO2H
HClCl2
x x
x
x x
?xx
x
x
x
xx
x x x x
xx
x
CCl4CHCl3
x? x
x xx
A Lillian et al ,1975a,bB Pearson and McConnell, 1975C Lobban, 1975; Singh et al, 1975; Appleby, 1976; see also comments in Appleby et al, 1976D Gay et al, 1976a,bE Müller and Korte, 1977F Crosby, 1980 as quoted in Pruden and Ollis, 1983; Crosby, 1982 as quoted in Ollis et al, 1984G Goodman et al, 1986H Winer et al, 1987; Tuazon et al, 1988I Ibusuki et al, 1990; Itoh et al, 1994J Behnke and Zetzsch, 1991? Uncertain
A.3.2 Reaction Mechanisms
Phosgene and trichloroacetyl chloride (CCl3COCl, abbreviation TCAC) are the main molecular
products identified in the laboratory studies. A key contribution to understanding the mechanism of the
formation of these products was made in a study carried out by Atkinson and co-workers (Winer et al,
1987; Tuazon et al, 1988). In experiments in which the oxidation was initiated by hydroxyl radicals,
both phosgene and TCAC were formed. When ethane was added to scavenge chlorine atoms
present in the system, the formation of TCAC was practically suppressed, with only phosgene
remaining as an observed product (but the carbon balance was very poor, since the phosgene yield
was only 23.5%). This confirms that TCAC is a product arising - most probably solely - from a reaction
involving Cl atoms.
TCAC was indeed known previously in the literature to be the main product, along with phosgene, in
the chlorine-atom sensitised oxidation of PER (i.e. in the absence of hydroxyl radicals) studied by
Huybrechts et al (1967), Mathias et al (1974) and others. The proposed mechanism in this case is
basically as follows:
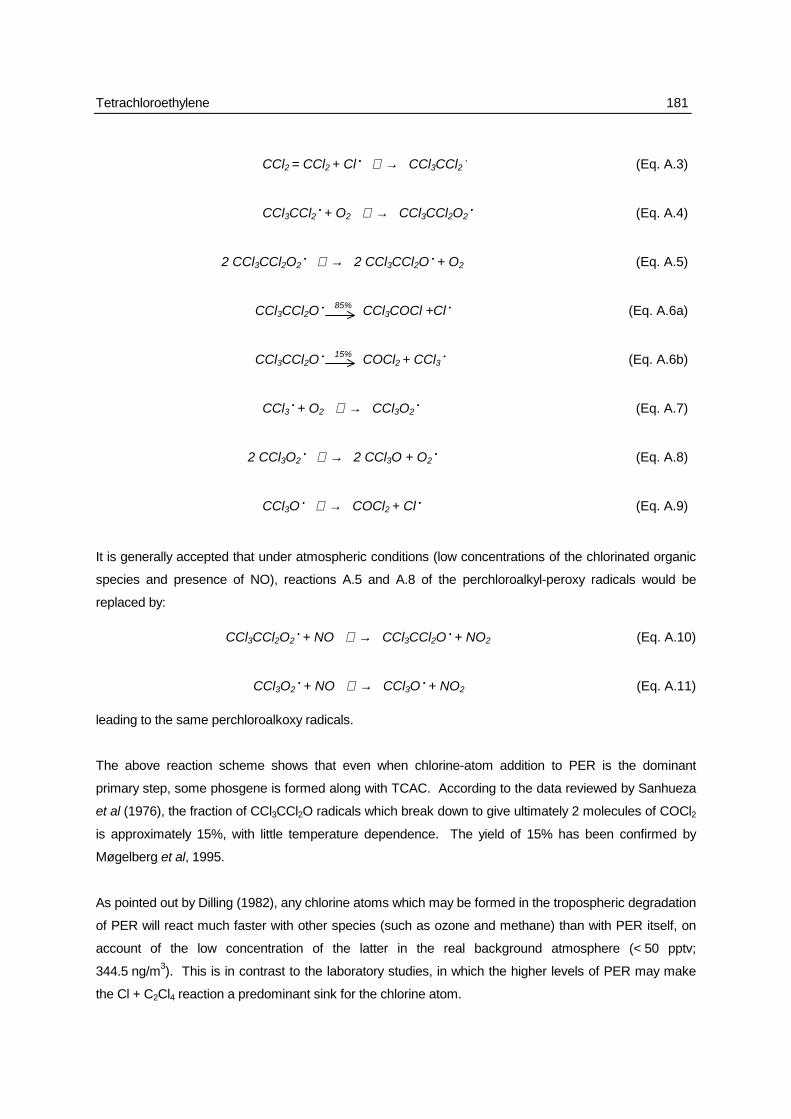
Tetrachloroethylene 181
It is generally accepted that under atmospheric conditions (low concentrations of the chlorinated organic
species and presence of NO), reactions A.5 and A.8 of the perchloroalkyl-peroxy radicals would be
replaced by:
CCl3CCl2O2!!!! + NO → CCl3CCl2O!!!! + NO2 (Eq. A.10)
CCl3O2!!!! + NO → CCl3O!!!! + NO2 (Eq. A.11)
leading to the same perchloroalkoxy radicals.
The above reaction scheme shows that even when chlorine-atom addition to PER is the dominant
primary step, some phosgene is formed along with TCAC. According to the data reviewed by Sanhueza
et al (1976), the fraction of CCl3CCl2O radicals which break down to give ultimately 2 molecules of COCl2
is approximately 15%, with little temperature dependence. The yield of 15% has been confirmed by
Møgelberg et al, 1995.
As pointed out by Dilling (1982), any chlorine atoms which may be formed in the tropospheric degradation
of PER will react much faster with other species (such as ozone and methane) than with PER itself, on
account of the low concentration of the latter in the real background atmosphere (< 50 pptv;
344.5 ng/m3). This is in contrast to the laboratory studies, in which the higher levels of PER may make
the Cl + C2Cl4 reaction a predominant sink for the chlorine atom.
CCl2 = CCl2 + Cl!!!! → CCl3CCl2! (Eq. A.3)
CCl3CCl2!!!! + O2 → CCl3CCl2O2!!!! (Eq. A.4)
2 CCl3CCl2O2!!!! → 2 CCl3CCl2O!!!! + O2 (Eq. A.5)
CCl3CCl2O!!!! 85% CCl3COCl +Cl!!!! (Eq. A.6a)
CCl3CCl2O!!!! 15% COCl2 + CCl3!!!! (Eq. A.6b)
CCl3!!!! + O2 → CCl3O2!!!! (Eq. A.7)
2 CCl3O2!!!! → 2 CCl3O + O2!!!! (Eq. A.8)
CCl3O!!!! → COCl2 + Cl!!!! (Eq. A.9)

182 ECETOC Joint Assessment of Commodity Chemicals No. 39
When conditions are such that addition of hydroxyl radicals to PER:
CCl2 = CCl2 + !!!!OH → HOCCl2CCl2!!!! (Eq. A.1)
is the predominant primary step, the precise nature of the ensuing steps has not been clearly established.
Initial products formed subsequent to the addition of OH to PER, in the absence of oxygen, have been
investigated by mass spectrometry (Kirchner, 1983; Kirchner et al, 1990; Helf, 1990). According to the
proposed mechanism, the chemically activated adduct initially formed in reaction (A.1) can be stabilised
by collision with other molecules, or can lose a chlorine atom to give either the unstable trichloroethenol
(A.12a) or dichloroacetyl chloride (A.12b), or undergo C-C cleavage to yield phosgene (A.12c):
HOCCl2CCl2!!!! → C(OH)Cl = CCl2 + Cl!!!! (Eq. A.12a)
HOCCl2CCl2!!!! → CHCl2COCl + Cl!!!! (Eq. A.12b)
HOCCl2CCl2!!!! → COCl2 + CHCl2!!!! (Eq. A.12c)
The extent to which such reactions may occur under atmospheric conditions depends on their rates
relative to that of the competing reaction:
HOCCl2CCl2!!!! + O2 → HOCCl2CCl2O2!!!! (Eq. A.13)
However, while the rate constant for reaction (A.13) may be estimated to lie between 10–12 and 10–11 cm3
molecule–1 s–1, under atmospheric conditions, no kinetic data on reactions (A.12a), (A.12b) and (A.12c)
are available. Atkinson (1986, p. 131) has nevertheless pointed out that reaction (A.1) is exothermic by
approximately 35 kcal mol–1, while reaction (A.12a) is endothermic by only approximately 11 kcal mol–1,
so the combination of the two processes is thermodynamically favourable.
Howard (1976) also postulated the occurrence of reactions (A.1), (A.12a) and (A.13) in the atmospheric
breakdown mechanism, reaction (A.13) being followed by reactions (A.14 + A.15) and (A.16 + A.17):
HOCCl2CCl2O2!!!! + NO → HOCCl2CCl2O! + NO2 (Eq. A.14)
HOCCl2CCl2O!!!! → HOCCl2COCl + Cl!!!! (Eq. A.15)
HOCCl2COCl + !!!!OH → !!!!OCCl2COCl + H2O (Eq. A.16)
OCCl2COCl → COClCOCl + Cl!!!! (Eq. A.17)
This speculative mechanism would lead to the formation of oxalyl chloride, which however has never
been reported in product studies.
Tetrachloroethylene 183
Graedel (1978, personal communication as quoted in Chen et al, 1983), suggested a more plausible
sequence, consisting of reactions (A.1), (A.13) and (A.14), followed by:
HOCCl2CCl2O!!!! → HOCCl2!!!! + COCl2! (Eq. A.18)
HOCCl2!!!! + O2 → COCl2 + HO2!!!! (Eq. A.19)
Reactions (A.18) and (A.19) would explain the formation of phosgene reported by Tuazon et al (1988) as
the major observed product in the presence of chlorine-atom scavengers.
It has recently been confirmed that in systems free from chlorine atoms, the yield of C2 products in the
OH-initiated oxidation of PER is negligible (Manning et al, 1996).
A.3.3 Formation of Carbon Tetrachloride and Chloroform
The mechanisms presented so far do not explain the formation of carbon tetrachloride and chloroform.
Carbon tetrachloride, an ozone-depleting substance, was observed in three series of studies, all of which
were carried out in smog chambers, at ppm levels of PER and in the presence of simulated sunlight
(Singh et al, 1975; Lobban, 1975; Appleby, 1976; Behnke and Zetzsch, 1991; Ibusuki et al, 1990; Itoh et
al, 1994).
The first such report was by Singh and co-workers (Singh et al, 1975; Lobban, 1975; Appleby, 1976),
who observed the formation of phosgene, TCAC and possibly dichloroacetyl chloride (DCAC) and
chloroform (although the latter two compounds were later stated by Appleby et al, 1976, not to be present
in significant amounts), together with carbon tetrachloride (CCl4). These investigators noted that CCl4
concentrations continued to increase well after all the PER had been consumed. At the same time, the
initially formed TCAC continued to react, suggesting its role as the precursor of CCl4. While phosgene
was the main product, the formation of CCl4 represented approximately 8% by weight relative to the initial
PER, after 1 week of reaction.
In order to investigate CCl4 formation further, two additional smog-chamber studies were initiated in 1990.
Behnke and Zetzsch (1991) performed experiments both in the absence and in the presence of added
ethane as a scavenger for chlorine atoms, and monitored chlorine-atom and hydroxyl-radical
concentrations using a hydrocarbon tracer technique. This work led to the following results:
! CCl4 was indeed observed, albeit in considerably lower yields than those reported by Singh and co-
workers (maximum approximately 2%, instead of 8%);
184 ECETOC Joint Assessment of Commodity Chemicals No. 39
! a good correlation was established between the amount of CCl4 formed and the calculated amount of
PER having reacted with chlorine atoms, suggesting that CCl4 is a product of the chlorine-atom
initiated degradation pathway;
! the rate of CCl4 formation increased with time, from an initial value of zero, showing that it is not a
primary product of PER oxidation.
In order to check the hypothesis (Singh et al, 1975; Appleby, 1976) that TCAC is the precursor of CCl4,
Behnke and Zetzsch (1991) performed experiments on the photolysis of ppm levels of TCAC in air and
found that:
! CCl4 was indeed formed as a minor product, the major one being phosgene;
! the rate of formation of CCl4 increased with rising relative humidity;
! photolysis of TCA, the hydrolysis product of TCAC, also led to CCl4 and in this case the yield was
further enhanced by the addition of gaseous HCl or NaCl aerosol.
These observations suggested that CCl4 was formed by a heterogeneous photochemical process,
occurring on the reactor walls or on the surface of the aerosols, in which TCA and chloride ion were
probably the precursors of CCl4.
From experiments on the photolysis of TCAC, carried out in the presence of the lowest amount of
humidity possible, to prevent hydrolysis to TCA, Behnke and Zetzsch (1991) estimated an upper limit of
0.003 for the quantum yield of the hypothetical homogeneous gas-phase formation of CCl4 from TCAC
itself:
CCl3COCl + hν → CCl4 + CO (Eq. A.20)
analogous to the postulated (Yung et al, 1975; Chang and Kaufman, 1977) but not demonstrated
photolysis of DCAC to chloroform:
CHCl2COCl + hν → CHCl3 + CO (Eq. A.21)
DCAC does indeed seem to have been formed in certain laboratory studies on the oxidation of PER
(Singh et al, 1975; Appleby, 1976; Crosby, 1980 as quoted in Pruden and Ollis, 1983; Crosby, 1982 as
quoted in Ollis et al, 1984), albeit in low yields (Appleby et al, 1976). Thus reaction (A.21), occurring
either homogeneously or heterogeneously, might explain the formation of chloroform reported by some of
the groups of investigators (Singh et al, 1975; Appleby, 1976; Crosby, 1980 and 1982; Behnke and
Zetzsch, 1991) as a minor product (Appleby et al, 1976).
Behnke and Zetzsch (1991) estimated that the overall yield of CCl4 from PER in the homogeneous gas-
phase atmosphere would be less than 0.1%.

Tetrachloroethylene 185
Ibusuki and co-workers (Ibusuki et al, 1990; Itoh et al, 1994), who conducted a smog-chamber study of
the OH-initiated oxidation of PER in the absence of chlorine-atom scavengers, observed that the main
oxidation products were TCAC, COCl2, CO and CO2. The yield of CCl4 was typically only 0.07% and the
formation of chloroform was not reported. Ibusuki and co-workers confirmed the conclusions of Behnke
and Zetzsch (1991) that CCl4 is not a primary product, but arises from the photochemical degradation of
TCAC and thus is a low-yield product of the chlorine-atom initiated degradation pathway.
Based on the understanding of the degradation mechanism provided by the studies discussed above, it is
concluded that the amount of CCl4 formed by degradation of PER in the real atmosphere, if it is formed at
all, will depend on the relative rates of various processes in competition with each other (Franklin, 1994):
! Attack on PER by chlorine atoms, rather than by hydroxyl radicals (as only the former can ultimately
give appreciable yields of TCAC, according to Tuazon et al, 1988 and Manning et al, 1996). The yield
of this process is assumed to be 13% (Section A.1.2).
! Dissociation of the intermediate pentachloroethoxy radical to TCAC rather than to phosgene. The
TCAC yield is 85% (Section A.3.2).
! Photolysis of TCAC, rather than destruction of TCAC by hydrolysis subsequent to uptake by cloud
droplets or deposition to the ocean or land surface. TCAC is hydrolysed only very slowly in the
homogeneous gas phase (Butler and Snelson, 1979) but its lifetime with respect to uptake from the
atmosphere to liquid water (clouds, oceans) is estimated to be of the order of 20 days (Kindler et al,
1995). Its lifetime with respect to photolysis, assuming a quantum yield of unity, has been variously
estimated to be 6 days (WMO, 1994, p. 12.12) or approximately 50 days (Behnke and Zetzsch, 1991).
Conservatively adopting the faster rate, photolysis could represent up to 77% of the overall removal
of TCAC.
! Photolysis of TCAC to CCl4 (quantum yield < 0.003, see above), rather than to phosgene (major
product in air).
Thus the overall yield of CCl4 from PER in the atmosphere is likely to be less than 0.13 x 0.85 x 0.77 x
0.003 x 100%, i.e. < 0.03%.
A.4 EFFECT ON STRATOSPHERIC OZONE DEPLETION
A rough estimate of the contribution of PER to stratospheric ozone depletion may be obtained by
assessing its share of total atmospheric chlorine loading. As stated above (Section A.2), the atmospheric
concentrations of PER are much higher in the northern hemisphere than in the southern hemisphere.
186 ECETOC Joint Assessment of Commodity Chemicals No. 39
However, recent measurements by three groups give similar values for the global weighted-mean
ground-level concentration: 8.5 pptv (58.6 ng/m3) (Wiedmann et al, 1994), 7.3 pptv (50 ng/m3) (Wang et
al, 1995) and 8.4 pptv (58 ng/m3) (Rudolph et al, 1996). Thus PER contributes approximately
8 x 4 = 32 pptv (220.5 ng/m3) to tropospheric Cl loading.
In early 1996, the total chlorine loading of the troposphere was roughly 3,000 pptv (20,670 ng/m3)
(Montzka et al, 1996), so PER represented only approximately 1% of this total and hence it may be
concluded that, roughly speaking, PER contributes approximately 1% to current ozone depletion. This
calculation could be refined by :
! expressing the contribution of PER and other substances (including bromine compounds) in terms of
“equivalent effective stratospheric chlorine loading” (Montzka et al, 1996);
! taking into account the fact that approximately a quarter of the contribution to reactive halogen loading
is due to naturally occurring substances (CH3Cl and CH3Br).
These refinements would not have a very great impact on the estimate of the contribution of PER to the
total amount of ozone-depleting species of anthropogenic origin.
WMO (1994, p. 13.8) concluded, on a similar basis to the one developed above, that PER probably
contributes little to contemporary stratospheric chlorine loading, but hinted that future growth in emissions
might pose a problem. However, as shown by McCulloch and Midgley (1996), emissions actually
decreased by 35% between 1988 and 1992. They are expected to decline further in the future as a result
of improved working practices.
Wang et al (1995) expressed the contribution of PER to stratospheric chlorine loading as follows: “... the
transport of [organochlorine] molecules from the troposphere to the stratosphere takes place almost
entirely through the tropical tropopause. Because the typical mixing ratios in the tropics in all seasons are
around 5 pptv of CCl2=CCl2 or 20 pptv of Cl, the fraction of the current 4,000 pptv of tropospheric
organochlorine attributable to CCl2=CCl2 as a source is approximately 0.5%. The delivery of only 20 pptv
Cl to the stratosphere from yearly atmospheric emissions of approximately 400 kilotons contrasts
strikingly with the delivery of more than 1,000 pptv Cl from CCl2F2 (2 Cl atoms x 500 pptv mixing ratio)
from the accumulation from yearly emissions over the 1970’s and the 1980’s of approximately 400
kilotons/year.”
It would not seem meaningful to attempt to calculate an Ozone Depleting Potential (ODP) for PER using
a 2-dimensional modelling approach, as has been done for chlorofluorocarbons, hydrochloro-
fluorocarbons and other compounds. Indeed, PER has such a short atmospheric lifetime (0.3 - 0.4 y)
that its concentration varies considerably from one point of the Earth’s surface to another; it also falls off
significantly between ground level and the tropopause (Blake et al, 1996). Thus calculation of an ODP
Tetrachloroethylene 187
would require 3-dimensional (altitude, latitude, longitude) modelling and the result obtained would depend
to some extent on the point and time of emission to the atmosphere.
The ODPs reported by Kindler et al (1995) are in fact not model-calculated ODPs, but corrected Chlorine
Loading Potentials (CLPs). The CLP is a quantity that can easily be calculated from the atmospheric
lifetime and chlorine content of a compound. In some cases, it is a good approximation to the ODP.
Assuming an atmospheric lifetime of 0.32 years, the (uncorrected) CLP of PER would be 0.007. An
important conclusion of the Kindler et al (1995) paper is that any phosgene formed during the
stratospheric degradation of PER is sufficiently stable in the lower stratosphere to be partially removed by
transport to the troposphere, where it is destroyed by hydrolysis. Thus, not all the chlorine contained in
the already small fraction of PER reaching the stratosphere (1.6% of ground-level emissions, according
to Kindler et al, 1995, which confirms the value reported by Derwent and Eggleton, 1978) is actually
converted into ozone-depleting inorganic chlorine species. This led to a downward correction of the CLP
to 0.006 in the study by Kindler et al (1995), who assumed a 23.5% yield for the production of phosgene
from PER on reaction with OH, based on the laboratory study by Tuazon et al (1988). If the actual
phosgene yield were higher, the downward correction to the CLP would be even greater. However, it
should be emphasised that the concept of CLPs (like ODPs) was developed for longer-lived substances
than PER and it is not appropriate for compounds that do not become more or less uniformly distributed
in the troposphere.
Kindler et al (1995) also concluded that :
! only approximately 0.4% of the phosgene produced in the troposphere by the breakdown of PER
avoids removal by wet or dry deposition and subsequent hydrolysis and is transported to the
stratosphere;
! stratospheric chlorine loading from any TCAC which might be formed as a product of the degradation
of PER would be insignificant.
The possible formation of CCl4, an ozone-depleting substance, in the atmospheric oxidation of PER, has
been discussed in Section A.3.3. It would appear likely that only a very small proportion of PER
(< 0.03%) is converted into CCl4.
A.5 EFFECT ON TROPOSPHERIC OZONE FORMATION (PHOTOCHEMICALSMOG)
Certain organic air pollutants known as VOCs (Volatile Organic Compounds) lead to the production of
excess tropospheric ozone and other oxidants (“O3/Ox”) in the presence of sunlight and nitrogen oxides
(NOx). This phenomenon occurs particularly in or near urban areas, on account of high precursor
concentrations and it leads to episodes of “photochemical smog”. The degree to which individual
pollutants contribute to such smog depends essentially on how fast the pollutants react in the
188 ECETOC Joint Assessment of Commodity Chemicals No. 39
troposphere to give organic free radicals. Only the more reactive compounds make a significant
contribution.
PER, while being reactive enough to be almost completely degraded in the troposphere, is sufficiently
long-lived to be transported away from the polluted urban boundary layer and dispersed before being
oxidised. For this reason it makes only a negligible contribution to local tropospheric O3/Ox production.
Dimitriades et al (1983) reviewed and analysed existing evidence on photochemical O3/Ox production by
PER and concluded that PER is less “photochemically reactive” than ethane. Since ethane was itself
considered by EPA to have a negligible reactivity and was one of the compounds exempted from
regulation under State Implementation Plans to attain national ambient air quality standards for ozone,
EPA proposed in 1983 to add PER to the list of substances exempted from being considered, as VOCs
(US-EPA, 1996). A final rule exempting PER was published recently (US-EPA, 1996).
Derwent and Jenkin (1991) defined a Photochemical Ozone Creating Potential (POCP) for ranking
various organic pollutants, assigning a value of 100 for the POCP of ethylene. By means of modelling
studies, these authors concluded that “as a class the chlorocarbons show exceedingly low POCPs,
illustrating their value as solvents with low ozone forming potentials”. The POCP of PER was found to be
roughly 0.5 (compared to 8.2 for ethane). Derwent and Jenkin (1990) showed that for a typical polluted
air mass traversing southern England, the individual calculated contribution of PER was less than 0.06%
of total ozone formation due to various classes of hydrocarbons, ketones, alcohols and esters.
POCP values derived by Andersson-Sköld et al (1992) are somewhat higher (0.7 - 1.4 relative to 100 for
ethylene), but still point to the very low photochemical reactivity of PER.
A.6 OTHER EFFECTS OF REACTION PRODUCTS
A.6.1 Chloride
The atmospheric oxidation of PER leads, via the formation of intermediates such as phosgene and
possibly small amounts of TCAC, to the presence of hydrochloric acid in clouds, rain and the oceans.
Assuming that all the chlorine in the estimated global emissions of 295 kt/y (1992 figure from McCulloch
and Midgley, 1996) is converted into HCl (260 kt/y), the amount of chloride deposited in this manner is
negligible (< 0.003%) compared to the natural atmospheric chloride flux of around 10 Gt/y, primarily from
sea-salt aerosols (Graedel and Keene, 1995).
A.6.2 Acidity
The main precursors of acid rain are sulphur dioxide (SO2) and nitrogen oxides (NOx). The current global
natural and anthropogenic emissions of SO2 and NOx correspond to an amount of sulphuric and nitric
Tetrachloroethylene 189
acids of the order of 1013 mol H+/y (Galloway, 1995). This is 1400 times greater than the acidity due to
the HCl formed by the degradation of PER, on a global scale. Furthermore, since PER has a lifetime of a
few months and is therefore dispersed before being oxidised, it will not contribute to high local acidity in
rainwater, near the emission sources.
A.6.3 Phosgene
PER is one of several anthropogenic and natural sources of phosgene in the atmosphere (Wilson et al,
1988; Kindler et al, 1995). It appears unlikely that the very low tropospheric concentrations of this
compound, i.e. less than 30 pptv (207 ng/m3), will cause any direct effects on animal or plant life.
Phosgene hydrolyses in the environment to CO2 and HCl.
A.6.4 Trichloroacetic Acid
Chloroacetic acids, including TCA, are found to be widespread in rainwater, surface waters, vegetation
and soil. It has been postulated by a number of groups of researchers that these compounds arise from
the atmospheric degradation of chlorinated solvents, including PER (see, for example: Frank, 1988,
1989, 1990, 1991; Frank and Frank, 1990; Frank and Scholl, 1990; Frank et al, 1989a,b, 1990, 1993,
1995; Reimann et al, 1996; Bauer, 1991; Plümacher and Schröder, 1994; Fillibeck et al, 1995; Juuti et al,
1996; and references cited therein). Furthermore, in a number of these papers, it is suggested that there
is a causal link between forest decline and uptake of TCA by foliage.
Available evidence leads to the conclusion that TCA is likely to be only a rather minor product of the
atmospheric degradation of PER.
As has been discussed above (Section A.3.2), TCAC - the possible precursor of TCA in the atmosphere -
is almost certainly a product of the chlorine-atom initiated degradation of PER alone, and not of the
predominant hydroxyl-radical initiated breakdown mechanism. The Cl-atom pathway is calculated to
represent approximately 13% of the overall free-radical attack of PER (Section A.1.2). An estimated 85%
of any pentachloroethyl radicals formed by Cl-atom addition will be converted ultimately to TCAC (Section
A.3.2). The fraction of TCAC which is taken up by cloud droplets and hydrolysed to TCA can be
estimated by assuming that the lifetime of TCA with respect to aqueous uptake is 20 days and its lifetime
with respect to photolysis is approximately 17 days (the geometric mean of 6 and 50 days, see Section
A.3.3), so that 46% of the TCAC is hydrolysed to TCA (and 54% photolysed to phosgene). Thus the best
estimate of the overall conversion of PER to TCA is 0.13 x 0.85 x 0.46 = 5%; the uncertainty on this
figure is very great. If one combines individual uncertainties on rate constants for reaction of PER with
Cl and OH, atmospheric abundances of Cl and OH, yield of TCAC from the CCl3CCl2O radical, and
lifetimes of TCAC with respect to aqueous uptake and photolysis, then the overall yield of TCA from
PER could range between 0.1% and 33%. It should also be noted that these figures represent global
average values, while there may be considerable local and temporal variations.
190 ECETOC Joint Assessment of Commodity Chemicals No. 39
A rough “order-of-magnitude” check on whether the atmospheric degradation of PER might account
for a significant part of the levels of TCA observed in precipitation can be performed by making the
following assumptions :
! the background concentrations of PER in the middle and high latitudes of the northern and
southern hemispheres are 15 and 2.5 pptv (103.4 and 17 ng/m3), respectively (see references in
Section A.2);
! the rate constants for reaction of PER with OH and Cl are 1.23 x 10⁻¹³ and
4 x 10 11 cm3 molecule 1 s–1 respectively, at an effective mean atmospheric temperature of 277 K;
! the global-mean atmospheric concentrations of OH and Cl are respectively 106 and
500 molecules cm–3;
! the overall yield of TCA from PER is 5%;
! degradation of PER occurs in the troposphere, between the earth’s surface and 10 km altitude at a
mean pressure of 0.6 atm and an effective temperature of 277 K;
! any TCAC formed is scavenged by precipitation and hydrolysed to TCA;
! the total world-wide precipitation (5 x 10¹⁴ t/y) is assumed to be distributed uniformly over the
earth’s surface, corresponding to an annual depth of 1 m of rainfall or the equivalent of snow.
These assumptions lead to the following results :
! the rate of degradation of PER is 2.3 x [P] molecule cm–3 s–1, where [P] (pptv) is the local
concentration of PER
! the amount of PER degraded in a column having a cross-section of 1 m2 and extending up to
10 km altitude, is 1.2 x 10⁻⁶ x [P] mol/y
! the amount of TCA formed in such a column is 1.0 x 10⁻¹¹ x [P] t/y (5% yield). Its concentration in
the corresponding precipitation (1 t/y) is 10 x [P] ng/l.
The TCA concentrations anticipated in precipitation are therefore 150 and 25 ng/l, in the middle to high
latitudes of the northern and southern hemisphere, respectively. These calculated values are based
on the hemispheric background concentrations of PER, while local tropospheric concentrations of
PER may be considerably higher, even in rural air (Table 8).
For comparison, TCA concentrations observed in precipitation are as follows:
! 115 “open-field” values ranging from < 30 to 840 ng/l, with a median of 120 ng/l, in southern
Germany (Schleyer et al, 1996);
! mean “open-field” concentrations for 9 rural observation stations in southern Germany varying
between 170 and 280 ng/l (maximum concentrations from 330 to 540 ng/l), with an overall average
of 200 ng/l (Fillibeck et al, 1995);
! monthly means of 50 to 350 ng/l in Zürich and 0 to 350 ng/l in a rural location in Switzerland
(Reimann et al, 1996);
Tetrachloroethylene 191
! mean concentrations in Zürich and Dübendorf (Switzerland) of 280 and 320 ng/l, respectively
(Müller et al, 1996);
! 26 values varying from 0 to 55 ng/l in the Russian tundra and in northern Norway and Sweden, i.e.
at latitudes of 63 - 78°N (Grimvall et al, 1995);
! levels of 0 to 45 ng/l for 4 samples taken in British Columbia, at 50 - 52°N (Grimvall et al, 1995);
! 6 values ranging from 20 to 120 ng/l in Antarctica (Grimvall et al, 1995).
While the TCA concentrations in rain over central Europe are broadly consistent with the assumption
that TCA is formed from atmospheric PER with a yield of approximately 5%, the values observed in
both the high-latitude northern hemisphere and in British Columbia are lower than one would expect
on this basis, while the values observed in Antarctica are higher.
More detailed modelling than the rough “hemispheric-average” calculation performed here would be
required to confirm the possible relationship between PER and TCA.
The extremely high TCA levels in soil reported by Frank (1988), namely 20 - 400 µg/kg at 20 cm depth in
southern Germany, could in no way be explained either by input from rainfall or production from the
degradation of PER, if these levels were typical of soils in general. This can be demonstrated by the
following conservative calculation. Assuming that:
! TCA, at a steady-state concentration of 100 µg/kg, is physically confined to the top 20 cm-layer of soil
(unlikely for a fully-ionised, hydrophilic, substance);
! TCA is microbially or chemically degraded in soil with a lifetime of 90 days (upper limit given by
Worthing and Walker, 1987);
! annual rainfall is 80 cm and soil density is 2,000 kg/m3;
then the rainwater concentration necessary to sustain the reported soil concentration would be
approximately 100 µg/l, i.e. roughly 1,000 times greater than the levels actually observed in rainwater,
and corresponding (if TCA is present in northern hemisphere precipitation alone and is uniformly
distributed) to a total deposition flux of 50 Mt TCA/y.
192 ECETOC Joint Assessment of Commodity Chemicals No. 39
APPENDIX B. AQUATIC FATE OF TETRACHLOROETHYLENE
(ABIOTIC PROCESSES)
The abiotic processes which may be expected, a priori, to contribute to removal of PER from aqueous
media are: volatilisation, chemical (or photochemical) reaction and sorption. However, in confined
groundwater, neither volatilisation nor photodegradation will occur.
B.1. VOLATILISATION
Owing to its high Henry's Law constant (Table 1), PER present in surface waters will partition
preferentially into the ambient air. Application of a Mackay Level 1 model leads to the conclusion that
99.45% of PER partitions to the air compartment (Ballschmiter, 1992). The rate of volatilisation is
discussed below.
B.1.1 Laboratory Studies
Dilling et al (1975) and Dilling (1977) carried out experiments with pure water containing 1 mg/l of PER,
stirred at 200 rpm in an open beaker in the presence of still air. The fall-off in the aqueous-phase
concentration followed a first-order rate law and the evaporation half-life of the solute was approximately
0.4 hours at 25°C and 0.6 hours at 1 - 2°C. Addition of various contaminants (clay, limestone, sand, salt,
peat moss, etc.) to the water had relatively little effect on the evaporation or disappearance rates of the
PER. When the aqueous solution was stirred only intermittently (15 s every 5 min), the volatilisation half-
life increased to over 1.5 hours.
Chiou et al (1980) performed laboratory experiments in a shallow dish (height 1.6 cm, diameter 5.2-cm)
With initial concentrations of 180 and 0.1 mg/l, respective volatilisation half-lives were 3.2 and 7 minutes
when the aqueous solution was stirred at 100 rotations/min (1.67 Hz) at 25°C. Without stirring (at the
lower concentration) the half-life increased to 69 minutes. Chiou et al (1980) provided a theoretical
model showing how, for relatively volatile solutes such as PER, mixing enhances the rate of volatilisation
by reducing the liquid layer concentration gradient.
Smith et al (1980) devised a method for predicting environmental volatilisation rates of chemicals such as
PER, from laboratory measurements. This method relies on measuring, in the laboratory, the ratio R of
the evaporation rate constant to the oxygen re-aeration rate constant. In experiments carried out in
stirred 1-litre or 2-litre beakers, PER volatilisation half-lives of 7.5 to 50 minutes were measured. The
ratio R was shown to be constant at 0.52 over a wide range of conditions. The PER volatilisation rate
constant in a natural water body can be obtained by measuring or estimating the oxygen re-aeration rate
constant under the relevant environmental conditions and multiplying by the factor R.
Tetrachloroethylene 193
Matter-Müller et al (1980, 1981) adopted a similar approach. Using a mechanically-stirred, surface-
aerated, 3-litre vessel at 25°C, they measured volatilisation half-lives of 14 and 47 min at 800 and 600
rotations/min (1,334 and 1000 Hz) respectively and showed that the ratio R of the mass-transfer rate
constant of PER to that of oxygen was 0.56. The presence of various types of surfactants was shown to
have little effect on this ratio.
Roberts and Dändliker (1983) operated with 7.3 litres of 5 mg/l aqueous solutions of PER at 20°C and
showed not only that the fall-off in concentration obeyed a first-order rate law, but that the overall mass-
transfer rate constant increased almost linearly with the specific power input to the agitator once the
turbulent regime was attained. Under the latter conditions, typical rather of mechanical aerators than of
environmental situations, half-lives between 3 minutes and 1 hours were measured. The ratio R was
found to be 0.61, practically independent of the mixing intensity.
Ince and Inel (1989) found R to be 0.53; they obtained a good correlation between the measured overall
liquid transfer coefficient and the one estimated from the two-film model.
Zytner et al (1989b) studied volatilisation of PER from unstirred aqueous solutions containing 19 to
75 mg/l of PER, in beakers having surface/volume ratios varying between 2 and 81 m–1, at 22°C. An air
velocity of 10 km/h was maintained above the solutions. The evaporation half-lives were found to
increase with decreasing surface/volume ratio; they ranged from 2 to 16 hours.
Chodola et al (1989) reported overall liquid-film transfer coefficients for PER at the water-air interface.
B.1.2 Large-Scale Experiments and Observations
Ruf and Scherb (1977a,b) reported on practical trials carried out by introducing mg/l levels of PER into a
1 km long, 18 cm deep artificial stream, (flow 0.5 m/s, water temperature 15-19°C). Samples were taken
at various points downstream of the injection point and half-lives were calculated from first-order plots of
the fall-off of the PER concentration. Although there was much scatter in the data, the half-lives were in
the range 0.2 to 3.6 hours.
Wakeham et al (1983) carried out measurements on solutions of a few mg/l of PER in an experimental
ecosystem or “mesocosm”, i.e. a tank containing 13 m3 of sea-water and its associated planktonic and
microbial communities. The tank was regularly mixed (4 x 2h/day). Half-lives of between 12 and 25 days
were measured and differences were attributed to variations in wind stress regime. It was concluded that
volatilisation appeared to be the dominant process and that biodegradation and sorption onto particles
were probably not important. In further mesocosm experiments of this type, but using 14C-labelled PER,
Wakeham et al (1986) confirmed that biodegradation was not a significant process.
194 ECETOC Joint Assessment of Commodity Chemicals No. 39
Namkung and Rittmann (1987) observed loss of volatile organic compounds from two waste-water
treatment plants using an activated sludge process with diffused aeration. They concluded that
volatilisation was the main loss process, adsorption being negligible (biodegradation was assumed from
other studies to be insignificant).
B.1.3 Field Observations
Zoeteman et al (1980) pointed out that evaporation is generally much slower in real surface waters than
in laboratory experiments. In fact liquid-phase resistance to evaporation dominates the mass transfer
rate for most hydrophobic pollutants. In rivers, the vertical transport of pollutants in the water phase is
mainly determined by eddies caused by the interaction of the current with the river bottom and thus
depends on the depth of the river. In lakes the turbulence originates from the atmosphere and the wind
speed is probably the dominant parameter. Field observations made by Zoeteman et al (1980) in Rhine
water in the Netherlands gave half-lives for PER (initial concentration around 1 µg/l) of approximately
10 days in river water and 1 month in lake water.
Somewhat lower half-lives in rivers (4 - 6 d) resulted from field observations on PER concentrations (1.4 -
3.6 µg/l) in the River Main (Germany) carried out in 1982 (Brüggemann and Trapp, 1988). The authors
of this study presented an equation, involving wind speed, water speed and river depth, for calculating the
evaporation rate. They concluded that volatilisation was the main loss process, chemical degradation
and burial with sediment being orders of magnitude slower. Subsequent measurements of PER in the
Main, carried out in 1989-1990, showed that the concentrations were then lower (0.05 - 0.3 µg/l), but the
calculated half-life was similar (3 - 5 d) (Trapp et al, 1992). Trapp and Harland (1995) derived, from the
1990 Main observations, a half-life for PER of 2 days. These authors also compared the experimental
results with those provided by four theoretical volatilisation models.
Dyrssen et al (1990) performed measurements of PER concentrations (up to 0.4 µg/l) along the estuary
of the River Elbe, showing that PER was supersaturated in the water and that evaporation to the
atmosphere was a rapid and favoured process.
Schwarzenbach et al (1979) measured PER concentrations (0.03 - 0.07 µg/l) as a function of depth in
Lake Zurich. The authors concluded that volatilisation was the dominant process for the removal of PER
and they estimated the transfer flux to the atmosphere.
B.2. CHEMICAL REACTION
The rate, mechanism and products of the hydrolysis of PER in aqueous solution have not been well
characterised. The existing data show, however, that PER reacts very slowly.
Tetrachloroethylene 195
McConnell et al (1975) and Pearson and McConnell (1975) reported an estimated (extrapolated) half-life
of 6 years, at an unspecified temperature. They stated that the rate of hydrolysis is not significantly pH-
dependent (at least in the neutral to acid range) and speculated that the observed degradation may have
occurred in the gas phase of the test bottles and may have been due to the presence of oxygen.
Dilling et al (1975) carried out reactivity studies with 1 mg/l of PER dissolved in water previously purged
with air, so that the molar ratio of dissolved oxygen to PER was over 40. Samples were maintained for
up to one year, either in sealed Pyrex tubes at approximately 25°C in the laboratory (and in the dark), or
in quartz tubes at approximately −20 to + 40°C outdoors (exposed to daylight). In each case there was a
large air space above the liquid in the tubes. The observed half-life was found to be approximately
9 months for the dark experiments and 6 months for the solutions exposed to daylight. It is quite
probable that reaction was not purely hydrolytic, but at least partly (photo)oxidative and may have
occurred in the head-space.
Jensen and Rosenberg (1975) measured the fall-off of the concentrations of PER dissolved at initial
levels of 0.1 to 1 mg/l in sea-water and maintained in the dark or in daylight in various open or closed
systems at 11 - 12°C. After 8 days the decrease in concentration was found to be 25 - 50%. In the case
of sterilised de-ionised water, on the other hand, there was no significant decrease after 8 days at 4 -
20°C. It was speculated that the difference in behaviour may have been due to “inorganic or biological
factors”.
Chodola et al (1989) carried out hydrolysis experiments in sealed vials with no head-space and observed
losses of up to 14% after 7 days at 50°C and pH 9.2.
Jeffers et al (1989) measured hydrolysis rate constants for PER between 130 and 170°C and at pHs of 2
to 14. Apparently no special precautions were taken to exclude traces of oxygen. Only a basic attack
was observed (first order in PER and first order in hydroxide ion); no evidence was found for a “neutral”
reaction (attack by H2O molecules) or for a process catalysed by the hydrogen ion. When the results
were extrapolated to 25°C and pH 7, the estimated half-life was found to be as long as 109 years.
Miyamoto and Urano (1996) maintained neutral aqueous solutions containing 0.1 - 1 mg/l of PER for
48 hours at 80°C and reported that the conversion was less than 10%. On the basis of an assumed
activation energy for hydrolysis (110 kJ/mol), they calculated a half-life of greater than 170 years at 15°C.
The above results suggest that PER might be very persistent in closed aqueous systems such as
groundwater, unless biodegradation is an important breakdown pathway.
On the other hand, Kohno et al (1995) monitored PER present in groundwater, over a period of more
than 5 years, and observed disappearance of this compound according to first-order kinetics, with a half-
196 ECETOC Joint Assessment of Commodity Chemicals No. 39
life of only 344 days. The physical, chemical or microbial processes contributing to removal of PER from
the groundwater were not identified.
As far as the nature of the hydrolysis products is concerned, little is known, but review articles report TCA
to be a product (Hardie, 1964; Callahan et al, 1979). This is somewhat surprising: if nucleophilic
substitution of the vinylic chlorine atoms occurs by attack of OH¯ or H2O and elimination of Cl¯ ,one
would expect it to be followed by an enol to keto tautomerisation to dichloroacetyl chloride and rapid
hydrolysis of the latter to dichloroacetic acid. TCA may have resulted from gas-phase oxidation to TCAC
(Section A.3.2), followed by hydrolysis of the latter.
For lack of experimental data, no in-depth attempt has been made here to assess the possible
importance of degradation reactions of PER in sunlit surface waters due either to direct photolysis or to
“indirect photolysis”, i.e. reactions initiated by humic or fulvic materials acting as photosensitisers or by
various species of photochemical origin, such as the hydrated electron, the hydroxyl radical, alkylperoxy
and alkoxy radicals, electronically excited (singlet) molecular oxygen and the superoxide ion.
Mabey et al (1982) concluded that direct photolysis is not an environmentally significant degradation
process in aquatic media. They made a rough evaluation of the rate constants for the reactions of PER
with singlet molecular oxygen and with alkylperoxy radicals. According to their data, these two processes
would have half-lives of many thousands of years. Chodola et al (1989) conducted experiments
simulating photolysis in the aqueous environment and concluded that this process is negligible. Mertens
and Von Sonntag (1995) carried out a detailed study of the photo-oxidation of PER in aqueous solution at
254 nm, but such short wavelengths are not present in the sunlight that reaches the Earth’s surface.
B.3. SORPTION
B.3.1 Laboratory Studies
Some early observations on the sorption of PER by mineral substances, peat moss and natural
sediments were reported by Dilling et al (1975), McConnell et al (1975) and Pearson and McConnell
(1975).
Values for the partition coefficient of PER from water to the organic carbon of soils (Koc), published by
various authors are listed in Table 1; log Koc lies in the range 1.9 - 2.6.
Wakeham et al (1983, 1986) calculated that for Narragansett Bay sea-water, any PER present should be
mainly dissolved in the aqueous phase and hardly bound at all to suspended particulate matter.
Tetrachloroethylene 197
Using the procedure adopted by Smith and Dragun (1984), but adopting a log Koc of 2.4, one can
calculate that for a water-saturated subsoil containing 1% of organic carbon and low levels of PER,
roughly 10% of this solute will be present at equilibrium in the aqueous phase and 90% on the soil.
The low Koc values and the above calculation on the partitioning to soils suggest that PER is fairly mobile
in soil/water systems. The mobility of PER was studied experimentally, in soil-column experiments, by
Wilson et al (1981), Bouwer et al (1981a) and Bates et al (1991).
Piwoni and Banerjee (1989) showed that sorption of PER onto low-carbon aquifer materials (C < 0.1%) is
several times greater than would be predicted on the basis of partitioning to organic carbon alone; they
attributed this to an additional mechanism involving adsorption on the mineral surfaces. Mokrauer and
Kosson (1989) postulated that electrostatic attraction between negatively-charged clay particles and the
positively-charged carbon atoms of organic chlorine compounds such as PER is the driving force for
sorption onto a sandy loam.
Grathwohl (1990) showed that sorption of non-ionic compounds such as PER depends not only on the
organic carbon content of the soils and sediments, but also on the nature of the organic matter. This
author gave log Koc values of 2.6, 3.3 and 4.0 for different adsorbents and presented a correlation
equation for calculating Koc from Pow and the hydrogen/oxygen atomic ratio of the organic matter.
Schwarzenbach and Westall (1981) found that sorption to a variety of materials was reversible at the low
concentrations of PER typical of the environment; they noted however that sorption kinetics may have an
effect on transport of PER over the range of flow velocities encountered in aquifers.
Doust and Huang (1992) concluded that the sorption of PER to soils, clays and sands is rapid and
reversible, following pseudo-first-order kinetics with a half-time of approximately 4 hours.
Pignatello (1990a,b) describes the formation of “slowly reversible” sorbed fractions of PER in soils. Such
fractions were found to increase with sorption equilibration time and applied concentration. This work
shows that even compounds normally regarded as labile in the environment by their volatility and weak
equilibrium sorption tendencies can generate kinetically slowly sorbed residues.
Rate-limited, non-equilibrium sorption of PER was also investigated by Brusseau and Reid (1991) and
Brusseau et al (1991).
A mathematical model was developed by Biswas et al (1992) to predict sorption, desorption and leaching
of PER, in various soil environments. This model has been critiqued by Kuo (1993).

198 ECETOC Joint Assessment of Commodity Chemicals No. 39
B.3.2 Field Observations
As reported by Kußmaul et al (1978), bank infiltration of Rhine water did not lead to any reduction in the
concentration of PER, showing that sorption and any other removal processes such as biological
degradation were negligible under these conditions.
Analogous conclusions on bank infiltration were published by Schwarzenbach et al (1983) and Giger et al
(1983) for two sites in Switzerland. The similar average concentrations in the rivers and in the
groundwater showed that PER was not significantly affected by any elimination process. Furthermore,
the strong response in the groundwater to concentration changes in the river suggested that during
infiltration PER was not strongly retained in the ground.
Apparently contradictory conclusions have been published on the efficiency of dune infiltration of Rhine
water. Zoeteman et al (1980) reported results showing a 10-fold reduction in the PER concentration. On
the other hand, Piet et al (1981) observed no such reduction.
Tomson et al (1981) published results on the efficiency of removal of PER from a secondary sewage
effluent applied to a rapid infiltration site, by sorption and possibly other processes.
Tetrachloroethylene 199
APPENDIX C. MODELLING OF CANCER RISK - A CRITICAL
EVALUATION
A number of quantitative cancer risk assessments exist for exposure to PER, both from the environment
and during occupational use of the chemical. The majority of these have been prepared by, or on behalf
of, the US Federal and State regulatory authorities. It is the practice in the USA to use mathematical
extrapolation from animal data to provide numerical power estimates of risk in humans. However, in
other countries this methodology is rejected because it is imprecise and the risk estimates are subjected
to substantial variation by defering assumptions used in the calculations. In the extreme case, the
variation can be 5 orders of magnitude between the 95% upper confidence limit (UCL) of the multistage
model and the maximum likelihood estimate (MLE) using other estimates. Thus risk assessments of this
type must take into account this systematic variability.
The published risk assessments are based on the tumour incidences seen in the 2-year studies (NCI,
1977; NTP, 1986) and use either mouse liver tumours, rat mononuclear cell leukaemias, or both, as the
basis of the assessment. Male rat kidney tumours, seen in one of the animal bioassays (NTP, 1986),
have not been used. The risks were calculated using applied dose or metabolised dose, body weight or
body surface area, for extrapolation between species, or using physiologically-based pharmacokinetic
(PBPK) models for both dose and species extrapolation, followed by the application of linearised
multistage or the Weibull statistical models for extrapolation from high to low dose.
Most of the existing risk assessments that pre-date the mechanistic studies define the mode of action of
PER as a carcinogen. Consequently, the role of peroxisome proliferation, protein droplet nephropathy
and activation by the GSH β-lyase pathway are not considered, either in the calculation of risk, or in the
choice of animal model or tumour type on which the risk assessment is based. In the absence of these
data the risk assessments were based on the highest incidences of tumours in the most sensitive animal
species.
The US-EPA in their Health Assessment Document (US-EPA, 1985), based the risk calculations on the
mouse liver tumours observed in the NCI gavage study (NCI, 1977). Dose was expressed either as
applied dose or metabolised dose, with the linearised multistage model used for high to low dose
extrapolation. When metabolised dose was used, estimates of metabolism were obtained from
published papers (Bolanowska and Golacka, 1972; Fernandez et al, 1976; Schumann et al, 1980; Buben
and O'Flaherty, 1985). Species to species scaling was based on either surface area extrapolation or
metabolised dose. Although a number of different methods and data sets were used to produce a range
of results, the preferred (by EPA) upper-bound estimates (95% UCL) of the incremental risk were as
follows. For inhalation, the lifetime risk from exposure to a concentration of 1 mg PER/m3 (0.15 ppm)
was 4.8x10⁻⁷, and for drinking water the risk associated with ingestion of 1 mg PER/l was 1.5x10⁻⁶.
200 ECETOC Joint Assessment of Commodity Chemicals No. 39
The Health Risk Assessment of PER in California Drinking Water prepared by Bogen et al (1987)
contains a full review of the toxicology of PER and its environmental fate, in addition to a risk
assessment, which is compared with the EPA approach described above. As in most risk assessments
of PER, the toxic and carcinogenic effects are assumed to result from metabolites of PER. This concept
is not further defined other than by reference to ”reactive intermediates or epoxides”. Metabolised dose
is therefore preferred over applied dose and is determined by Simple Steady State Pharmacokinetics
based on the Michaelis-Menten equation and published experimental studies. Risks are calculated using
either the mouse liver tumours seen in the NCI gavage study (NCI, 1977) or in the NTP inhalation study
(NTP, 1986), or the rat mononuclear-cell leukaemias seen in the NTP study (NTP, 1986). The linearised
multistage model was used throughout to predict the risks at very low dose levels, and inter-species
scaling was based on both bodyweight and body surface area. A large number of potency values (128)
are given comparing the California approach with that of the EPA for both metabolised and applied dose.
These values have an 84-fold range for metabolised dose and a 447-fold range for applied dose.
A number of PBPK models have been developed for PER (Hattis et al, 1986; Bogen and McKone, 1987;
Ward et al, 1988; Travis et al, 1989). All of these models are suggested as an approach to risk
assessment but only two include risk calculations (Hattis et al, 1986; Travis et al, 1989). Of the two
publications that do include risk calculations, one (Hattis et al, 1986) was prepared on behalf of NIOSH
and describes the risks at occupational exposure levels, the other (Travis et al, 1989) is based on
continuous lifetime exposure to environmental levels. Both models assume a genotoxic mode of action
for PER. Hattis et al (1986) calculate risks based on mouse liver tumours and rat leukaemias, and give a
range of values. For example, a working lifetime exposure to 100 ppm (689 mg/m3) PER is predicted to
cause an increased cancer incidence in the range 52 - 65% (UCL) or 4.5 - 27% (MLE), depending upon
the tumour type.
The approach taken by Travis et al (1989) assumes that there are two metabolic pathways for PER, one
a saturable pathway leading to TCA, the other a linear but undefined pathway invoked to explain an
apparent imbalance between uptake of parent chemical and production of metabolites. Metabolic rate
constants for each species were determined by fitting model predictions to the same experimental data
used in the previous risk assessments. The incidences of mouse liver tumours in the NCI (1977) and
NTP (1986) studies were combined with those for male rats in the NTP study, even though the latter
were not statistically significant. Data from the inhalation bioassay (NTP, 1986) were converted to
a mg/kg/d dose so that they could be combined with the data from the gavage study (NCI, 1977). The
relationship between metabolised dose and these tumour incidences was obtained using a least squares
fit of the data. As in some of the previous risk assessments, comparisons were made between the PBPK
approach and the conventional approach using applied dose and allometric scaling between species. At
very low dose levels, the PBPK method gave a reduction in risk of 1.6-fold, exposure to PER in air at a
concentration of 1 mg/m3 (0.15 ppm) giving a risk of 3.1x10⁻⁷ by the PBPK method and 5.1x10⁻⁷ using the
Tetrachloroethylene 201
applied dose. The reduction in risk given by the PBPK method increased at higher dose levels (118-fold
at 500 ppm; 3,445 mg/m3) when metabolic saturation was taken into account by one method (PBPK) but
not the other.
In addition to the numerical, mathematically-based risk assessments, the US-EPA published an exposure
and risk assessment for PER in 1982 (US-EPA, 1982), including a major review of the chemical, its fate
in the environment and its effects on various biological systems. The quantitative aspects concerning the
environment are now 10 years old and may no longer be correct. The risk assessment was largely
superseded by that in the Health Assessment Document of 1985 (US-EPA, 1985). Several groups have
commented on the various PBPK models used for PER risk assessments, both on the statistical
precision of the models (Farrar et al, 1989; Bois et al, 1990), and on the values of some of the biological
parameters used in the models (Reitz and Nolan, 1986).
Alternative approaches to risk assessment using mechanistic data from different species produce a
totally different picture (see below and ECETOC, 1990).
The uncertainties in human risk assessments based on animal data are apparent from the wide range of
risks predicted for PER by the various methodologies used. These arise from the choice of animal
tumour data, the selection of dose and the models used for dose and species extrapolation. Because of
a lack of knowledge (at the time) of the mechanism of action and pharmacokinetics of PER, there is little
or no guidance as to the most appropriate form of these risk assessments. For example, rat leukaemias
are frequently used even though most reviewers considered these tumours inappropriate for human risk
assessment (NTP, 1986; HSE, 1987; ECETOC, 1990). There appears to be general agreement that
metabolised dose is preferable to applied dose, although the assumptions made in the calculation of
these doses vary widely and are frequently based on inadequate data. There is little agreement on the
use of physiology, body weight or body surface area for species to species extrapolation.
The wide range of risks predicted by these assessments fail to provide accurate guidance for
establishing safe levels of PER either during occupational use or in the environment. Some of the
risks predicted are exceptionally high: e.g. Hattis et al (1986) suggest a 65% increase in tumours for
occupational exposure to 100 ppm (689 mg/m3); the US-EPA (1985) predict the potency of PER to be
8-fold higher than that of vinyl chloride. However, occupational experience of PER over several
decades clearly suggests that these predictions are unrealistic, which leads to the conclusion that key
pieces of information were either ignored or were unavailable when these risk assessments were
published.
More recent studies of the various mechanisms involved in the induction of cancer in rodents exposed
to PER have revealed both qualitative and quantitative differences between rats and mice, and
between these species and humans. As a result, the tumours seen in rats and mice exposed to PER

202 ECETOC Joint Assessment of Commodity Chemicals No. 39
are now considered to be an inappropriate endpoint on which to base human risk assessments
(ECETOC, 1990).
Tetrachloroethylene 203
APPENDIX D. REVIEW OF MUTAGENICITY TESTS
The details of mutagenicity assays of PER are summarised in Tables D.1-D.18.
D.1 GENE MUTATION
Bacterial Assays
Studies using bacterial assays are summarised in Table D.1.
The ability of PER to cause gene mutations in bacteria has been investigated in Salmonella
typhimurium and Escherichia coli. In several plate-incorporation assays negative results were
obtained, either with or without pre-incubation, using S. typhimurium strains TA98, TA100, TA1535,
TA1537 and TA1538 and two additional strains which are not DNA repair deficient (UTH 8413 and
8414). Toxicity was observed at 224 - 333 mg/plate. Metabolic activation was achieved with liver S9
fractions obtained from rats, mice or hamsters induced by phenobarbital or Aroclor (Margard, 1978 as
quoted in US-EPA, 1985; Bartsch et al, 1979; Kringstad et al, 1981; Haworth et al, 1983; Connor et al,
1985).
PER in the vapour phase has been tested on different S. typhimurium strains (see Table D.1). PER of
high purity and containing low concentrations of stabilisers gave negative results in these assays up to
levels which were toxic to the organisms in the absence or presence of Aroclor induced rat, mouse or
hamster liver S9 fractions (SRI International, 1983 as quoted in US-EPA, 1985; Williams and
Shimada, 1983 as quoted in US-EPA, 1985; Milman et al, 1988; Warner et al, 1988).
Positive responses in both plate incorporation and vapour phase Ames assays have been obtained
with certain commercial and technical preparations of PER but only at toxic concentrations. No dose-
response relationship was established in these tests. Furthermore, non-stabilised, highly pure PER
gave a negative response in these studies (Margard, 1978; Williams and Shimada, 1983, both as
quoted in US-EPA, 1985). The positive findings may be due to the presence of mutagenic
contaminants and/or added stabilisers such as cyclohexene oxide and epichlorohydrin; both
contaminants gave positive results with Salmonella typhimurium TA100 at concentrations greater than
0.25 ppm (1.72 mg/m3 vapour), and Salmonella typhimurium TA1535 at 0.2 mg/ml agar (Bridges,
1978; Koorn, 1987).
PER of undefined purity was tested in a spot test, using S. typhimurium strains TA98, TA100, TA1535,
TA1950, TA1951 and TA1952. Mutagenic activity was shown in all strains. A dose-dependent
response was observed only in strain TA100 (Cerná and Kypenová, 1977). Insufficient details were
provided for an assessment of this study.

204 ECETOC Joint Assessment of Commodity Chemicals No. 39
A screening test on the ability of PER to induce survival repair mechanisms (SOS chromotest) in
E. coli PQ37 was negative (Von der Hude et al, 1988).
PER caused no increase in the frequency of forward or reverse mutations in a bacterial assay with
E. coli K12, in the presence or the absence of mouse liver S9 fractions (Greim et al, 1975).
D.1.1 Yeast Assays (Table D.2)
PER did not induce mutagenic activity in a yeast culture of Saccharomyces cerevisiae D7 in stationary
phase in the absence or the presence of an exogenous activation system (Bronzetti et al, 1983).
PER has also been studied in S. cerevisiae D7 and D4 strains using log-phase cultures (Callen et al,
1980; Koch et al, 1988). The results were positive but were not reliable because of poor survival. The
purity of the PER used was incompletely described.
D.1.2 Drosophila Assay (Table D.2)
Sex-linked recessive lethal tests in Drosophila melanogaster in which PER was administered by
inhalation, feeding or injection showed no mutagenic effect (Beliles et al, 1980; Valencia et al, 1985).
D.1.3 Host-mediated Assays (Table D.3)
Oral administration of PER of high purity (99.5%) to CD-1 mice for 5 days gave negative results in a
host-mediated assay using stationary S. cerevisiae D7 as the indicator organism (Bronzetti et al,
1983). The protocol, which involved intravenous injection, was unusual and as no positive control was
used, interpretation of this study is impossible.
Using S. typhimurium strains TA1950, TA1951 and TA1952 as indicators, an increase in mutagenicity
was observed in a host-mediated assay with PER of unknown purity administered to female ICR mice.
No dose dependence was found (Cerná and Kypenová, 1977). In another host-mediated assay using
S. typhimurium strain TA98, PER administered to female mice by inhalation at concentrations of 100
and 500 ppm (689 and 3,445 mg/m3) yielded a clear (four-fold) increase in mutations at the highest
concentration (Beliles et al, 1980). The material used was of low purity (91.43%) but it was negative
when tested with TA98 in the presence of an S9 fraction.
The results obtained from the host-mediated assays are un-interpretable because of the absence of
suitable controls or the use of an unconventional route of administration.

Tetrachloroethylene 205
D.1.4 Mammalian System (Table D.4)
A study of gene mutation in vitro in a mouse lymphoma cell line (L5178Y/TK+/-), in the presence of an
induced rat liver S9 fraction, gave negative results up to concentrations which were toxic to the cells
(NTP, 1986).
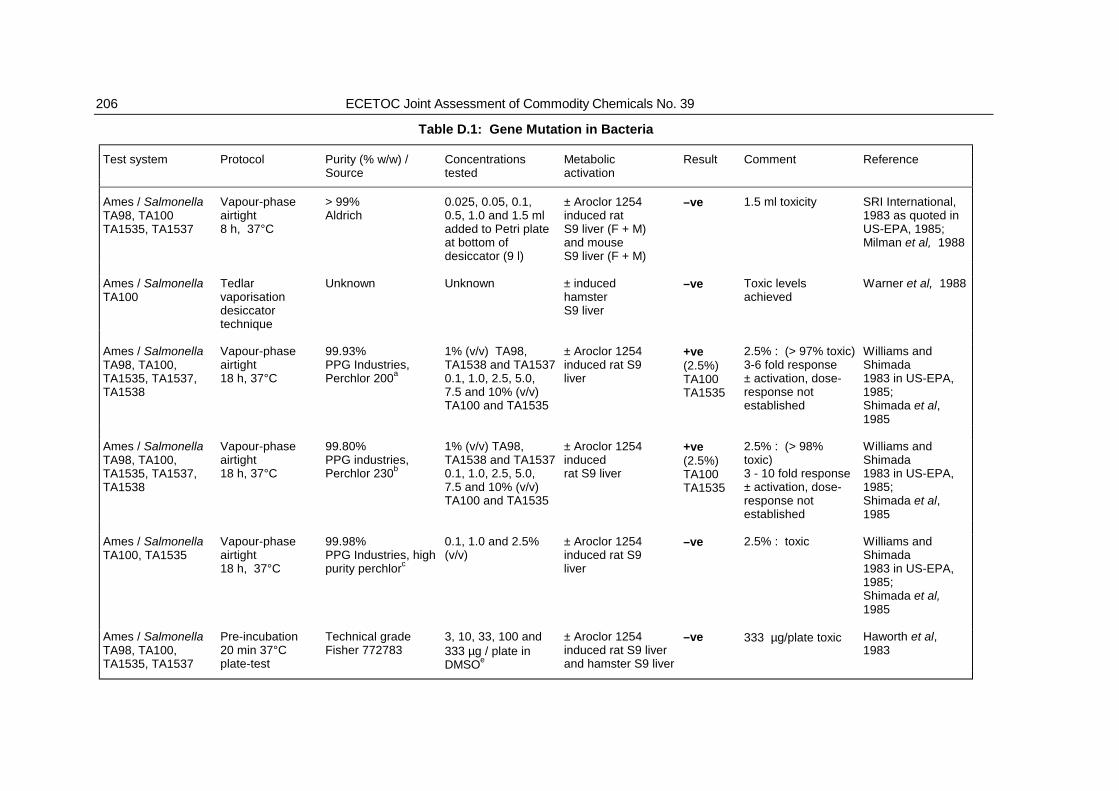
206 ECETOC Joint Assessment of Commodity Chemicals No. 39
Table D.1: Gene Mutation in Bacteria
Test system Protocol Purity (% w/w) /Source
Concentrationstested
Metabolicactivation
Result Comment Reference
Ames / SalmonellaTA98, TA100TA1535, TA1537
Vapour-phaseairtight8 h, 37°C
> 99%Aldrich
0.025, 0.05, 0.1,0.5, 1.0 and 1.5 mladded to Petri plateat bottom ofdesiccator (9 l)
± Aroclor 1254induced ratS9 liver (F + M)and mouseS9 liver (F + M)
–ve 1.5 ml toxicity SRI International,1983 as quoted inUS-EPA, 1985;Milman et al, 1988
Ames / SalmonellaTA100
Tedlarvaporisationdesiccatortechnique
Unknown Unknown ± inducedhamsterS9 liver
–ve Toxic levelsachieved
Warner et al, 1988
Ames / SalmonellaTA98, TA100,TA1535, TA1537,TA1538
Vapour-phaseairtight18 h, 37°C
99.93%PPG Industries,Perchlor 200a
1% (v/v) TA98,TA1538 and TA15370.1, 1.0, 2.5, 5.0,7.5 and 10% (v/v)TA100 and TA1535
± Aroclor 1254induced rat S9liver
+ve(2.5%)TA100TA1535
2.5% : (> 97% toxic)3-6 fold response± activation, dose-response notestablished
Williams andShimada1983 in US-EPA,1985;Shimada et al,1985
Ames / SalmonellaTA98, TA100,TA1535, TA1537,TA1538
Vapour-phaseairtight18 h, 37°C
99.80%PPG industries,Perchlor 230b
1% (v/v) TA98,TA1538 and TA15370.1, 1.0, 2.5, 5.0,7.5 and 10% (v/v)TA100 and TA1535
± Aroclor 1254inducedrat S9 liver
+ve(2.5%)TA100TA1535
2.5% : (> 98% toxic)3 - 10 fold response± activation, dose-response notestablished
Williams andShimada1983 in US-EPA,1985;Shimada et al,1985
Ames / SalmonellaTA100, TA1535
Vapour-phaseairtight18 h, 37°C
99.98%PPG Industries, highpurity perchlorc
0.1, 1.0 and 2.5%(v/v)
± Aroclor 1254induced rat S9liver
–ve 2.5% : toxic Williams andShimada1983 in US-EPA,1985;Shimada et al,1985
Ames / SalmonellaTA98, TA100,TA1535, TA1537
Pre-incubation20 min 37°Cplate-test
Technical gradeFisher 772783
3, 10, 33, 100 and333 µg / plate inDMSOe
± Aroclor 1254induced rat S9 liverand hamster S9 liver
–ve 333 µg/plate toxic Haworth et al, 1983
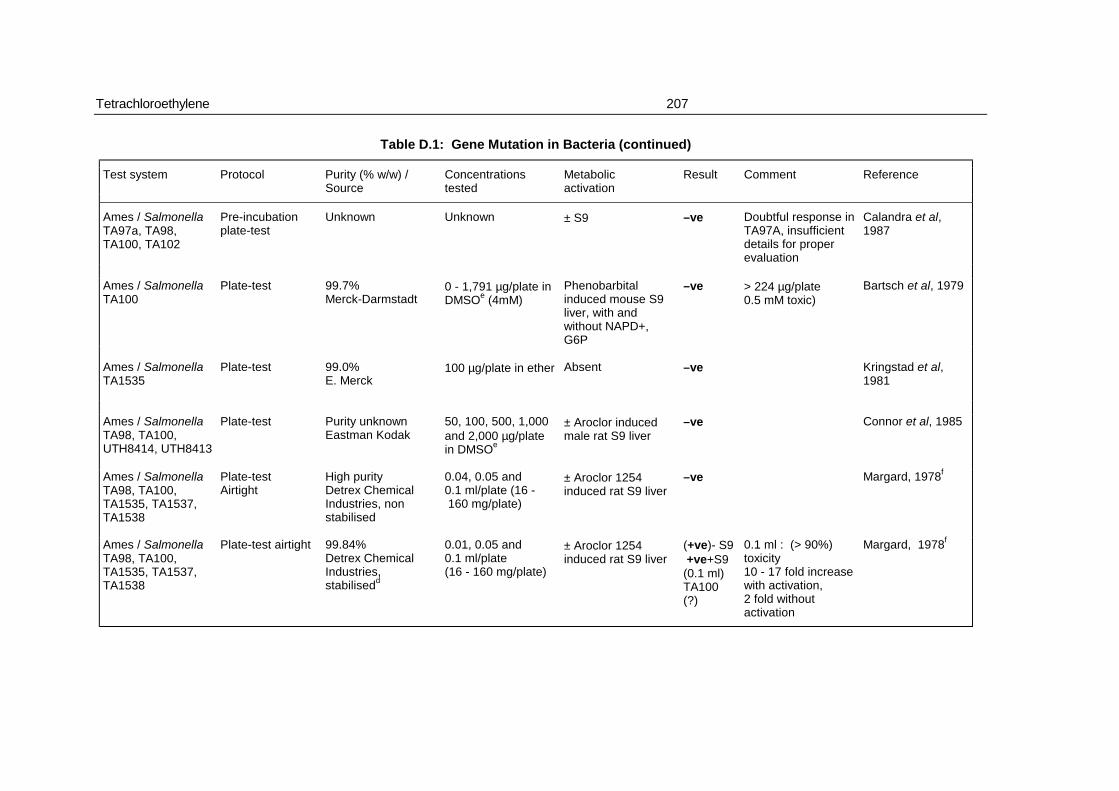
Tetrachloroethylene 207
Table D.1: Gene Mutation in Bacteria (continued)
Test system Protocol Purity (% w/w) /Source
Concentrationstested
Metabolicactivation
Result Comment Reference
Ames / SalmonellaTA97a, TA98,TA100, TA102
Pre-incubationplate-test
Unknown Unknown ± S9 –ve Doubtful response inTA97A, insufficientdetails for properevaluation
Calandra et al,1987
Ames / SalmonellaTA100
Plate-test 99.7%Merck-Darmstadt
0 - 1,791 µg/plate inDMSOe (4mM)
Phenobarbitalinduced mouse S9liver, with andwithout NAPD+,G6P
–ve > 224 µg/plate0.5 mM toxic)
Bartsch et al, 1979
Ames / SalmonellaTA1535
Plate-test 99.0% E. Merck
100 µg/plate in ether Absent –ve Kringstad et al,1981
Ames / SalmonellaTA98, TA100,UTH8414, UTH8413
Plate-test Purity unknownEastman Kodak
50, 100, 500, 1,000and 2,000 µg/platein DMSOe
± Aroclor inducedmale rat S9 liver
–ve Connor et al, 1985
Ames / SalmonellaTA98, TA100,TA1535, TA1537,TA1538
Plate-testAirtight
High purityDetrex ChemicalIndustries, nonstabilised
0.04, 0.05 and0.1 ml/plate (16 - 160 mg/plate)
± Aroclor 1254induced rat S9 liver
–ve Margard, 1978f
Ames / Salmonella TA98, TA100,TA1535, TA1537,TA1538
Plate-test airtight 99.84%Detrex ChemicalIndustries,stabilisedd
0.01, 0.05 and0.1 ml/plate(16 - 160 mg/plate)
± Aroclor 1254induced rat S9 liver
(+ve)- S9 +ve+S9(0.1 ml)TA100 (?)
0.1 ml : (> 90%)toxicity10 - 17 fold increasewith activation,2 fold withoutactivation
Margard, 1978f
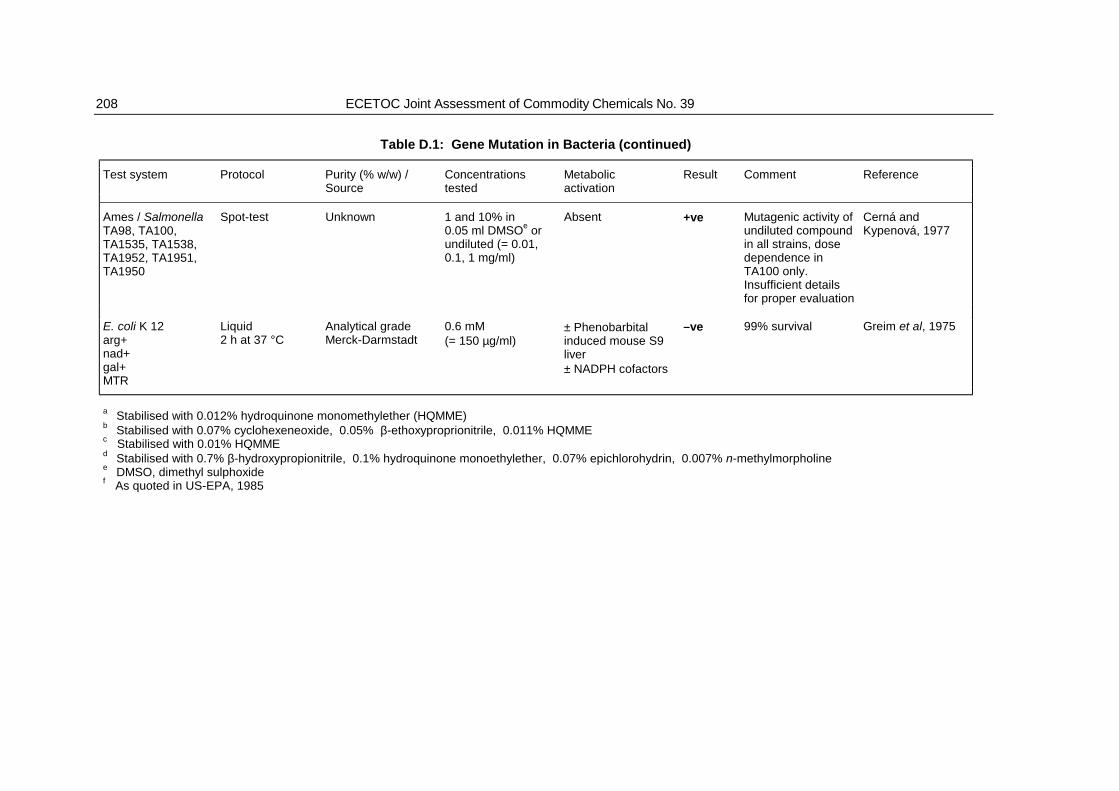
208 ECETOC Joint Assessment of Commodity Chemicals No. 39
Table D.1: Gene Mutation in Bacteria (continued)
Test system Protocol Purity (% w/w) /Source
Concentrationstested
Metabolicactivation
Result Comment Reference
Ames / SalmonellaTA98, TA100,TA1535, TA1538,TA1952, TA1951,TA1950
Spot-test Unknown 1 and 10% in0.05 ml DMSOe orundiluted (= 0.01,0.1, 1 mg/ml)
Absent +ve Mutagenic activity ofundiluted compoundin all strains, dosedependence inTA100 only.Insufficient detailsfor proper evaluation
Cerná andKypenová, 1977
E. coli K 12arg+nad+gal+MTR
Liquid2 h at 37 °C
Analytical grade Merck-Darmstadt
0.6 mM(= 150 µg/ml)
± Phenobarbitalinduced mouse S9liver ± NADPH cofactors
–ve 99% survival Greim et al, 1975
a Stabilised with 0.012% hydroquinone monomethylether (HQMME)b Stabilised with 0.07% cyclohexeneoxide, 0.05% β-ethoxyproprionitrile, 0.011% HQMMEc Stabilised with 0.01% HQMMEd Stabilised with 0.7% β-hydroxypropionitrile, 0.1% hydroquinone monoethylether, 0.07% epichlorohydrin, 0.007% n-methylmorpholinee DMSO, dimethyl sulphoxidef As quoted in US-EPA, 1985
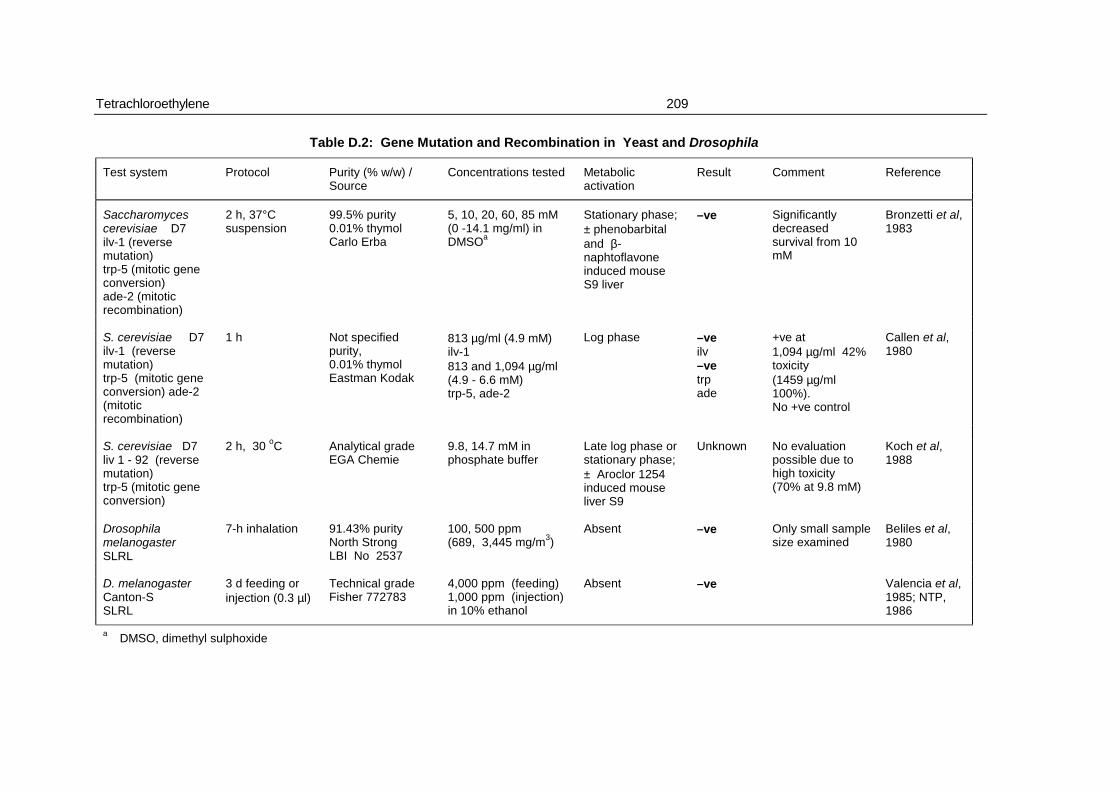
Tetrachloroethylene 209
Table D.2: Gene Mutation and Recombination in Yeast and Drosophila
Test system Protocol Purity (% w/w) /Source
Concentrations tested Metabolicactivation
Result Comment Reference
Saccharomycescerevisiae D7ilv-1 (reversemutation)trp-5 (mitotic geneconversion)ade-2 (mitoticrecombination)
2 h, 37°C suspension
99.5% purity0.01% thymolCarlo Erba
5, 10, 20, 60, 85 mM (0 -14.1 mg/ml) inDMSOa
Stationary phase;± phenobarbitaland β-naphtoflavoneinduced mouseS9 liver
–ve Significantlydecreasedsurvival from 10mM
Bronzetti et al,1983
S. cerevisiae D7ilv-1 (reversemutation)trp-5 (mitotic geneconversion) ade-2(mitoticrecombination)
1 h Not specifiedpurity,0.01% thymolEastman Kodak
813 µg/ml (4.9 mM)ilv-1813 and 1,094 µg/ml(4.9 - 6.6 mM)trp-5, ade-2
Log phase –veilv–vetrpade
+ve at1,094 µg/ml 42%toxicity(1459 µg/ml 100%).No +ve control
Callen et al, 1980
S. cerevisiae D7liv 1 - 92 (reversemutation)trp-5 (mitotic geneconversion)
2 h, 30 oC Analytical gradeEGA Chemie
9.8, 14.7 mM inphosphate buffer
Late log phase orstationary phase;± Aroclor 1254induced mouseliver S9
Unknown No evaluationpossible due tohigh toxicity(70% at 9.8 mM)
Koch et al, 1988
Drosophilamelanogaster SLRL
7-h inhalation 91.43% purityNorth StrongLBI No 2537
100, 500 ppm(689, 3,445 mg/m3)
Absent –ve Only small samplesize examined
Beliles et al, 1980
D. melanogasterCanton-SSLRL
3 d feeding orinjection (0.3 µl)
Technical gradeFisher 772783
4,000 ppm (feeding)1,000 ppm (injection)in 10% ethanol
Absent –ve Valencia et al,1985; NTP,1986
a DMSO, dimethyl sulphoxide
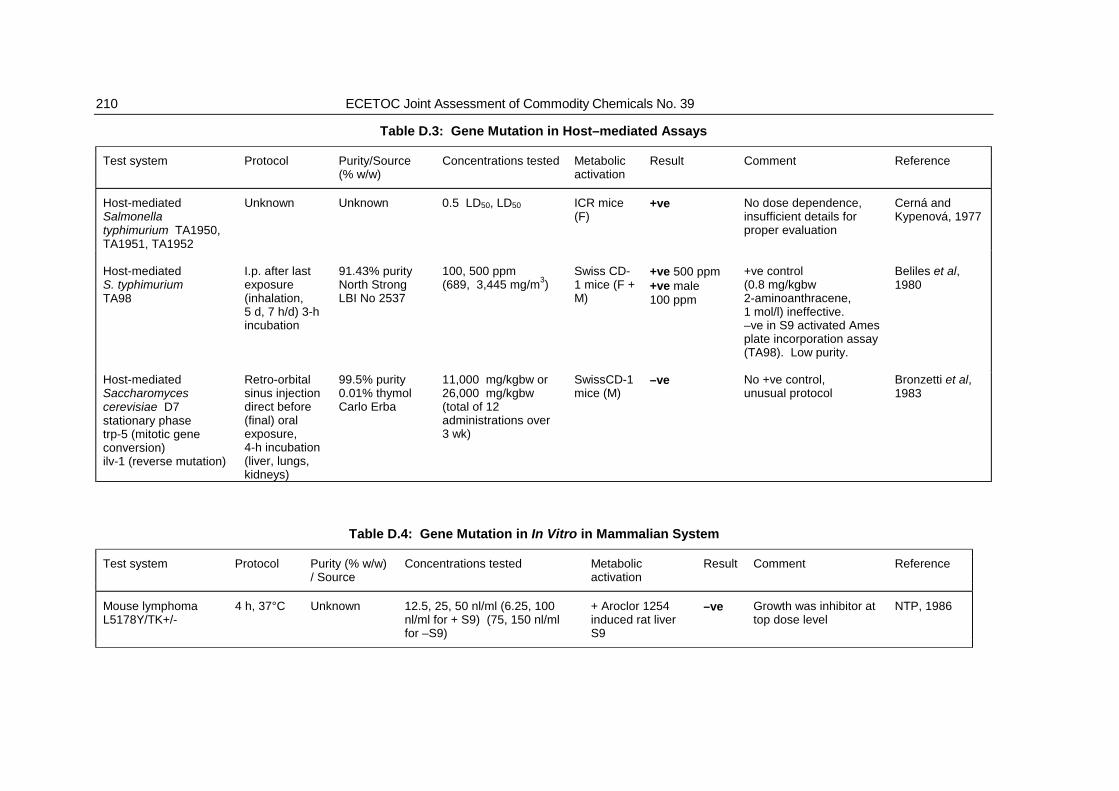
210 ECETOC Joint Assessment of Commodity Chemicals No. 39
Table D.3: Gene Mutation in Host–mediated Assays
Test system Protocol Purity/Source(% w/w)
Concentrations tested Metabolicactivation
Result Comment Reference
Host-mediatedSalmonellatyphimurium TA1950,TA1951, TA1952
Unknown Unknown 0.5 LD50, LD50 ICR mice(F)
+ve No dose dependence,insufficient details forproper evaluation
Cerná andKypenová, 1977
Host-mediatedS. typhimurium TA98
I.p. after lastexposure(inhalation,5 d, 7 h/d) 3-hincubation
91.43% purityNorth StrongLBI No 2537
100, 500 ppm(689, 3,445 mg/m3)
Swiss CD-1 mice (F +M)
+ve 500 ppm+ve male100 ppm
+ve control (0.8 mg/kgbw2-aminoanthracene,1 mol/l) ineffective.–ve in S9 activated Amesplate incorporation assay(TA98). Low purity.
Beliles et al, 1980
Host-mediatedSaccharomycescerevisiae D7stationary phasetrp-5 (mitotic geneconversion)ilv-1 (reverse mutation)
Retro-orbitalsinus injectiondirect before(final) oralexposure,4-h incubation(liver, lungs,kidneys)
99.5% purity0.01% thymolCarlo Erba
11,000 mg/kgbw or26,000 mg/kgbw(total of 12administrations over3 wk)
SwissCD-1mice (M)
–ve No +ve control,unusual protocol
Bronzetti et al, 1983
Table D.4: Gene Mutation in In Vitro in Mammalian System
Test system Protocol Purity (% w/w)/ Source
Concentrations tested Metabolicactivation
Result Comment Reference
Mouse lymphomaL5178Y/TK+/-
4 h, 37°C Unknown 12.5, 25, 50 nl/ml (6.25, 100nl/ml for + S9) (75, 150 nl/mlfor –S9)
+ Aroclor 1254induced rat liverS9
–ve Growth was inhibitor attop dose level
NTP, 1986

Tetrachloroethylene 211
D.2 CHROMOSOMAL EFFECTS
D.2.1 In Vitro Mammalian Systems (Tables D.5 and D.6)
PER did not induce chromosomal aberrations or sister chromatid exchanges (SCEs) in an in vitro
study on Chinese hamster ovary cells, in the presence or absence of rat liver S9 metabolic activation
(NTP, 1986; Galloway et al, 1987).
D.2.2 In Vivo Mammalian Systems (Table D.7)
Administration of PER to rats at concentrations up to 600 ppm (4,134 mg/m3) for 12 months and by
single or repeated i.p. injection to mice did not reveal exposure related chromosome aberrations in
bone marrow (Cerná and Kypenová, 1977; Rampy et al, 1978; Beliles et al, 1980).
A dominant lethal study in which male rats were exposed (7 h/d) to 100 - 500 ppm (689 - 3,445 mg/m3)
PER by inhalation, for 5 days showed no mutagenic effects (Beliles et al, 1980).
D.2.3 Non-Mammalian Systems (Tables D.8 and D.10)
An inhalation study of the mutagenic activity of PER (100 - 500 ppm for 7 h) in Drosophila
melanogaster failed to demonstrate effects on chromosomes, including sex chromosome loss
(Beliles et al, 1980).
D.2.4 In Vivo Human Systems (Tables D.6 and D.9)
Studies on lymphocytes from 10 factory workers occupationally exposed to PER for 3 months to
18 years showed no significant dose-related differences in numerical or structural chromosomal
aberrations, SCE rate, the proportion of M2 and M3 metaphases and mitotic index (Ikeda et al, 1980).
The study is of limited value because the workers studied were not matched to the control group with
regard to age, sex, race or social-economic status. No record was available of the medical histories of
the subjects.
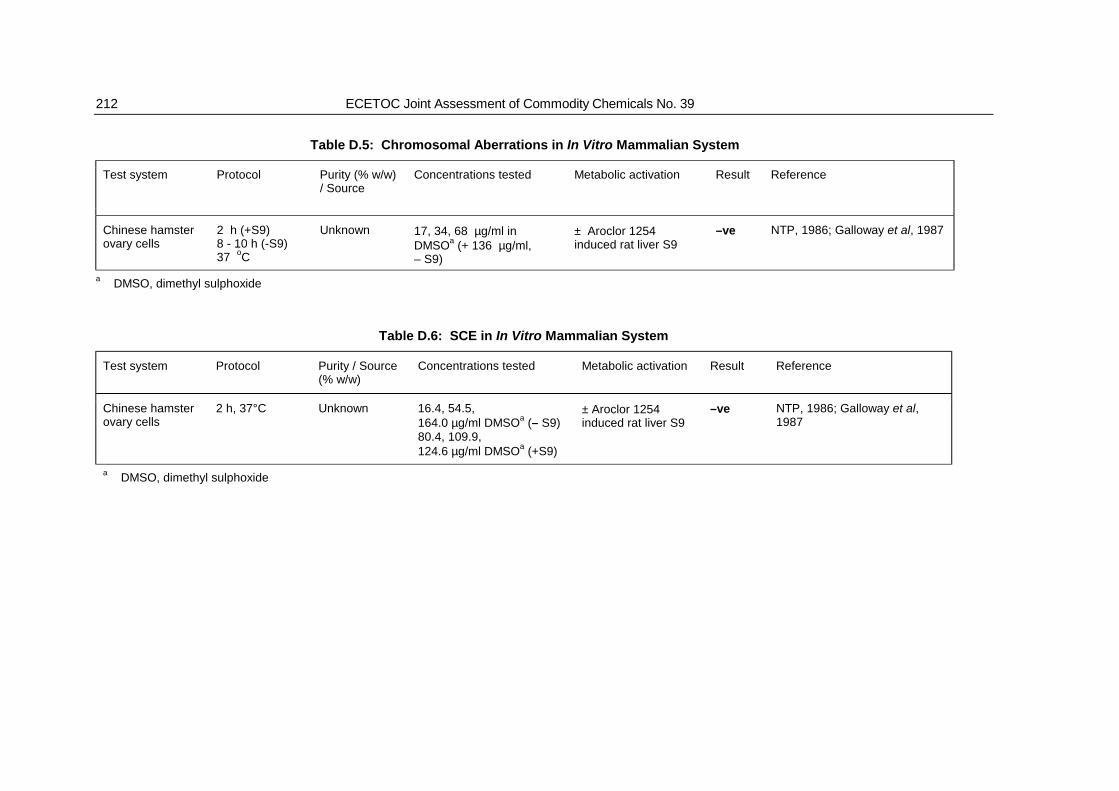
212 ECETOC Joint Assessment of Commodity Chemicals No. 39
Table D.5: Chromosomal Aberrations in In Vitro Mammalian System
Test system Protocol Purity (% w/w)/ Source
Concentrations tested Metabolic activation Result Reference
Chinese hamsterovary cells
2 h (+S9)8 - 10 h (-S9)37 oC
Unknown 17, 34, 68 µg/ml inDMSOa (+ 136 µg/ml,– S9)
± Aroclor 1254induced rat liver S9
–ve NTP, 1986; Galloway et al, 1987
a DMSO, dimethyl sulphoxide
Table D.6: SCE in In Vitro Mammalian System
Test system Protocol Purity / Source(% w/w)
Concentrations tested Metabolic activation Result Reference
Chinese hamsterovary cells
2 h, 37°C Unknown 16.4, 54.5,164.0 µg/ml DMSOa (– S9)80.4, 109.9,124.6 µg/ml DMSOa (+S9)
± Aroclor 1254induced rat liver S9
–ve NTP, 1986; Galloway et al,1987
a DMSO, dimethyl sulphoxide
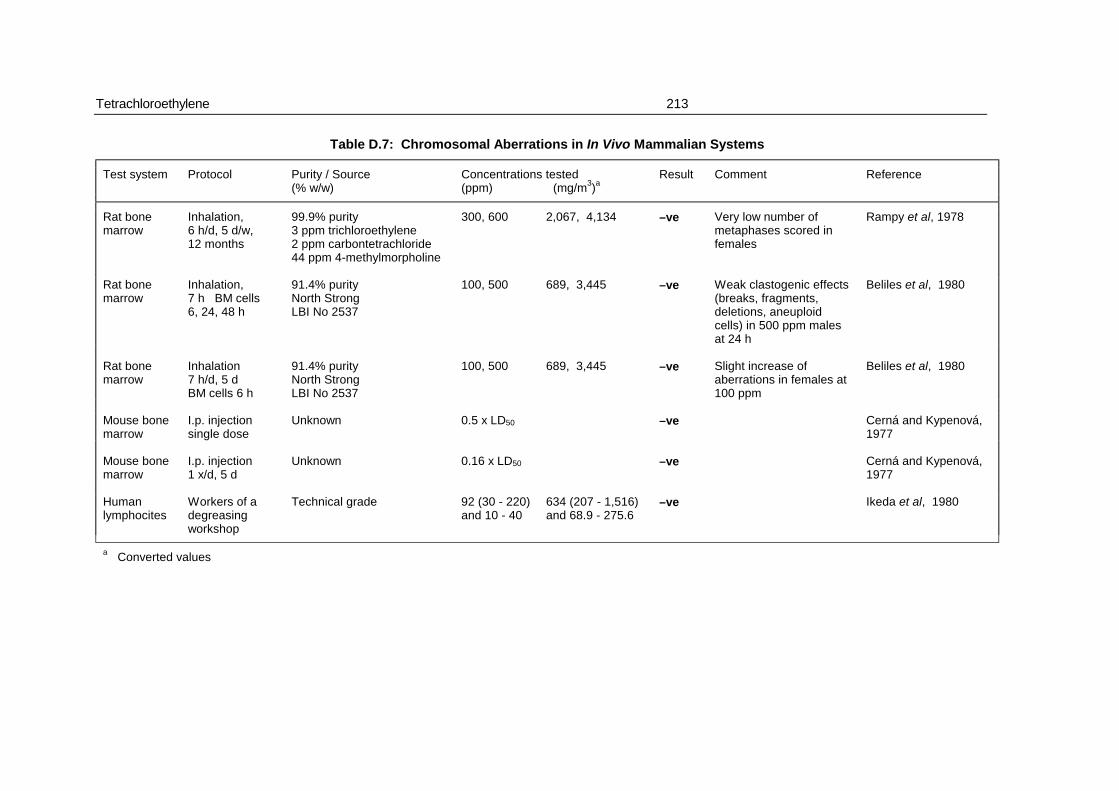
Tetrachloroethylene 213
Table D.7: Chromosomal Aberrations in In Vivo Mammalian Systems
Test system Protocol Purity / Source(% w/w)
Concentrations tested(ppm) (mg/m3)a
Result Comment Reference
Rat bonemarrow
Inhalation,6 h/d, 5 d/w,12 months
99.9% purity3 ppm trichloroethylene2 ppm carbontetrachloride44 ppm 4-methylmorpholine
300, 600 2,067, 4,134 –ve Very low number ofmetaphases scored infemales
Rampy et al, 1978
Rat bonemarrow
Inhalation,7 h BM cells6, 24, 48 h
91.4% purityNorth StrongLBI No 2537
100, 500 689, 3,445 –ve Weak clastogenic effects(breaks, fragments,deletions, aneuploidcells) in 500 ppm malesat 24 h
Beliles et al, 1980
Rat bonemarrow
Inhalation7 h/d, 5 dBM cells 6 h
91.4% purityNorth StrongLBI No 2537
100, 500 689, 3,445 –ve Slight increase ofaberrations in females at100 ppm
Beliles et al, 1980
Mouse bonemarrow
I.p. injectionsingle dose
Unknown 0.5 x LD50 –ve Cerná and Kypenová, 1977
Mouse bonemarrow
I.p. injection1 x/d, 5 d
Unknown 0.16 x LD50 –ve Cerná and Kypenová, 1977
Humanlymphocites
Workers of adegreasingworkshop
Technical grade 92 (30 - 220)and 10 - 40
634 (207 - 1,516)and 68.9 - 275.6
–ve Ikeda et al, 1980
a Converted values

214 ECETOC Joint Assessment of Commodity Chemicals No. 39
Table D.8: Chromosome Loss - Non Mammalian Systems
Test system Protocol Purity/Source(% w/w)
Concentrations tested(ppm) (mg/m3)a
Result Reference
Drosophilamelanogaster
Inhalation, 7 h 91.4% purityNorth StrongLBI No 2537
100, 500 689, 3,445 –ve Beliles et al, 1980
a Converted values
Table D.9: SCE and Mitotic Index - In Vivo Mammalian Systems
Test system Protocol Purity/Source(% w/w)
Concentrations tested(ppm) (mg/m3)a
Result Reference
Humanlymphocytes
Workers fromdegreasingworkshop
Technical grade 92 (30 - 220) and10 - 40 for 3 months to10 years
634 (207 - 1,516)and 68.9 - 245.6
–ve Ikeda et al, 1980
a Converted values
Table D.10: Dominant Lethal - In Vivo Mammalian Systems
Test system Protocol Purity/Source(% w/w)
Concentrations tested(ppm) (mg/m3)a
Result Reference
Male rats Inhalation7 h/d, 5 d
91.4% purityNorth StrongLBI No 2537
100, 500 ppm 689, 3,445 –ve Beliles et al, 1980
a converted values

Tetrachloroethylene 215
D.3 DNA DAMAGE
D.3.1. Unscheduled DNA Synthesis (Tables D.11 to D.12)
Unscheduled DNA synthesis (UDS) is a measure of reparative (rather than replicative) synthesis
resulting from damage to DNA. PER of varying purity has been evaluated in vitro by means of UDS
test systems using human fibroblasts and rat or mouse hepatocytes. No effects indicative of DNA
damage were observed (Beliles et al, 1980; Williams, 1983 as quoted in US-EPA, 1985; Williams and
Shimada, 1983 as quoted in US-EPA, 1985; Costa and Ivanetich, 1984; Milman et al, 1988). In
assays conducted in the vapour phase, weak positive responses were observed at levels that killed
more than 25% of cells (Williams and Shimada, 1983 as quoted in US-EPA, 1985). The PER used in
this study was stabilised (see Table D.11) and gave a positive response in a Salmonella assay (see
Table D.1). In an in vivo/in vitro rat kidney cell UDS assay, in which PER was administered orally
(1,000 mg/kgbw), reparative DNA synthesis was not induced (Goldsworthy et al, 1988).
D.3.2 Single-Strand DNA Breaks (Table D.13)
Single-strand DNA breaks were found in cells of the liver and kidney, but not of the lungs, of mice
1 hour after i.p. administration of PER; the sensitivity of detection was 1 single-strand break per 5x10⁶
nucleotides. All damage was repaired by 24 hours (Walles, 1986). The origin of the single-strand
breaks induced by PER as is not clear. No studies are available from which to evaluate the effects of
prolonged administration of PER on the persistence of these single-strand breaks.
D.3.3 DNA Binding (Tables D.14 and D.15)
The ability of PER to bind covalently to DNA was studied in vivo in mice following inhalation (600 ppm,
4,134 mg/m3 for 6 h) and oral administration (500 mg/kgbw) (Schumann et al, 1980). No evidence of
alkylation was found; the study had a power to detect 1 alkylation in 105 nucleotides. DNA binding
was reported to occur in mouse liver in vivo following i.p. injection of PER and in calf thymus DNA
under certain metabolic conditions in vitro (Mazzullo et al, 1987). An unusual pattern of binding in the
in vivo study was reported, the level bound to RNA being significantly higher than that bound to protein
or DNA. No distinction was drawn between covalent binding and the incorporation of radioactivity
through the C-1 pool, making interpretation of the results impossible.
D.3.4 Evaluation
In conclusion, although PER produced a low incidence of single-strand breaks, the limited studies of
DNA damage failed to provide evidence of DNA alkylation. PER did not induce UDS either in vitro or
in vivo.
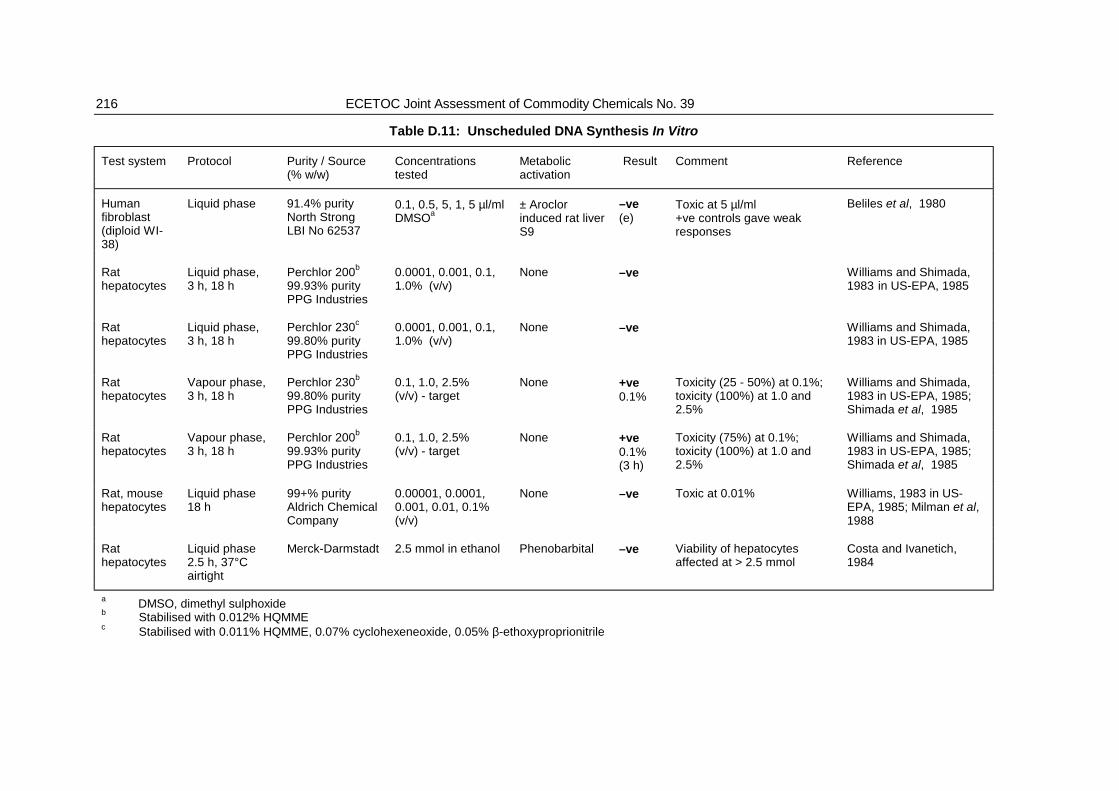
216 ECETOC Joint Assessment of Commodity Chemicals No. 39
Table D.11: Unscheduled DNA Synthesis In Vitro
Test system Protocol Purity / Source(% w/w)
Concentrationstested
Metabolicactivation
Result Comment Reference
Humanfibroblast(diploid WI-38)
Liquid phase 91.4% purityNorth StrongLBI No 62537
0.1, 0.5, 5, 1, 5 µl/mlDMSOa
± Aroclorinduced rat liverS9
–ve(e)
Toxic at 5 µl/ml+ve controls gave weakresponses
Beliles et al, 1980
Rathepatocytes
Liquid phase,3 h, 18 h
Perchlor 200b
99.93% purityPPG Industries
0.0001, 0.001, 0.1,1.0% (v/v)
None –ve Williams and Shimada,1983 in US-EPA, 1985
Rathepatocytes
Liquid phase,3 h, 18 h
Perchlor 230c
99.80% purityPPG Industries
0.0001, 0.001, 0.1,1.0% (v/v)
None –ve Williams and Shimada,1983 in US-EPA, 1985
Rathepatocytes
Vapour phase,3 h, 18 h
Perchlor 230b
99.80% purityPPG Industries
0.1, 1.0, 2.5%(v/v) - target
None +ve0.1%
Toxicity (25 - 50%) at 0.1%;toxicity (100%) at 1.0 and2.5%
Williams and Shimada,1983 in US-EPA, 1985;Shimada et al, 1985
Rathepatocytes
Vapour phase,3 h, 18 h
Perchlor 200b
99.93% purityPPG Industries
0.1, 1.0, 2.5%(v/v) - target
None +ve0.1%(3 h)
Toxicity (75%) at 0.1%;toxicity (100%) at 1.0 and2.5%
Williams and Shimada,1983 in US-EPA, 1985;Shimada et al, 1985
Rat, mousehepatocytes
Liquid phase18 h
99+% purityAldrich ChemicalCompany
0.00001, 0.0001,0.001, 0.01, 0.1% (v/v)
None –ve Toxic at 0.01% Williams, 1983 in US-EPA, 1985; Milman et al,1988
Rathepatocytes
Liquid phase2.5 h, 37°Cairtight
Merck-Darmstadt 2.5 mmol in ethanol Phenobarbital –ve Viability of hepatocytesaffected at > 2.5 mmol
Costa and Ivanetich,1984
a DMSO, dimethyl sulphoxideb Stabilised with 0.012% HQMMEc Stabilised with 0.011% HQMME, 0.07% cyclohexeneoxide, 0.05% β-ethoxyproprionitrile
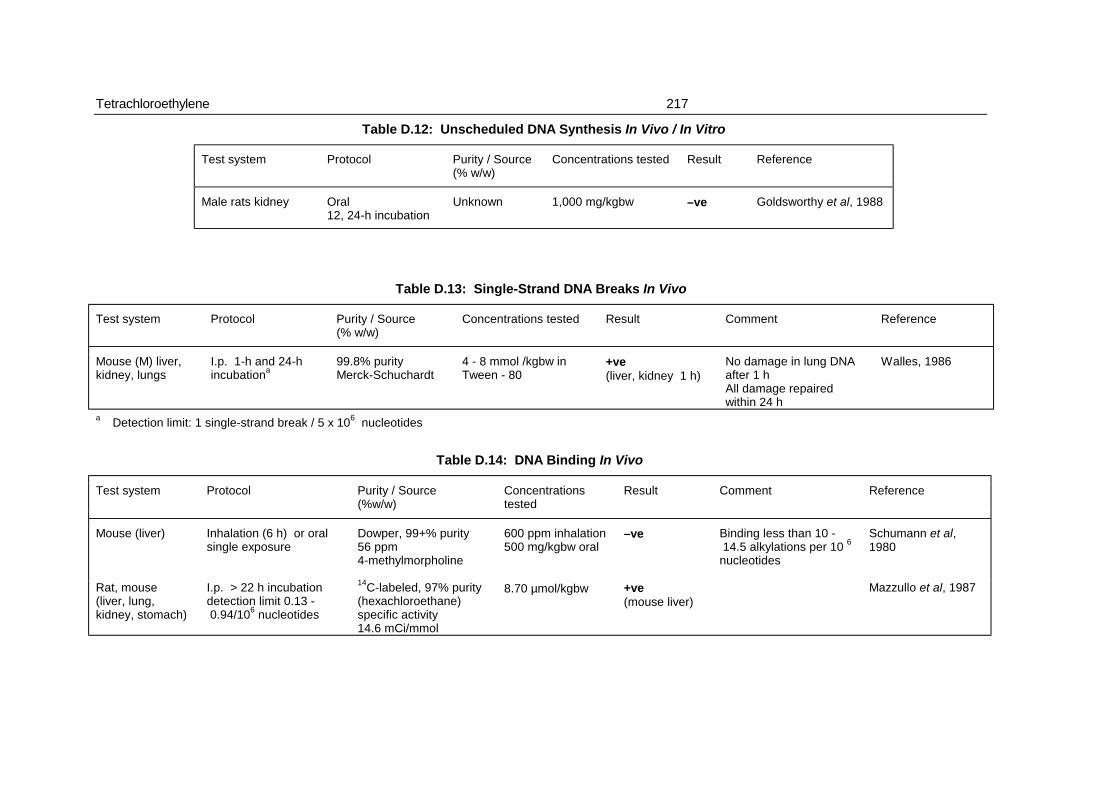
Tetrachloroethylene 217
Table D.12: Unscheduled DNA Synthesis In Vivo / In Vitro
Test system Protocol Purity / Source(% w/w)
Concentrations tested Result Reference
Male rats kidney Oral12, 24-h incubation
Unknown 1,000 mg/kgbw –ve Goldsworthy et al, 1988
Table D.13: Single-Strand DNA Breaks In Vivo
Test system Protocol Purity / Source(% w/w)
Concentrations tested Result Comment Reference
Mouse (M) liver,kidney, lungs
I.p. 1-h and 24-hincubationa
99.8% purityMerck-Schuchardt
4 - 8 mmol /kgbw inTween - 80
+ve(liver, kidney 1 h)
No damage in lung DNAafter 1 hAll damage repairedwithin 24 h
Walles, 1986
a Detection limit: 1 single-strand break / 5 x 10⁶ nucleotides
Table D.14: DNA Binding In Vivo
Test system Protocol Purity / Source(%w/w)
Concentrationstested
Result Comment Reference
Mouse (liver) Inhalation (6 h) or oralsingle exposure
Dowper, 99+% purity56 ppm4-methylmorpholine
600 ppm inhalation500 mg/kgbw oral
–ve Binding less than 10 - 14.5 alkylations per 10 6
nucleotides
Schumann et al,1980
Rat, mouse(liver, lung,kidney, stomach)
I.p. > 22 h incubationdetection limit 0.13 - 0.94/106 nucleotides
14C-labeled, 97% purity(hexachloroethane)specific activity 14.6 mCi/mmol
8.70 µmol/kgbw +ve(mouse liver)
Mazzullo et al, 1987
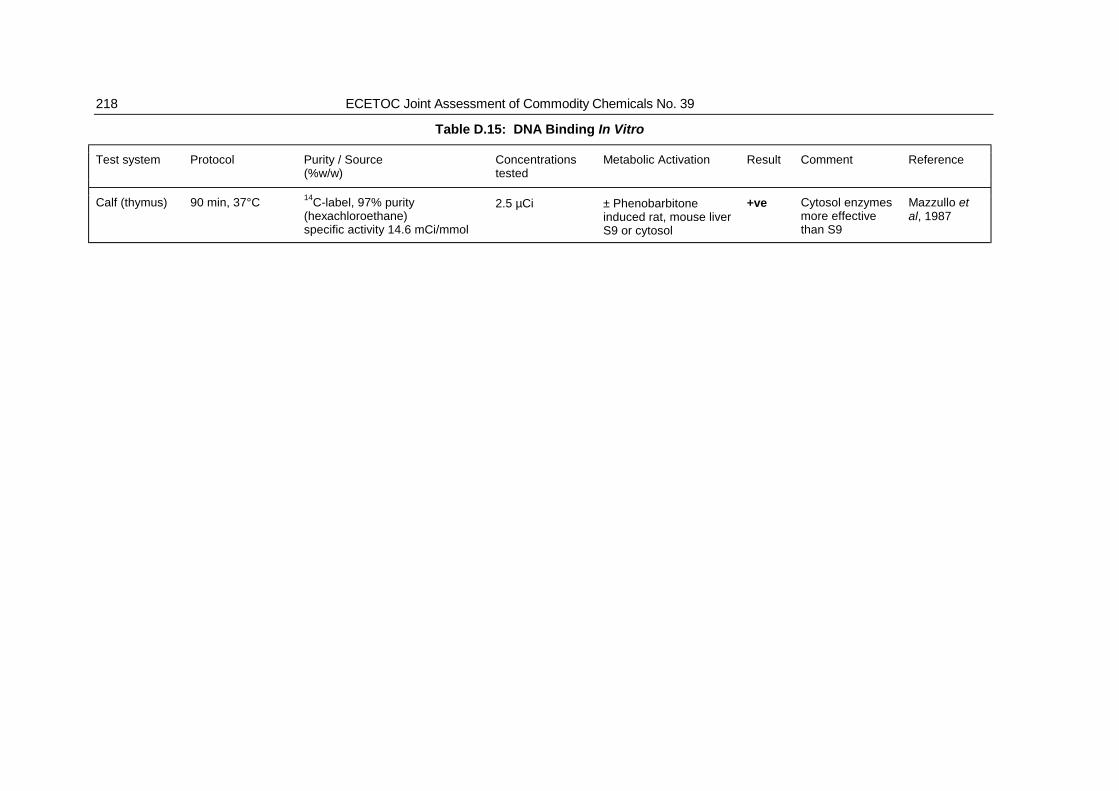
218 ECETOC Joint Assessment of Commodity Chemicals No. 39
Table D.15: DNA Binding In Vitro
Test system Protocol Purity / Source(%w/w)
Concentrationstested
Metabolic Activation Result Comment Reference
Calf (thymus) 90 min, 37°C 14C-label, 97% purity(hexachloroethane)specific activity 14.6 mCi/mmol
2.5 µCi ± Phenobarbitoneinduced rat, mouse liverS9 or cytosol
+ve Cytosol enzymesmore effectivethan S9
Mazzullo etal, 1987
Tetrachloroethylene 219
D.4 MISCELLANEOUS TEST SYSTEMS
D.4.1 Cell Transformation (Table D.16)
PER has been tested for its ability to induce transformation in various cell systems. No effects were
observed in BHK21/C13 and BALB/C-3T3 mouse cells (Longstaff and Ashby, 1978; Tu et al, 1985;
Milman et al, 1988). Transformed cell colonies were induced in an unusual test system using
Rauscher leukaemia virus-infected F344/N rat embryo cells (Price et al, 1978). Conflicting results
from different cell transformation test systems is common and makes uncertain their relevance to, and
reliability in, predicting carcinogenic activity.
D.4.2 Germ Cell Effects (Table D.17)
Effects on germ cells were studied in a sperm head abnormality test in mice and rats (Beliles et al,
1980). PER of low purity, which also produced weakly positive responses in other test systems,
induced an increase in the proportion of sperm with aberrant morphology in mice but not in rats. As
sperm morphology can be affected by non-genetic mechanisms, no conclusions regarding germ cell
mutagenicity can be drawn from these findings.

220 ECETOC Joint Assessment of Commodity Chemicals No. 39
Table D.16: Cell Transformation
Test system Protocol Purity/Source(% w/w)
Concentrations tested Metabolicactivation
Result Comment Reference
Rat embryocellsF 1706 p 108
48-h incubation 99.9%Eastman Kodak755428
97 - 970 µmol/l(=16.1 - 161 µg/ml)
None +ve Cytotoxic at 97 µM;positive control:3-methylcholantrene
Price et al, 1987
BALB/C-313 mouse 97 - 99% purityAldrich
0 - 250 µg/ml None –ve Cytotoxic at 250 µg/ml(4% survival)
Tu et al, 1985;Milman et al,1988
HamsterBHK 21/C13
Vapour phase Purity unknownICI MD 516
Unknown + Aroclor inducedrat liver S9
–ve Longstaff andAshby, 1978
Table D.17: Germ Cell Effects In Vivo
Test system Protocol Purity (% w/w) /Source
Concentrations tested(ppm) (mg/m3)a
Result Comment Reference
Rat, mouse spermhead abnormality
Inhalation(7 h/d, 5 d/wk)for 1, 4 and10 wk
91.4% purityNorth StrongLBI No 2537
100, 500 689 - 3,4455 –ve (rat)+ve (mouse)
500 sperm/animalexamined damage tospermatocytes,spermatogenia
Beliles et al,1980
a Converted values

Tetrachloroethylene 221
D.5 METABOLITES OF PER
The general lack of genotoxicity of PER has been discussed above. In addition, its metabolites from
the cytochrome P-450 pathway - tricholoroacetylchloride (Reichert et al, 1983) oxalic acid (Sayato et
al, 1987) TCA (Andersen et al, 1972; Waskel, 1978) and trichloroethanol (Bignami et al, 1980) - have
been shown to be non-mutagenic (Table D.18). It is noted, however, that TCA has been
demonstrated to cause chromosome aberrations and spermhead abnormalities in mice following i.p.
administration of 500 mg/kgbw (Bhunya and Behera, 1987).
D.5.1. Evaluation
These observations are consistent with the hypothesis that the mouse liver tumours arise through a
non-genotoxic mechanism. Although the GSH-pathway may produce a genotoxic metabolite in rats, it
does so only in the kidneys and it is therefore not relevant to the formation of mouse liver tumours.
For details, see ECETOC (1990).
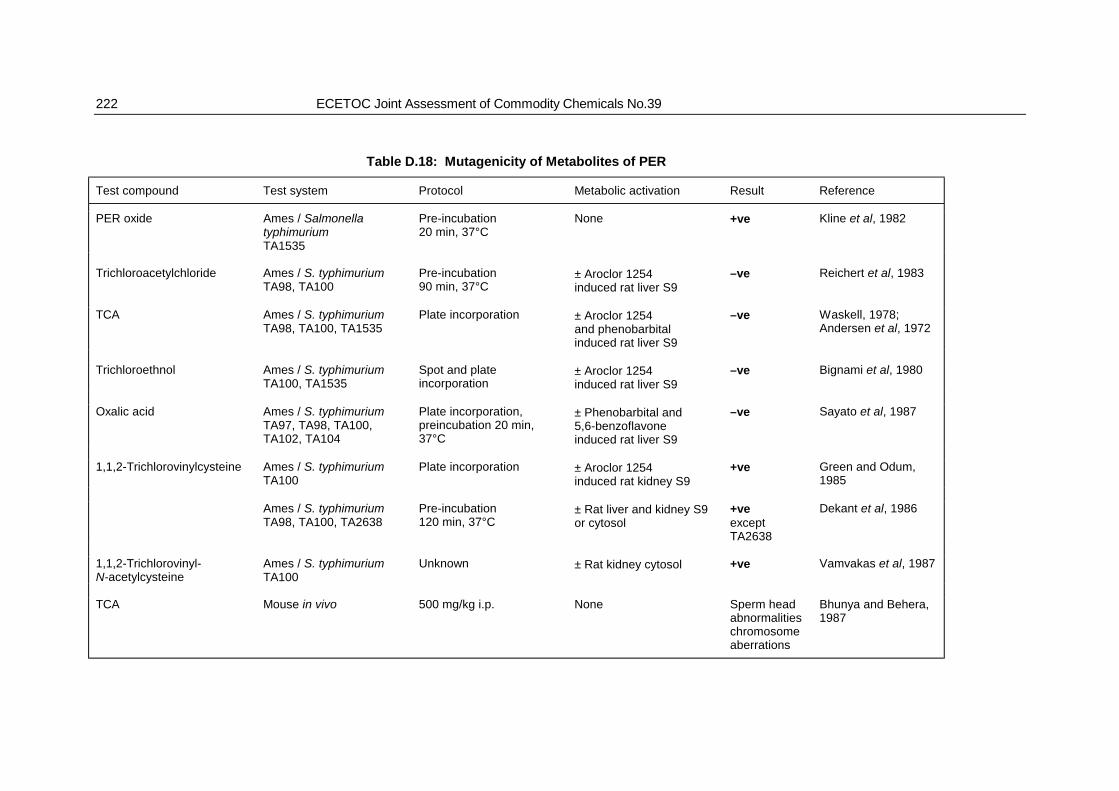
222 ECETOC Joint Assessment of Commodity Chemicals No.39
Table D.18: Mutagenicity of Metabolites of PER
Test compound Test system Protocol Metabolic activation Result Reference
PER oxide Ames / SalmonellatyphimuriumTA1535
Pre-incubation20 min, 37°C
None +ve Kline et al, 1982
Trichloroacetylchloride Ames / S. typhimuriumTA98, TA100
Pre-incubation90 min, 37°C
± Aroclor 1254induced rat liver S9
–ve Reichert et al, 1983
TCA Ames / S. typhimuriumTA98, TA100, TA1535
Plate incorporation ± Aroclor 1254and phenobarbitalinduced rat liver S9
–ve Waskell, 1978;Andersen et al, 1972
Trichloroethnol Ames / S. typhimuriumTA100, TA1535
Spot and plateincorporation
± Aroclor 1254induced rat liver S9
–ve Bignami et al, 1980
Oxalic acid Ames / S. typhimuriumTA97, TA98, TA100,TA102, TA104
Plate incorporation,preincubation 20 min,37°C
± Phenobarbital and5,6-benzoflavoneinduced rat liver S9
–ve Sayato et al, 1987
1,1,2-Trichlorovinylcysteine Ames / S. typhimuriumTA100
Plate incorporation ± Aroclor 1254induced rat kidney S9
+ve Green and Odum,1985
Ames / S. typhimuriumTA98, TA100, TA2638
Pre-incubation120 min, 37°C
± Rat liver and kidney S9or cytosol
+veexceptTA2638
Dekant et al, 1986
1,1,2-Trichlorovinyl-N-acetylcysteine
Ames / S. typhimuriumTA100
Unknown ± Rat kidney cytosol +ve Vamvakas et al, 1987
TCA Mouse in vivo 500 mg/kg i.p. None Sperm headabnormalitieschromosomeaberrations
Bhunya and Behera,1987
Tetrachloroethylene 223
BIBLIOGRAPHY
Abdul AS, Gibson TL and Rai DN, 1987. Statistical correlations for predicting the partition coefficient for non-
polar organic contaminants between aquifer organic carbon and water. Hazardous Wastes and Hazardous
Materials 4, 211-222.
Abedin Z, Cook RC and Milberg RM, 1980. Cardiac toxicity of perchloroethylene (a dry cleaning agent).
Southern Med J 73, 1081-1083.
Abrahamsson K, Dryssen D, Jogebrant G and Krysell M, 1989. Halocarbon concentrations in Askeroefjorden
related to the water exchange and inputs from the petrochemical site at Stenungsund. Vatten 45, 3-6.
Abrahamsson K, Ekdahl A, Collén J and Pedersén M, 1995a. Marine algae - a source of trichloroethylene
and perchloroethylene. Limnol Oceanogr 40, 1321-1326.
Abrahamsson K, Ekdahl A, Collén J and Pedersén M, 1995b. Formation and distribution of halogenated
volatile organics in sea water. In: Grimvall A and De Leer EWB (eds), Naturally-produced organohalogens.
Kluwer Academic, Delft, 317-326.
ACGIH (American Conference of Government Industrial Hygienists), 1996. Threshold limit values (TLVsTM)
for chemical substances and physical agents and biological exposure indices (BEIsTM). ACGIH, Cincinnati
OH, 29, 66.
AFS (Arbetarskyddsstyrelsens Författningssamling), 1996. Hygieniska gränsvärden, AFS 1996:2
Arbetarskyddsstyrelsen, Stockholm.
Aggazzotti G and Predieri G, 1986. Survey of volatile halogenated organics (VHO) in Italy. Levels of VHO in
drinking waters, surface waters and swimming pools. Water Research 20, P959-963.
Aggazzotti G, Fantuzzi G, Predieri G, Righi E and Moscardelli S, 1994a. Indoor exposure to
perchloroethylene (PCE) in individuals living with dry-cleaning workers. The Science of the Total Environment
156, 133-137.
Aggazzotti G, Fantuzzi G, Righi E, Predieri G, Gobba FM, Paltrinieri M and Cavalleri A, 1994b. Occupational
and environmental exposure to perchloroethylene (PCE) in dry cleaners and their family members. Arch Env
Health 49, 487-493.
Ahel M, Giger W, Molnar-Kubica E and Schaffner C, 1984. Organic micropollutants in surface waters of the
Glatt valley, Switzerland. Analysis of organic micropollutants in water. Report EUR 8518. Commission of the
EC, Luxembourg, 280-288.
Ahlborg GA, 1990a. Pregnancy outcome among women working in laundries and dry-cleaning shops using
tetrachloroethylene. Amer J of Ind Med 17, 567-575.
Ahlborg GA, 1990b. Validity of exposure data obtained by questionnaire. Two examples from
occupational reproductive studies. Scand J Work Environ Health 16, 284-288.
224 ECETOC Joint Assessment of Commodity Chemicals No.39
Alarie Y, 1981. Dose-response analysis in animal studies, prediction of human responses. Environ Health
Perspect 42, 9-13.
Albee RR, Mattsson JL, Bradley GJ and Spencer PJ, 1991. Acute neurophysiology effects of 1,1,2,2-
tetrachloroethylene in rats. R& D report. Dow Chemical, Midland MI.
Alberti J, 1989. Analysierbarkeit von halogenorganischen Verbindungen in Gewässern. VDI-Berichte 745,
373-393.
Alexander HC, McCarty WM and Bartlett EA, 1978. Toxicity of perchloroethylene, trichloroethylene, 1,1,1-
trichloroethane, and methylene chloride to fathead minnows. Bull Environ Contam Toxicol 20, 344-352.
Altmann L, Böttger A and Wirgand H, 1990. Neurophysiological and psychological measurements reveal
effects of acute low-level organic solvent exposure in humans. Int Arch Occup Environ Health 62, 493-
499.
Altmann L, Neuhah HF, Krämer U, Witten J and Jermann E, 1995. Neurobehavioral and
neurophysiological outcome of chronic low-level tetrachloroethylene exposure measured in
neighbourhoods of dry cleaning shops. Environmental Research 69, 83-89.
Altshuller AP, 1980. Lifetimes of organic molecules in the troposhere and lower stratosphere. Adv Environ
Sci Technol 10, 181-219.
Andersen KJ, Leighty EG and Takahashi MT, 1972. Evaluation of herbicides for possible mutagenic
properties. J Agr Food Chem 20, 649.
Andersson-Sköld Y, Grennfelt P and Pleijel K, 1992. Photochemical ozone creation potentials: a study of
different concepts. J Air Waste Manage Assoc 42, 1152-1158.
Antoine SR, DeLeon IR and O’Dell-Smith RM, 1986. Environmentally significant volatile organic pollutants in
human blood. Bull Environ Contam Toxicol 36, 364-371.
Anttila A, Pukkala E, Sallmén M, Hernberg S and Hemminki K, 1995. Cancer incidence among Finnish
workers exposed to halogenated hydrocarbons. J Occup Environ Med 37, 797-806.
Aoki A, Suzaki H, Chow MJ and Nomura Y, 1989. Olfactory disturbance caused by perchloroethylene. Pract
Otol Kyoto 82, 935-939 [abstract].
Appleby A, 1976. Atmospheric freons and halogenated compounds. Rutgers University, New Brunswick NJ.
EPA -600/3-76-108. US EPA, Research Triangle Park NC [NTIS: PB-262 432].
Appleby A, Lillian D and Singh HB, 1976. Comment on atmospheric halocarbons: a discussion with
emphasis on chloroform by Yung YL, McElroy MB and Wofsy SC. Geophysical Research Letters 3, 237.
Aranyi C, O'Shea WJ, Graham JA and Miller FJ, 1986. The effects of inhalation of organic chemical air
contaminants on murine lung host defenses. Fundamental and Applied Tox 6, 713-720.
Arbeidsinspectie, 1995. De nationale MAC-lijst 1995. Ministerie van Sociale Zaken en Werkgelegenheid P
145. Sdu Uitgeverij, Den Haag, 49.
Tetrachloroethylene 225
Arbeidstilsynet, 1995. Administrative normer for forurensning i arbeidsatmosfære. Veiledning til
arbeidsmiljøloven 361. Tiden Norsk Forlag, Oslo, 20.
Arbejdstilsynet, 1988. Graensevaerdier for stoffer og materialer. At-anvisning Nr 3.1.0.2, April 1988.
Arbejdstilsynet, København, 30.
Archer WL and Stevens VL, 1977. Comparison of chlorinated, aliphatic, aromatic and oxygenated
hydrocarbons as solvents. Ind Eng Chem Prod Res Dev 16, 319-325.
Arge Elbe, 1986. Wassergütedaten der Elbe - Zahlentafeln der Jahre 1980-82, 1984, 1985 und 1986.
Arbeitsgemeinschaft für die Reinhaltung der Elbe, Wassergütestelle Elbe, Hamburg.
Asal NR, Geyer JR, Risser DR, Lee ET, Kadamani S and Cherng N, 1988. Risk factors in renal cell
carcinoma II, medical history, occupation, multivariate analysis and conclusions. Cancer Detect Prevent
13, 263-279.
Aschengrau A, Ozonoff D, Paulu C, Coogan P, Vezina R, Heeren T and Zhang Y, 1993. Cancer risk and
tetrachloroethylene-contaminated drinking water in Massachusetts. Arch Environ Health 48, 284-292.
Atkinson R, 1986. Kinetics and mechanisms of the gas-phase reactions of the hydroxyl radical with organic
compounds under atmospheric conditions. Chem Rev 86, 69-201.
Atkinson R, 1994. Gas-phase tropospheric chemistry of organic compounds. J Phys Chem Ref Data,
Monograph No 2, 116.
Atlas E, Pollock W, Greenberg J, Heidt L and Thompson AM, 1993. Alkyl nitrates, nonmethane
hydrocarbons, and halocarbons over the Equatorial Pacific Ocean during SAGA 3. J Geophys 98, 16933-
16947.
Aucott M, 1997. Chlorine atoms and the global biogeochemical cycle, estimation of the global background
tropospheric concentration of chlorine atoms concentration based on perchloroethylene concentrations
and discussion of key aspects of the chlorine cycle. PhD thesis. Rutgers University, New Brunswick NJ.
Ballschmiter K, 1992. Transport and fate of organic compounds in the global environment. Angew Chem
Int Ed Engl 31, 487-664.
Ballschmiter K, Haltrich W, Kühn W and Niemitz W (eds), 1987. HOV-Studie, Halogenorganische
Verbindungen in Wässern. Fachgruppe Wasserchemie, Forschungsbericht Wasserwirtschaft 102 04 323.
GDCh, München, 85.
Barrows ME, Petrocelli SR, Macek KJ and Carroll JJ, 1980. Bioconcentration and elimination of selected
water pollutants by bluegill sunfish (Lepomis macrochirus). In: Haque R (ed), Dynamics, exposure and
hazard assessment of toxic chemicals. Ann Arbor Science, Ann Arbor MI, 379-392.
Barsoum GS and Saad K, 1934. Relative toxicity of certain chlorine derivatives of the aliphatic series.
Quart J Pharm 7, 205-214.
226 ECETOC Joint Assessment of Commodity Chemicals No.39
Bartsch H, Malaveille C, Barbin A and Planche G, 1979. Mutagenic and alkylating metabolites of
haloethylenes, chlorobutadienes and dichlorobutenes produced by rodent or human liver tissues, evidence for
oxirane formation by P450-linked microsomal mono-oxygenases. Arch Toxicol 41, 249-277.
Bates BA, Brenniman GR, Allen RJ and Anderson RJ, 1991. Elution profiles of three chlorinated
hydrocarbons leaching through sandy soil. J Environ Eng 117, 279-290.
Bauer U, 1981a. Human exposure to the environmental chemicals-investigations on volatile organic
halogenated compound in water, air, food and human tissues, IV, communication: calculation of human
exposure. Zbl Bakt Hyg 174, 556-583.
Bauer U, 1981b. Belastung des Menschen durch Schadstoffe in der Umwelt, Untersuchungen über leicht
flüchtige organische Halogen-verbindungen in Wasser, Luft, Lebensmitteln und im menschlichen
Gewebe, III, Mitteilung: Untersuchungsergebnisse. Zbl Bakt Hyg 174, 200-237.
Bauer U, 1981c. Belastung des Menschen durch Schadstoffe in der Umweltuntersuchungen über leicht
flüchtige organische Halogenverbindungen in Wasser, Luft, Lebensmitteln und im menschlichen Gewebe, IV,
Mitteilung: Bilanzierung der Belastung des Menschen durch Organohalogenverbindungen aus der Umwelt.
Zbl Bakt Hyg 174, 556-583.
Bauer U, 1990. Occurence of tetrachloroethylene in the FRG. In: Hutzinger O and Fiedler H (eds), Dioxin
'90, EPRI PCB-Seminar, vol.2, organohalogen compounds. Eco-Informa, Bayreuth, 385-388.
Bauer U, 1991. Occurrence of tetrachloroethylene in the Federal Republic of Germany. Chemosphere 23,
1777-1781.
Bauer U and Gregorzik H, 1982. Perchlorethylen in Trinkwasser, Luft und Lebensmitteln - eine ubiquitäre
Umweltchemikalie. Forum Städte-Hygiene 33, 255-258.
Bauer U and Selenka F, 1982. Belastung der Bevölkerung durch Haloforme und chlorierte Lösemittel, in
Trinkwasser im Vergleich zu Luft und Lebensmitteln. Vom Wasser 59, 7-17.
Bauer C and Dietze C, 1992. Phytotoxizitätstest an einer monokotylen Pflanzenart (Hafer, Avena sativa L.)
mit Tetrachloroethen nach dem Verfahrenvorschlag ‘Phytotoxizitätest an einer monokotylen Pflanzenart
(Avenia sativa L) und einer dikotylen Pflanzenart (Brassica rapa ssp. rapa Metzg.).' Batelle Institute report
5. Battelle Europe, Frankfurt am Main.
Bazin C et al, 1987. Compared sensitivity of luminescent marine bacteria (Photobacterium phosphoreum)
and Daphnia bioassays. Sciences de l'eau 6, 403-413.
Behnke W and Zetzsch C, 1991. The yield of carbon tetrachloride from the troposheric photochemical
degradation of perchloroethylene. Fraunhofer-Institut für Toxikologie und Aerosolforschung, Hannover.
Beier R, Balfanz E and Koenig J, 1989. Immissionsmessungen leichtflüchtiger halogenierter
Kohlenwasserstoffer in der Nähe von Chemisch-Reinigungsanlagen. VDI Berichte 745, 235-243.
Tetrachloroethylene 227
Beliles RP, Brusick DJ and Mecler FJ, 1980. Teratogenic-mutagenic risk of workplace contaminants:
trichloroethylene, perchloroethylene, and carbon disulfide. Litton Bionetics, Kensington MD. NIOSH,
Cincinatti OH [NTIS PB82-185075].
Benoit FM, Davidson WR, Lovett AM, Nacson S and Ngo A, 1985. Breath analysis by API/MS, human
exposure to volatile organic solvents. Int Arch Occup Environ Health 55, 113-120.
Benson EN and Hunter JV, 1977. Comparative effects of halogenated hydrocarbon solvents on waste
disposal processes. Proc Ind Waste Conf 31, 614-627.
Besemer AC, Eggels PG, van Esch GJ, Hollander JCT, Huldy HJ and Maas HJM, 1984. Criteriadocument
over tetrachlooretheen. Publikatiereeks Lucht 32. Ministerie van Volkshuisvesting, Ruimtelijke Ordening en
Milieubeheer. ‘s-Gravenhage.
Bhunya SP and Behera BC, 1987. Relative genotoxicity of trichloroacetic acid (TCA) as releaved by different
cytogenetic assays: bone marrow chromosome aberration, micronucleus and sperm-head abnormality in the
mouse. Mutation Research 188, 215-221 [Chem Abstr 107, 91629d].
Bianchi AP, Varney MS and Philips J, 1991. Analysis of volatile organic compounds in estuarine
sediments using dynamic headspace and gas chromatography-mass spectrometry. J Chromatogr 542,
413-450.
Bignami M, Conti G, Conti L, Crebelli R, Misuraca F, Puglia AM, Randazzo R, Sciandrello G and Carere A,
1980. Mutagenicity of halogenated aliphatic hydrocarbons in Salmonella typhimurium, Streptomyces
coelicolor and Aspergillus nidulans. Chem Biol Interact 30, 9-23.
Binnemann PH, Sandmeyer U and Schmuck E, 1983. Gehalt von Schwermetallen, Organochlorpesticiden,
PCB und flüchtigen Organohalogenverbindungen in Fischen des Hochrheins, Oberrheins und Bodensees.
Z Lebensm Unters Forsch 176, 253-261.
Birner G, Richling C, Henschler D, Anders MW and Dekant W, 1994. Metabolism of tetrachloroethene in
rats: identification of N-(dichloroacetyl)-L-lysine and N-(trichloroacetyl)-L-lysine as protein adducts. Chem
Res Toxicol 7, 724-732.
Birner G, Rutkowska A and Dekant W, 1998. N-Acetyl-S-(1,2,2-trichlorovinyl)-L-cysteine and 2,2,2-
trichloroethanol. Two novel metabolites of tetrachloroethene in humans after occupational exposure. Drug
Metabolism and Disposition 24, 41-48.
Biswas N, Zytner RG and Bewtra JK, 1992. Model for predicting PCE desorption from contaminated soils.
Water Env Res 64, 170-178.
Blair A, Decoufle P and Grauman D, 1979. Causes of death among laundry and dry-cleaning workers. Am J
Public Health 69, 508-511.
Blair A, Stewart PA, Tolbert PE, Grauman D, Moran FX, Vaught J and Rayner J, 1990. Cancer and other
causes of death among a cohort of dry cleaners. Brit J Ind Med 47, 162-168.

228 ECETOC Joint Assessment of Commodity Chemicals No.39
Blair A, Tolbert P, Thomas T and Grauman D, 1986. Mortality among dry cleaners (abstract). Med Lav 77,
82-83.
Blake DR, Chen TY, Smith TW, Wang CJL, Wingenter OW, Blake NJ and Rowland FS, 1996. Three-
dimensional distribution of nonmethane hydrocarbons and halocarbons over the northwestern Pacific
during the 1991 Pacific Exploratory Mission (PEM-West A). J Geophys Res 101, 1763-1778.
Blum DJW and Speece RE, 1991. QSAR for chemical toxicity to environmental bacteria. Ecotoxicol Environ
Safety 22, 198-224.
BMA (Bundesministerium für Arbeitsschutz), 1995. Grenzwerte in der Luft am Arbeitsplatz,
Luftgrenzwerte, MAK, TRK. Neufassung der TRGS 900, April 1995. Bundesarbeitsblatt, 65.
BOCCRF, 1995. Avis de la commission de sécurité des consommateurs relatif aux risques toxicologiques
présentés par les machines de nettoyage à sec fonctionnant en libre-service (requête n° 94-120). Bulletin
Officiel de la Concurrence, de la Consommation et de la Répression des Fraudes, Paris, 6 novembre 1995,
435-441.
Bogen KT and McKone TE, 1987. Prediction of risk from indoor exposure to tetrachloroethylene:
pharmacokinetic considerations under steady-state and dynamic exposure conditions. Preprint APCA Annual
Meeting 3, 18. University of California, Livermore CA.
Bogen KT, Hall LC, McKone TE, Layton DW and Patton SE, 1987. Health risk assessment of
tetrachloroethylene (PCE) in California drinking water. University of California, Livermore CA. California
Public Health Foundation, Berkeley CA.
Bohlen H, Hicke K, Stoebel AO, Zierott M and Thiemann W, 1989. Die Belastung der Unterweser im
Bremischen Raum mit Halogenorganika und Phosphorsäureestern I. Vom Wasser 72, 185-197.
Boillat MA, Berode M and Droz PO, 1986. Surveillance de personnes exposées au perchloroéthylène ou
au styrène. Médecine Sociale et Préventive 31, 260-262.
Bois FY, Zeise L and Tozer TN, 1990. Precision and sensitivity of pharmacokinetic models for cancer risk
assessment, tetrachloroethylene in mice, rats, and humans. Toxicol Appl Pharmacol 102, 300-315.
Bolanowska W and Golacka J, 1972. Inhalation and excretion of tetrachloroethylene in men in experimental
conditions. Medycyna Pracy 23, 109-119 [Polish; English summary].
Bonashevskaya TI, Belyaeva NN, Brodskii VY, Marshak TL and Tsulaya VR, 1977. Polyploidy as a
mechanism of compensation in the presence of chemical factors in the environment. Gig Sanit 12, 81-83.
Bond GG, McLaren EA, Sabel FL, Bodner KM, Lipps TE and Cook RR, 1990. Liver and biliary tract
cancer among chemical workers. Am J Ind Med 18, 19-24.
Bonnet P, Francin J-M, Gradiski D, Raoult G and Zissu D, 1980. Détermination de la concentration léthale50
des principaux hydrocarbures aliphatiques chlorés chez le rat. Arch Mal Prof 41, 317-32.
Bosco MG, Figa-Talamanca I and Salerno S, 1987. Health and reproductive status of female workers in dry-
cleaning shops. Int Arch Occup Environm Health 59, 295-301.
Tetrachloroethylene 229
Böttger A, Obe G, Thenhaus-Casper U and Ewers U, 1990. Cytogenetische Befunde bei Perchloroethylen-
Exponierten. Presented at: Deutsche Gesellschaft für Arbeitsmedizin, 30. Jahrestagung, Frankfurt-Hoechst,
28-31.5.1990.
Bouchereau JM, 1992. Monographie sur 7 composés organiques chlorés. CITEPA, 1-15.
Boulet L-P, 1988. Increases in airway responsiveness following acute exposure to respiratory irritants. Chest
94, 476-481.
Bouwer EJ and McCarty PL, 1982. Removal of trace chlorinated organic compounds by activated carbon and
fixed-film bacteria. Environ Sci Technol 16, 836-843.
Bouwer EJ, McCarty PL and Lance JC, 1981a. Trace organic behaviour in soil columns during rapid
infiltration of secondary waste water. Water Res 15, 151-160.
Bouwer EJ, Rittmann BE and McCarty PL, 1981b. Anaerobic degradation of halogenated 1- and 2-carbon
organic compounds. Environ Sci Technol 15, 596-599.
Brack W and Rottler H, 1994. Toxicity testing of highly volatile chemicals with green algae. Environmental
Science and Pollution Research International 1, 223-228.
Bridges BA, 1978. On the detection of volatile liquid mutagens with bacteria: experiments with dichlorvos
and epichlorhydrin. Mut Res 54, 367-371.
Bringmann G and Kühn R, 1982. Ergebnisse der Schadwirkung wassergefährdender Stoffe gegen Daphnia
magna in einem weiterentwickelten standardisierten Testverfahren. Z Wass Abw Forsch 15, 1-6.
Briving C, Jacobson I, Hamberger A, Kjellstrand P, Haglid P and Rosengren LE, 1986. Chronic effects of
perchloroethylene and trichloroethylene on the gerbil brain amino acids and glutathione. Neurotoxicologist 7,
101-108.
Broderius S and Kahl M, 1985. Acute toxicity of organic chemical mixtures to the fathead minnow. Aquatic
Toxicology 6, 307-322.
Bronzetti G, Bauer C, Corsi C, Del Carratore R, Galli A, Nieri R and Paolini M, 1983. Genetic and
biochemical studies on perchloroethylene in vitro and in vivo. Mutation Research 116, 323-331.
Brooke DN, Crookes MJ and Howe PD, 1993. Environmental hazard assessment: tetrachloroethylene.
Building Research Establishment, Watford UK.
Brown DP and Kaplan SD, 1987. Retrospective cohort mortality study of dry-cleaner workers using
perchloroethylene. J Occupational Medicine 29, 535-541.
Brown PH, Cape JN and Farmer JG, 1993. Chlorinated C1- and C2-hydrocarbons in the needles of Scots
pine (Pinus sylvestris L) in three forests of Northern Britain. In: Grimvall A and De Leer EWB (eds),
Naturally-Produced Organohalogens. Kluwer Academic, Dortrecht, 397-401.
Brownson RC, Alavanja MCR and Chang JC, 1993. Occupational risk factors for lung cancer among
nonsmoking women, a case-control study in Missouri (United States). Cancer Causes Control 4, 449-454.
230 ECETOC Joint Assessment of Commodity Chemicals No.39
Bruckmann P and Kersten W, 1988. The occurrence of chlorinated and other organic trace compounds in
urban air. Chemosphere 17, 2363-2380.
Brüggemann R and Trapp S, 1988. Release and fate modelling of highly volatile solvents in the river Main.
Chemosphere 17, 2029-2041.
Brusseau ML and Reid ME, 1991. Nonequilibrium sorption of organic chemicals by low organic-carbon
aquifer materials. Chemosphere 22, 341-350.
Brusseau ML, Jessup RE and Rao PSC, 1991. Nonequilibrium sorption of organic chemicals: elucidation
of rate-limiting processes. Environ Sci Technol, 25 134-142.
BUA (Beratergremium für umweltrelevante Altstoffe der Gesellschaft Deutscher Chemiker), 1994.
Tetrachloroethen (PER). BUA-Stoffbericht 139. Hirzel, Frankfurt 44, 46,146.
Buben JA and O'Flaherty EJ, 1985. Delineation of the role of metabolism in the hepatotoxicity of
trichloroethylene and perchloroethylene, a dose-effect study. Toxicol Appl Pharmacol 78, 105-122.
Buccafusco RJ, Ells SJ and LeBlanc GA, 1981. Acute toxicity of priority pollutants to bluegill (Lepomis
macrochirus). Bull Environ Contam Toxicol 26, 446-452.
Buszka PM, Zaugg SD and Werner MG, 1990. Determination of trace concentrations of volatile organic
compounds in ground water using closed-loop stripping, Edwards Aquifer, Texas. Bulletin of
Environmental Contamination and Toxicology 45, 507-515.
Butler R and Snelson A, 1979. Kinetics of the homogenous gas phase hydrolysis of CCl3COCl, CCl2HCOCl,
CH2ClCOCl and COCl2. J Air Poll Control Ass 29, 833-837.
Bysczkowski JZ and Fisher JW, 1994. Lactational transfer of tetrachloroethylene in rats. Risk Anal 14,
339-349.
Bysczkowski JZ and Fisher JW, 1995. A computer program linking physiologically based pharmacokinetic
model with cancer risk assessment for breast fed infants. Comput Methods Programs Biomed 46, 155-
163.
Bysczkowski JZ, Kinkead ER, Leahy HF, Randall GM and Fisher JW, 1994. Computer simulation of the
lactational transfer of tetrachloroethylene in rats using a physiologically based model. Toxicol Appl
Pharmacol 125, 228-236.
Calandra TD, Caruso JE and Shahied SI, 1987. Mutagenicity of volatile organic compounds commonly
found in potable water supplies. Environ Mut 9, 22.
Call DJ, Brooke LT, Ahmad N and Richter JE, 1983. Toxicity and metabolism studies with EPA priority
pollutants and related chemicals in freshwater organisms. EPA 600/3-83-095. US-EPA, Duluth MN [NTIS
PB83-263665].
Callahan MA, Slimak MW, Gabel NW, May IP, Fowler CF, Freed JR, Jennings P, Durfree RL, Whitmore FC,
Mästri B, Mabey WR, Holt BR and Gould C, 1979. Water-related environmental fate of 129 priority pollutants,
vol 2. Office of Water Planning and Standards. EPA-440/4-79-029b. US EPA, Washington DC, 53, 1-13.
Tetrachloroethylene 231
Callen DF, Wolf CR and Philpot RM, 1980. Cytochrome P450-mediated genetic activity and cytotoxicity of
seven halogenated aliphatic hydrocarbons in Saccharomyces cerevisiae. Mut Res 77, 55-63.
Carlson GP, 1975. Epinephrine-induced cardiac arrhythmias in rabbits exposed to tetrachloroethylene.
Toxicol Letts 19,113-117.
Carpenter CP, 1937. The chronic toxicity of tetrachloroethylene. J Ind Hyg Toxicol 19, 323-326.
Carpenter CP, Smyth HF and Pozzani VC, 1949. The assay of acute vapour toxicity, and the grading and
interpretation of results on 96 chemical compounds. J Ind Hyg Toxicol 31, 343-346.
Cavalleri A, Gobba F, Paltrinieri M, Fantuzzi G, Righi E and Aggazotti G, 1994. Perchloroethylene
exposure can induce colour vision loss. Neuroscience Letters 179, 162-166.
CEDRE (Centre de Documentation, de Recherche et d'Expérimentations sur les Pollutions Accidentelles des
Eaux), 1990. Mini-guide d'intervention et de lutte face au risque chimique: perchloroéthylène. CEDRE,
Plouzane, France, 30 p.
Cerná M and Kypenová H, 1977. Mutagenic activity of chloroethylenes analysed by screening system
test. Mut Res 46, 214-215.
Chang JS and Kaufman F, 1977. Kinetics of the reactions of hydroxyl radicals with some halocarbons:
CHFCl2, CHF2Cl, CH3CCl3, C2HCl3 and C2Cl4. J Chem Phys 66, 4989-4994.
Chen CW, Davidson IWF, Vaughan-Dellarco VL, Gibb H and Greenberg M, 1983. Health assessment
document for tetrachloroethylene (perchloroethylene), review draft. Office of Health and Environmental
Assessment. EPA-600/8-82-005B. US EPA, Washington DC [NTIS PB84-155803].
Chiou CT, Freed VH, Schmedding DW and Kohnert RL, 1977. Partition coefficient and bioaccumulation of
selected organic chemicals. Environ Sci & Technol 11, 475-478.
Chiou CT, Freed VH, Peters LJ and Kohnert RL, 1980. Evaporation of solutes from water. Environment
International 3, 231-236.
Chmielewski J, Tornaszecdki R, Glombiowski P, Kowalewski W, Kwietkowskie SR, Szezekocki W and
Winnicka A, 1976. Clinical observations of the occupational exposure to tetrachloroethylene. Biol Inst Med
Morskiej 27, 197-206.
Chodola GR, Biswas N, Bewtra JK, St Pierre CG and Zytner RG, 1989. Fate of selected volatile organic
substances in aqueous environment. Water Poll Res J Canada, 24, 119-142.
Christensen BV and Lynch HJ, 1993. The effect of anthelminthics on the host, I, tetrachloroethylene, II,
hexylresorcinol. J Pharmacol Exp Ther 48, 311-316.
CITI (Chemicals Inspection and Testing Institute Japan) eds, 1992. Tetrachloroethylene, biodegradation
and bioaccumulation. In: Data of existing chemicals based on the CSCL (Chemical Substance Control
Law) Japan. Japan Chemical Industry Ecology & Information Center, Tokyo, 2-25.
232 ECETOC Joint Assessment of Commodity Chemicals No.39
Class T and Ballschmiter K, 1986. Chemistry of organic traces in air, VI, distribution of chlorinated C1 - C4
hydrocarbons in air over the northern and southern Atlantic Ocean. Chemosphere 15, 413-427.
Class T and Ballschmiter K, 1987. Global baseline pollution studies, X, atmospheric halocarbons: global
budget estimations for tetrachloroethylene, 1,2-dichloroethane, 1,1,1,2-tetrachloroethane, hexachloroethane
and hexachlorobutadiene. Estimation of the hydroxyl radical concentrations in the troposphere of the
northern and southern hemisphere. Fresenius Z Anal Chem 327, 198-204.
Cohn P, Klotz J, Bove F, Berkowitz M and Fagliano J, 1994. Drinking water contamination and the
incidence of leukemia and non-Hodgkin’s lymphoma. Environ Health Perspectives 102, 556-561.
Connor TH, Theiss JC, Hanna HA, Menteith DK and Matney TS, 1985. Genotoxicity of organic chemicals
frequently found in the air of mobile homes. Toxicol Lett 25, 33-40.
Coopers and Lybrand, 1995. Methylene chloride, perchloroethylene and trichloroethylene. Worldwide
statistics for the years 1993-1994. Coopers and Lybrand, Brussels.
Costa AK and Ivanetich KM, 1984. Chlorinated ethylenes: their metabolism and effect on DNA repair in
rat hepatocytes. Carcinogenesis 5, 1629-1636.
Cupitt LT, 1980. Fate of toxic and hazardous materials in the air environment. Environmental Sciences
Research Laboratory. EPA-600/3-80-084. US EPA, Research Trangle park NC [NTIS PB80-221948].
Czaplenski U, Qualen G and Schenck HG, 1988. Vergleichende Untersuchungen zur PER-Belastung in
Nachbarwohnungen von chemischen Reinigungsanlagen.
Czuczwa J, Leuenberger C and Giger W, 1988. Seasonal and temporal changes of organic compounds in
rain and snow. Atmos Environ 22, 907-916.
Dallas CE, Muralidhara S, Chen XM, Ramanathan R, Varkonyi P, Gallo JM and Bruckner JV, 1994a. Use
of a physiologically based model to predict systemic uptake and respiratory elimination of
perchloroethylene. Toxicol Appl Pharmacol 128, 60-68.
Dallas CE, Chen XM, Muralidhara S, Varkonyi P and Bruckner JV, 1994b. Development of a
physiologically based pharmacokinetic model for perchloroethylene using tissue concentration-time data.
Toxicol Appl Pharmacol 128, 50-59.
Dallas CE, Chen XM, Muralidhara S, Varkonyi P, Tackett RL and Bruckner JV, 1994c. Use of tissue
disposition data from rats and dogs to determine species differences in input parameters for a
physiological model for perchloroethylene. Environ Res 67, 54-67.
Danneberg G, 1993. Auswirkungen von Tetrachlorethen auf die Aktivität der Bodenmikroflora
(Dehydrogenaseaktivität). Battelle Institut Report 5. Umweltbundesamt, Berlin.
Davezies P, Briant V, Prost G and Tolot F, 1983. Etude du risque dû aux solvants pour le personnel des
entreprises de nettoyage à sec. Arch Mal Prof 44, 159-174.
Dawes and Waldock, 1994. Measurement of volatile organic compounds at UK national monitoring plan
stations. Marine Pollution Bulletin 28, 291-298.
Tetrachloroethylene 233
De Bortoli M, Knöppel H, Pecchio E, Peil A, Rogora L, Schauenburg H, Schlitt H and Vissers H, 1986.
Concentrations of selected organic pollutants in indoor and outdoor air in northern Italy. Environment
International 12, 343-350.
De Bruin WP, Kotterman MJJ, Posthumus MA, Schraa G and Zehnder AJB, 1992. Complete biological
reductive transformation of tetrachloroethene to ethane. Appl Env Microbiol 58, 1996-2000.
De Ceaurriz J, Desiles JP, Bonnet P, Marignac B, Muller J and Guenier JP, 1983. Concentration-dependent
behavioural changes in mice following short-term inhalation exposure to various industrial solvents. Toxicol
Appl Pharmacol 67, 383-389.
De Vries T, Den Tonkelaar EM, van Leeuwen FXR and Danse LHJC, 1982. Onderzoek naar de subacute
orale toxiciteit van perchloorethyleen. Report 618105 001. Rijks Instituut voor de Volksgezondheid,
Bilthoven.
Dekant W, Vamvakas S, Berthold K, Schmidt S, Wild D and Henschler D, 1986. Bacterial β-lysase mediated
cleavage and mutagenicity of cysteine conjugates derived from the nephrocarcinogenic alkenes
trichloroethylene, tetrachloroethylene and hexachlorobutadiene. Chem-Biol Interactions 60, 31-45.
Delzell E, Doul J, Giesy J, Mackay D, Munro I and Williams G, 1994. Interpretive review of the potential
adverse effects of chlorinated organic chemicals on human health and the environment, report of an expert
panel. Willes F, CanTox. Chapter 9, section 2.2 "chlorinated alkene". Reg. Toxicol. and Pharmacol 20,
S610, S626-S635.
DeMore WB, Sander SP, Golden DM, Hampson RF, Kurylo MJ, Howard CJ, Ravishankara AR, Kolb CE
and Molina MJ, 1994. Chemical kinetics and photochemical data for use in stratospheric modeling.
Evaluation number 11. NASA Jet Propulsion Laboratory, Pasadena, CA, 23.
Derwent RG and Eggleton AEJ, 1978. Halocarbon lifetimes and concentration distributions calculated using
a two-dimensional tropospheric model. Atmos Environ 12, 1261-1269.
Derwent RG and Jenkin ME, 1990. Hydrocarbon involvement in photochemical ozone formation in Europe.
AERE 13736, United Kingdom Energy Authority, Harwell Laboratory, HMSO Publications, London.
Derwent RG and Jenkin ME, 1991. Hydrocarbons and the long-range transport of ozone and PAN across
Europe. Atmos Environ 25A, 1661-1678.
Devillers J, Chambon P and Zakarya D, 1987. A predictive structure toxicity model with Daphnia magna.
Chemosphere 16, 1149-1163.
DFG (Deutsche Forschungsgemeinschaft, Senatskommission zur Prüfung gesundheitschädlicher
Arbeitsstoffe), 1988. Tetrachlorethen (Perchlorethylen, "Per"). In: Henschler D (ed), Gesundheits-schädliche
Arbeitsstoffe, toxikologish-arbeitsmedizinische Begründing von MAK-Werten, 14th ed. VCH, Weinheim.
DFG (Deutsche Forschungsgemeinschaft, Senatskommission zur Prüfung gesundheits-schädlicher
Arbeitsstoffe), 1997. MAK- und BAT-Werte-Liste 1996, Maximale Arbeitsplatzkonzentrationen und
Biologische Arbeitsstofftoleranzwerte. Mitteilung 31. VCH, Weinheim 92, 162.
234 ECETOC Joint Assessment of Commodity Chemicals No.39
Dickson AG and Riley JP, 1976. The distribution of short-chain halogenated aliphatic hydrocarbons in some
marine organisms. Marine Pollution Bulletin 7, 167-169.
Dilling WL, 1977. Interphase transfer processes, 2, evaporation rates of chloromethanes, ethanes, ethylenes,
propanes and propylenes from dilute aqueous solutions. Comparison with theoretical predictions. Environ Sci
Technol 11, 405-409.
Dilling WL, 1982. Atmospheric environment. In: Environmental risk analysis for chemicals, Conway E (ed).
Van Nostrand Reinhold, New York, 154-197.
Dilling WL, Tefertiller NB and Kallos GJ, 1975. Evaporation rates and reactivities of methylene chloride,
chloroform, 1,1,1-trichloroethane, trichloroethylene, tetrachloroethylene and other chlorinated compounds in
dilute aqueous solutions. Environ Sci Technol 9, 833-838.
Dimitriades B, Gay BW, Arnts RR and Seila RL, 1983. Photochemical reactivity of perchloroethylene: a new
appraisal. J Air Pollution Control Association 33, 575-587.
DiStefano TD, Gosset JM and Zinder SH, 1991. Reductive dechlorination of high concentrations of
tetrachloroethene to ethene by an anaerobic enriched culture in the absence of methanogenesis. Appl Env
Microbiol 57, 2287-2292.
DiStefano TD, Gosset JM and Zinder SH, 1992. Hydrogen as an electron donor for dechlorination of
tetrachloroethene by an anaerobic mixed culture. Appl Env Microbiol 58, 3622-3629.
DiVincenzo GD and Krasavage WJ, 1974. Serum ornithine carbamyltransferase as a liver response test
for exposure to organic solvents. Am Ind Hyg Assoc J 35, 21-29.
Dohdoh K, Kataoka M, Yamamoto O, Kodani S, Nakamoto K, Ishikawa T and Kiyooka H, 1985. Survey of
unregulated substances in ambient air, II, low-boiling point organic chlorinated compounds. Hiroshima-shi
Eisei Kenkyusho Nenpo 1984, 73-77 [Japanese].
Doust HG and Huang JC, 1992. The fate and transport of hazardous chemicals in the subsurface
environment. Wat Sci Tech 25, 169-176.
Doyle P, Roman E, Beral V and Brookes M, 1997. Spontaneous abortion in dry cleaning workers potentially
exposed to perchloroethylene. Occup Environ Med 54, 848-853.
Dräger, 1982. Prüfröhrchen-Taschenbuch. 5. Auflage. Drägerwerk, Lübeck.
Drew RT, Patel JM and Lin F-N, 1978. Changes in serum enzymes in rats after inhalation of organic solvents
singly and in combination. Toxicol Appl Pharmacol 45, 809-819.
Duh RW and Asal NB, 1984. Mortality among laundry and dry cleaning workers in Oklahoma. Am J of Public
Health 74, 1278-1280.
Duprat P and Bonnet P, 1979. Study of organic lesions in the mouse produced by chlorinated aliphatic
solvents administered by inhalation [French]. INRS Bull doc 1103, 73-101.
Tetrachloroethylene 235
Duprat P, Delsant L and Gradiski D, 1976. Irritant potency of the principal aliphatic chloride solvents on
the skin and ocular mucous membranes of rabbits. Eur J Toxicol 3, 171-177.
Duprat P, Bonnet P, Zissu D et al, 1979. Tritiated thymidine uptake by the lung under low concentrations
of chlorinated solvents. IRCS Med Sci 7, 242
Dybing F and Dybing O, 1946. The toxic effect of tetrachlormethane and tetrachlorethylene in oily
solution. Acta Pharmacol 2, 223-226.
Dyrssen D, Fogelqvist E, Krysell M and Sturm R, 1990. Release of halocarbons from an industrial estuary.
Tellus 42B, 162-169.
EC (European Communities), 1975. Council Directive 75/440/EEC of 16 June 1975 concerning the quality
required of surface water intended for the abstraction of drinking water in the Member States. Off J EC L 194,
26-31.
EC (European Communities), 1980. Council Directive 80/778/EEC of 15 July 1980 relating to the quality of
water intended for human consumption. Off J EC L 229, 11-29.
EC (European Communities), 1990. Council Directive 90/415/EEC of 27 July 1990 amending Annex II to
Directive 86/280/EEC on limit values and quality objectives for discharges of certain dangerous substances
included in list I of the Annex to Directive 76/464/EEC. Official Journal of the European Communities N°L
219, 49-57 [adds perchloroethylene to Annex II].
ECETOC (European Chemical Industry Ecology and Toxicology Centre), 1988. Concentrations of industrial
organic chemicals measured in the environment, the influence of physico-chemical properties, tonnage and
use pattern, Tech Rep 29. ECETOC, Brussels.
ECETOC (European Chemical Industry Ecology and Toxicology Centre), 1990. Tetrachloroethylene,
assessment of human carcinogenic hazard, Tech Rep 37. ECETOC, Brussels.
Echevarria D, White RF and Sampaio C, 1995. A behavioural evaluation of PCE exposure in patients and
dry cleaners: a possible relationship between clinical and preclinical effects. J Occup Environ Medicine
37, 667-680.
ECSA (European Chlorinated Solvent Association), 1989. Storage and handling of chlorinated solvents, 2nd
ed. CEFIC, Brussels.
ECSA (European Chlorinated Solvent Association), 1995. EU draft risk assessment [production and use
data]. Unpublished draft. ECSA, Brussels, 9-13.
ECSA (European Chlorinated Solvent Association), 1996. Personal communication by Johnson P. CEFIC,
Brussels.
Edmonson GK and Palin MJ, 1989. Occupational exposure to perchloroethylene in the UK drycleaning
industry. FCRA (Fabric Care Research Association), Harrogate.
Eichler DL and Mackay JH, 1986. The levels of certain volatile organic compounds in ambient air of the
United States. Proc APCA 79th Ann Meet 6, 3-17.
236 ECETOC Joint Assessment of Commodity Chemicals No.39
Einhorn C, 1972. A case of perchloroethylene poisoning and pulmonary damage. Harefuag 82, 362.
Elovaara E, Hemminki K and Vainio H, 1979. Effects of methylene chloride, trichloroethane,
trichloroethylene, tetrachloroethylene and toluene on the development of chicks embryos. Toxicology, 111-
119.
Ensign SA, Hyman MR and Arp DJ, 1992. Cometabolic degradation of chlorinated alkenes by alkene
monoexygenase in a propylene grown Xanthobacter strain. Appl Env Microbiol 58, 3038-3046.
Entz RC and Hollifield HC, 1982. Headspace gas chromatographic analysis of foods for volatile
hydrocarbons. J Agric Food Chem 30, 84-88.
Erickson SJ and Freeman AE, 1978. Toxicity screening of the fifteen chlorinated and brominated compounds
using four species of marine phytoplankton. In: Jolley RL, Gorchev H and Hamilton DH (eds), Water
chlorination, environmental impact and health effects, vol 2. Ann Arbor Science, Ann Arbor MI, 307-310.
Erickson SJ and Hawkins CE, 1980. Effects of halogenated organic compounds on photosynthesis in
estuarine phytoplankton. Bull Environ Contam Toxicol 24, 910-915.
Erikson MD, Harris BSH, Pellizzari ED, Tomer KB and Waddell RD, 1980. Acquisition and chemical analysis
of mother's milk for selected toxic substances. Report EPA/560/13-80/029. Research Triangle Institute,
Triangle Park CA.
Eskenazi B, Fenster L, Hudes M, Wyrobek AJ, Katz DF, Gerson J and Rempel DM, 1991a. A study of the
effect of perchloroethylene exposure on the reproductive outcomes of wives of dry-cleaning workers.
American Journal of Industrial Medicine 20, 593-600.
Eskenazi B, Wyrobek AJ, Fenster L, Katz DF, Sadler M, Lee J, Hudes M and Rempel DM, 1991b. A study of
the effect of perchloroethylene exposure on semen quality in dry-cleaning workers. American Journal of
Industrial Medicine 20, 575-591.
Essing HG, Schäcke G, Valentin H, Wittjens H and Pfäll A, 1974. Untersuchungen zur Leberfunktion bei
Werkstättenarbeitern mit Langjährigen Perchloräthylen-Exposition. Der ärtzliche Dienst 3/4.
Fahrni HP, 1984. Leichtflüchtige chlorierte Kohlenwasserstoffe in Schweizer Gewässern. Gas, Wasser,
Abwasser 64, 689-695.
Fahrni HP, 1985. Leichtflüchtige chlorierte Kohlenwasserstoffe in Schweizer Gewässern. Schriftenreihe
Umweltschutz 39 des Schweizer Bundesamtes für Umweltschutz, Bern.
Farrar D, Allen B, Crump K and Shipp A, 1989. Evaluation of uncertainty in input parameters to
pharmacokinetic models and the resulting uncertainty in output. Tox Letters 49, 371-385.
Fathepure BZ and Boyd SA, 1988. Dependence of tetrachloroethylene dechlorination on methanogenic
substrate consumption by Methanosarcina sp. strain DCM. Appl Environ Microbiol 54, 2976-2980.
Fathepure BZ and Vogel TM, 1991. Complete degradation of polychlorinated hydrocarbons by a two-stage
biofilm reactor. Appl Env Microbiol 57, 3418-3422.
Tetrachloroethylene 237
Fathepure BZ, Nengu JP and Boyd SA, 1987. Anaerobic bacteria that dechlorinate perchloroethene. Appl
Env Microbiol 53, 2671-2674.
Fernandez T, Guberman E and Caperos J, 1976. Experimental human exposures to tetrachloroethylene
vapor and elimination in breath after inhalation. Am Ind Hyg Ass J, March, 143-150.
Ferrario JB, Lawler GC, Deleon IR and Laseter JL, 1985. Volatile organic pollutants in biota and
sediments of Lake Pontchartrain. Bull Environ Contam Toxicol 34, 246-255.
Ferrau O, Crino M, Freni MA, Ajello A and Consolo F, 1980. Perchloroethylene-induced hepatitis developing
rapidly into cirrhosis. Clinical and histobioptic findings [Italian]. Minerva Medica 71, 3381-3388.
Ferroni L, Selis L, Mutti A, Folli D, Bergamaschi E and Franchini I, 1992. Neurobehavioral and
neuroendocrine effects of occupational exposure to tetrachloroethylene. Neurotoxicol 13, 243-248.
Fillibeck J, Raffius B, Schleyer R and Hammer J, 1995. Trichloroacetic acid (TCA) in rain water, results
and comparison of two analytical methods. Vom Wasser 84, 181-195 [German].
Filser JG and Bolt HM, 1980. Characteristics of haloethylene-induced acetonemia in rats. Arch Toxicol 45, 2,
109-116.
Filser JG, Bolt HM, Kimmich K and Bencsath FA, 1978. Exhalation of acetone by rats on exposure to trans-
1,2-dichloroethylene and related compounds. Toxicol Lett 2, 247-252.
Filser JG, Jung P and Bolt HM, 1982. Increased acetone exhalation induced by metabolites of halogenated
C1 and C2 compounds. Arch Toxicol 49, 107-116.
Fogel MM, Taddeo AR and Fogel S, 1986. Biodegradation of chlorinated ethenes by a methane-utilizing
mixed culture. Appl Environ Microbiol 51, 720-724.
Fogelqvist E, 1985. Carbon tetrachloride tetrachloroethylene, 1,1,1-trichloroethane and bromoform in arctic
seawater. J Geophys Res C 90, 9181-9193.
Folkard GK, 1986. The significance, occurrence and removal of volatile chlorinated hydrocarbon solvents
in ground waters. Water Pollution Contr 85, 63-70.
Frank H, 1988. Trichloressigsäure im Boden: eine Ursache neuartiger Waldschäden. Nachr Chem Tech Lab
36, 889.
Frank H, 1989. Neuartige Waldschäden und Luftgetragene Kohlenwasserstoffe, UWSF-Z. Umweltchem
Oekotox 4, 7-11.
Frank H, 1990. Halocarbon solvents: analysis, environmental occurrence and phytotoxic secondary air
pollutants. In: Hutzinger O and Fiedler H (eds), Dioxin '90, EPRI PCB-Seminar, vol 2, organohalogen
compounds. Eco-Informa, Bayreuth, 393-396.
Frank H, 1991. Airborne chlorocarbons, photooxidants, and forest decline. Ambio 20, 13-18.
238 ECETOC Joint Assessment of Commodity Chemicals No.39
Frank H and Frank W, 1986. Photoaktivierung luftgetragener chlorkohlenwasserstoffe. Nach Chem Tech
Lab 34, 15-20.
Frank H and Frank W, 1989. Uptake of airborne tetrachloroethene by spruce needles. Environ Sci Technol
23, 365-367.
Frank W and Frank H, 1990. Concentrations of airborne C1- and C2- holocarbon in forest areas in West
Germany: results of three campaigns in 1986, 1987 and 1988. Atmospheric Env 24A, 1735-1739.
Frank H and Scholl H, 1990. Determination of TCA in spruce needles. In: Hutzinger O and Fiedler H (eds),
Dioxin '90, EPRI PCB-Seminar, vol 2, organohalogen compounds. Eco-Informa, Bayreuth, 397-399.
Frank H, Frank W and Thiel D, 1989a. C1- and C2- halocarbons in soil-air of forests. Atmospheric
Environment 23, 1333-1335.
Frank H, Vital J and Frank W, 1989b. Oxidation of airborne C2- chlorocarbons to trichloroacetic and
dichloroacetic acid. Fresenius Z Anal Chem 333, 713.
Frank W, Frank H and Englert R, 1990. Automated analysis of C1- and C2- halocarbons in ambient air. In:
Hutzinger O and Fiedler H (eds), Dioxin '90, EPRI PCB-Seminar, vol.2, organohalogen compounds. Eco-
Informa, Bayreuth, 401-404.
Frank H, Frank W and Neves HJC, 1991. Airborne C1- and C2- halocarbons at four representative sites in
Europe. Atmospheric Environment 25A, 257-261.
Frank H, Renschen D, Klein A and Scholl H, 1995. Trace analysis of airborne haloacetates. J High Resol
Chromatogr 18, 83-88.
Frank H, Scholl H, Renschen D, Rether B, Laouedj A and Norokorpi Y, 1993. Haloacetic acids, phytotoxic
secondary air pollutants. Environ Sc and Pollut Res 1, 1-11.
Frank H, Vincon A, Reiss J and Scholl H, 1990. Trichloroacetic acid in the foliage of forest trees. J High
Resolution Chromatography 13, 733-736.
Franke W and Eggeling F, 1969. Klinisch-statistische Untersuchungen bei Perchloräthylen-Exponierten,
Beschäftigten in chemisch-reiniger Betrieben. Med Welt 9, 453-460.
Franklin J, 1994. The atmospheric degradation and impact of perchloroethylene. Tox Environ Chem 46,
169-182.
Frederiksson M, Bengtsson NO, Hardell L and Axelson O, 1989. Colon cancer, physical activity, and
occupational exposures. Cancer 63, 1838-1842.
Freed DM and Kandel E, 1988. Long-term occupational exposure and the diagnosis of dementia.
Neurotoxicology 9, 391-400.
Freedman DL and Gosset JM, 1989. Biological reductive dechlorination of tetrachloroethylene and
trichloroetylene to ethylene under methanogenic conditions. Appl Env Microbiol 58, 2144-2151.

Tetrachloroethylene 239
Friberg L, Kylin B and Nystrom A, 1953. Toxicities of trichloroethylene and Fujiwara's pyridine - alkali
reaction. Acta Pharmacol et Toxicol 9, 303-312.
Friesel P, Milde G and Steiner B, 1984. Interactions of halogenated hydrocarbons with soils. Fresenius Z
Anal Chem 319, 160-164.
Fytianos K, Vasilikiotis G and Weil L, 1985. Identification and determination of some trace organic
compounds in coastal seawater of Northern Greece. Bull Environ Toxicol 34, 390.
Galloway JN, 1995. Acid deposition: perspectives in time and space. Water, Air and Soil Pollut 85, 15-24.
Galloway SM, Armstrong MJ, Reuben C, Colman S, Brown B, Cannon C, Bloom AD, Nakamura F, Ahmed
M, Duk S, Rimpo J, Margolin BH, Resnick MA, Anderson B and Zeiger E, 1987. Chromosome aberrations
and sister chromatid exchanges in Chinese hamster ovary cells. Evaluations of 108 chemicals. Environ
Mol Mut 10, 1-175.
Garnier R, Bédouin J, Pépin G and Gaillard Y, 1996. Coin-operated dry cleaning machines may be
responsible for acute tetrachloroethylene poisoning: report of 26 cases including one death. Clinical
Toxicology 34, 191-197.
Gay BW Jr, Hanst PL, Bufalini JJ and Noonan RC, 1976a. Oxidation of chlorinated ethylenes and other
chlorinated compounds. Presented at: Meeting of the American Chemical Society, Division of Environmental
Chemistry, April 1976, New York City NY. ACECB 16, 233-238.
Gay BW Jr, Hanst PL, Bufalini JJ and Noonan RC, 1976b. Atmospheric oxidation of chlorinated ethylenes.
Env Sci Techn 10, 58-67.
Gearhart JM, Mahle DA, Greene RJ, Seckel CS, Flemming CD, Fisher JW and Clewell HJ, 1993.
Variability of physiologically based pharmacokinetic (PBPK) model parameters and their effects on PBPK
model predictions in a risk assessment for perchloroethylene. Toxicol Lett 68, 131-144.
Gehring PJ, 1968. Hepatotoxic potency of various chlorinated hydrocarbon vapours relative to their narcotic
and lethal potencies in mice. Toxicol Appl Pharmacol 13, 287-298.
Gerhartz W (ed), 1986. Ullmann's encyclopedia of industrial chemistry, 5th ed, vol A6, Ceramics to
chlorohydrins. VCH, Weinheim, Germany, 302-309, 373.
Gezondheidsraad (Dutch National Health Council), 1985. Advice concerning trichloroethylene and
tetrachloroethylene in ambient air, based on criteria documents on these compounds [Dutch].
Gezondheidsraad, 's-Gravenhage, 75-117.
Ghittori S, Imbriani M, Pezzagno G and Capodaglio E, 1987. The urinary concentration of solvents as a
biological indicator of exposure: proposal for the biological equivalent exposure limit for nine solvents. Am
Ind Hyg Assoc J 48, 786-790.
Giger W, Schwarzenbach RP, Hoehn E, Schellenberg K, Schneider JK, Wasmer HR, Westall J and Zobrist J,
1983. Das Verhalten organischer Wasserinhaltstoffe bei der Grundwasserbildung und im Grundwasser. Gas-
Wasser-Abwasser 63, 517-531.
240 ECETOC Joint Assessment of Commodity Chemicals No.39
Gilli G, Scursatone E, Bono R, Natale P and Grosa M, 1990. An overview of atmospheric pollution in Italy
before the use of new gasoline. Sci Tot Environ 93, 51-56.
Goldberg ME, Johnson HE, Pozzani UC and Smyth HF, 1964. Effect of repeated inhalation of vapors of
industrial solvents on animal behavior. Evaluation of nine solvents vapors on pole-climb performance in rats.
Ind Hyg J, 369-375.
Goldbloom AA and Boyd LJ, 1954. Tetrachloroethylene fatality. Case report of a patient with infections
(virus) hepatitis and hookworm infestation. Ind Med Surg 23, 116-119.
Goldsworthy TL, Smith-Oliver T, Loury DJ, Popp JA and Butterworth BE, 1988. Assessment of chlorinated
hydrocarbon-induced genotoxicity and cell replication in rat kidney cells. Environ Mol Mut 11, 39.
Goodman MA, Tuazon EC, Atkinson R and Winer AM, 1986. A study of the atmospheric reactions of
chloroethenes with OH radicals. Presented at: Meeting of the American Chemical Society, Division of
Environmental Chemistry, Anaheim, CA. ACECB 26, 169-171.
Goto S, Nakama S, Oka F, Myeno Y and Hikita A, 1987. Concentrations of chlorinated hydrocarbons in
air. Oita-ken Kogai Eisei Senta Nenpo, 1986, 73-77 [Japanese].
Graedel TE and Keene WC, 1995. Tropospheric budget of reactive chlorine. Global Biogeochemical
Cycles 9, 47-77.
Grathwohl P, 1990. Influence of organic matter from soils and sediments from various origins on the sorption
of some chlorinated aliphatic hydrocarbons: implications on Koc correlations. Environ Sci Technol 24, 1687-
1693.
Green T and Odum J, 1985. Structure/activity studies of the nephrotoxic and mutagenic action of cysteine
conjugates of chloro- and fluoroalkenes. Chem Biol Interactions 54, 15-31.
Green T, Odum J, Nash JA and Foster JR, 1990. Perchloroethylene-induced rat kidney tumors: an
investigation of the mechanisms involved and their relevance to humans. Toxicol and Applied Pharmacology
103, 77-89.
Greim H, Bonse G, Radwan Z, Reichert D and Henschler D, 1975. Mutagenicity in vitro and potential
carcinogenicity of chlorinated ethylenes as a function of metabolic oxirane formation. Biochem Pharmacol 24,
2013-2017.
Grimsrud EP and Rasmussen RA, 1975. Survey and analysis of halocarbons in the atmosphere by gas
chromatography-mass spectrometry. Atmospheric Environment 9, 1014-1017.
Grimvall A, Borén H, Von Sydow L, Laniewski K and Johnson S, 1995. Origin of adsorbable organic
halogens (AOX) and chloroacetates in precipitation. Final report to Euro Chlor, 27 December 1995.
Department of Water and Environmental Studies, Linköping University, Sweden.
Grob K, Artho A and Egli J, 1991. Verunreinigung von Lebensmitteln mit Perchlorethylen aus der Luft:
Begrenzung für die Luft statt für die Lebensmittel. Mitt Gebiete Lebensm Hyg 82, 56-65.
Tetrachloroethylene 241
Gruber H, 1984. GC-Dampfraumbestimmung von Halogenkohlenwasserstoffen in Wasserproben. GIT
Fachz Lab 28, 161-165.
Guberan E and Fernandez J, 1974. Control of industrial exposure to tetrachloroethylene by measuring
alveolar concentrations: theoretical approach using a mathematical model. Br J Ind Med 31, 159-167.
Guicherit R and Scholting FL, 1985. The occurrence of organic chemicals in the atmosphere of the
Netherlands. Sci Total Environ 43, 193-219.
Gulyas H and Hemmerling L, 1990. Tetrachloroethylene air pollution originating from coin-operated dry
cleaning establishments. Environ Res 53, 90-99.
Gulyas H, Billing R and Hemmerling L, 1988. Stichprobenmessungen von Tetrachloroethen. Immissionen in
Hamburger Münzreinigungen. Forum Städte-Hygiene 39, 97-100.
Güthner B, Class TJ and Ballschmiter K, 1990. Chemistry of organic traces in air, XI: Sources and
variations of volatile hydrocarbons in rural and urban air in Southern Germany. Mikrochim Acta [Wien] 3,
21-27.
Haerer AF and Udelman HD, 1964. Acute brain syndrome secundary to tetrachloroethylene ingestion. Am J
Psychiatr 12, 78-79.
Hajimiragha H, Ewers U, Jansen-Rosseck R and Brockhaus A, 1986. Human exposure to volatile
halogenated hydrocarbons from the general environment. Int Arch Occup Environ Health 58, 141-150.
Hake CL and Stewart RD, 1977. Human exposure to tetrachloroethylene: inhalation and skin contact.
Environ Health Perspect 21, 231-238.
Hammerling Gold J, 1969. Chronic perchloroethylene poisoning. Canad Psychiat Ass J 14, 627-630.
Hansch C and Leo AJ, 1979. Substituent constants for correlation analysis in chemistry and biology. Wiley,
New York NY.
Hara M, Kino M, Yamamoto et al, 1985. Cardiovascular effects of organic solvents (perchloroethylene)
(PERC). Japan Circ J 49, 887-888.
Hardell L, Eriksson M, Lenner P and Lundgren E, 1981. Malignant lymphoma and exposure to chemicals,
especially organic solvents, chlorophenols and phenoxy acids, a case-control study. Br J Cancer 43, 169-
176.
Hardell L, Bengtsson NO, Jonsson U, Eriksson S and Larsson LG, 1984. Aetiological aspects on primary
liver cancer with special regard to alcohol, organic solvents and acute intermittent porphyria-an
epidemiological investigation. Br J Cancer 50, 389-397.
Hardie DWF, 1964. Chlorocarbons and chlorohydrocarbons. In: Kirk-Othmer Encyclopedia of Chemical
Technology, 2nd ed, vol 5. Interscience, New York, 197-198.
Hardin DB, Bond GP, Skov MR, Andrew FD, Beliles RP and Niemeier RW, 1981. Testing of selected
workplace chemicals for teratogenic potential. Scand J Work Environ Health 7, 66-75.
242 ECETOC Joint Assessment of Commodity Chemicals No.39
Harkov R, Gianti SJ, Bozzelli JW and Laregina JE, 1985. Monitoring volatile organic compounds at
hazardous and sanitary landfills in New Jersey. J Environ Sci Health 20, 491-501.
Hattis D, Tuler S, Finkelstein L and Luo ZQ, 1986. A pharmacokinetic/mechanism based analysis of the
carcinogenic risk of perchloroethylene. Massachusetts Institute of Technology, Cambridge Center for
Technology, Policy and Industrial Development. NIOSH, Rockville, MD.
Hattis D, White P, Marmorstein L and Koch P, 1990. Uncertainties in pharmacokinetic modeling for
perchloroethylene, I, comparison of model structure, parameters, and predictions for low dose metabolism
rates for models derived by different authors. Risk Anal 10, 449-458.
Haworth S, Lawlor T, Mortelmans K, Speck W and Zeiger E, 1983. Salmonella mutagenicity test results
for 250 chemicals. Environmental Mutagenesis Supplement 1, 3-142.
Hayes JR, Condie LW and Borzelleca JF, 1986. The subchronic toxicity of tetrachloroethylene
(perchloroethylene) administered in the drinking water of rats. Fund Appl Toxicology 7, 119-125.
Hecht B, Class TH and Ballschmiter K, 1987. Chemistry of organic traces in air, variations of volatile
halocarbons in ambient air in Southern Germany. Fresenius Z Anal Chem 327, 45-46.
Heil H, Eikmann T, Einbrodt HJ, Koenig H, Lahl U and Zeschmar-Lahl B, 1989. Konsequenzen aus dem
Altlastfall Bielefeld-Brake. Vom Wasser 72, 321-348.
Heimann D and Harle M, 1993. Auswirkungen von Tetrachlorethen auf Folsomia candida (Willem)
(Isotomidae, Collembola). Batelle Institute Report 5. Battelle Europe, Frankfurt am Main.
Heineman EF, Cocco P, Gómez MR, Dosemeci M, Stewart PA, Hayes RB, Hoar Zahm S, Thomas TL and
Blair A, 1994. Occupational exposure to chlorinated aliphatic hydrocarbons and risk of astrocytic brain
cancer. Am J Ind Med 26, 155-169.
Heitmuller PT, Hollister TA and Parrish PR, 1981. Acute toxicity of 54 industrial chemicals to sheephead
minnows (Cyprinodon variegatus). Bull Environm Contam Toxicol 27, 596-604.
Helf D, 1990. Die Oxidation von 1,1-Dichlorethylen mit OH-Radikalen in einem Rohrreaktor. Dissertation,
Technische Universität München. Published by the Dechema-Institut, Frankfurt-am-Main.
Hellmann H, 1984. Leichtflüchtige Chlorkohlenwasserstoffein den Gewässern der Bundesrepublik
Deutschland-Aufreten und Bilanz. Haustechnik-Bauphysik-Umwelttechnik-Gesundheits-Ingenieur 105, 269.
Helz GR and Hsu RY, 1978. Volatile chloro- and bromocarbons in coastal waters. Limnol Oceanogr 23, 858-
869.
Hemminki K, Franssila E and Vainio H, 1980. Spontaneous abortions among female chemical workers in
Finland. Int Arch Occup Environ Health 45, 123-126.
Hemminki K, Lindbohm ML, Hemminki T and Vainio H, 1984. Reproductive hazards and plastics industry.
Prog Clin Biol Res 141, 79-87.
Tetrachloroethylene 243
Henschler D (ed), 1989. Toxikologish-arbeitmedizinische Bergründung von MAK-Werten, Tetrachlorethen.
Verlag Chemie, Weinheim, 1-16.
Henschler D and Bonse G, 1977. Metabolic activation of chlorinated ethylenes, dependence of mutagenic
effect on electrophilic reactivity of metabolically formed epoxides. Arch Toxicol 39, 7-12.
Hermens J, Broekhuyzen E, Canton H and Wegman R, 1985. Quantitative structure activity relationships
and mixture toxicity studies of alcohols and chlorohydrocarbons: effects of growth on Daphnia magna.
Aquat Toxicol 6, 209-217.
Herren-Freund SL, Pereira MA and Olson G, 1987. The carcinogenicity of trichlorethylene and its
metabolites, trichloroacetic acid and dichloroacetic, in mouse liver. Toxicol Appl Pharmacol 90, 183-189.
Herrmann R, 1987. Chemodynamik und Transport von organischen Umweltchemikalien in verschiedenen
Kompartimenten eines Talökosystems. Gewasserschutz – Wasser – Abwasser 100, 229-302.
Hisham MW and Grosjean D, 1991. Methylchloroform and tetrachloroethylene in southern California,
1987-1990. Environ Sci Technol 25, 1930-1936.
Hobara T, Kobayashi H, Higashihara E, Iwamoto S and Sakai T, 1981. Organic solvent levels following
intravenous asministration, in the bile, blood and liver of dogs. Chemical Abstracts 98, 1396.
Holliger C, Schraa G, Stams AJM and Zehnder AJB, 1993. A highly purified enriched culture couples the
reductive dechlorination of tetrachloroethene to growth. Appl Env Microbiol 59, 2991-2997.
Holmberg B, Ekstrom T, Hogberg J, Lundberg I, Nilsson K, Walles S and Warholm M, 1986. Five industrial
chemicals investigated for tumor promoting activity in the rat liver. Toxicol Lett 31, 197.
Honma T, Hasegawa H, Sato M and Sudo A, 1980a. Changes of free amino acid content in rat brain after
exposure to trichloroethylene and tetrachloroethylene. Ind Health 18, 1-7.
Honma T, Sudo A, Miyagawa M, Sato M and Hasegawa H, 1980b. Effects of exposure to trichloroethylene
and tetrachloroethylene on the contents of acetylcholine, dopamine, norepinephrine and serotonin in rat brain.
Ind Health 18, 171-178.
Horvath AL, 1982. Halogenated hydrocarbons, solubility - miscibility with water. Marcel Dekker, New York
and Basel, 718-719.
Hov Ø, Penkett SA, Isaksen ISA and Semb A, 1984. Organic gases in the Norwegian arctic. Geophys
Res Lett 11, 425-428.
Howard CJ, 1976. Rate constants for the gas-phase reactions of OH radicals with ethylene and halogenated
ethylene compounds. J Chem Phys 65, 4771-4777.
Howie SJ and Elfers LA, 1981. Ambient perchloroethylene levels inside coin-operated laundries with dry-
cleaning machines on the premises. Report EPA-600/4-82-032. PEDCo-Environ Inc, Cincinnati OH.
HSDB (Hazardous Substances Data Bank), 1987. National Library of Medicine, Bethesda MD.
244 ECETOC Joint Assessment of Commodity Chemicals No.39
HSE (UK Health and Safety Executive), 1987. Toxicity review No 17, tetrachloroethylene (tetrachloroethene,
perchloroethylene). Illing HPA, Mariscotti SP and Smith AM. HMSO, London.
HSE (UK Health and Safety Executive), 1990. Chlorinated hydrocarbon solvent vapours (charcoal tube/GC).
MDHS 28 (rev). HMSO, London.
HSE (UK Health and Safety Executive), 1995. Occupational exposure limits 1995. EH40/95. HSE Books,
Sudbury, Suffolk, 37.
HSIA (US Halogenated Solvents Industry Alliance), 1989. Perchloroethylene, White Paper. HSIA,
Washington DC.
Hughes JP, 1954. Hazardous exposure to some so-called safe solvents. J Am Med Assoc 156, 234-237.
Hurford N, Law RJ, Payne AP and Fileman TW, 1989. Concentrations of chemicals in the North Sea arising
from discharges from chemical tankers. Oil Chem Pollut 5, 391-410.
Huybrechts G, Olbregts J and Thomas K, 1967. Gas-phase chlorine-photosensitised oxidation and oxygen-
inhibited photochlorination of tetrachloroethylene and pentachloroethane. Trans Faraday Soc 63, 1647-1655.
IARC (International Agency for Research on Cancer), 1987. Tetrachloroethylene. In: IARC Monographs
on the evaluation of the carcinogenic risk of chemicals to humans, supplement 7. IARC, Lyon, 355-357.
IARC (International Agency for Research on Cancer), 1995. Tetrachloroethylene. In: IARC Monographs
on the evaluation of the carcinogenic risk of chemicals to humans, vol. 63. IARC, Lyon, 159-221.
Ibusuki T, Kutsuna S and Itoh N, 1990. Degradation pathways of chlorinated solvents in the troposphere and
assessment of the effect on the atmospheric environment. In: Proceedings of the 31st Annual Meeting of the
Japanese Society of Air Pollution, Kanazawa, Japan, 31 October-2 November 1990.
Ikeda T, Nagano C and Okada A, 1969. (Hepatotoxic effects of trichloroethylene and perchloroethylene in the
rat and mouse). Igaku to Seibutsugako 79, 123-129 [EPA translation TR-78-0135].
Ikeda M, Ohtsuji H, Imamura T and Komoike Y, 1972. Urinary excretion of total trichloro-compounds,
trichloroethanol and trichloroacetic acid as a measure of exposure to trichloroethylene and
tetrachloroetyhlene. Brit J Ind Med 29, 328-333.
Ikeda M, Koizumi A, Watanabe T, Endo A and Sato K, 1980. Cytogenetic and cytokinetic investigations on
lymphocytes from workers occupationally exposed to tetrachloroethylene. Tox Letters Suppl 1, 30 [Abstract].
Inamori Y, Matushige K, Sudo R and Kikuchi H, 1989. Effect of organochlorine compounds on existence
and growth of soil organisms. Water Sci Technol 21, 1887-1890.
Ince N and Inel Y, 1989. Volatilization of organic chemicals from water. Water, Air and Soil Pollution 47, 71-
79.
INRS (Institut National de Recherche Scientifique), 1993. Valeurs limites d'exposition professionelle aux
agents chimiques en France. Cahiers de notes documentaires 153, 557-574.

Tetrachloroethylene 245
IPCC (Intergovernmental Panel on Climate Change), 1996. Climate Change 1995 - The Science of
Climate Change. Cambridge University Press, 92.
IPCS (International Programme on Chemical Safety), 1984. Tetrachloroethylene. Environmental Health
Criteria 31. WHO, Geneva.
IRPTC (International Register of Potentially Toxic Chemicals), 1997. Selected pages from UNEP website,
IRPTC legal file (http://irptc.unep.ch/irptc/), December 1997.
Irish DD, 1963. Hydrogenated hydrocarbons, aliphatic, tetrachloroethylene. In: Patty FA (ed), Industrial
Hygiene and Toxikology, 2nd ed, vol 2. J Wiley, New York NY, 1314.
Isacson P, Bean JA, Splinter R, Olson DB and Kohler J, 1985. Drinking water and cancer incidence in
Iowa III, association of cancer with indices of contamination. Am J Epidemiol 121, 856-869.
Itoh N, Kutsuna S and Ibusuki T, 1994. A product study of the OH radical initiated oxidation of
perchloroethylene and trichloroethylene. Chemosphere 28, 2029-2040.
James HA et al, 1980. The occurrence and significance of organic micropollutants in drinking water. Iwes
seminar - Trace Organics. London Institute of Marine Engineers.
Janssen PJM, 1990. Acute inhalation study to investigate the respiratory irritating properties of
tetrachloroethylene in male rats. Duphar rep S.8923. Duphar, Weesp.
Jeffers PM, Ward LM, Woytowitch LM and Wolfe NL, 1989. Homogeneous hydrolysis rate constants for
selected chlorinated methanes, ethanes, ethenes and propanes. Environ Sci Technol 23, 965-969.
Jensen S and Rosenberg R, 1975. Degradability of some chlorinated aliphatic hydrocarbons in sea water
and sterilised water. Water Research 9, 659-661.
Jensen SA and Ingvordsen C, 1977. Tetrachloroethylene in garments. Ugeskr Laeg 139, 239-297
[Danish].
Juuti S, Norokorpi Y, Helle T and Ruuskanen J, 1996. Trichloroacetic acid in conifer needles and arboreal
lichens in forest environments. Sci Total Environ 180, 117-124.
Kaemmerer K, Fink J and Kietzmann M, 1982. Studien zur Pharmakodynamik von Perchloräthylen. Der
Praktische Tierarzt 2, 171-182.
Kanazawa S and Filip Z, 1987. Effects of trichloroethylene, tetrachloroethylene and dichloromethane on soil
biomass and microbial counts. Zbl Bakt Hyg B 184, 24-33.
Kaplan SD, 1980. Dry cleaners exposed to perchloroethylene, a retrospective cohort mortality study. SRI-
International, contract 210-77-0094. US Dept Health, Education, Welfare, Cincinnati, OH.
Karlsson JE, Rosengren LE, Kjellstrand P and Haglid KG, 1987. Effects of low-dose inhalation of three
chlorinated aliphatic organic solvents on deoxyribonucleic acid in gerbil brain. Scand J Work Environ Health
13, 453-458.
246 ECETOC Joint Assessment of Commodity Chemicals No.39
Kästner M, 1991. Reductive dechlorination of tri- and tetrachloroethenes depends on transition from aerobic
to anaerobic conditions. Appl Env Microbiol 57, 2039-2046.
Katz RM and Jowett D, 1981. Female laundry and dry cleaning workers in Wisconsin: a mortality analysis.
Am J Publ Health 71, 305-307.
Kawamura K and Kaplan IR, 1983. Organic compounds in the rainwater of Los Angeles. Environ Sci
Technol 17, 497-501.
Kawauchi T and Nishiyma K, 1989. Residual tetrachloroethylene in dry-cleaned clothes. Environ Res 48,
296-301.
Kenaga EE, 1980. Predicted bioconcentration factors and soil sorption coefficients of pesticides and other
chemicals. Ecotoxicol Environ Safety 4, 26-38.
Kendrick JF, 1929. The treatment of hookworm disease with tetrachloroethylene. Am J Trop Med, 483-488.
Kerster HW and Schäffer DJ, 1983. Brine shrimp (Artemia Salina) nauplii as a teratogen test system.
Ecotoxicol Environ Safety 7, 342-349.
Khalil MAK and Rasmussen RA, 1983. The global trends and mass balance of F-113. In: Hutzinger O and
Fiedler H (eds), Dioxin '90, EPRI PCB-Seminar, vol.2, organohalogen compounds. Eco-Informa, Bayreuth,
405-406.
Kindler TP, Chameides WL, Wine PH, Cunnold DM, Alyea FN and Franklin JA, 1995. The fate of
atmospheric phosgene and the stratospheric chlorine loadings of its parent compounds: CCl4, C2Cl4,
C2HCl3, CH3CCl3, and CHCl3. J Geophys Res 100(D1), 1235-1251.
Kirchner K, 1983. Reaktionen von Luftverunreinigungen im Bereich kleiner Konzentrationen. Bedeutung für
Natur und Technik. Chimia 37, 1-9.
Kirchner K, Helf D, Ott P and Vogt S, 1990. The reaction of OH radicals with 1,1-di-, tri- and
tetrachloroethylene. Ber Bunsenges Phys Chem 94, 77-83.
Kirschmer P and Ballschmiter K, 1983. Baseline studies of the global pollution, VIII, the complex pattern of
C1-C4 organohalogens in continental and marine background air. Intern J Environ Anal Chem 14, 275-284.
Kirschmer P and Gerlach A, 1989. Immissionsmessungen von Chlorkohlenwasserstoffen, Probenahme,
Analyse, Ergebnisse. LIS Ber 87, 5-23, 25-29.
Kjellstrand P, Holmquist B, Kanje M, Alm P, Romare S, Jonsson I, Mansson L and Bjerkemo M, 1984.
Perchloroethylene: effects on body and organ weights and plasma butyrylcholinesterase activity in mice. Acta
Pharmacol Tox 54, 414-424.
Kjellstrand P, Holmquist B, Jonsson I, Romare S and Mansson L, 1985. Effects of organic solvents on motor
activity in mice. Toxicol 35, 35-46.
Klaassen CD and Plaa GL, 1966. Relative effect of various chlorinated hydrocarbons on liver and kidney
function in mice. Toxicol Appl Pharmacol 9, 139-151.
Tetrachloroethylene 247
Klaassen CD and Plaa GL, 1967. Relative effects of various chlorinated hydrocarbons on liver and kidney
function in mice. Toxicol Appl Pharmacol 19, 119-131.
Klein P and Kurz J, 1994. Untersuchung von Maßnamen zur Reduzierung der Lösemittelkonzentration in
der Nachbarschaft von Textilreinigungen. Physiological Institute on Clothing, Bönninghiem, Hohenstein.
Kline SA, McCoy EC, Rosenkranz HS and Van Duuren BL, 1982. Mutagenicity of chloroalkele epoxides in
bacterial systems. Mut Res 101, 115-125.
Knie J, Hälke A, Juhnke I and Schiller W, 1983. Ergebnisse der Untersuchungen von chemischen Stoffen mit
vier Biotests. Deutsche Gewässerkundliche Mitteilungen 27, 77-79.
Kobayashi S, Hutcheon DE and Regan J, 1982. Cardiopulmonary toxicity of tetrachloroethylene. J Toxiol
Environ Health 10, 23-30.
Koch R, Schlegelmilch R and Wolf HU, 1988. Genetic effects of chlorinated ethylenes in the yeast
Saccharomyces cerevisiae. Mutation Res 206, 209-216.
Kohno K, Sekiya K, Iwakiri J, Tomiyama N, Andou Y and Sakoda K, 1995. Investigation of groundwater
polluted by volatile chlorinated hydrocarbons. Studies on chemical kinetics of tetrachloroethylene and
trichloroethylene. Miyazaki-ken Eisei Kankyo Kenkyusho Nenpo, 6, 115-120 [Japanese; Chem. Abstr.124,
241411].
Koizumi A, Kumai M and Ikeda M, 1983. Dose-dependent induction and suppression of liver mixed-function
oxidase system in chlorinated hydrocarbon metabolism. J Appl Toxicol 3, 208-217.
Kolstad HA, Brandt L and Rasmussen K, 1990. Chlorinated solvents and fetal damage: spontaneous
abortions, low birth weights and malformations among women employed in dry-cleaning industry. Ugeskr
Laeg 152, 2481-2482 [Danish; DIMDI abstract].
Könemann H, 1981. Quantitative structure-activity relationships in fish toxicity studies, part 1: relationships for
50 industrial pollutants. Toxicology 19, 209-221.
Koorn, 1987. Mutagenicity of epoxycyclohexane in vapour phase. Ames assay with Salmonella typhimurium
TA98, TA100, TA1535, TA1537 and TA1538 without metabolic activation. Lab sheet dated 04/09/87. Duphar,
Weesp NL.
Koppmann R, Johnen FJ, Plass-Dülmer C and Rudolph J, 1993. Distribution of methylchloride,
dichloromethane, trichloroethene and tetrachloroethene over the North and South Atlantic. J Geophys Res
98, 20517-20526.
Kostrzewski P and Jakubowski M, 1985. Application of determination of volatiles in capillary blood
samples for evaluation of industrial exposure: tetrachloroethylene. Ann Am Conf Ind Hyg 12, 269-273.
Krijsell M and Nightingale PD, 1993. Low molecular weight halocarbons in the Humber and Rhine
estuaries determined using a new purge and trap gas chromatographic method. Continental Shell
Research.
248 ECETOC Joint Assessment of Commodity Chemicals No.39
Kringstad KP, Ljunquist PO, de Sousa F and Strömberg LM, 1981. Identification and mutagenic properties of
some chlorinated aliphatic compounds in the spent liquor from Kraft pulp chlorination. Env Sci Tech 15, 562-
566.
Kroneld R, 1986. Volatile halocarbons in water. Bull Environ Contam Toxicol 37, 677-685.
Kroneld R, 1989a. Volatile pollutants in suburban and industrial air. Bull Environ Contam Toxicol 42, 868-
872.
Kroneld R, 1989b. Volatile pollutants in the environment and human tissues. Bull Environ Contam Toxicol
42, 873-877.
Kronevi T, Wahlberg JE and Holmberg B, 1981. Skin pathology following epicutaneous exposure to seven
organic solvents. Int J Tiss Reac 3, 21-30.
Krüger BC, GuiQin Wang and Fabian P, 1987. The Antarctic ozone depletion caused by heterogeneous
photolysis of halogenated hydrocarbons. Geophys Res Letters 14, 523-526.
Kubin D, Bächmann K and Kessel M, 1989. Langzeitmessungen chlorierter Kohlenwasserstoffe in der
Atmosphere. VDI-Berichte 745, 257-265.
Kühn-Birett, 1991. Perchlorethylen. Merkblätter Gefährliche Arbeitsstoffe 42 P05. Ecomed, München.
Kuo J-F, 1993. Discussion of model for predicting PCE desorption from contaminated soils, N. Biswas et
al, 64, 170 (1992). Water Env Res 65, 85-87
Kußmaul H and Mühlhausen D, 1981. Vorkommen und Verhalten von chlorierten Loesungsmitteln bei der
Trinkwassergewinning aus Oberflächenwasser. WaBoLu-Berichte 3, 85-89.
Kußmaul H, Fritschi U, Fritschi G and Schinz V, 1978. Leichtflüchtige Halogenkohlenwasserstoffe im
Rheinwasser, Uferfiltrat und Trinkwasser. Wasser-Boden-Luft Berichte 3, 75-85.
Kylin B, Reichard H, Suemegi I and Yllner S, 1963. Hepatotoxicity of inhaled trichloroethylene,
tetrachloroethylene and chloroform, single exposure. Acta Pharmacol Toxicol 20, 16-26.
Kylin B, Suemegi I and Yllner S, 1965. Hepatoxicity of inhaled trichloroethylene, tetrachloroethylene and
chloroform, long-term exposure. Acta Pharmacol et Toxicol 22, 379-385.
Kyrklund T, Alling C, Kjellstrand P and Haglid KG, 1984. Chronic effects of perchloroethylene on the
composition of lipid and acyl groups in cerebral cortex and hippocampus of the gerbil. Tox Letters 22, 343-
349.
Kyrklund T, Kjellstrand P and Haglid KG, 1987. Lipid composition and fatty acid pattern of the gerbil brain
after exposure to epichloroethylene. Arch Toxicol 60, 397-400.
Kyrklund T, Kjellstrand P and Haglid KG, 1988. Effects of exposure to Freon 11, 1,1,1-trichloroethane or
perchloroethylene on the lipid and fatty-acid composition of rat cerebral cortex. Scand J Work Environ Health
14, 91-94.
Tetrachloroethylene 249
Kyrklund T, Kjellstrand P and Haglid KG, 1990. Long-term exposure of rats to perchloroethylene, with and
without a post-exposure solvent-free recovery period: effects on brain lipids. Toxicology Letters 52, 279-285.
Kyyrönen P, Taskinen H, Lindbohm M-L, Hemminki K, and Heinonen O, 1989. Spontaneous abortions and
congenital malformations among women exposed to tetrachloroethylene in dry cleaning. J Epid Commun
Health 43, 346-351.
Lagakos SW, Wessen BJ and Zelen M, 1986. An analysis of contaminated well water and health effects
in Woburn, Massachusetts. J Am Stat Assoc 84, 583-596.
Lamson PD, Robbins BH and Ward CB, 1929. The pharmacology and toxicology of tetrachloroethylene. Am
J Hygiene 9, 430-444.
Lauwerys R, Herbrand J, Buchet JP, Bernard A and Gaussin J, 1983. Health surveillance of workers
exposed to tetrachloroethylene in dry-cleaning shops. Int Arch Occup Environ Health 52, 69-77.
Lay JP and Herrmann ME, 1989. Wirkungen auf Oekosysteme des Süsswassers - Eine Fallstudie mit
Tetrachlorethen. VDI Berichte 745, 585-600.
Lay JP, Schäurte W, Klein W and Korte F, 1984. Influence of tetrachloroethylene on the biota of aquatic
systems, toxicity to phyto- and zooplankton species in compartments of a natural pond. Arch Environm
Contam Toxicol 13, 135-142.
Laszlo F, 1989. Qualitätsprobleme bei der Gewinnung von überfiltriertem Grundwasser in Ungarn. Acta
hydrochim hydrobiology 17, 453-463.
LeBlanc GA, 1980. Acute toxicity of priority pollutants to water flea (Daphnia magna). Bull Environm Contam
Toxicol 24, 684-691.
Lee JE et al, 1989. Enhanced retention of organic contaminants by soils exchanged with organic cations.
Environ Sci Technol 23, 1365-1372.
Lemburg P, Sprock P, Bretschneider A, Strom W and Goebel V, 1979. A new concept of therapy in
accidental intoxications with halogenated hydrocarbons. Vet Hum Toxicol 21, 37-40.
Levine B, Fierro MF, Goza SW and Valentour JCA, 1981. A tetrachloroethylene fatality. J Forensic Sci 26,
206-209.
Liang L and Grbic-Galic D, 1993. Biotransformation of chlorinated aliphatic solvents in the presence of
aromatic compounds under methanogenic conditions. Environ Tox and Chem 12, 1377-1393.
Ligocki MP, Leuenberger C and Pankow JF, 1985. Trace organic compounds in rain-II. Gas scavenging of
neutral organic compounds. Atmos Environ 19, 1609-1617.
Lillian D, Singh HB, Appleby A, Lobban L, Arnts R, Gumpert R, Hague R, Toomey J, Kazakis J, Antell M,
Hansen D and Scott B, 1975a. Fates and levels of ambient halocarbons. In: Removal of trace contaminants
from air. In: Deitz VR (Ed), Removal of trace contaminants from air, ACS Symposium Series 17. ACS,
Washington DC, 13, 152-158.

250 ECETOC Joint Assessment of Commodity Chemicals No.39
Lillian D, Singh HB, Appleby A, Lobban L, Arnts R, Gumpert R, Hague R, Toomey J, Kazakis J, Antell M,
Hansen D and Scott B, 1975b. Atmospheric fates of halogenated compounds. Env Sci Techn 9, 1042-1048.
Lindbohm ML, Hemminki K and Kyyrönen P, 1984. Parental occupational exposure and spontaneous
abortion in Finland. Am J of Epidemiology, 120, 370-378.
Lindbohm ML, Taskinen H, Sallmén M and Hemminki K, 1990. Spontaneous abortions among women
exposed to organic solvents. Am J of Ind Medicine 17, 449-463.
Ling S and Lindsay WA, 1971. Perchloroethylene burns (letter). Br Med J 3, 115.
Lobban L, 1975. The atmospheric fates of C2Cl4, CF2Cl2 and CFCl3. MSc thesis, Rutgers University, New
Brunswick NJ.
Loch JPG, Kool HJ, Lagas P and Verheul JHAM, 1986. Removal and retention of volatile chlorinated soil,
proceedings 1st international TNO conference on contaminated soil, November 1985, Utrecht. Martinus
Nijhoff, Dordrecht, 63-77.
Loekle D, 1987. The effects of chlorinated hydrocarbons on Carassius Auratus. Diss Abstr Int B 47,
DA8628334 [abstract].
Loekle DM, Schecter AJ and Christian JJ, 1983. Effects of chloroform, tetrachloroethylene, and
trichloroethylene on survival, growth, and liver of Poecilia sphenops. Bull Environm Contam Toxicol 30, 199-
205.
Longstaff E and Ashby J, 1978. Short-term carcinogen test report on perchloroethylene. CTL ref. Z1332,
dated 11/1/78. ICI, Alderley Park, Macclesfield, Cheshire.
Ludwig HR, Meister MV, Roberts DR and Cox C, 1983. Workers exposure to perchloroethylene in the
commercial dry-cleaning industry. Am Ind Hyg Ass J 44, 600-605.
Lukaszewski T, 1979. Acute tetrachloroethylene fatality. Clin Toxicol 15, 411-415.
Lundberg I, Hoegberg J, Knonevi T and Holmberg B, 1987. Three industrial solvents investigated for tumor
promoting activity in the rat liver. Cancer Letters 36, 29-33.
Lynge E, 1994. Danish Cancer Registry as a resource for occupational research. J Occup Med 36, 1169-
1173.
Lynge E and Thygesen L, 1990. Primary liver cancer among women in laundry and dry-cleaning work in
Denmark. Scand J Environ Health, 16, 108-112.
Lynge E, Carstensen B and Anderson O, 1995. Primary liver cancer among women in laundry and dry-
cleaning work in Denmark. Scand J Environ Health 21, 293-295.
Maben JR, Keene WC, Pszenny AAP and Galloway JN, 1995. Volatile inorganic Cl in surface air over
eastern North America. Geophys Res Lett, 22, 3513-3516.
Tetrachloroethylene 251
Mabey WR, Smith JH, Podoll RT, Johnson HL, Mill T, Chou TW, Gates J, Waight Partridge I, Jaber H and
Vandenberg D, 1982. Aquatic fate data for organic priority pollutants. SRI International. EPA report 440/4-
81-014. US EPA, Washington DC [NTIS PB87-169090].
McCarthy TB and Jones RD, 1983. Industrial gassing poisonings to trichloroethylene, perchloroethylene and
1,1,1-trichloroethane, 1961-80. Br J Ind Med 40, 450-455.
McConnell G, Ferguson DM and Pearson CR, 1975. Chlorinated hydrocarbons and the environment.
Endeavour 34, 13-18.
McCredie M and Stewart JH, 1993. Risk factors for kidney cancer in New South Wales. IV Occupation Br
J Ind Med 50, 349-354.
McCulloch A and Midgley PM, 1996. The production and global distribution of emissions of
trichloroethene, tetrachloroethene and dichloromethane over the period 1988-1992. Atmos Environ 30,
601-608.
McDonald AD, McDonald JC, Armstrong B, Cherry N, Delorme C, Nolin AD and Robert D, 1987a. Occupation
and pregnancy outcome. Brit J of Ind Medicine 44, 521-526.
McDonald JC, Lavoie J, Côté R and McDonald AD, 1987b. Chemical exposures at work in early pregnancy
and congenital defect: a case-referent study. Brit J of Ind Medicine 44, 527-533.
McDonald AD, McDonald JC, Armstrong Cherry N, Côté R, Lavoie J, Nolin AD and Robert D, 1988.
Congenital defects and work in pregnancy. Brit J of Ind Medicine 45, 581-588.
McDougal JN, Jepson GW, Clewell HJ, Gargas ML and Anderson ME, 1990. Dermal absorption of organic
chemical vapors in rats and humans. Fund Appl Toxicol 14, 299-308.
McLaughlin JK, Malker HSR, Stone BJ, Weiner JA, Malter BK, Ericsson JLE, Blot WJ and Fraumeni JF,
1987. Occupational risks for renal cancer in Sweden. Br J Ind Med 44, 119-123.
Magara Y and Furuichi T, 1986. Environmental pollution by trichloroethylene and tetrachloroethylene: a
nationwide survey. In: Chambers PL, Gehring P and Sakai F (ed), new concepts and developments in
toxicology. Elsevier Science, 231-243.
Makide Y, Yokohata A, Kubo Y and Tominaga T, 1987. Atmospheric concentrations of halocarbons in Japan
in 1979-1986. Bull Chem Soc Japan 60, 571-574.
Malker H and Weiner J, 1984. Cancer Environment Register. Examples of use of register-based
epidemiology in occupational health. Arbete Hälsa 9, 1-107.
Malle KG, 1990. Vergleich von Elbe und Rhein. Gegenüberstellung der Gütedaten, UWSF-Z. Umweltchem
Oekotox 2, 92-96.
Maltoni C and Cotti G, 1986. Results of long-term carcinogenicity bioassays of tetrachloroethylene on
Sprague-Dawley rats administered by ingestion. Acta Oncologica 7, 11.
252 ECETOC Joint Assessment of Commodity Chemicals No.39
Manning M, Treacy J and Sidebottom HW, 1996. Kinetics and mechanisms for the oxidation of chlorinated
alkanes and alkenes. In: Sidebottom HW and Franklin J (eds), proceedings of the World Chlorine Council
Workshop “Chloroacetic Acids in the Atmospheric Environment - Anthropogenic or Natural?”, 29-30 March
1996, Garmisch-Partenkirchen, Germany.
Marchand M, 1989. Les polluants organiques toxiques dans les rejets urbains en milieu marin ou estuarien.
Technique et Science Municipale et Revue L'Eau 84, 7-18.
Marchand M, Caprais JC, Tronczynski J, Marty JC, Scribe P and Saliot A, 1986. Processus de transport
et flux des hydrocarbures et hydrocarbures halogénés dans l’estuaire de la Loire. Rapp P-v Réun Cons
int Explor Mer 186, 361-374.
Marchand M, Caprais JC and Pignet P, 1988. Hydrocarbons and halogenated hydrocarbons in coastal
waters of the Western Mediterranean (France). Mar Environ Res 25, 131-159.
Marchand M, Caprais JC, Pignet P and Porot V, 1989. Organic pollutants in urban sewage and pollutant
inputs to the marine environment, application to the French shoreline. Water Res 23, 461-470.
Margossian N, Limasset J-C and Richard S, 1971. Contribution à l'étude de la dégradation thermique de
quelques solvants chlorés industriels, 2è partie, dégradation oxydante de tétrachloréthylène
(perchloréthylène) dans l'air. INRS, Cahiers de Notes Doc 64, 247-259.
Margossian N, Limasset J-C and Richard S, 1973. Contribution à l'étude de la dégradation thermique de
quelques solvants chlorés industriels, 5è partie, dégradation oxydante de tétrachloréthylène, du
trichloréthylène et du trichloro-1,1,1-éthane dans l'air, en présence de quelques métaux usuels. INRS,
Cahiers de Notes Doc 70, 11-22.
Marth E, Stünzner D, Binder H and Möse JR, 1985a. Tetrachlorethylen, eine Studie über die Wirkung
niedriger Konzentrationen von 1,1,2,2-Tetrachlorethylen (Perchlorethylen) am Organismus der Maus, I,
laborchemische Untersuchungen. Zbl Bakt Hyg, I. Abt Orig B 181, 525-540.
Marth E, Stünzner D, Binder H and Möse JR, 1985b. Tetrachlorethylen, eine Studie über die Wirkung
niedriger Konzentrationen von 1,1,2,2-Tetrachloethylen (Perchloethylen) am Organismus der Maus, II,
Rückstandsuntersuchungen von Tetrachlorethylen in verschiedenen Organen und Nachweis von
histologischen Veränderungen der untersuchten Organe. Zbl Bak Hyg I; Abt Orig B 181, 541-547.
Materna BL, 1985. Occupational exposure to perchloroethylene in the dry cleaning industry. Am Ind Hyg
Assoc J 46, 268-273.
Mathias E, Sanhueza E, Hisatsune IC and Heicklen J, 1974. The chlorine atom sensitised oxidation and the
ozonolysis of CCl4. Can J Chem 52, 3852-3862.
Matter-Müller C, Gujer W, Giger W and Stumm W, 1980. Non-biological elimination mechanisms in a
biological sewage treatment plant. Prog Water Technol 12, 299-314.
Matter-Müller C, Gujer W and Giger W, 1981. Transfer of volatile substances from water to the atmosphere.
Water Research 15, 1271-1279.
Tetrachloroethylene 253
Mattsson JL, Albee RR, Yano BL, Bradley GJ and Spencer PJ, 1998. Neurotoxicologic examination of rats
exposed to 1,1,2,2-tetrachloroethylene (perchloroethylene) vapor for 13 weeks. Neurotoxicol Teratol 20, 83-
98.
Mazza V, 1972. Enzymatic changes in experimental tetrachloroethylene poisoning. Folia Med 55, 373-
381.
Mazza V and Brancaccio A, 1971. Adrenal corical and medullar hormones in experimental
tetrachloroethylene poisoning. Folio Med 54, 204-207.
Mazzulo M, Grilli S, Lattanzi G, Prodi G, Turina MP and Colacci A, 1987. Evidence of DNA-binding activity to
perchloroethylene. Res Communic Chem Pathol Pharmacol 58, 215-235.
Meckler LC and Phelps DK, 1966. Liver disease secondary to tetrachloroethylene exposure. A case report.
J Am Med Assoc 197, 662-663.
Mertens R and Von Sonntag C, 1995. Photolysis (λ = 254 nm) of tetrachloroethene in aqueous solutions.
J Photochem Photobiol A: Chem 85, 1-9.
Method HL, 1946. Toxicity of tetrachloroethylene (letter). J Am Med Assoc 131, 1468.
Metz V, Graben N and Bock KD, 1982. Symptomatik und Differentialtherapie der ingestiven und inhalativen
Tetra-(=Per-)chloräthylen Vergiftung. Med Welt 33, 892-894.
Meyer NJ, 1973. Altérations bronchopulmonaires par le trichloroethylène et autres hydrocarbures halogénés.
Bronches 23, 113-124.
Midgley PM and Place J, 1992. Production, technical applications and emissions of volatile halocarbons.
Presented at: Ecoinforma ‘92, Bayreuth, September 1992 [submitted to Toxicological & Environmental
Chemistry, October 1992].
Milman HA, Story DL, Riccio ES, Sivak A, Tu AS, Williams GM, Tong C and Tyson CA, 1988. Rat liver foci
and vitro assays to detect initiating and promoting effects of chlorinated ethanes and ethylenes. Ann NY
Acad Sci 534, 521-530.
Ministerie van Volksgezondheid en Leefmilieu, Instituut voor Hygiene en Epidemiologie, 1990. Leefmilieu in
Belgie nu en morgen. Statusrapport, 1990.
Missere M, Giaccomini C, Gennari P, Violante F, Dallolio L, Failla G, Lodi V and Raffi G, 1988. Evaluation
of exposure to tetrachloroethylene in dry cleaning shops. Med Lav 10, 261-267 [Italian].
Miyamoto K and Urano K, 1996. Reaction rates and intermediates of chlorinated organic compounds in
water and soil. Chemosphere 32, 2399-2408.
Møgelberg TE, Sehested J, Nielsen OJ and Wallington TJ, 1995. Atmospheric chemistry of
pentachloroethane (CCl3CCl2H): absorption spectra of CCl3CCl2 and CCl3CCl2O2 radicals, kinetics of the
CCl3CCl2O2 + NO reaction, and fate of the CCl3CCl2O radical. J Phys Chem 99, 16932-16938.
254 ECETOC Joint Assessment of Commodity Chemicals No.39
Mokrauer JE and Kosson DS, 1989. Electrophysical sorption of two carbon halogenated solvents onto soil.
Environmental Progress 8, 279-283.
Monster AC and Smolders JFJ, 1984. Tetrachloroethylene in exhaled air of persons living near pollution
sources. Int Arch Work Occup Environm Health 53, 331-336.
Monster A, Regouin-Peeters W, Van Schijndel A and Van der Tuin J, 1983. Biological monitoring of
occupational exposure to tetrachloroethylene. Scand J Work Environm Health 9, 273-281.
Montalto B and Mari F, 1971. L’avvelenamento acuto da percloroetilene. Minerva Medicolegale 4, 28-39.
Montzka SA, Butler JH, Myers RC, Thompson TM, Swanson TH, Clarke AD, Lock LT and Elkins JW,
1996. Decline in the tropospheric abundance of halogen from halocarbons: implications for stratospheric
ozone depletion. Science 272, 1318-1322.
Morgan B, 1969. Dangers of perchloroethylene (letter). Br Med J 2, 513.
Mudder T, 1982. Development of empirical structure biodegradability relationships and biodegradability
testing protocol for volatile and slightly soluble priority pollutants. Presented at: Meeting of the American
Chemical Society, Division of Environmental Chemistry, September 1982, Kansas City, MO, 52-53 [Diss Abstr
Int 1981, 42, 1804-B].
Müller JPH and Korte F, 1977. Beitrage zur oekologischen Chemie CXXXVI. Kurze Mitteilung zur nicht
sensibilierten Photooxidation von Chloroäthylenen. Chemosphere 6, 341-346.
Müller S, Zweifel H-R, Kinnison DJ, Jacobsen JA, Meier MA, Ulrich MM and Schwarzenbach RP, 1996.
Occurrence, sources, and fate of trichloroacetic acid in Swiss waters. Environmental Toxicology and
Chemistry 15, 1470-1478.
Münzer M and Heder K, 1972. Ergebnisse der Arbeitsmedizinischen und technische Überprüfung
chemischer Reinigungsbetriebe. Zbl Arbeitsmed 22, 133-138.
Murray AJ and Riley JP, 1973. Occurrence of some chlorinated aliphatic hydrocarbons in the
environment. Nature 242, 37-38.
Mutti A, Alinovi R, Bergamaschi E, Biagini C, Cavazzini S, Franchini I, Laurwerys RR, Bernard AM, Roels
H, Gelpi E, Rosello J, Ramis I, Price RG, Taylor SA, De Broe M, Nuyts GD, Stolte H, Fels LM and Herbort
C, 1992. Nephropathies and exposure to perchloroethylene in dry cleaners. Lancet 340, 189 -193.
Nakamura K, 1985. Mortality patterns among cleaning workers. Jap J Ind Health 27, 24-37.
Nakatsuka H, Watanabe T and Takeuchi, 1992. Absence of blue-yellow color vision loss among workers
exposed to toluene or tetrachloroethylene, mostly at levels below occupational exposure limits. Int Arch
Occup Environ Health 64, 113-117.
Namkung E and Rittmann, BE, 1987. Estimating volatile organic compound emissions from publicly owned
treatment works. Journal of the Water Pollution Control Federation 59, 670-678.

Tetrachloroethylene 255
NCI (US National Cancer Institute), 1977. Bioassay of tetrachloroethylene for possible carcinogenicity. NCI
TR 13. US Dept of Health, Education and Welfare, Cincinatti, OH.
Neely WB, Branson DR and Blau GE, 1974. Partition coefficient to measure bioconcentration potential of
organic chemicals in fish. Environ Sci Technol 8, 1113-1115.
Nelson BK, Taylor BJ, Setzer JV and Hornung RW, 1979. Behavioral teratology of perchloroethylene in rats.
J Environ Pathol Toxicol 3, 233-250.
Nelson BK, Taylor BJ, Setzer JV and Hornung RW, 1980. Behavioral teratology of perchloroethylene in rats.
J Env Pathol Toxicol 3, 233-250.
Neumayr V, 1981. 4. Verteilungs- und Transportmechanismen von chlorierten Kohlenwasserstoffen in der
Umwelt. WaBoLu Berichte 3, 24-40.
Neumüller OA, 1988. Römpps Chemie-Lexikon. Achte, neubearbeitete und erweiterte Auflage. Franckh'sche
Verlagshandlung, Stuttgart, Germany, 4178.
Nicholson AA, Meresz O and Lemyk B, 1977. Determination of free and total potential haloforms in drinking
water. Analyt Chem 49, 814-819.
Nicolis GD and Helwig EB, 1973. Exfoliative dermatitis. A clinopathologic study of 135 cases. Arch Dermatol
108, 788-797.
Nicovich JM, Wang S, McKee ML and Wine PH, 1996. Kinetics and thermochemistry of the Cl(2PJ) + C2Cl4
association reaction. J Phys Chem 100, 680-688.
NIOSH (US National Institute of Occupational Safety and Health), 1976. Criteria for a recommended
standard occupational exposure to tetrachloroethylene (perchloroethylene). Agatha Corp, Cincinnati OH.
NIOSH, Cincinnati, OH, 141 [NTIS PB-266 583].
NIOSH (US National Institute of Occupational Safety and Health), 1977a. NIOSH manual of analytical
methods, 2nd edition, part I: NIOSH monitoring methods. US Department of Health, Education and Welfare,
Cincinnati, OH, 127-1 - 127-7.
NIOSH (US National Institute of Occupational Safety and Health), 1977b. NIOSH manual of analytical
methods, part II: standards completion program validated methods. US Department of Health, Education and
Welfare, Cincinnati, OH, S335-1 - S335-9.
NTP (US National Toxicology Program), 1985. Technical report on the toxicology and carcinogenesis
studies of tetrachloroethylene (perchloroethylene) in F344/N rats and B6CF1 mice. DHSS-NIH Report 85-
2657.
NTP (US National Toxicology Program), 1986. Toxicology and carcinogenesis tetrachloroethylene
(perchloroethylene) (CAS No 127-18-4) in F344/N rats and B6C3F1 mice (inhalation studies). NTP TR 311.
NTP, Research Triangle Park, NC.
OECD (Organisation for Economic Co-operation and Development), 1996. SIDS initial assessment report for
the 5th SIAM, tetrachloroethylene, October 1996 (draft). OECD, Paris.
256 ECETOC Joint Assessment of Commodity Chemicals No.39
Ogata M, Tomokuni K and Watanabe S, 1968. ATP and lipid contents in the liver of mice after inhalation of
chlorinated hydrocarbons. Ind Health 6, 116-119.
Ohde G and Bierod K, 1989. Tetrachloroäthylenen-Belastung in der Nachbarschaft chemischer Reinigungen.
Öff. Gesundh.-Wes. 51, 628.
Ohtsuki T, Sato K, Koizumi A, Kumai M and Ikeda M, 1983. Limited capacity of humans to metabolize
tetrachloroethylene. Int Arch Occup Environ Health 51, 381-390.
Ollis DF, Hsiao CY, Budiman L and Lee CL, 1984. Heterogeneous photoassisted catalysis: conversions of
perchloroethylene, dichloroethane, chloroacetic acids and chlorobenzenes. J Catal 88, 89-96.
Olsen GW, Hearn S, Cook RR, Currier MF and Allen S, 1989. Mortality experience of a cohort of Louisiana
chemical workers. J Occup Med 31, 32-34.
Olsen J, Hemminki K, Ahlborg G, Bjerkedal T, Kyyrönen P, Taskinen H, Lindbohm ML, Heinonen OP, Brandt
L, Kolstad H, Halvorsen BA and Egenäs J, 1990. Low birthweight, congenital malformations, and
spontaneous abortions among dry-cleaning workers in Scandinavia. Scand J Work Environm Health 16, 163-
168.
Opdam JJG and Smolders JFJ, 1986. Alveolar sampling and fast kinetics of tetrachloroethene in man, I,
alveolar sampling. Bri J Ind Med 43, 814-824.
Opdam JJG and Smolders JFJ, 1987. Alveolar sampling and fast kinetics of tetrachloroethene in man, II, fast
kinetics. Bri J Ind Med 44, 26-34.
Osani H, 1967. Experimental studies on the liver damage caused by hepatotoxic poisons and serum
transaminase activity. J Sci Labour 43, 567-584.
OSHA (US Occupational Safety and Health Administration), 1989. Organic vapors, method no. 07, air. OSHA
Analytical Laboratory, Salt Lake City UT, 1-11. OSHA, US Dep. Labor, Washington, DC.
Pannier R, Hübner G and Schultz G, 1986. Results of biological exposure tests in connection with passive
dosimetric measurements of ambient air concentrations in occupational exposure to tetrachloroethylene in
dry-cleaning shops. Z ges Hyg 32, 297-300 [German].
Parsons F, Lage GB and Rice R, 1985. Biotransformation of chlorinated organic solvents in static
microcosms. Environ Toxicol Chem 4, 739-742.
Patel R, Janakiraman H and Towne WD, 1977. Pulmonary edema due to tetrachloroethylene. Environ
Health Perspect 21, 247-249.
Pavlostatis SG and Zhuang P, 1993. Reductive dechlorination of chloroalkenes in microcosms developed
with a field contaminated soil. Chemosphere 27, 585-595.
Pearson CR and McConnell G, 1975. Chlorinated C1 and C2 hydrocarbons in the marine environment. Proc
R Soc Lond B 189B, 305-332.
Tetrachloroethylene 257
Pedersen F, Tyle H, Niemelä JR, Guttmann B, Lander L, Wedebrand A, 1994. Environmental hazard
classification-data collection and interpretration guide. TemaNord, 589.
Pellizzari ED, Hartwell TD, Harris III BSH, Waddell RD, Whitaker DA and Erickson MD, 1982. Purgeable
organic compounds in mother’s milk. Bull Environ Contam Toxicol 28, 322-328.
Penverne Y and Montiel A, 1985. Etude des organohalogènes volatiles dans les eaux souterraines du
Département du Val de Marne (France). Trib Cebedeau 38, 23-30.
Pereira MA, Herren SL, Britt AL and Khoury MM, 1982. Initiation/promotion bioassay in rat liver: Use of
gamma glutamyltranspeptidase-positive foci to indicate carcinogenic activity. Toxicol Pathol 10, 11-18.
Pfannhauser W and Thaller A, 1985. Bestimmung halogenierter Loesungsmittelrückstände in Wasser,
Abwasser, Futter- und Lebensmitteln. Fresenius Z Anal Chem 322, 220.
Phelps TJ, Niedzielski JJ, Malachlowsky KJ, Schram RM, Herbes SE and White DC, 1991. Biodegradation of
mixed-organic wastes by microbial consortia in continuous-recycle expanded-bed bioreactors. Environ Sci
Technol 25, 1461-1465.
Piet GJ, Morra CHF, de Kruijf HAM, Schultink LJ and Smeenk JGHM, 1981. The behaviour of organic
micropollutants during passage through soil. In: van Duijvenbooden W, Glasbergen P and van Lelyveld H
(eds), Quality of groundwater, Proceedings of an International Symposium, Noordwijkerhout, The
Netherlands, 23-27 March 1981. Studies in Environmental Science 17, 557-564.
Pignatello JJ, 1990a. Slowly reversible sorption of aliphatic halocarbons in soils, 1, Formation of residual
fractions. Environmental Tox and Chemistry 9, 1107-1115.
Pignatello JJ, 1990b. Slowly reversible sorption of aliphatic halocarbons in soils, 2, Mechanistic aspects.
Environmental Tox and Chemistry 9, 1117-1126.
Piwoni MD and Banerjee P, 1989. Sorption of volatile organic solvents from aqueous solution onto
subsurface solids. Journal of Contaminant Hydrology 4, 163-179.
Plaa GL and Larson RE, 1965. Relative nephrotoxic properties of chlorinated methane, ethane, and ethylene
derivatives in mice. Toxicology and Applied Pharmacology 7, 37-44.
Plaa GL, Evans EA and Hine CH, 1958. Relative hepatotoxicity of seven halogenated hydrocarbons.
J Pharmacol Exp Ther 123, 224-229.
Plümacher J and Schröder P, 1994. Accumulation and fate of C1/C2-chlorocarbons and trichloroacetic acid
in spruce needles from an Austrian mountain site. Chemosphere, 29, 2467-2476.
Pottern LM, Morris LE, Blot WJ, Ziegler RG and Fraumeni JF, 1981. Esophageal cancer among black
men in Washington, DCI. Alcohol, tobacco, and other risk factors. J Natl Cancer Inst 67, 777-783.
Pozzani UC, Weil CS and Carpenter CP, 1959. The toxicological basis of threshold limit values 5, the
experimental inhalation of vapour mixtures by rats, with notes upon the relationship between single dose
inhalation and single dose oral data. Am Ind Hyg Assoc J 20, 364-369.
258 ECETOC Joint Assessment of Commodity Chemicals No.39
Prather M and Spivakovsky CM, 1990. Tropospheric OH and the lifetimes of hydrofluorocarbons.
J Geophys Res 95, 18723-18729.
Price PJ, Hasset CM and Mansfield JI, 1978. Transforming activities of trichloroethylene and proposed
industrial alternatives. In Vitro 14, 290-293.
Prinn RG, Weiss RF, Miller BR, Huang J, Alyea FN, Cunnold DM, Fraser PJ, Hartley DE and Simmonds
PG, 1995. Atmospheric trends and lifetime of CH3CCl3 and global OH concentrations. Science 269, 187-
192.
Pruden AL and Ollis DF, 1983. Photoassisted heterogeneous catalysis: the degradation of trichloroethylene
in water. J Catal 82, 404-417.
Rachootin P and Olsen J, 1983. The risk of infertility and delayed conception associated with exposures in
the Danish workplace. J of Occupational Med 25, 394-402.
Rampy LW, Quast JF, Leong BKJ and Gehring PJ, 1978. Results of long-term inhalation studies on rats of
1,1,1-trichloroethane and tetrachloroethylene formulations. In: Plaa GL and Duncan WAM (eds),
Proceedings of the first international congress on toxicology. Academic Press, New York, 562.
Rantala K, Riipinen H and Anttila A, 1992. Altisteetyössä, 22 halogeenihiitivedyt [exposure at work, 22
halogenated hydrocarbons]. Finnish Institute of Occupational Health, Helsinki.
Rao HV and Brown DR, 1993. A physiologically based pharmacokinetic assessment of
tetrachloroethylene in groundwater for a bathing and showering determination. Risk Anal 13, 37-49.
Rao KS, Besto JE and Olson KJ, 1981. A collection of guinea pig sensitization test results grouped by
chemical class. Dug Chem Toxicol 4, 331-351.
Redmond and Schappert KR, 1987. Occupational dermatitis associated with garments. J Occup Med 3,
243-244.
Reichert D, Neudecker T, Spengler U and Henschler D, 1983. Mutagenicity of dichloroacetylene and its
degradation products trichloroacetyl chloride, trichloroacryloyl chloride and hexachlorobutadiene. Mut Res
117, 21-29.
Reimann S, Grob K and Frank H, 1996. Chloroacetic acids in rainwater. Environ Sci Technol 30, 2340-
2344.
Reinhard K Dulson W and Exner M, 1989. Untersuchungen zum Vorkommen von Perchlorethylen in
Raumluft und Lebensmitteln in Wohnungen in der Nähe von Chemischreinigungen. Zbl Hyg 189, 111-116.
Reinhardt CF, Mullin LS and Maxfield ME, 1973. Epinephrine-induced cardiac arrhythmia potential of some
common industrial solvents. J Occup Med 15, 953-955.
Reitz RH and Nolan RJ, 1986. Physiological pharmacokinetic modelling for perchloroethylene dose
adjustment. Dow Chemical, Midland, MI [draft].
Tetrachloroethylene 259
Renner I, Schleyer R and Mühlhausen D, 1990. Gefährdung der Grundwasserqualität durch anthropogene
organische Luftverunreinungen. VDI Berichte 837, 705-727.
Richter JE, Peterson SF and Kleiner CF, 1983. Acute and chronic toxicity of some chlorinated benzenes,
chlorinated ethanes, and tetrachloroethylene to Daphnia magna. Arch Environ Contam Toxicol 12, 679-684.
Riihimäki V and Pfäffli P, 1978. Percutaneous absorption of solvent vapors in man. Scand J Work Environ
Health 4, 73-85.
Rinzema LC, 1971. Behavior of chlorohydrocarbons solvents in the welding environment. Int Archives of
Occupational Health 28, 151-174.
Rippen, 1992. Handbuch Umweltchemikalien, 14th update, edition 3/92. Ecomed, München, 19-21.
Rivett MO, Lerner DN and Lloyd J, 1990. Organic contamination of the Birmingham aquifer (UK). Journal
of Hydrology 113, 307-323.
RIVM (Dutch National Institute of Public Health and Environmental Protection), 1984. Criteria document
over tetrachloretheen. Publ Lucht 32. Min VROM, DG Milieuhygiene, Leidschendam.
RIVM (Dutch National Institute of Public Health and Environmental Protection), 1993. Monitoring of
radioactivity and xenobiotic substances in the environment. RIVM, Bilthoven.
RIWA (Samenwerkende Rijn- en Maaswaterleidingbedrijven), 1995. Jaarrapport 1993 B: De Maas. RIWA,
Amsterdam.
Roberts PV and Dändliker PG, 1983. Mass transfer of volatile organic contaminants from aqueous solution to
the atmosphere during surface aeration. Environ Sci Technol 17, 484-489.
Römbke J, Bauer C and Hilt J, 1991. Study of the acute toxicity for the earthworm tetrachloroethene.
According to OECD guideline for testing of chemicals 207. Batelle Institute, Frankfurt am Main.
Umweltbundesamt, Berlin.
Römbke J, Heimann D, Bauer C and Vickus P, 1993. Study of the acute toxicity for Poecilus cupreus
(Carabidae) of Tetrachlorethen. Batelle Institute report 5. Umweltbundesamt, Berlin.
Rosengren LE, Kjellstrand P and Haglid KG, 1986. Tetrachloroethylene: levels of DNA and S-100 in the
gerbil CNS after chronic exposure. Neurobehav Toxicol Teratol 8, 201-206.
Rowe VK, McCollister DD, Spencer HC, Adams EM and Irish DD, 1952. Vapour toxicity of
tetrachloroethylene for laboratory animals and human subjects. Am Med Assoc Arch Ind Health 5, 566-579.
Ruder AM, Ward EM and Brown DP, 1994. Cancer mortality in female and male dry-cleaning workers.
J Occup Med 36, 867-874.
Rudolph J, Koppmann R and Plass-Dülmer C, 1996. The budgets of ethane and tetrachloroethene: Is
there evidence for an impact of reactions with chlorine atoms in the troposphere? Atmos Environ 30,
1887-1894.

260 ECETOC Joint Assessment of Commodity Chemicals No.39
Ruf M and Scherb K, 1977a. Ergebnisse von Versuchen zum Ausdampfen einiger niedermolekularer
Chlorkohlenwasserstoffe aus einem Fliessgerinne. Abwassertechnik 2, 16-17.
Ruf M and Scherb K, 1977b. Ergebnisse von Versuchen zum Ausdampfen einiger niedermolekularer
Chlorkohlenwaserstoffe aus einem Fliessgerinne. Abwassertechnik 3, 16-19.
Ruth JH, 1986. Odor thresholds and irritation levels of several chemical substances: a review. Am Ind Hyg
Assoc J 47, 142-151.
Sagunski H, Hajimiragha H, Fischer U and Boettger A, 1987. Grundwasserverunreinigungen durch
Halogenkohlenwasserstoffe im Raum Düsseldorf. Forum Städte-Hyg 38, 75-76.
Saland G, 1967. Accidental exposure to perchloroethylene, case report. New York State J Med 67, 2359-
2361.
Sallmén M, Lindbohm ML, Kyyrönen P, Nykyri E, Anttila A, Taskinen H and Hemminki K, 1995. Reduced
fertility among women exposed to organic solvents. Am J of Ind Med 27, 699-713.
Sandground JH, 1941. Coma following medication with tetrachloroethylene. J Am Med Assoc 117, 440-441.
Sanhueza E, Hisatsune IC and Heicklen J, 1976. Oxidation of haloethylenes. Chemical Reviews 76, 801-
825.
Santodonato J et al, 1985. Monograph on human exposure to chemicals in the workplace,
tetrachloroethylene. Contract 1-CP-26002-03, final report. NCI, Bethesda MD.
Sauer TC, 1981. Volatile organic compounds in open ocean and coastal surface waters. Org Geochem
3, 91-101.
Savolainen H, Pfäffli P, Tengén M and Vainio H, 1977. Biochemical and behavioural effects of inhalation
exposure to tetrachloroethylene and dichloromethane. J Neuropath Exp Neurol 36, 941-949.
Sayato Y, Nakamuro K and Ueno H, 1987. Mutagenicity of products formed by ozonation of
naphthoresorcinol in aqueous solutions. Mutat Res 189, 217-222.
Schefer W, 1981a. Hemmung der anaeroben Gärung von Klärschlamm durch Abwasserinhaltstoffe. Gas-
Wasser-Abwasser 61, 261-263.
Schefer W, 1981b. Hemmung der anaeroben Gärung von Klärschlamm durch Abwasserinhaltstoffe.
Z Wasser Abwasser Forsch 14, 69-71.
Schleyer R, Fillibeck J, Hammer J and Raffius B, 1996. Beeinflussung der Grundwasserqualität durch
Deposition anthropogener Stoffe aus der Atmosphäre. WaBoLu-Hefte 10, 246-250.
Schoenberg JB, Stemhagen A, Mogielnicki AP, Altman T, Abe T and Mason TJ, 1984. Case-control study of
bladder cancer in New Jersey, I, Occupational exposures in white males. J Nat Cancer Inst 72, 973-981.

Tetrachloroethylene 261
Schoknecht W, Wodarz R, Fritzsche I and Weichard H, 1983. Simple gas-chromatographic determination of
trichloroethylene, perchloroethylene and their metabolites in biological samples in a single operation
[German]. Staub-Reinhalt Luft 43, 186-188 [Chem Abstr 99, 6543h].
Schreiber JS, House S, Prohonic E, Smead G, Hudson C, Styk M and Lauber J, 1993. An investigation of
indoor air contamination in residences above dry cleaners. Risk Analysis 13, 335-344.
Schröder P and Weiss A, 1991. Uptake and detoxification of chlorinated hydrocarbons by spruce trees. In:
Schwarz SE and Slinn GWN (eds), Precipitation scavenging and atmosphere surface exchange 2.
Hemisphere, Washington DC, 1011-1021.
Schumann AM, Quast JF and Watanabe PG, 1980. The pharmacokinetics and macromolecular interactions
of perchloroethylene in mice and rats as related to oncogenicity. Toxicol Appl Pharmacol 55, 207-219.
Schumann AM, Watanabe PG and Reitz RH, 1982. The importance of pharmacokinetic and
macromolecular events as they relate to mechanisms of tumorigenicity and risk assessment. In : Plaa G,
Hewitt WR, (eds), Toxicology of the liver target organ toxicology series. Raven Press Books, New York,
311-331.
Schwarzenbach RP and Westall J, 1981. Transport of nonpolar organic compounds from surface water to
groundwater, laboratory sorption studies. Environ Sci Technol 15, 1360-1367.
Schwarzenbach RP, Molnar-Kubica E, Giger W and Wakeham SG, 1979. Distribution, residence time, and
fluxes of tetrachloroethylene and 1,4-dichlorobenzene in Lake Zurich, Switzerland. Environ Sci Technol 13,
1367-1373.
Schwarzenbach RP, Giger W, Hoehn E and Schneider JK, 1983. Behavior of organic compounds during
infiltration of river water to groundwater, field studies. Environ Sci Technol 18, 472-479.
Schwetz BA, Leong BKJ and Gehring PJ, 1975a. The effect of maternally inhaled trichloroethylene,
perchloroethylene, methyl chloroform and methylene chloride on embryonal foetal development in mice and
rats. Tox Appl Pharmacol 28, 452-464.
Schwetz BA, Leong BKJ and Gehring PJ, 1975b. The effect of maternally inhaled trichloroethylene,
perchloroethylene, methyl chloroform and methylene chloride on embryonal and fetal development in mice
and rats. Tox and Appl Pharmacology 32, 84-96.
Seeber A, 1989. Neurobehavioural toxicity of long-term exposure to tetrachloroethylene. Neurotoxicology
and Teratology 11, 579-583.
Seifert B, 1990. Flüchtige Organische Verbindungen in der Innenraumluft. Bundesgesundheitsblt 3, 111-
115.
Seiji K, Jin C, Watanabe T, Nakatsuka H and Ikeda M, 1990. Sister chromatid exchanges in peripheral
lymphocytes of workers exposed to benzene, trichloroethylene, or tetrachloroethylene, with reference to
smoking habits. Int Arch Occup Environ Health 62, 171-176.
262 ECETOC Joint Assessment of Commodity Chemicals No.39
Seip HM, Alstad J, Carlberg GE, Martinsen K and Skaane R, 1986. Measurement of mobility of organic
compounds in soils. Sci Total Environ 50, 87-101.
Selenka F and Bauer U, 1984. Belastung der Bevölkerung der Bundesrepublik Deutschland durch flüchtige
organische Halogenverbindungen aus Trinkwasser, Luft und Lebensmitteln; Abschlußbericht zum DFG-
Forschungsvorhaben "Organohalogene", Se-182/9. Institut für Hygiene der Ruhr-Universität, Bochum.
Semprini L, Roberts PV, Hopkins GD and McCarthy PL, 1990. A field evaluation on in situ biodegradation of
chlorinated ethenes: Part 2, results of biostimulation and biotransformation experiments. Ground Water 28,
715-727.
Shimada T, Swanson AF, Leber P and Williams GM, 1985. Activities of chlorinated ethane and ethylene
compounds in the Salmonella/rat microsome mutagenesis and rat hepatocyte/DNA repair assays under
vapor phase exposure conditions. Cell Biol Toxicol 1, 159-179.
Shipman AJ and Whim BP, 1980. Occupational exposure to trichloroethylene in metal cleaning processes
and tetrachloroethylene in the dry-cleaning industry in the UK. Ann Occup Hyg 23, 197-204.
Shubat PJ, Poirier SH, Knuth ML and Brooke LT, 1982. Acute toxicity of tetrachloroethylene and
tetrachloroethylene with dimethyformamide to rainbow trout (Salmo gairdneri). Bull Environ Contam Toxicol
28, 7-10.
Siematycki J, 1991. Risk factors for cancer in the workplace. CRC Press, Boca Raton FL.
Singh HB, Lillian D, Appleby A and Lobban L, 1975. Atmospheric formation of carbon tetrachloride from
tetrachloroethylene. Environ Letters 10, 253-256.
Singh HB, Salas LJ and Cavanagh LA, 1977. Distribution, sources and sinks of atmospheric halogenated
compounds. J Air Poll Contr Assoc 27, 332-336.
Singh HB, Salas LJ and Stiles RE, 1982. Distribution of selected gaseous organic mutagens and suspect
carcinogens in ambient air. Environ Sci Technol 16, 872-888.
Singh HB, Salas LJ and Stiles RE, 1983. Selected man-made halogenated chemicals in the air and oceanic
environment. J Geophys Res 88 C6, 3675-3683.
Singh HB, Gregory GL, Anderson B, Browell E, Sachse GW, Davis DD, Crawford J, Bradshaw JD, Talbot
R, Blake DR, Thornton D, Newell R and Merrill J, 1996a. Low ozone in the marine boundary layer of the
tropical Pacific Ocean: photochemical loss, chlorine atoms, and entrainment. J Geophys Res 101, 1907-
1917.
Singh HB, Thakur AN, Chen YE and Kanakidou M, 1996b. Tetrachloroethylene as an indicator of low Cl
atom concentrations in the troposphere. Geophys Res Lett 23, 1529-1532.
Skender LJ, Karacic V and Prpic-Majic D, 1991. A comparative study of human levels of trichloroethylene
and tetrachloroethylene after occupational exposure. Arch Toxicol 46, 174-178.
Smith JH, Bomberger DC and Haynes DL, 1980. Prediction of the volatilisation rates of high-volatility
chemicals from natural water bodies. Env Science and Technology 14, 1332-1337.
Tetrachloroethylene 263
Smith LR and Dragun J, 1984. Degradation of volatile chlorinated aliphatic primary pollutants in groundwater.
Environment International 10, 291-298.
Smith AD, Bharath A, Mallard C, Orr D, Smith K, Sutton JA, Vulkmanich J, McCarty LS and Ozburn GW,
1991. The acute and chronic toxicity of ten chlorinated organic compounds to the American flagfish
(Jordanella floridae). Arch Environ Contam Toxicol 20, 94-102.
Spielmann H, 1985. Tetrachlorethylen. BGA-Schriften 4/1985, 65-76.
Spirtas R, Stewart P and Lee S, 1991. Retrospective cohort mortality study of workers at an aircraft
maintenance facility, I, Epidemiological results. Br J Ind Med 48, 515-530.
SSA (Secretaria de Salubridad y Assistencia), 1984. Instructivo No. 10, relativo a las condiciones de
seguridad e higiene de los centros de trabajo, ethene, terachloro-. In: UNEP (UN Environment Programme)
recommendations and legal mechanisms, regulations and standards which are legally binding,
perchloroethylene. Departamento de Imprenta de la SSA, Mexico DF, Mexico [http://
dbserver.irptc.unep.ch:887].
Stanley JS, 1986. Broad scan analysis of human adipose tissue, vol. 2, volatile organic compounds. Govt
Reports Announcements & Index 15 [NTIS/PB87-177226].
Staples CA, Werner AF and Hoogheem TJ, 1985. Assessment of priority pollutant concentrations in the
United States using STORET database. Environ Toxicol Chem 4, 131-142.
Sterling TD and Weinkam JJ, 1976. Smoking characteristics by type of employment. J Occup Med 18,
743-754.
Stewart RD, 1969. Acute tetrachloroethylene intoxication. J Amer Med Assoc, 208, 1490-1492.
Stewart RD and Dodd HC, 1964. Absorption of carbon tetrachloride, trichloroethylene, tetrachloroethylene,
methylene chloride, and 1,1,1-trichloroethane through the human skin. Amer Ind Hyg Assoc J 25, 439-446.
Stewart RD, Arbor A, Gay HH, Erley DS, Hake CL and Schaffer AW, 1961. Human exposure to
tetrachloroethylene vapor. Archives of Envir Health, 2, 516-522.
Stewart RD, Baretta ED and Dodd HC and Torkelson TR, 1970. Experimental human exposure to
tetrachloroethylene. Arch Environ Health 20, 224-229.
Stewart RD, Hake CL, Wu A et al, 1977. Effects of perchloroethylene/drug interaction on behaviour and
neurological function. Final report 77-191 US DHEW / NIOSH. NIOSH, Washington, DC [PB83-17460].
Suarez L, Weiss NS and Martin J, 1989. Primary liver cancer death and occupation in Texas. Am J Ind
Med 15, 167-175.
Suflita JM, Gibson SA and Beeman RE, 1988. Anaerobic biotransformations of pollutant chemicals in
aquifers. J Ind Microbiol 3, 179-194.
Sullivan DA, Jones AD and Williams JG, 1985. Results of the US Environmental Protection Agency. Air
toxics analysis in Philadelphia. In: Proc-APCA Annual Meeting 78th, 2, 85-175.
264 ECETOC Joint Assessment of Commodity Chemicals No.39
Suva, 1997. Valeurs limites d’exposition aux postes de travail, VME/VLE, VBT, valeurs admissibles pour
agents physiques. Suva, Lucerne.
Sykes AL, Wagoner DE and Decker CE, 1980. Determination of perchloroethylene in the sub-parts-per-
billion range in ambient air by gas chromatography with electron capture detection. Anal Chem 52, 1630-
1633.
Tabak HH, Quave SA, Mashni CI and Barth EF, 1981. Biodegradability studies with organic priority pollutant
compounds. J Water Pollution Control Federation 53, 1503-1518.
Takeuchi Y, Hisanaga N, Ono Y, Iwata M, Oguri S, Tauchi T, Tanaka T 1981. An occupational health
survey on dry cleaning workers. Sangyo Igaku [Jap J Ind Health] 23, 407-418 [Japanese; abstract].
Tamaoki M, Hiraki T, Mitsumoto I, Kobayashi Y, Umeda H, Tsuji M and Watanabe H, 1983. Composition
of rain water in Kobe area. Hyogo-ken Kogai Kenkyusho Kenkyu Hokoku 15, 60-61. [Japanese]
Taskinen H, Anttila A, Lindbohm M-L, Sallmén M and Hemminki K, 1989. Spontaneous abortions and
congenital malformations among the wives of men occupationally exposed to organic solvents. Scand J
Work Environ Health 15, 345-352.
Teekens M, 1985. Preliminary research on the occurrence of pesticides and their degradation products in
sandy soils. Mededelingen Faculteit Landbouwwetenschappen, Rijksuniversiteit Gent 50, 885-894.
Theiss JC, Stoner GD, Shimkin MB and Weisburger EK, 1977. Test for carcinogenicity of organic
contaminants of United States drinking waters by pulmonary tumor response in strain A mice. Cancer Res
37, 2717-2720.
Thijsse TR, 1983. Luchtverontreiniging door uitworp van kolengestookte installaties. Rapport TNO-IMG.
TNO, Delft.
Thomas KW, Pellizzari E, Perritt RL and Nelson WC, 1991. Effect of dry-cleaned clothes on
tetrachloroethylene levels in indoor air, personal air, and breath for residents of several New Jersey
homes. J Expos Anal Environ Epidem 1, 475-490.
Thompson KM and Evans JS, 1993. Workers' breath source of perchloroethylene (Perc) in the home.
J Exposure Anal Environ Epidemiol 3, 417-430.
Tichenor BA, Sparks LE and Jackson MD, 1990. Emissions of perchlorthylene from dry cleaned fabrics.
Atmospheric Environment 24A, 1219-1229.
Tinston DJ, 1995. Perchloroethylene: multigeneration inhalation study in the rat. Report No CTL/P/4079.
Zeneca, Alderley Park, Macclesfield, Cheshire.
Tomson MB, Dauchy J, Hutchins S, Curran C, Cook CJ and Ward CH, 1981. Groundwater contamination by
trace level organics from a rapid infiltration site. Water Research 15, 1109-1116.
Tetrachloroethylene 265
Torkelsson TR and Rowe VK, 1981. Halogenated aliphatic hydrocarbons containing chlorine, bromine
and iodine. In: Clayton GD and Clayton FE (eds), Patty's industrial hygiene and toxicology, 3rd ed, vol 2B.
J Wiley, New York NY, 3562.
Trapp, S. and Harland, B, 1995. Field test of volatilization models. Environ Sci Pollut Res 2, 164-169.
Trapp S, Brüggemann R, Kalbfus W and Frey S, 1992. Organische und anorganische Stoffe im Main.
Gas-Wasser-Fach Wasser Abwasser 133, 495-504.
Travis CC, White RK and Arms AD, 1989. A physiologically based pharmacokinetic approach for assessing
the cancer risk of tetrachloroethylene. In: Paustenbach DJ (ed), The risk assessment of environmental and
human health hazards, a textbook of case studies. John Wiley, New York, NY, 769-796.
Trense E and Zimmerman H, 1969. Tödliche Inhalations-vergiftung durch chronisch einwirkende
Perchloräthylendämpfe. Zbl Arbeitsmed Arbeitsschutz 19, 131-137.
Triebig G and Schaller KH, 1986. Air monitoring of solvent exposed workers with passive samplers in
comparison to biological monitoring (BM). Toxicological and Environmental Chemistry 12, 295-312.
Trouwborst T, 1981. Groundwater pollution by volatile halogenated hydrocarbons; sources of pollution and
methods to estimate their relevance. Sci Total Environ 21, 41-46.
Truhaut R, Boudedne C, Jouany JM and Bouant A, 1972. Application of the physiogram to the investigation
of the acute toxicology of chlorinated solvents. J Eur Toxicol 5, 284-292.
Tsulaya VR, Bonashevskaya TI, Zykova VV, Shaipak VM, Erman FM, Shoricheva VN, Belyaeva NN,
Kumpan NN, Tarasova KI and Gushchina LM, 1977. Toxicological features of certain chlorine derivatives
of hydrocarbons. Gig Sanit 8, 50-53 [Chem Abstr 87, 128366].
Tu AS, Murray TA, Hatch KM, Sivak A and Milman HA, 1985. In vitro transformation of BALB/C-3T3 cells by
chlorinated ethanes and ethylenes. Cancer Lett 28, 85-92.
Tuazon EC, Atkinson R, Aschmann SM, Goodman MA and Winer AM, 1988. Atmospheric reactions of
chloroethenes with the OH radical. Int J Chem Kinet 20, 241-265.
Tuttle TC, Wood GD and Grether CB, 1977. A behavioral and neurological evaluation of workers exposed to
perchloroethylene. DHEW (NIOSH) publication 77-214. NIOSH, Cincinnati OH.
UBA (Umweltbundesamt), 1983. Materialienblatt zu Perchlorethylen, Trichlorethylen und 1,1,1-Trichlorethan
[draft 5.9.1983]. Umweltbundesamt 13.4-97061-2/2m, Bundes-gesundheitsamt CV5. UBA, Berlin.
UBA (Umweltbundesamt), 1986. Entwicklungsstand der Analysenverfahren zu den 129 Stoffen der
Vorschlagsliste (EG-Gewässerschutzrichtlinie 76/464/EWG). Tischvorlage III 1.2-20710/5. UBA, Berlin.
UBA (Umweltbundesamt), 1989. Hintergrundkonzentrationend von ubiquitären Stoffen. In: Daten zur
Umwelt 1988/89. UBA, Berlin, 242-243.
Urano K, Kawamoto K, Abe Y and Otake M, 1988. Chlorinated organic compounds in urban air in Japan.
Science of the Total Environment 74, 121-131.
266 ECETOC Joint Assessment of Commodity Chemicals No.39
US-EPA (US Environmental Protection Agency), 1975. Methods for acute toxicity tests with fish,
macroinvertebrates, and amphibians. Stephan CE, Committee on methods for toxicity tests. EPA 660/3-75-
009. US EPA, Washington DC.
US-EPA (US Environmental Protection Agency), 1980. Tetrachloroethylene, ambient water quality criteria.
EPA 440/5-80-073. US EPA, Washington DC [NTIS PB81-117830].
US-EPA (US Environmental Protection Agency), 1982. An exposure and risk assessment for
tetrachloroethylene. Gilbert D, Goyer M, Lyman W, Magil G, Walker P, Wallace D, Wechsler A, Yee J (Arhur
D. Little). EPA 440 4-85-015. US EPA, Washington DC [NTIS PB85-221497].
US-EPA (US Environmental Protection Agency), 1985. Occurrence, teratogenicity, embryotoxicity and
reprodutive effects. In: Health assessment document for tetrachloroethylene (perchloroethylene), final report.
EPA/600/8-82/005F. EPA, Washington DC [NTIS PB85-249704].
US-EPA (US Environmental Protection Agency), 1987-1988. Method 8240, 8260. In: Test methods for
evaluating solid waste, 3rd ed. Vol IB: Laboratory manual, physical/chemical methods. US EPA, Washington
DC.
US-EPA (US Environmental Protection Agency), 1993. Hazardous waste criteria, subpart C, characteristics
of hazardous waste. CFR 40 (1990), 261, 24 revised. Fed Reg 58, 46049.
US-EPA (US Environmental Protection Agency), 1996. Air quality: revision to definition of volatile organic
compounds - exclusion of perchloroethylene. Federal Register, 61, 4588.
Vail JT, 1974. False-negative reaction to patch testing with volatile compounds (letter). Arch Dermatol 110,
130.
Valencia R, Mason JM, Woodreff RC and Zimmering S, 1985. Chemical mutagenesis testing in Drosophila,
III, results of 48 coded compounds tested for the National Toxicology Program. Environ Mut 7, 325-348.
Vamvakas S, Dekant W, Berthold K, Schmidt S, Wild D and Henschler D, 1987. Enzymatic transformation of
mercapturic acids derived from halogenated alkenes to reactive and mutagenic intermediates. Biochem
Pharmacol 36, 2741-2748.
Van Beek L, 1990. Investigation of a possibility to reduce the use of rabbits in skin irritation tests;
experiments with dichloromethane, trichloroethylene, tetrachloroethylene and 1,1,1-trichloroethane, rep V
89.265. TNO-CIVO Institutes, Zeist.
Van de Meent D, Den Hollander HA, Pool WG, Vredenbregt MJ, Van Oers HAM, De Greef E and Luijten JA,
1986. Organic micropollutants in Dutch coastal waters. Wat Sci Tech 18, 73-81.
Van der Gulden JWJ and Zielhuis GA, 1989. Reproductive hazards related to perchloroethylene, a review.
Int Arch Occup Environ Health 61, 235-242.
Van der Tuin, 1979. Perchloroethylene in a dry cleaning service. Report F1647. TNO, Rijswijk.
Van der Tuin and Hoevers, 1977a. Perchloroethylene in a dry cleaning service. Report F1560. TNO,
Rijswijk.
Tetrachloroethylene 267
Van der Tuin and Hoevers, 1977b. Perchloroethylene in a dry cleaning service. Report F1590. TNO,
Rijswijk.
Van Duuren BL, Goldschmidt BM, Loewengart G, Smith AC, Melchlonne S, Seidman I and Roth D, 1979.
Carcinogenicity of haloganeted olefinic and aliphatic hydrocarbons in mice. J Natl Cancer Inst 63, 1433-
1439.
Vannelli T, Logan M, Arciero DM and Hooper AB, 1990. Degradation of halogenated aliphatic compounds by
the ammonia-oxidizing bacterium Nitrosomas europaea. Appl Env Microbiol 56, 1169-1171.
Vartiainen T, Pukkala E, Rienoja T, Strandman T and Kaksonen K, 1993. Population exposure to tri- and
tetrachloroethene and cancer risk: two cases of drinking water pollution. Chemosphere 27, 1171-1181.
Veith GD, Call DJ and Brooke LT, 1983. Structure-toxicity relationships for the fathead minnow, Pimephales
promelas: narcotic industrial chemicals. Can J Fish Aquat Sci 40, 743-748.
Veith GD, Macek KJ, Petrocelli SR and Carroll J, 1980. An evaluation of using partition coefficients and water
solubility to estimate bioconcentration factors for organic chemicals in fish. Aquatic Toxicol 116-129.
Verberk MM and Scheffers TML, 1980. Tetrachloroethylene in exhaled air of residents near dry-cleaning
shops. Environ Research 21, 432-437.
Verschueren K, 1983. Handbook of environmental data on organic chemicals, 2nd ed. Van Nostrand
Reinhold, New York, NY, 1071-1080.
Veul MFXW, Van Asseldonk ASF, de Boer C, de Bruijn PJ, Janssen CA and Langenhuijsen MJH, 1997.
Leidraad bodemberscherming. Sdu Uitgeverij, Den Haag.
Vieths S, Blaas W, Fischer M, Krause C, Mehlitz I and Weber R, 1987. Kontaminationen von Lebensmitteln
über die Gasphase durch Tetrachlorethen-Emissionen einer chemischen Reinigung. Z Lebensm Unters
Forsch 185, 267-270.
Vogel TM and McCarty PL, 1985. Biotransformation of tetrachloroethylene to trichloroethylene,
dichloroethylene, vinyl chloride, and carbon dioxide under methanogenic conditions. Appl Environ Microbiol
49, 1080-1083.
Von der Hude W, Behm C, Gürtler R and Basler A, 1988. Evaluation of the SOS chromotest. Mutat Res
203, 81-94.
Von Düszeln J and Thiemann W, 1983. Gesundheitsrisiko in Chemischreinigungen durch Verwendung von
Tetrachloroethylen. Zbl Arbeitsmed 33, 260-267.
Von Düszeln J, Lahl U, Bätjer K, Cetinkaya M, Stachel B, Thiemann W, Gabel B, Kozicki R and Podbielski A,
1982. Flüchtige Halogenkohlenwasserstoffe in Luft, Wasser und Nahrungsmitteln in der Bundesrepublik
Deutschland. Deutsche Lebensmittel-Rundschau 78, 352-356.
Vonk JW, Adema DMM and Barug D, 1986. Comparison of the effects of several chemicals on
microorganisms, higher plants and earthworms. In: Assink JW and Van den Brink WJ (eds), Contaminated
268 ECETOC Joint Assessment of Commodity Chemicals No.39
soil, proceedings 1st international TNO conference on contaminated soil, November 1985, Utrecht. Martinus
Nijhoff, Dordrecht, 191-202.
Wakeham SG, Davis AC and Karas JL, 1983. Mesocosm experiments to determine the fate and persistence
of volatile organic compounds in coastal seawater. Environ Sci Technol 17, 611-617.
Wakeham SG, Canuel, EA and Doering PH, 1986. Geochemistry of volatile organic compounds in
seawater, mesocosm experiments with 14C-model compounds. Geochimica et Cosmochimica Acta 50,
1163-1172.
Walbridge CT, Fiandt JT, Phipps GL and Holcombe GW, 1983. Acute toxicity of ten chlorinated aliphatic
hydrocarbons to the fathead minnow (Pimephales promelas). Arch Environm Contam Toxicol 12, 661-666.
Wallace LA, 1991. Comparison of risks from outdoor and indoor exposure to toxic chemicals. Environ
Health Persp 95, 7-13.
Wallace LA, Pellizzari E, Hartwell TD, Sparacino CM, Sheldon LS and Zelon H, 1984. Personal exposures,
outdoor concentrations, and breath levels of toxic air pollutants measured for 425 persons in urban, suburban
and rural areas. In: Proceedings 77th annual meeting of the Air Pollution Control Association, San Francisco
CA, 24-29 June 1984. J Air Pollution Control Association 34, 1-16.
Walles SAS, 1986. Induction of singled-strand breaks in DNA of mice by trichloroethylene and
tetrachloroethylene. Toxicol Letters 31, 31-35.
Walrath J, Rogot E, Murray J and Blair A, 1985. Mortality patterns among US veterans by occupation and
smoking status, vol 1. NIH publication 85-2756. US Department of Health and Human Services, Bethesda
MD.
Walther W, Teichgräber B, Schäfer W and Dähne M, 1985. Messungen ausgewählter organischer
Spurenstoffe in der Bodenzone, eine Bestandsaufnahme an einem Ackerbaugebiet. Z Dtsch Geol Ges
Hannover 136, 613-625.
Wang S, Karlsson JE, Kyrklund T and Haglid K, 1993. Perchloroethylene-induced reduction in glial and
neuronal cell marker proteins in rat brain. Phamacol Toxicol 72, 273-278.
Wang CJL, Blake DR and Rowland FS, 1995. Seasonal variations in the atmospheric distribution of a
reactive chlorine compound, tetrachloroethene (CCl2=CCl2). Geophys Res Lett 22, 1097-1100.
Ward RC, Travis CC, Hetrick DM, Andersen, ME and Gargas ML, 1988. Pharmacokinetics of
tetrachloroethylene. Toxicol Appl Pharmacol 93, 108-117.
Warner JR, Hughes TJ and Claxton LD, 1988. Mutagenicity of 16 volatile organic chemicals in a vaporization
technique with Salmonella typhimurium TA100. Environ Mol Mut 11, 111.
Waskell L, 1978. A study of the mutagenicity of anesthetics and their metabolites. Mutat Res 57, 141-153.
Watanabe M, Otaki T, Iketani S, Unno C, Takimoto T and Wakasawa H, 1989. Research on water
pollution with trichloroethylene, tetrachloroethylene and 1,1,1-trichloroethane. Shizuoka-ken Eisei Knakyo
Senta Kokoku 30, 137-142 [Japanese].
Tetrachloroethylene 269
Wauters E and Verdun G, 1989. Luchtverontreiniging in de streek van Tessenderlo-Kwaadmechelen, deel
IV, onderzoek naar toxische koolwaterstoffen te Tessenderlo. Jaarrapport 1988-1989. Instituut voor Hygiene
en Epidemiologie, Ministerie van Volksgezondheid en Leefmilieu, Brussels.
Wayne LG and Orcutt JA, 1960. The relative potentials of common organic solvents as precursors of eye-
irritants in urban atmospheres. J Occup Med 2, 383-388.
Weast RC, Astle MJ and Beyer WH, 1988. Handbook of chemistry and physics, 69th ed. CRC, Boca Raton
F, C-272.
Wenzel DG and Gibson RD, 1951. A study of the toxicity and the anthelminthic activity of n-butylidene
chloride. J Pharmacol 3, 169-176.
Werkgroep Deskundigen (Dutch Expert Committee for Occupational Standards), 1987. Occupational
health report on tetrachloroethylene, draft. DG Arbeid, Voorburg.
Werner M, Birner G and Dekant W, 1996. Sulfoxidation of mercapturic acids derived from tri- and
tetrachloroethene by cytochromes P4503A: A bioactivation reaction in addition to deacetylation and
cysteine conjugate b-lyase mediated cleavage. Chem Res Toxicol 9, 41-49.
Westrick JJ, Mello JW, Thomas RF, 1984. The ground water supply survey. Journal of American Water
Works Association 76, 52-59.
WHO (World Health Organization), 1984. Guidelines for drinking-water quality, Vol 2, Health criteria and
other supporting information. WHO, Geneva, 176-179.
WHO (World Health Organization), 1993. Guidelines for drinking-water quality, 2nd ed, Vol. 1,
Recommendations. WHO, Geneva, 63-64.
Wiedmann TO, Güthner B, Class TJ and Ballschmiter K, 1994. Global distribution of tetrachloroethene in
the troposphere: measurements and modeling. Environ Sci Technol 28, 2321-2329.
Williams KJ, 1991. Tetrachloroethylene and other volatile halocarbons in lard and butter from shops near
dry cleaning premises. Fd Sci Lab internal report 91, 61.
Wilson JT, Enfield CG, Dunlap WJ, Cosby RL, Foster DA and Baskin DB, 1981. Transport and fate of
selected organic pollutants in a sandy soil. J Environ Qual 10, 501-506.
Wilson JT, McNabb JF, Balkwill DL and Ghiorse WC, 1983a. Enumeration and characterization of bacteria
indigenous to a shallow water-table aquifer. Ground Water 21, 2, 134-142.
Wilson JT, McNabb JF, Wilson BH and Noonan MJ, 1983b. Biotransformation of selected organic pollutants
in ground water. Devel Industr Microbiol 24, 225-233.
Wilson SR, Crutzen PJ, Schuster G, Griffith DWT and Helas G, 1988. Phosgene measurements in the upper
troposphere and lower stratosphere. Nature 334, 689-691.
Wilson SC, Burnett, V, Waterhouse KS and Jones KC, 1994. Volatile organic compounds in digested United
Kingdom sludges. Environ Sci Technol 28, 259-266.
270 ECETOC Joint Assessment of Commodity Chemicals No.39
Windham GC, Shusterman D, Swan SH, Fenster L and Eskenazi B, 1991. Exposure to organic solvents and
adverse pregnancy outcome. American Journal of Industrial Medicine 20, 241-259.
Windholz M, Budavari S, Stroumtsos LY and Fertig MN, 1976. The Merck index, an encyclopedia of
chemicals and drugs, 9th ed. Merck, Rahway, NJ, 1184.
Winer AM, Atkinson R, Arey J, Aschmann SM, Goodman MA and Tuazon, EC, 1987. Lifetimes and fates of
toxic chemicals in California's atmosphere, final report. California Air Resources Board A5-104-32. Statewide
Air Pollution Reseach Center. University of California, Riverside CA.
Wingenter OW, Kubo MK, Blake NJ, Smith TW, Blake DR and Rowland FS, 1996. Hydrocarbon and
halocarbon measurements as photochemical and dynamical indicators of atmospheric hydroxyl, atomic
chlorine, and vertical mixing obtained during Lagrangian flights. J Geophys Res 101, 4331-4340.
Winneke G, Böttger A, Ewers U and Wiegand H, 1989. Neuropsychologische und neurophysiologische
Auffälligkeiten nach Belastung mit leichtflüchtigen Organohalogenverbindungen. VDI Berichte 745, 771-786.
Withey RJ and Hall JW, 1975. The joint toxic action of perchloroethylene with benzene in rats. Toxicology
4, 5-15.
Wittsiepe J, 1990. Occurrence of vinyl chloride and other halogenated C1- and C2-hydrocarbons in German
surface water. In: Hutzinger O and Fiedler H (eds), Dioxin '90, EPRI PCB-Seminar, vol.2, organohalogen
compounds. Eco-Informa, Bayreuth [poster].
WMO (World Meteorological Organization), 1994. Scientific assessment of ozone depletion 1994. Global
Ozone Research and Monitoring Project, report 37. WMO, Geneva, 12.2, 13.8.
Wofsy SC, Fan S-M, Blake SR, Bradshaw JD, Sandholm ST, Singh HB, Sachse GW and Harriss RC, 1994.
Factors influencing atmospheric composition over subarctic North America during summer. J Geophys Res
99, 1887-1897.
Wolf MA, 1956. Results of skin absorption studies on carbon tetrachloride, ethylene dichloride,
terachloroethylene, trichloroethylene, chloroethene. R&D report, Dow Chemical, Midland MI.
Wolff DL, 1987. Behavioural toxicology: the relative sensitivity of a functional test in relation to the LD-50.
Zool Jahrb Abt Allg Zool Physiol Tiere 91, 79-87.
Worthing CR and Walker SB, 1987. TCA. In: Worthing CR and Balker BS, the pesticide manual, 8th ed.
British Crop Protection Council, Thornton Heath, 765-766.
Yokouchi Y, Barrie LA, Toom D. and Akimoto H, 1996. The seasonal variation of selected natural and
anthropogenic halocarbons in the Arctic troposphere. Atmos Environ 30, 1723-1727.
Yoshioka Y, Ose Y and Sato T, 1986. Correlation of the five test methods to assess chemical toxicity and
relation to physical properties. Ecotoxicol Environ Safety 12, 15-21.
Yu MC, Garabrant DH, Peters JM and Mack TM, 1988. Tobacco, alcohol, diet, occupation, and carcinoma of
the esophagus. Cancer Res 48, 3843-3848.

Tetrachloroethylene 271
Yung YL, McElroy MB and Wofsy SC, 1975. Atmospheric halocarbons: a discussion with emphasis on
chloroform. Geophys Res Letters 2, 397-399.
Zielhuis GA, Gijsen R and Van der Gulden JWJ, 1989a. Het optreden van menstruatiestoornissen in relatie
to blootstelling aan perchloorethyleen [Menstrual disorders related to perchloroethylene exposure]. T Soc
Gezondheidsz 67, 285-290.
Zielhuis GA, Gijsen R, Joost WJ and Van der Gulden JWJ, 1989b. Menstrual disorders among dry-cleaning
workers (letter). Scand J Work Environ Health 15, 238.
Ziglio G, 1981. Human exposure to environmental trichloroethylene and tetrachloroethylene: preliminary data
on populatiob groups of Milan, Italy. Bull Environm Contam Toxicol 26, 131-136.
Ziglio G, Beltramelli G, Pregliasco F and Ferrari G, 1985. Metabolites of chlorinated solvents in blood and
urine of subjects exposed at environmental level. Sci Total Environ 47, 473-477.
Zimmerli B, Zimmermann H and Müller F, 1982. Perchlorethylen in Lebensmitteln. Mitt Gebiete Lebensm
Hyg 73, 71-81.
Zoccolillo L and Rellori M, 1994. Halocarbons in antacrtic surface waters. Intern J Anal Chem 55, 27-32.
Zoeteman BCJ, Harmsen K, Linders JBHJ, Morra CFH and Slooff W, 1980. Persistent organic pollutants in
river water and groundwater of the Netherlands. Chemosphere 9, 231-249.
Zytner R, Biswas N and Bewtra JK, 1989a. Adsorption and desorption of perchloroethylene in soils, peat
moss, and granular activated carbon. Canadian Journal of Civil Engineering 16, 798-806.
Zytner RG, Biswas N and Bewtra JK, 1989b. PCE volatilised from stagnant water and soil. J Environmental
Engineering 115, 1199-1212.

272 ECETOC Joint Assessment of Commodity Chemicals No.39
MEMBERS OF THE TASK FORCE
D. Farrar (Chairman) ICI ChlorchemicalsUK - Runcorn
C. De Rooij SolvayB - Brussels
D.l. Eisenbrandta Dow EuropeCH - Horgen
J. Franklin SolvayB - Brussels
V. Garny Solvayb
B - Brussels
T. Green AstraZenecaUK - Macclesfield
J.J. Kolka Katholieke Universiteit NijmegenNL - Nijmegen
H. Lagasta SolvayB - Brussels
R. Millischer Elf-AtochemF - Paris
J.A. Tomensona ICIUK - Northwich
H. Wieganda Degussa-HülsD - Marl
J.W. Wilmer Dow EuropeCH - Horgen
H. Vrijhof (Secretary) ECETOCB - Brussels
a Part-timeb Presently with Eurochlor, B-Brussels

Tetrachloroethylene 273
MEMBERS OF THE SCIENTIFIC COMMITTEE
(Peer Review Committee)
W. Tordoir (Chairman), Group Adviser, Shell InternationalEnvironmental Health and Human Toxicology NL - Den Haag
H. Verschuurena (Vice-Chairman), Head, Dow EuropeToxicology Department CH - Horgen
O. Bøckman, Scientific Adviser Norsk HydroN - Porgrunn
N. Carmichael, Toxicology Director Worldwide Rhône-PoulencF - Lyon
C. d’Hondt, Head, Novartis Crop PortectionEnvironmental Safety Department CH - Basel
B. Hildebrand, Director, BASFExperimental Toxicology D - Ludwigshafen
J. Jackson, Senior Associate, MonsantoMedical Adviser B - Louvain-La-Neuve
E. Löser, Head, BayerInstitute of Industrial Toxicology D - Wuppertal
R. Millischer, Head, Elf AtochemIndustrial Toxicology Department F - Paris La Défense
I. Purchaseab, Director, ZenecaCentral Toxicology Laboratory UK - Maclesfield
G. Randall, Director, ZenecaEnvironmental Laboratory UK - Brixham
A. Sarrif, Associate Director, DuPontToxicology Affairs D - Bad Homburg
J. Solbéa, UnileverHead of SEAC Environment UK - Wirral
H-J. Wiegand, Degussa-HülsHead Product Safety Department D - Marl
a Stewards responsible for primary peer reviewb Honorary Chairman

Responsible Editor: FM Carpanini, ECETOCAv E Van Nieuwenhuyse 4 (Bte 6)
B-1160 Brussels, BelgiumD-1999-30001-155