Embed Size (px)
Citation preview

Ebook Choices at the University of Texas at
Austin:
Our Experience with Vendors, Librarians,
Technical Support Staff and Users
National Swedish Ebooks Conference
12 December, 2002
Lindsey Schell

En liten glimpt av University of Texas Largest university in the States: 52,000 students 20,000 faculty
/staff
Ranked 5th in the US, the “General Libraries” is composed of 17 campus branches and 8 million volumes.
UT Austin is the flagship of 15 universities in a state-wide system. These schools comprise the UT System library consortium.
We also belong to TexShare, a consortium of university, secondary school and public libraries, led by the Texas State Library and to AMIGOS, the OCLC western region consortium.

UT Ebook glimt
Current contracts include netLibrary, Safari, History Ebooks
Current netLibrary purchases made through UT system, TexShare and AMIGOS
Currently have access to 50,000 netLibrary titles with 10,000 being duplicate copies.

Ebook begynnelsestadium
Summer 1999 Sought web based,
academic content No investment in hand-held
readers or special software 500 netLibrary titles posted
as a list and linked on General Libraries homepage
No promotion or marketing, no integration into library services

Kärlek vid första ögonkastet?
Extremely high usage statistics after first 6 months.
Feedback from users was enthusiastic and expressed comfort with Ebooks as a natural progression from Ejournals and electronic databases.
Positive response inspired experimentation with other Ebook companies: Ebrary, Safari, IT Knowledge and Books24x7

Början Ebook paradigm
Format: HTML, PDF, LIT Delivery: web, hand-held
readers, download, print-on-demand
Market audience: libraries, education, corporate, individual consumer
Business Model: one time fee vs. subscription, institution vs. individual consumer
Control: digital rights management, access vs. copyright

Aktuell UT strategi och praxis
Seamless delivery to academic workstations: – Web based content, no partial
books or limited content– No proprietary software or
hardware– Behind-the-scenes payment for
viewing and printing– Permanent access by one-time
purchase and maintenance fees with escrow agreement providing content on CD-ROM in the event vendor ceases business
– Vendor must have critical mass of titles, no revolving content and no subscription fees**
– MARC records for catalog integration

…Strategi och praxis… netLibrary Selection and acquisition
– TexShare and AMIGOS selection by committee
– UT system selection is title-by-title
• Past: Excel spreadsheets • Present: TitleDirect
http://www.netlibrary.com/titledirect
• Future: approval plan
• 30 UT subject bibliographers, volunteer selectors
• No administrative guidelines• Model provides widespread
knowledge/investment of Ebook collection among professional staff
• Librarians know user needs better than vendor staff

Aktuell UT kontrakt
netLibraryCosts of book + either one time access
fee or smaller ongoing annual access fee.
SafariAnnual subscription. Library regulates
cost by simultaneous users and number of books selected.
History EbooksAnnual subscription based on sliding
scale according to university size.

Användare statistiker
What are we measuring?
Use
Cost
In comparison to what?
Printed Books
E-Journals
Other E-books
Annual cost-per-use formula:
annual expenditures / annual circulation = cost-per-use
or
total collection cost / circulation over time = cost-per-use

Printed books
UT-Austin one year cost-per-use of new books
Cost = $1.8 millionTitles = 56,000Circulation = 63,000Cost per use = $28.57
In succeeding years, the overall cost-per-use of these titles decreases because the books are purchased, not subscribed to.

Printed books
UT-Austin cost per use of all books over 100 years
Titles = 7,935,540Circulation = 2,240,275Insured value (cost)=
$727,568,073Total cost per annual use = $324
…but the books have been used for between 1 and 100 years, so divide by 50 = very roughly $6.48 per use

Printed books
Statistics don’t tell us everything:
Just because a book is checked out doesn’t mean its ever going to be read.
Books are often used in libraries without being checked out.
...Nevertheless, this is the data we have.

Books have to be read…
It is the only way of discovering what they contain.
A few savage tribes eat them, ...but reading is the only method of assimilation revealed to the West.
- E. M. Forster

E-Journals
UT-Austin use of Elsevier Science Direct:
125,000 articles per year.
1200 titles
104 articles used per title, each title averages 5 volumes, so use averages 20 articles per volume per year.
Annual cost = $1.2 million,
Cost per use = $10

E-Books• Cataloging increases usage (3
months after cataloging, usage doubled when compared to 3 months prior to cataloging).
• Cataloging changes usage, broadening usage to a full range of subjects
•Highly-used printed books are highly-used e-books.
• Subject usage of a single collection (Amigos) varies by library type
• The life cycle cost of a printed book is 7 times its purchase price
Sources:Dennis Dillon. E-books: The University of Texas
Experience. Library Hi-Tech. Vol 19 #2, Vol 19 #4, 2001.
Lawrence, Connaway, Brigham. Life Cycle Costs of Library Collections. College and Research Libraries. Nov. 2001.

G. K Chesterton was once asked what books he would most like to have with him if he were stranded on a desert island,
Thomas’s Guide to Practical Shipbuilding, he replied.

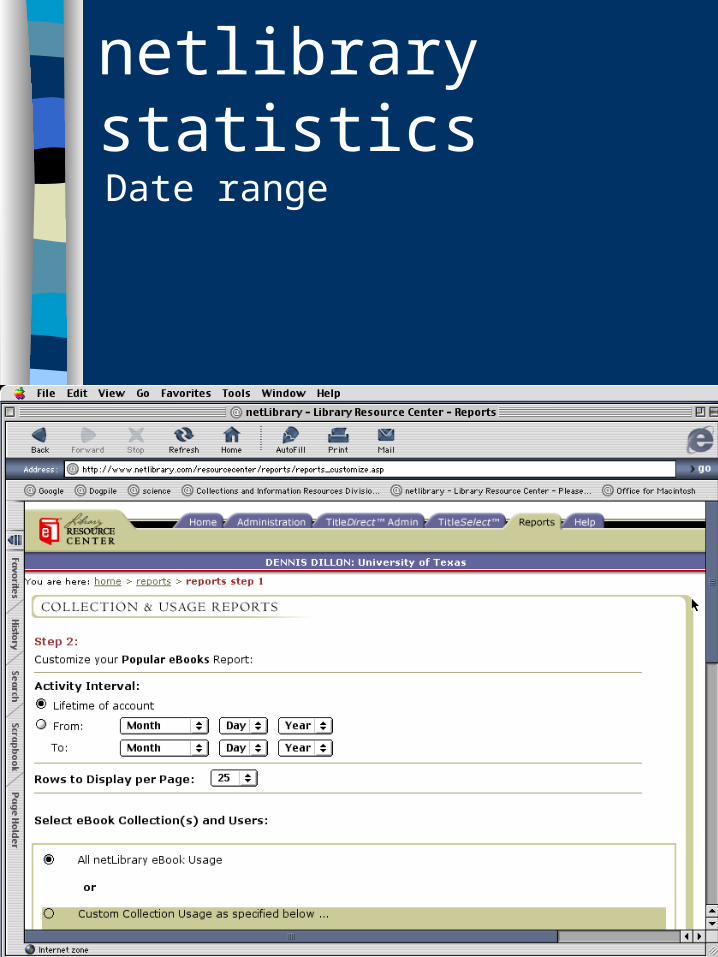
netlibrary statistics
What can you find out using the administration module?
Between any two dates:Use by titleUse by subjectTurnaways
Or download the above info into a spreadsheet and:sort by LC Call Number, sort by Publisher, etc.

netlibrary statistics
Statistics don’t tell us everything:
Just because an Ebook has been opened, that doesn’t mean it’s been read.
...nevertheless these are the numbers to which we have access.

netlibrary statistics
Usage Reports
netlibrary statistics
Date range

netlibrary statistics
Collections & members

netlibrary statisticsPopular books 1

netlibrary statisticsPopular books 2

I never read a book before reviewing it
… it prejudices a man so.
--Sydney Smith

netlibrary statistics
Snapshot of UT Collections:
UT volumes = 10,918
Use = 14,979
Use per volume = 1.37
But since many volumes are new…
Use over last 30 days = 1,262
x12/volumes (recent use per volume annualized) = 1.38
UT Costs = $570,000
Cost per use =$38
Cost per use over ten years = $3.78
(if recent use patterns continue)

netlibrary statistics
Snapshot of Amigos I Collection:Volumes = 10,912Use by UT = 21,273Use per volume = 1.95
But since many volumes are new…Use over last 30 days = 614x12/volumes (recent use per volume
annualized) = .66
UT Costs = $20,000Cost per use = $0.94Cost per use over ten years = $0.27(if recent use patterns continue)

netlibrary statistics
Snapshot of Amigos II Collection:
Volumes = 8,836
Use = 2,170
Use per volume = .25
But since many volumes are new…
Use over last 30 days = 358
x12/volumes (recent use per volume annualized) = .49
UT Costs = $25,000
Cost per use = $11.52
Cost per use over ten years = $0.58
(if recent use patterns continue)

netlibrary statistics
Snapshot of TSLAC Collection:
Volumes = 18,258
Use at UT= 4,425
Use per volume = .24
But since many volumes are new…
Use over last 30 days = 645
x12/volumes (recent use per volume annualized) = .42
UT Costs = $0
UT Cost per Use = $0

netlibrary statistics
Snapshot of TSLAC Collection:
Volumes = 18,258
Total Use = 120,576
Use per volume = 6.6
But since many volumes are new…
Use over last 30 days = 14,301
x12/volumes (recent use per volume annualized) = 9.4
TSLAC Cost (estimate) = $1.4 million
TSLAC Cost per use = $11
TSLAC Cost per use over 10 years = $0.81
(if recent use patterns continue)

netlibrary statistics
Conclusion:
•Use by the same audience (UT) varies according to which titles are in which collection.
•Cost per use over ten years is low when compared to printed books or e-journals.(Since the continuing subscription costs are low or non-existent -- and e-books don’t require buildings, heating/cooling, reshelving, binding, etc.)
•If Ebooks are jointly purchased by multiple libraries and access is shared, then costs are lower than if one library purchased the books alone.

“It took me fifteen years to discover I had no talent for writing
… but I couldn’t give it up because by that time I was too famous.
-- Robert Benchley

netlibrary statistics
Lifetime turnaways

netlibrary statisticsTurnaways - last two weeks

netlibrary statistics
Turnaways - UT’s observations
• Most of our turnaways occurred when a computer title was repeatedly accessed on one day. (We suspect an IT staff member wrote a perl script to hit the book until it was free)
• Or when a book was assigned in a class.
• Turnaways for any title occur over a very short time span. Few titles have turnaways in more than a single week.
• We’ve rarely purchased additional copies and complaints have been few.

When I am dead
I hope it may be said
“His sins were scarlet,
But his books were read.”
-Hillaire Belloc

netlibrary statistics
UT top-ranked subject usage:UT System Collection 1.Computer Science2.Economics and Business3.Medicine, Health, Wellness4.American History5.Technology and Engineering6.Literature7.Sociology8.Education9.Library Science10.Psychology11.Religion12.Mathematics

netLibrary statistics
UT bottom-ranked subject usage:
UT System Collection
51.Naval Science
50.Astronomy
49.Biography
48.Arts & Crafts
47.Military Science
46.Gay/Lesbian
45.Archaeology
44.Geology
43.Zoology
42.Cooking, Nutrition
41.Geography
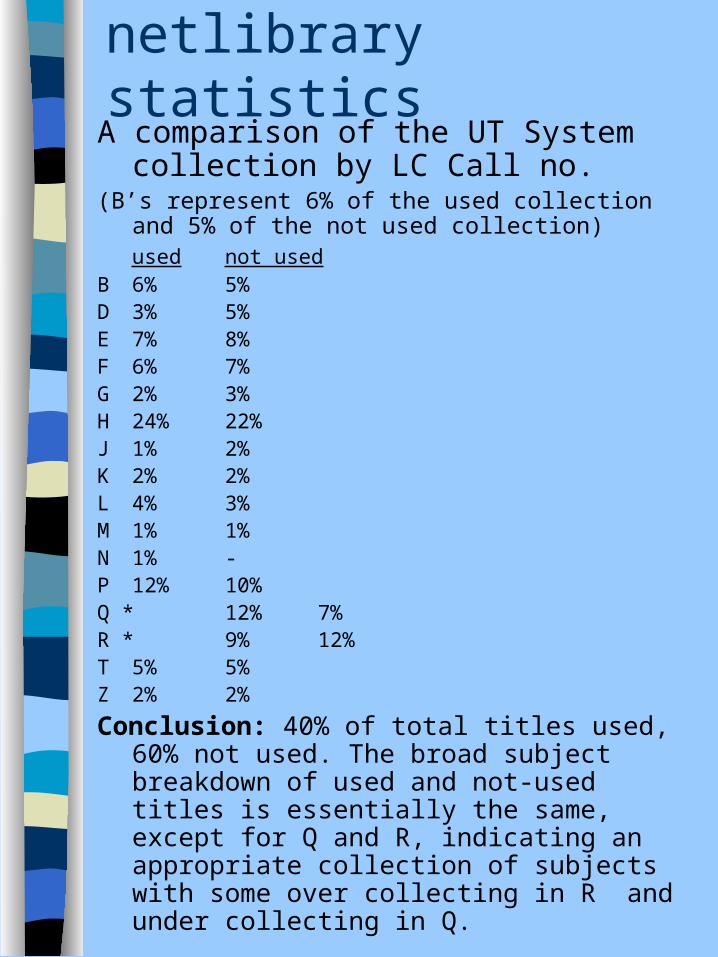
netlibrary statisticsA comparison of the UT System
collection by LC Call no. (B’s represent 6% of the used collection and 5% of the
not used collection)used not used
B 6% 5%D 3% 5%E 7% 8%F 6% 7%G 2% 3%H 24% 22%J 1% 2%K 2% 2%L 4% 3%M 1% 1%N 1% -P 12% 10%Q * 12% 7%R * 9% 12%T 5% 5%Z 2% 2%
Conclusion: 40% of total titles used, 60% not used. The broad subject breakdown of used and not-used titles is essentially the same, except for Q and R, indicating an appropriate collection of subjects with some over collecting in R and under collecting in Q.

netlibrary statisticsUT Collection - publishers(9.2% of the not used books were National Academy
Press, 5.9% of the used books were National Academy Press.)
not used usedTexas - 1%Harvard Business - 1.1% O’Reilly - 2.1% SAMS - 1.7%CLIO press 1.1% 1.1%Routledge 1.1% -Scarecrow 1.2% -MIT 1.2% 5.2%New Mexico 1.5% 1.3%Southern Illinois 1.5% 1.8%McGraw-Hill 1.5% 2.1%Indiana 1.6% 2.2%Erlbaum 1.7% 3%Oxford Univ Press 2% 1.9%Texas A&M 2.3% 1.3%State Univ of NY 4.3% 4%Univ of California 6.9% 6.5%Oklahoma 7% 4.5%National Academy Press 9.2% 5.9%
Conclusion -Different publishers, different rates of use. If these use rates hold, we are likely to increasingly tailor our collection by publisher

A classic –
something that everybody wants to have read and nobody wants to read.
-- Mark Twain

netlibrary statistics
UT System Collection average per volume use by publication year.
1950 2 1983 3.71953 1 1984 3.91954 3 1985 3.61955 1 1986 2.61957 3 1987 2.21958 1 1988 3.81959 1 1989 2.61960 1 1990 2.91961 1.5 1991 31963 12 1992 3.11964 1 1993 2.71965 2 1994 2.91966 1 1995 3.41968 3 1996 3.11969 3 1997 41970 4 1998 4.21971 1.3 1999 4.31972 1.5 2000 4.31973 1.21974 11975 2.31976 31977 2.21978 3.81979 2.61980 31981 5.11982 2.4
Conclusion: the year of publication has made only a slight difference in use. Other factors, such as subject and publisher seem to be more relevant to use.

What about session length?
UT’s year-long experience with the now defunct IT Knowledge (2,000 computer titles) revealed that a user’s average session duration was ten minutes.
Users were finding what they needed
quickly (probably via keyword) and exiting.
From discussions with users we believe that most were locating and printing relevant pages or chapters, and then logging off

Outside of a dog, a book is a man’s best friend.
Inside of a dog, it’s too dark to read.
-Groucho Marx

Ten year cost-per-use (UT)
Printed books$6.48 - $28.57
E-Journals$10
E-books$.58 - $3.78
*E-Journal cost-per-use based on Elsevier Science Direct.
*Full life cycle cost of printed books are 7 times their purchase price

Ten year cost-per-title (UT)
netLibrary
Avg. cost per titles (with permanent access) = $80
1st year costs = $80
Cost after ten years = $80
1 user, free printing
Safari
Avg cost per title (UT - 3 users) = $52
1st year costs = $52
Cost after ten years = $520
? Users, free printing

netlibrary statistics
How has UT reacted to these stats?
• encouraged us to continue purchases
• encouraged us to catalog
• affected our publisher selections
• continue to ignore publication date on purchases
cont…

netlibrary statistics
How has UT reacted to these stats?
• encouraged our librarians to speak well of e-books
• seldom purchased added copies
• raises questions about the effectiveness of our current program of printed book purchasing - though we have not made any changes to print purchases yet

Assessing e-books (UT)
Vendor statistics - √Cost-benefit analysis - √Anecdotal data - √Faculty/student purchase
requests - √E-reserves - √User studies - 0
Still neededStatistics on length of session
use.Continuing discussion with users
about e-booksMore time -- too early to judge

netlibrary statistics
What does it all mean?
Ebooks are a valid expenditure of funds,
…but knowing what the stats don’t tell us, it is still too early to draw any far-reaching conclusions about e-book use or effectiveness.

“A good book holds you down.
It’s an anchor that keeps you from getting up and having another gin and tonic”
-- Roy Blount