Embed Size (px)
Citation preview

EBA REPORT ON THE DYNAMICS AND DRIVERS OF NON‐PERFORMING EXPOSURES IN THE EU BANKING SECTOR
22 July 2016

EBA REPORT ON THE DYNAMICS AND DRIVERS OF NON‐PERFORMING EXPOSURES IN THE EU BANKING SECTOR
2
Table of Contents
Table of Contents .................................................................................................................................. 2
List of Figures and Tables ...................................................................................................................... 3
List of abbreviations .................................................................................................................................. 5
Executive Summary ................................................................................................................................... 7
Introduction ............................................................................................................................................ 10
Quantitative Findings related to NPL across countries ........................................................................... 11
The sample and the data ................................................................................................................. 11
The aggregate picture: Banks’ NPL across countries .......................................................................... 11
Overview over NPL and FBL ............................................................................................................ 11
Spread between NPL and default ratios ......................................................................................... 12
Forborne exposures and non‐performing forborne exposures ...................................................... 15
Coverage ratios ............................................................................................................................... 16
Correlation between NPL, FBL, Coverage ratios ............................................................................. 17
Quantitative findings related to NPL across countries – geographical breakdown by residence of
counterparty. ...................................................................................................................................... 19
The framework ................................................................................................................................ 19
Geographical dispersion of EU banks’ business .............................................................................. 20
EU banks’ business in the EU and abroad ....................................................................................... 21
NPL dispersion between regions ..................................................................................................... 22
NPL Matrix across Europe ............................................................................................................... 24
FBL dispersion between regions ..................................................................................................... 27
Qualitative findings from survey on NPL across EU countries ................................................................ 28
NPL adoption ................................................................................................................................... 29
Rules for risk taking, default and impairment ................................................................................. 31
Legal foundations affecting sufficient provisioning and resolving of NPE ...................................... 32
Collateral valuation ......................................................................................................................... 38
Alternative ways of getting bad loans off the balance sheet .......................................................... 40
Policy implications and way forward ...................................................................................................... 42
Appendix ................................................................................................................................................. 45

EBA REPORT ON THE DYNAMICS AND DRIVERS OF NON‐PERFORMING EXPOSURES IN THE EU BANKING SECTOR
3
List of Figures and Tables
Figure 1: Non‐performing loans and forborne loans for total On‐balance loans and advances per
country of origin of the bank (March 2016) ............................................................................................ 12
Figure 2: Change of Spread between Defaulted Ratio and NPL ratio since implementation of the
EBA ITS for total loans and advances per country of origin of the bank ................................................. 13
Figure 3: Weighted average breakdowns of the forborne loan category into non‐performing and
performing FBL per bank’s home country – Total L&A. .......................................................................... 15
Figure 4: Weighted non‐performing FBL % of total loans and advances and range per bank’s home
country and across countries since Sept. 2014 ....................................................................................... 16
Figure 5: Change of coverage ratio for total loans and advances per bank’s home country since
Sept. 2014 ............................................................................................................................................... 17
Figure 6: Correlation Coefficient of NPL and Coverage ratio, NPL and FBL, NPL and NP‐FBL for EU
countries .................................................................................................................................................. 18
Figure 7: Weighted domestic exposures for total loans and advances and number of significant
foreign exposures per country. ............................................................................................................... 20
Figure 8: Weighted exposures for total loans and advances to EU Countries plus NO and to non‐EU
countries. ................................................................................................................................................. 22
Figure 9: Weighted NPL ratio for total loans and advances in different regions of EU banks’
business activity. ..................................................................................................................................... 23
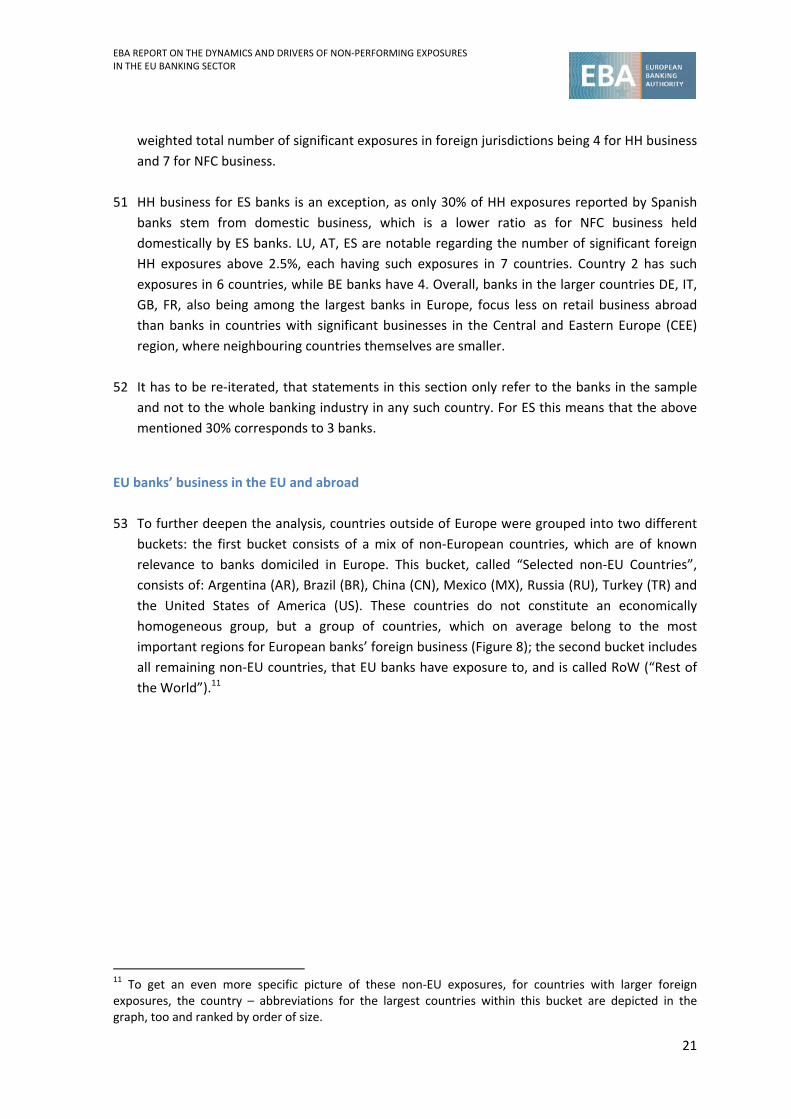
Figure 10: Weighted FBL ratio for total loans and advances in different regions of EU banks’
business activity. ..................................................................................................................................... 28
Figure 11: Use on NPL reporting in # of EU countries based on the local accounting standards ........... 30
Figure 12: Importance of impediments to the local legal and judicial system across EU countries. ...... 33
Figure 13: Estimated average duration of corporate insolvency proceedings across EU countries. ...... 35
Figure 14: Coverage ratios in countries with long and short duration of insolvency proceedings......... 36
Figure 15: Transparency of Residential‐ and Commercial Real Estate markets across EU countries. .... 39
Figure 16: EU countries and the possibility to set up bad banks there. ................................................. 41
Figure A 1: Weighted non‐performing FBL % for loans and advances to NFC and range per bank’s
home country and across countries since Sept. 2014 ............................................................................ 45
Figure A 2: Weighted non‐performing FBL % for loans and advances to HH and range per bank’s
home country and across countries since Sept. 2014 ............................................................................ 45
Figure A 3: Change of Coverage Ratio I for loans and advances to NFC per bank’s home country
since Sept. 2014 ...................................................................................................................................... 46
Figure A 4: Change of Coverage Ratio I for loans and advances to HH per bank’s home country
since Sept. 2014 ...................................................................................................................................... 46
Figure A 5: Weighted domestic exposures loans and advances to NFC and number of significant
foreign exposures per country ................................................................................................................ 47

EBA REPORT ON THE DYNAMICS AND DRIVERS OF NON‐PERFORMING EXPOSURES IN THE EU BANKING SECTOR
4
Figure A 6: Weighted domestic exposures loans and advances to HH and number of significant
foreign exposures per country. ............................................................................................................... 47
Figure A 7: Weighted exposures for loans and advances to NFC in EU Countries plus NO and to
non‐EU countries. .................................................................................................................................... 48
Figure A 8: Weighted exposures for loans and advances to HH in EU Countries plus NO and to non‐
EU countries. ........................................................................................................................................... 48
Figure A 9: Weighted NPL ratio for loans and advances to NFC in different regions of EU banks’
business activity ...................................................................................................................................... 49
Figure A 10: Weighted NPL ratio for loans and advances to HH in different regions of EU banks’
business activity ...................................................................................................................................... 49
Figure A 11: Weighted FBL ratio for loans and advances to NFC in different regions of EU banks’
business activity. ..................................................................................................................................... 50
Figure A 12: Weighted FBL ratio for loans and advances to HH in different regions of EU banks’
business activity ...................................................................................................................................... 51
Table 1: Number of banks per country included in analyses .................................................................. 11
Table 2: NPL weighted total loans and advances of EU banks across regions of their business ............ 24
Table 3: NPL per country of domicile in country of risk for total loans and advances across EU
countries .................................................................................................................................................. 25
Table 4: NPL per country of domicile in country of risk for loans and advances to NFC across EU
countries .................................................................................................................................................. 26
Table 5: NPL per country of domicile in country of risk for loans and advances to HH across EU
countries .................................................................................................................................................. 26
Table 6: Distressed asset markets and loan securitization across EU countries ..................................... 41
Table A 1: NPL weighted loans and advances to NFC of EU banks across regions of their business ...... 50
Table A 2: NPL weighted loans and advances to HH of EU banks across regions of their business ....... 50

EBA REPORT ON THE DYNAMICS AND DRIVERS OF NON‐PERFORMING EXPOSURES IN THE EU BANKING SECTOR
5
List of abbreviations
AE United Arab Emirates
AR Argentina
AT Austria
AU Australia
AQR Asset Quality Review
BA Bosnia And Herzegovina
BE Belgium
BCBS Basel Committee on Banking Supervision
BG Bulgaria
BR Brazil
CA Canada
CEE Central and Eastern Europe
CESEE Central, Eastern and South Eastern Europe
CH Switzerland
CN China
CRD IV Capital Requirements Directive
CRE Commercial Real Estate
CRR Capital Requirements Regulation
CY Cyprus
CZ Czech Republic
DE Germany
EBA European Banking Authority
EBRD European Bank for Reconstruction and Development
EE Estonia
ES Spain
FBL Forborne Loans
FI Finland
FINREP Financial Reporting
FR France
GB Great Britain
GR Greece
HH Households
HR Croatia
HU Hungary
IE Ireland
IFRS International Financial Reporting Standards
ILLP Individual Loan Loss Provision
IMF International Monetary Fund
IN India
IT Italy

EBA REPORT ON THE DYNAMICS AND DRIVERS OF NON‐PERFORMING EXPOSURES IN THE EU BANKING SECTOR
6
ITS Implementing Technical Standard
JP Japan
KY Cayman Islands
LLP Loan Loss Provisions
LT Lithuania
LU Luxembourg
LV Latvia
L&A Loans and Advances
MA Morocco
ME Montenegro
MH Marshall Islands
MK The Former Yugoslav Republic of Macedonia
MT Malta
MX Mexico
NCA National Competent Authority
NFC Non‐Financial Corporations
nGAAP National Generally Accepted Accounting Principles
NP Non‐Performing
NPE Non‐Performing Exposures
NPL Non‐Performing Loans
NL Netherlands
NO Norway
PL Poland
PT Portugal
RO Romania
RoW Rest of the World
RRE Residential Real Estate
RS Republic of Serbia
RU Russia
SE Sweden
SG Singapore
SI Slovenia
SK Slovakia
SSM Single Supervisory Mechanism
TR Turkey
UA Ukraine
US United States of America
VG British Virgin Islands
ZA South Africa
EBA REPORT ON THE DYNAMICS AND DRIVERS OF NON‐PERFORMING EXPOSURES IN THE EU BANKING SECTOR
7
Executive Summary
1 Following the recapitalisation of the EU banking sector,1 the process of repair of banks’
balance sheets has continued. As part of this process, in 2013 the EBA issued a
recommendation to Competent Authorities (CA) to run asset quality reviews for their banks,
based on newly harmonised definitions of Non‐performing Loans (NPL). In 2014, CAs carried
out comprehensive reviews of banks’ assets in preparation for the 2014 EU‐wide stress test.
The previous capital strengthening provided the conditions for this cleansing of banks’
balance sheets. These efforts have contributed to the clear identification and some reduction
of NPL ratios in recent quarters. However, the overall level remains high by historical
standards whilst improvements are uneven across countries, particularly in jurisdictions
where the level of NPLs is higher as the result of prolonged recessionary conditions.
2 This report analyses the recent dynamics, cross‐country dispersion and possible drivers of the
non‐performing exposures (NPE) in the EU banking sector. It uses as its basis the harmonised
EBA definitions of non‐performing loans and forbearance (FBL). The report covers a sample of
166 EU banks and the time‐period from September 2014 until March 2016. It should be noted
that, due to a short time series the analysis on the dynamics of NPLs is necessarily limited.
3 The report is structured as follows:
a. The first section analyses supervisory reporting data on forbearance and non‐
performing loans, as well as coverage levels, at the highest level of consolidation and
provides an overview of asset quality across jurisdictions;
b. The second section expands this analysis to focus on the riskiness of the
counterparties in different countries;
c. The third section looks at the structural characteristics of local markets that can affect
credit quality, provisioning policies and recovery of distressed assets. It is based on a
survey carried out across EU national competent authorities and reviews the legal and
regulatory specificities regarding NPLs and the possibility of establishing asset
management companies;
d. The final section briefly reviews how some policy outcomes are being or should be
pursued looking at supervisory, structural and market issues.
4 Looking at the EU as a whole, the weighted average NPL ratio was 5.7% in March 2016, but
with high dispersion across jurisdictions, with the highest NPL ratios primarily for banks from
countries that went through a more significant economic adjustment process. The FBL ratios
show a similar dynamic, indicating a positive and high correlation between NPL and FBL ratio.
1 http://www.eba.europa.eu/risk‐analysis‐and‐data/eu‐capital‐exercise/final‐results

EBA REPORT ON THE DYNAMICS AND DRIVERS OF NON‐PERFORMING EXPOSURES IN THE EU BANKING SECTOR
8
A cross country comparison suggests that the average NPL ratio is up to three times higher in
the EU than in other global jurisdictions.
5 The need for policies to tackle asset quality issues in the EU is compelling, also in light of the
adverse effect of high NPLs on the real economy. NPLs are a problem at multiple levels: at a
micro prudential level, heightened NPLs are associated with lower profitability and lower
efficiency; at a macro level high levels of NPLs are associated with stagnant growth as capital
is tied up with NPLs and not funding new lending into the real economy; finally, for
consumers, proactive engagement on NPLs by banks can help avoid the situation of paying
interest and fees on an asset that they may eventually not own.
6 Looking at the breakdown of NPLs by country of the counterparty, it is possible to better
disentangle the determinants of the dynamics. Indeed, large European banks tend to be
internationally active, with 52% of their loans and advances (L&A) granted to domestic
borrowers, 24% spread across EU, and the rest outside the EU.
7 Data shows that banks operating abroad tend to have lower NPL ratios than their domestic
peers operating in the same markets for exposures towards non‐financial corporations (NFC),
but they show higher NPL ratios for the households (HH) business. Therefore, the economic,
financial and legal conditions in local markets are likely to affect credit quality to a large
extent. Outside the EU, there is at present no common definition of NPL and FBL and this can
affect the findings of this part of the analysis. Significant improvement in this context will be
brought from the BCBS’ work on global definition on NPLs2.
8 The last section of the report looks at the structural characteristics of local markets that can
affect credit quality, provisioning policies and recovery of distressed assets. The analysis
shows that, while the definitions of non‐performing assets and provisioning rules are mostly
aligned, there are significant differences in the legal systems, duration of court proceedings
and tax regimes, which affect banks’ capacity to deal with NPLs.
9 One of the major impediments to a reliable and fast insolvency procedure is the slow process
and significant work‐overload of the judicial system in most countries, especially in those with
high NPL ratios. Indeed, data indicate that the level of provisions is higher in countries where
the duration of legal proceedings is longer. The link between the expected duration of
insolvency proceedings and coverage ratios seems to confirm that provisions strongly depend
on collaterals posted, recovery rates, and the speed of the recovery process. Out of court
restructuring of debt under judicial supervision could be an alternative path for many
insolvent clients. However, at the moment this does not seem to be a frequently used
alternative.
10 The tax treatment can affect banks’ provisioning policies and this, in turn, has an impact on
NPL management. While most European legislators acknowledge the positive incentive of tax‐
2 http://www.bis.org/bcbs/publ/d367.htm

EBA REPORT ON THE DYNAMICS AND DRIVERS OF NON‐PERFORMING EXPOSURES IN THE EU BANKING SECTOR
9
deductibility on building adequate provisions and allow for some sort of deductibility, tax
treatments are not harmonised.
11 Collateral markets across the EU are also different, but without much information available,
especially when it comes to Commercial Real Estate (CRE). This determines low volumes and
high discounts, both characterising an illiquid market in its infancy. Therefore, there is room
for improvement in this field. For instance, the establishment of property price registers and
publicly available property price indices, including CRE, can contribute to better evaluation
and pricing.
12 Overall, banks across the EU are improving their organisational set up to deal with the task of
bad debt resolution. They are faced, however, with limited options to transfer debt into bad
banks3, as this is only legally provided for in 15 of the 28 EU jurisdictions. Also sales on
secondary markets can be problematic and steps should be considered to improve their
functioning, for example increasing transparency and encouraging homogeneity of contracts.
3 A major constraint is often also banks’ level of capital.

EBA REPORT ON THE DYNAMICS AND DRIVERS OF NON‐PERFORMING EXPOSURES IN THE EU BANKING SECTOR
10
Introduction
13 This paper analyses the dynamics on NPLs and FBLs in the EU and aims at identifying possible
drivers of cross‐jurisdictional differences. Data available since the introduction of the EBA ITS
on Forbearance and Non‐Performing Exposures in late 20144 is analysed for a large sample of
EU banks. While, so far, most analyses have focused on data reported by banks at the highest
level of consolidation, this report also looks at the data broken down by country of residence
of the counterparty. Since the largest European banks tend to run their business
internationally, this allows disentangling possible country‐level differences.
14 Trends in credit quality and NPLs are clearly affected by group‐management, but they also
depend on the general economic conditions in the local markets. As a matter of fact, there is
a vast empirical literature that confirms the interaction between the macroeconomic
conditions and asset quality.5 Empirical evidence also suggests that additional factors like
exchange rates may negatively affect asset quality in countries with specific vulnerabilities,
like a high level of FX‐lending. Moreover, a decline of stock prices can negatively affect bank
asset quality. Finally, an increase in lending interest rates tends to increase NPL. What has
been of limited focus in research so far is the extent to which differing business models, as
well as legal and regulatory differences between countries may explain differences in banks’
risk parameters.
15 As countries within the EU are not only different in their economic situation, but also in their
local legislation and in regulatory aspects, it seems warranted to look at the European
environment for banks on a country‐by country basis. This allows having a better
understanding of the large variance of NPL data, not only between countries and between
banks, but also within banking groups in their different geographies and segments of
business.
4 EBA ITS on Forbearance and Non‐Performing Exposures in application of Article 99(4) of Regulation EU No 575/2013, mandatory for FINREP reporting banks within the EU since September 2014, covering loans and debt securities except held for trading, and off‐balance sheet commitments. 5 This has already been shown in numerous papers, like P. P. Athanasoglou, S. N. Brissimis and M. D. Delis: “Bank‐specific, industry specific and macroeconomic determinants of bank profitability”, Journal of International Financial Markets, Institutions and Money, Elsevier, vol. 18(2), pages 121‐136, 2008, or Beck, Jakubik, Piloiu: “Non‐performing loans. What matters in addition to the economic cycle”, ECB Working Paper Series No 1515, 2013.

EBA REPORT ON THE DYNAMICS AND DRIVERS OF NON‐PERFORMING EXPOSURES IN THE EU BANKING SECTOR
11
Quantitative Findings related to NPL across countries
The sample and the data
16 The analyses based on data at the highest level of consolidation (FINREP templates 18 and 19)
cover 166 banking groups6 from all 28 EU countries and Norway.
17 Due to data constraints, the analysis of the “geographical breakdown of assets by residence of
the counterparty” covers 116 banking groups in 26 countries, including Norway. The smaller
universe of reporting banks is due to the fact that the reporting requirement for this data is
subject to a materiality threshold. The number of banks per country reporting each dataset is
shown in the table below7:
Table 1: Number of banks per country included in analyses
18 Unless stated otherwise, all point‐in time data are reported as of March 2016 and are
weighted averages. Time series are based on the seven available quarterly data points
(Q3/2014 until Q1/2016) since the implementation of the EBA ITS on Forbearance and NPE.
The limited number of observations has allowed the EBA to draw some conclusions, some of
which will nevertheless only be confirmed over time as more data become available and the
observations span across longer data series.
The aggregate picture: Banks’ NPL across countries
Overview over NPL and FBL
19 Figure 1 shows NPL and FBL ratios of banks based on their country of domicile, which is per
FINREP definition the highest level of consolidation. These NPL and FBL ratios relate only to
exposures qualifying as loans, and do not include debt securities or off‐balance sheet
6 The sample of banks is reviewed annually accordingly (http://www.eba.europa.eu/documents/10180/16082/EBA+DC+090+%28Decision+on+Reporting+by+Competent+Authorities+to+the+EBA%29.pdf/9beaf5be-2624-4e36-a75b-b77aa3164f3f). This can determine breaks in the time series or additional banks being added from a specific year onwards. 7 As this report does not report bank‐level data and to avoid an indirect reference to specific banks, data for countries with less than three reporting banks are anonymised in the tables and graphs.
# reporting banks per country AT BE BG CY CZ DE DK EE ES FI FR GB GR HR HU IE IT LT LU LV MT NL NO PL PT RO SE SI SK Total
At highest level of consolidation 9 7 3 3 3 16 5 3 14 3 11 11 4 3 4 5 15 3 5 3 3 5 3 3 6 3 6 4 3 166
Reporting country of risk data 7 7 3 2 3 15 2 3 3 3 8 6 4 3 2 5 6 3 4 3 3 5 2 0 5 0 5 4 0 116

EBA REPORT ON THE DYNAMICS AND DRIVERS OF NON‐PERFORMING EXPOSURES IN THE EU BANKING SECTOR
12
exposures. For EU banks, the NPL ratio per March 2016 was 5.7% and the FBL 3.5% on
average8.
Figure 1: Non‐performing loans and forborne loans for total On‐balance loans and advances per country of origin of the bank (March 2016)
20 The EU weighted average NPL is highly disperse across EU countries, with the highest NPL
ratios in financially stressed member states, which were hit the most by the economic crisis
from 2008 onwards. FBL ratios show a similar picture, indicating a positive and high
correlation between NPL and FBL.
Spread between NPL and default ratios
21 The EBA ITS on Forbearance and NPL was built on the definitions of impairment and default
according to IFRS and Regulation (EU) No 575/2013 (CRR). However, the following factors can
explain the difference (spread) between NPL and default ratios:
a. Entry criteria: an NPE is every exposure that it 90 days past‐due or unlikely to pay
without collateral realisation, even if it is not recognised as defaulted or impaired.
b. Pull effect: all exposures to a debtor have to be considered non‐performing when its
on‐balance sheet 90 days past‐due reaches 20% of the outstanding amount of total
on‐balance sheet exposure to that debtor, even if no pull effect is used for default or
impairment classification.
8 The EU figures have been adjusted for avoiding double counting, where a reporting entity in one country is a subsidiary of another reporting entity in the EU.
EBA REPORT ON THE DYNAMICS AND DRIVERS OF NON‐PERFORMING EXPOSURES IN THE EU BANKING SECTOR
13
c. NPE that are forborne cannot exit the NPE classification before one year over which
the debtor has to prove its ability to meet the restructured conditions, even if
forbearance has led to the exit from default or impairment classes.
22 The NPL definition is such that the NPL ratio should not be lower than the default ratio.
Indeed, comparing NPL data to defaulted ratios across EU member states confirms this
expectation. In all countries, the NPL ratio reported by banks is higher than the respective
defaulted ratios.
23 There are some interesting specificities across countries and over time, though:
a. The spread between NPL and defaulted ratios is highly divergent between countries
b. The spread between NPL and defaulted ratios varied over time
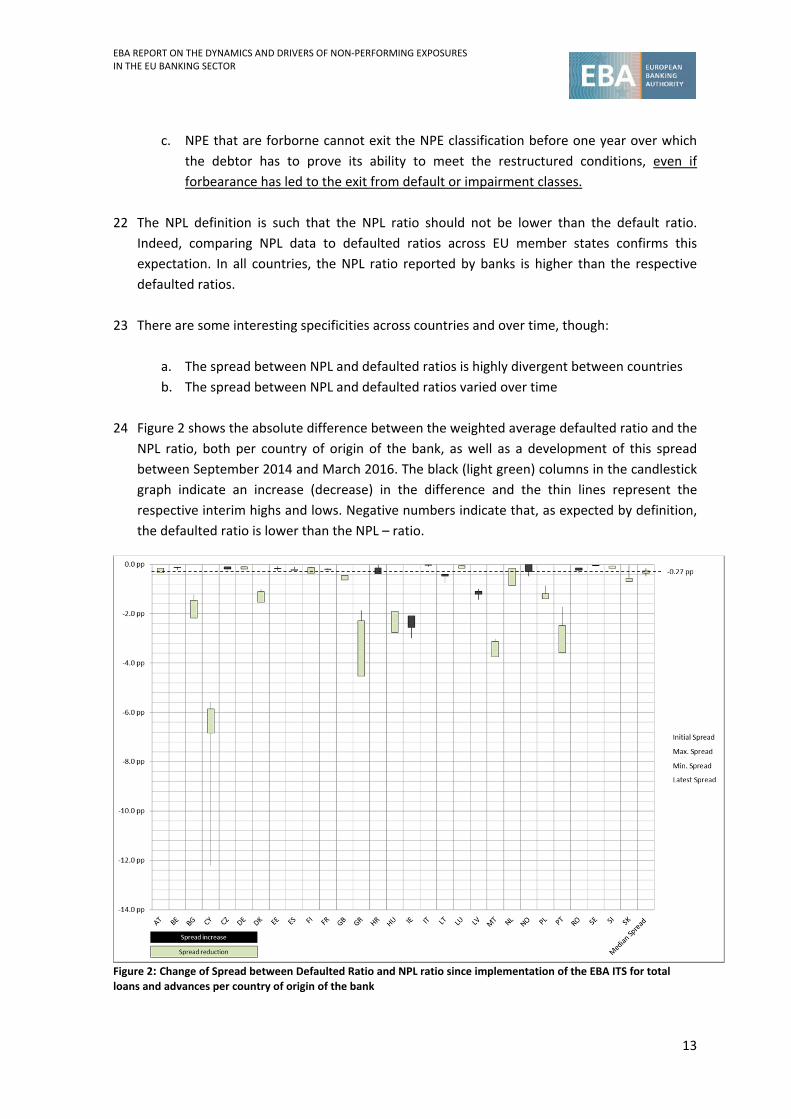
24 Figure 2 shows the absolute difference between the weighted average defaulted ratio and the
NPL ratio, both per country of origin of the bank, as well as a development of this spread
between September 2014 and March 2016. The black (light green) columns in the candlestick
graph indicate an increase (decrease) in the difference and the thin lines represent the
respective interim highs and lows. Negative numbers indicate that, as expected by definition,
the defaulted ratio is lower than the NPL – ratio.
Figure 2: Change of Spread between Defaulted Ratio and NPL ratio since implementation of the EBA ITS for total
loans and advances per country of origin of the bank

EBA REPORT ON THE DYNAMICS AND DRIVERS OF NON‐PERFORMING EXPOSURES IN THE EU BANKING SECTOR
14
25 For example, the delta for Greece (GR) has reduced (light green bar), which means that the
initial delta (lower end of the bar) was about ‐4.5pp, the closing (upper end of the bar) was
about ‐2.3pp. The minimum (the thin line), however, having been even smaller, about ‐1.9pp.
At Hungarian (HU) banks, the spread has widened slightly, oscillating around the minimum
(first data point) and the maximum (last data point) in the interim (thin lines above and below
the bar).
26 Overall the median spread between Defaulted Exposures and NPLs was ‐0.27pp as of March
2016, from ‐0.36pp as of September 2014. In particular:
a. In 21 out of 29 countries, banks report a reduction in the spread;
b. The vast majority of this spread reduction (80%) has taken place within the first two
reporting dates (Q4/2014 and Q1/2015);
c. In the majority of (19 of 29) countries the spread is within a tight range, and then
there are a few countries where the spread has changed significantly.
27 While the current time‐series is too short to come to final conclusions, both factors indicate
some kind of “pull – effect” on default identification in 2014, probably due to a combination
of the 2014 AQR and the EBA ITS on Forbearance and NPL, which lead banks to a
reassessment of their default identification procedures aligning them to NPL. Also, the
application of the more judgmental component of the definition on NPLs (the unlikeliness to
pay) may have increased over time.
28 Banks in a large number of countries (18 out of 29) report a Defaulted‐NPL ratio within a tight
range close to the median close to 0 to ‐0.50%). Banks in the remaining countries (BE, DK, GR,
HU, IE,MT, PL) report a spread of between ‐1% and ‐3.1%, except Cyprus (CY) where the
spread was ‐5.9% as at March 2016.
29 It is worth mentioning that, while the default definition according to Art. 178 CRR had already
been introduced in 2006, there are still various approaches that have been adopted across
institutions and jurisdictions. Currently these variations are in the process of harmonisation
through more detailed guidelines provided by EBA. Thus variability of deltas between NPL‐
and defaulted ratios will most likely stem from different local interpretations of default
definition, like the past‐due criterion, indications of unlikeliness to pay, effects of distressed
restructuring, the specific treatment of default definition for retail clients (e.g., 180 days past
due), and criteria for return to non‐defaulted status.

EBA REPORT ON THE DYNAMICS AND DRIVERS OF NON‐PERFORMING EXPOSURES IN THE EU BANKING SECTOR
15
Forborne exposures and non‐performing forborne exposures
30 The majority of forborne exposures were classified as non‐performing, albeit with significant
divergence across countries (Figure 3).
Figure 3: Weighted average breakdowns of the forborne loan category into non‐performing and performing FBL per
bank’s home country – Total L&A
31 There seems to be a relationship between FBL and NPL. This is observed in countries like
Croatia (HR), Hungary (HU), Romania (RO) and Slovenia (SI) which exhibit high NPL and high
NPL‐FB ratios; or in others such as Finland (FI), Norway (NO) Sweden (SE), which show low
NPL and low NPL‐FB ratios. On the other hand, data for Cyprus (CY), Greece (GR), Ireland (IE),
Spain (ES), Germany (DE), Czech Republic (CZ), and Portugal (PT) indicates a lack of correlation
between these two ratios. These observations on the NPL and FBL ratios for total loans are
also valid for loans to households and loans to non‐financial corporates.
32 Looking at the evolution of these figures since the implementation of the EBA ITS, it emerges
that the dispersion of NP FBL across countries is much more pronounced than the divergence
within a country over time (Figure 4).
EBA REPORT ON THE DYNAMICS AND DRIVERS OF NON‐PERFORMING EXPOSURES IN THE EU BANKING SECTOR
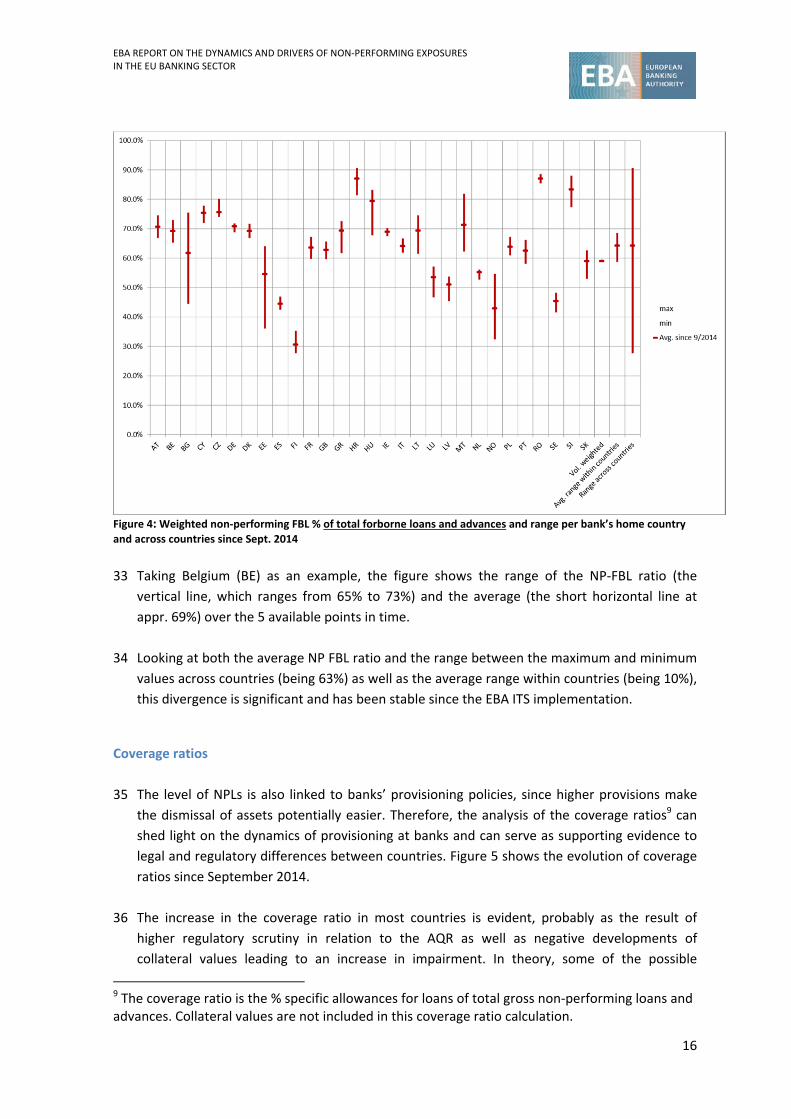
16
Figure 4: Weighted non‐performing FBL % of total forborne loans and advances and range per bank’s home country
and across countries since Sept. 2014
33 Taking Belgium (BE) as an example, the figure shows the range of the NP‐FBL ratio (the
vertical line, which ranges from 65% to 73%) and the average (the short horizontal line at
appr. 69%) over the 5 available points in time.
34 Looking at both the average NP FBL ratio and the range between the maximum and minimum
values across countries (being 63%) as well as the average range within countries (being 10%),
this divergence is significant and has been stable since the EBA ITS implementation.
Coverage ratios
35 The level of NPLs is also linked to banks’ provisioning policies, since higher provisions make
the dismissal of assets potentially easier. Therefore, the analysis of the coverage ratios9 can
shed light on the dynamics of provisioning at banks and can serve as supporting evidence to
legal and regulatory differences between countries. Figure 5 shows the evolution of coverage
ratios since September 2014.
36 The increase in the coverage ratio in most countries is evident, probably as the result of
higher regulatory scrutiny in relation to the AQR as well as negative developments of
collateral values leading to an increase in impairment. In theory, some of the possible
9 The coverage ratio is the % specific allowances for loans of total gross non‐performing loans and advances. Collateral values are not included in this coverage ratio calculation.

EBA REPORT ON THE DYNAMICS AND DRIVERS OF NON‐PERFORMING EXPOSURES IN THE EU BANKING SECTOR
17
dependencies between coverage ratio and regulatory/legal factors could indeed exist, but
they are difficult to identify with the available data. Looking at country‐of risk data and
segmenting them further along the lines of collateral type could indeed lead to different
results. Therefore, it would be interesting to analyse coverage ratios and collaterals broken
down by country of the counterparty, but data is not available.
Figure 5: Change of coverage ratio for total loans and advances per bank’s home country since Sept. 2014
Correlation between NPL, FBL, Coverage ratios
37 This subsection tries to disentangle the extent to which the different key risk indicators NPL,
FBL and Coverage ratio are correlated. In particular, the main questions addressed are the
following:
a. Is there a correlation between the NPL ratio and the coverage ratio at banks over
time?
b. Is there a relationship between the NPL ratio and the total level of forborne
exposures?
c. Likewise, is there a similar relationship between the NPL – ratio and the ratio of non‐
performing FBL?

EBA REPORT ON THE DYNAMICS AND DRIVERS OF NON‐PERFORMING EXPOSURES IN THE EU BANKING SECTOR
18
38 The analysis was carried out over the 7 quarters since the implementation of the ITS. Since
the time‐series used for this analysis is rather short to convey a statistically representative
message, the results should be interpreted with caution. In addition, correlation does not
imply a causal relationship between two time series.
39 The correlation between coverage ratio and NPL is low over time with a correlation
coefficient close to 0 (at least since September 2014). This seems to suggest that coverage
ratios are more linked to additional factors, such as recovery rates, collaterals available and,
possibly, the length of the recovery process (see Figure 6).
Figure 6: Correlation Coefficient of NPL and Coverage ratio, NPL and FBL, NPL and NP‐FBL for EU countries
40 The level of forborne exposures in countries, however, correlates highly (correlation
coefficient above 0.9) and stable over time with the level of NPL in the respective countries
for both NFC and HH loans. From a theoretical standpoint this makes a lot of sense, as the
need for modifications of loan contracts with or without default events is expected to
increase at times of higher non – performing exposures.
41 Such correlation could also have been expected between NPL and NP‐FBL. However, the
correlation between the 2 variables is much smaller than the overall correlation between NPL
and FBL. For HH it is almost inexistent, probably due to earlier forbearance measures taken by
banks or due to the more systematic identification in the HH segment. In general, such
conclusions would require additional analyses at the level of country of risk, or even at single
bank level.
EBA REPORT ON THE DYNAMICS AND DRIVERS OF NON‐PERFORMING EXPOSURES IN THE EU BANKING SECTOR
19
Quantitative findings related to NPL across countries – geographical breakdown
by residence of counterparty.
The framework
42 The analysis at the highest level of consolidation is a good starting point for understanding
the evolution of credit quality, but it does not allow to fully identifying country‐level
differences. Especially when it comes to reporting of total NPL per country of bank, significant
exposures abroad can lead to incomplete interpretations about risk as large parts of the risk
reported by banks may come from abroad. This is why the analysis is extended using data
broken down by the country of residence of the counterparties.
43 In fact, banks in the sample are among the largest banks in Europe and most of them run an
international business. Banks with dispersed international business have to adapt to a
significant number of local markets, different legal settings, judicial systems, fiscal rules and
regulatory frameworks, which makes management of NPL more difficult.
44 It is therefore important to get a better understanding of the asset allocation dispersion of EU
banks and the extent to which these banks have exposures domestically (exposures to
counterparties located in the Member State where the institution is located) and
internationally.
45 According to the ITS on supervisory reporting, banks are asked to specifically report exposures
in a “geographical breakdown of assets by residence of the counterparty”.10 In total, the
number of banks reporting these figures and included in the analyses below is 116, from 26
EU countries and Norway. Banks from Poland, Slovakia and Romania do not report non‐
domestic exposures, because of the above mentioned threshold.
46 It needs to be noted that any data below do not fully reflect each country’s banking system,
as only the largest banks per each country, which report FINREP data at “country of risk” level
are included in the analysis. While these banks represent a large share of the total banking
industry, they are not fully representative of smaller banks, which usually have a more local
footprint and a different client‐base than larger banks.
10 Template 20 only has to be reported when the institution exceeds the threshold described in Article 5.1(a)(iv) of the ITS. This is the case, where non‐domestic original exposures in all ‘non‐domestic’ countries in all exposures classes, are equal or higher than 10 % of total domestic and non‐domestic original exposures.

EBA REPORT ON THE DYNAMICS AND DRIVERS OF NON‐PERFORMING EXPOSURES IN THE EU BANKING SECTOR
20
Geographical dispersion of EU banks’ business
47 Figure 7 ranks countries by the proportion of exposure (measured by total L&A), banks hold
domestically. Additionally, the number of foreign countries in which these banks have
significant exposures is depicted. Exposures towards non‐domestic counterparties have been
defined as significant whenever they exceed 1% of the total L&A.
Figure 7: Weighted domestic exposures for total loans and advances and number of significant foreign exposures per
country.
48 Chart above shows that EU banks share of international business is relatively high. While in
average banks from 21 jurisdictions hold the majority of their total L&A domestically, volume
weighted the overall average domestic exposure is only 52%. On average, EU banks have
significant exposures in seven foreign jurisdictions, 3.5 of which being larger than 2.5% of
total exposures. Countries with notably low domestic exposure are Luxemburg (LU: 19%) and
Spain (ES: 31%), followed by Austria (AT: 38%) and the UK, (GB: 45%).
49 While most banks report a higher number of exposures between 1% and 2.5% of total L&A
(notably GB with 9 of a total 13 in that size bucket, DE and LU both 8 out of 11), some
countries seem to build larger exposures to the countries they deal with. AT being the country
with the highest number (9) of larger significant exposures, BE, ES, FR, the Netherlands (NL),
Greece (GR) and Slovenia (SI) showing similar characteristics.
50 Looking at the same analysis for NFC and HH loans separately (graphs are shown in the
appendix), the picture is slightly different. As can be expected, retail business in general is less
international (in total, 68% domestically) than NFC business (in total, 49% domestically), the
EBA REPORT ON THE DYNAMICS AND DRIVERS OF NON‐PERFORMING EXPOSURES IN THE EU BANKING SECTOR
21
weighted total number of significant exposures in foreign jurisdictions being 4 for HH business
and 7 for NFC business.
51 HH business for ES banks is an exception, as only 30% of HH exposures reported by Spanish
banks stem from domestic business, which is a lower ratio as for NFC business held
domestically by ES banks. LU, AT, ES are notable regarding the number of significant foreign
HH exposures above 2.5%, each having such exposures in 7 countries. Country 2 has such
exposures in 6 countries, while BE banks have 4. Overall, banks in the larger countries DE, IT,
GB, FR, also being among the largest banks in Europe, focus less on retail business abroad
than banks in countries with significant businesses in the Central and Eastern Europe (CEE)
region, where neighbouring countries themselves are smaller.
52 It has to be re‐iterated, that statements in this section only refer to the banks in the sample
and not to the whole banking industry in any such country. For ES this means that the above
mentioned 30% corresponds to 3 banks.
EU banks’ business in the EU and abroad
53 To further deepen the analysis, countries outside of Europe were grouped into two different
buckets: the first bucket consists of a mix of non‐European countries, which are of known
relevance to banks domiciled in Europe. This bucket, called “Selected non‐EU Countries”,
consists of: Argentina (AR), Brazil (BR), China (CN), Mexico (MX), Russia (RU), Turkey (TR) and
the United States of America (US). These countries do not constitute an economically
homogeneous group, but a group of countries, which on average belong to the most
important regions for European banks’ foreign business (Figure 8); the second bucket includes
all remaining non‐EU countries, that EU banks have exposure to, and is called RoW (“Rest of
the World”).11
11 To get an even more specific picture of these non‐EU exposures, for countries with larger foreign exposures, the country – abbreviations for the largest countries within this bucket are depicted in the graph, too and ranked by order of size.

EBA REPORT ON THE DYNAMICS AND DRIVERS OF NON‐PERFORMING EXPOSURES IN THE EU BANKING SECTOR
22
Figure 8: Weighted exposures for total loans and advances to EU Countries plus NO and to non‐EU countries
54 In total, about 76% of total L&A held at EU banks business is done within the EU (and NO).
There are some banks, though, which have a significant share of their business in non‐EU
countries, most notably GB (43% of L&A outside of EU), ES (35% outside of EU), DE (22%
outside the EU).
55 GB banks have their largest non‐EU business in Hong Kong (HK), Singapore (SG), South Africa
(ZA), Japan (JP), Canada (CA) and United Arab Emirates (AE). ES banks’ business is mostly
focussed on the US, Mexico (MX), Brazil (BR) and Turkey (TR). Slovenian (SI) banks are
notable, too, having relatively large business in their neighbouring countries Bosnia and
Herzegovina (BA) as well as in Macedonia (MK).12
56 Countries with an above average share of their NFC business outside Europe are ES, GB, NL
and SI. While French banks do not rank among these, they have a very wide range of non EU
countries, which they are significantly exposed to.
NPL dispersion between regions
57 Figure 9 provides the breakdown of NPL ratios (per March 2016) by geographic regions of the
counterparties:13
12 A similar analysis for L&A to NFC and to HH can be found in the appendix. 13 Based on figures reported in FINREP Template 20.4

EBA REPORT ON THE DYNAMICS AND DRIVERS OF NON‐PERFORMING EXPOSURES IN THE EU BANKING SECTOR
23
Figure 9: Weighted NPL ratio for total loans and advances in different regions of EU banks’ business activity
58 For most banks, the NPL ratio varies widely among the regions they operate in. Especially the
difference between “Domestic” and “EU plus NO excluding Domestic” NPL indicates that
banks’ strategic decision about the geographical diversification of their business contributes
significantly to NPL levels.
59 For example, AT banks with a strong strategic focus on CEE countries within and outside the
EU, report much lower NPL ratios domestically than abroad. On the other hand, a number of
countries, such as ES and IT report a higher NPL ratio domestically than for their total
exposures. Apart from that, there is no clear pattern as to the region in which the banks´ L&A
have the lowest or highest NPL ratio.
60 The NPL ratio for “Selected non‐EU Countries” is 2% and it is much lower than the one in the
domestic markets. To better understand the drivers, it is decomposed further in the above
graph. For example, weighted NPL in Turkey (TR) is reported 2.7%, in China (CN) 1.3%, in
Brazil (BR) 4.2%.
61 The drivers of these weighted figures are banks in the largest EU countries (incl. ES, GB and
DE) with significant exposure outside EU. NPL ratios for “Selected non‐EU Countries” for
banks from ES, GB and DE amounted to 2.5%, 1.7% and 2%, respectively.

EBA REPORT ON THE DYNAMICS AND DRIVERS OF NON‐PERFORMING EXPOSURES IN THE EU BANKING SECTOR
24
62 Banks in some countries report very high NPL ratios in “Selected Non‐EU” Countries. Looking
at the underlying data, this is mostly driven by idiosyncratic risk of relatively small and
concentrated positioning there.
63 While the divergence of NPL ratios in the “RoW” ‐ region is less pronounced than in the
“Selected non‐EU Countries”, the weighted NPL ratio (3.2%) is still much lower compared to
the ratio in EU. Again, this ratio is mostly driven by banks in the largest EU countries, most
notably by banks from GB, ES and DE.
64 Table 2 looks at NPL‐weighted exposures by region. This allows the comparison of nominal
exposures to exposures once weighted for the risk they imply, as measures by NPL ratios.14
Table 2: NPL weighted total loans and advances of EU banks across regions of their business
65 The weighted exposure value shown is a measure of risk contribution per each region. Taking
the example of AT, the nominal domestic exposure is 38%, while NPL ratio – adjusted, only
23% of NPL risk stems from Austria. On the other hand, both, ROW and EU excluding
domestic are regions, where Austrian banks have significantly higher risk than the mere split
according to exposures would indicate.
66 While the weighted average shows that the domestic exposure weighted by NPL ratio of
banks (65%) is larger than the simple exposure (52%), this average is distorted by ES and IT,
being large countries with high domestic NPL figures. Thus it is warranted to look at these
figures on a country and bank specific basis. Namely, whenever the divergence between the
exposure percentage and the NPL weighted exposure is high, it makes sense to have a closer
look at country‐ and ultimately at bank specifics, to identify if fundamental or
reporting/technical factors are driving this result.
NPL Matrix across Europe
67 Tables 3 and 4 show the difference (both volume weighted and average) between domestic
banks’ NPL ratios and foreign banks’ NPL ratios in the same country.
14 The NPL‐weighted exposures are computed as exposures times NPL ratio by region.
NPL ‐ weighted exposure
across regions ‐ L&A Total 1 2 3 4 AT BE BG CZ DE EE ES FI FR GB GR HR IE IT LT LU LV MT NL PT SE SI
Vol. w'ted
avg.
Domestic 54% 34% 69% 91% 23% 34% 96% 93% 43% 97% 63% 93% 52% 47% 86% 92% 83% 87% 99% 24% 89% 95% 64% 80% 14% 59% 65%
EU plus NO ex Domestic 28% 34% 29% 5% 54% 55% 1% 4% 36% 1% 17% 7% 34% 16% 9% 0% 15% 10% 0% 57% 6% 5% 23% 9% 79% 16% 22%
Selected Non‐EU Countries 1% 6% 1% 2% 11% 4% 0% 1% 8% 0% 15% 0% 4% 15% 0% 0% 1% 1% 1% 4% 2% 0% 5% 1% 1% 0% 5%
ROW 17% 26% 1% 2% 12% 7% 3% 2% 13% 2% 5% 1% 10% 23% 5% 8% 1% 2% 0% 14% 3% 0% 7% 10% 6% 25% 8%
Nominal Exposure 1 2 3 4 AT BE BG CZ DE EE ES FI FR GB GR HR IE IT LT LU LV MT NL PT SE SI avg.
Domestic 71% 53% 58% 75% 38% 48% 83% 92% 56% 95% 31% 68% 58% 45% 81% 85% 55% 62% 93% 19% 93% 77% 55% 74% 51% 70% 52%
EU plus NO ex Domestic 20% 35% 37% 11% 45% 43% 12% 6% 22% 4% 34% 28% 21% 12% 12% 5% 37% 29% 6% 70% 4% 21% 24% 15% 43% 11% 24%
Selected Non‐EU Countries 3% 5% 1% 2% 12% 6% 1% 1% 12% 0% 27% 1% 10% 19% 0% 0% 5% 5% 0% 3% 1% 1% 11% 1% 2% 0% 12%
ROW 6% 8% 4% 12% 6% 3% 3% 1% 10% 0% 8% 3% 12% 24% 8% 10% 3% 3% 0% 8% 3% 1% 10% 10% 4% 19% 12%

EBA REPORT ON THE DYNAMICS AND DRIVERS OF NON‐PERFORMING EXPOSURES IN THE EU BANKING SECTOR
25
68 To limit outlier‐effects, which might distort averages, in both tables 2 layers of thresholds
were introduced into the calculation. First, only bank exposed to a country with more than 1%
of its total exposures has been included in the calculation. Second, to exclude exposures that
are insignificant in terms of a specific country´s total exposures, a second threshold was
defined such that only banks with exposures exceeding 0.1% of the counterparty country´s
total were considered.15
Table 3: NPL per country of domicile in country of risk for total loans and advances across EU countries
15 This threshold was defined in analogy to the ECB definition of “significant institutions” within the SSM. The total assets of all European banks amount to roughly 30TN EUR. A bank is considered a “Significant Institution” exceeding 30BN EUR in assets, which is 0.1%.
Comparison
Banks from # foreign
countries doing
business
Foreign
banks´exposure in
country
Foreign banks'
weighted average NPL
ratio
Domestic banks'
weighted average NPL
ratio
Domestic banks'
weighted average
"advantage"
1 4 37% 1.1% 1.0% 0.1 pp
2 2 31% 11.7% 10.7% 1.0 pp
3 3 41% 2.5% 4.2% ‐1.7 pp
4 2 13% 73.9% 59.2% 14.7 pp
AT 7 29% 6.3% 4.0% 2.3 pp
BE 4 41% 3.0% 2.6% 0.4 pp
BG 3 46% 20.6% 17.8% 2.8 pp
CZ 3 45% 3.3% 3.0% 0.3 pp
DE 13 31% 1.9% 2.3% ‐0.3 pp
EE 1 46% 2.0% 1.6% 0.4 pp
ES 7 21% 6.9% 9.1% ‐2.2 pp
FI 3 39% 2.2% 2.2% 0.0 pp
FR 11 15% 1.4% 3.2% ‐1.8 pp
GB 14 35% 1.9% 2.4% ‐0.5 pp
HR 4 62% 16.3% 13.8% 2.6 pp
IE 4 45% 12.0% 23.2% ‐11.1 pp
IT 7 27% 11.6% 21.4% ‐9.8 pp
LT 2 50% 5.4% 6.3% ‐0.9 pp
LU 4 57% 2.0% 1.4% 0.7 pp
NL 8 17% 2.5% 3.1% ‐0.6 pp
PT 1 19% 8.0% 20.5% ‐12.5 pp
SE 3 10% 0.9% 0.3% 0.6 pp
SI 1 21% 13.7% 18.1% ‐4.3 pp
Average 4.8 28% 9.2% 10.1% ‐0.9 pp
Counterparty in
Foreign banks NPL

EBA REPORT ON THE DYNAMICS AND DRIVERS OF NON‐PERFORMING EXPOSURES IN THE EU BANKING SECTOR
26
Table 4: NPL per country of domicile in country of risk for loans and advances to NFC across EU countries
Table 5: NPL per country of domicile in country of risk for loans and advances to HH across EU countries
Comparison
Banks from # foreign
countries doing
business
Foreign
banks´exposure in
country
Foreign banks'
weighted average NPL
ratio
Domestic banks'
weighted average NPL
ratio
Domestic banks'
weighted average
"advantage"
1 2 42% 1.5% 1.9% ‐0.3 pp
2 3 67% 13.5% 14.2% ‐0.7 pp
3 3 38% 5.8% 5.5% 0.3 pp
4 3 12% 77.2% 66.9% 10.3 pp
AT 1 23% 6.1% 5.7% 0.4 pp
BE 4 42% 4.6% 4.9% ‐0.3 pp
BG 3 45% 28.8% 21.5% 7.3 pp
CZ 4 51% 5.1% 4.8% 0.3 pp
DE 11 26% 3.4% 5.4% ‐2.0 pp
EE 2 54% 2.6% 2.6% 0.0 pp
ES 8 23% 15.9% 17.8% ‐1.9 pp
FI 2 42% 2.7% 3.3% ‐0.6 pp
FR 8 15% 3.8% 5.0% ‐1.2 pp
GB 11 31% 4.3% 4.0% 0.3 pp
HR 4 65% 30.6% 28.9% 1.7 pp
IE 6 48% 14.3% 33.7% ‐19.4 pp
IT 6 21% 20.2% 33.0% ‐12.8 pp
LT 3 54% 5.8% 7.8% ‐2.0 pp
LU 7 74% 3.6% 2.3% 1.2 pp
LV 1 48% 7.2% 4.6% 2.6 pp
NL 12 26% 5.4% 6.8% ‐1.3 pp
PT 1 15% 15.7% 33.9% ‐18.3 pp
SE 4 12% 1.4% 0.5% 0.9 pp
SI 1 27% 18.2% 32.0% ‐13.8 pp
Average 4.6 29% 12.4% 14.5% ‐2.1 pp
Counterparty in
Foreign banks NPL
Comparison
Banks from # foreign
countries doing
business
Foreign
banks´exposure in
country
Foreign banks'
weighted average NPL
ratio
Domestic banks'
weighted average NPL
ratio
Domestic banks'
weighted average
"advantage"
1 2 32% 0.8% 0.5% 0.2 pp
2 1 25% 18.5% 16.4% 2.1 pp
3 1 31% 2.3% 4.1% ‐1.8 pp
4 1 13% 63.4% 52.5% 10.9 pp
AT 1 19% 4.5% 3.4% 1.1 pp
BE 3 42% 2.8% 1.5% 1.3 pp
BG 3 49% 16.5% 17.5% ‐1.1 pp
CZ 2 37% 3.5% 3.5% 0.1 pp
DE 4 30% 3.6% 1.7% 1.9 pp
EE 1 51% 1.5% 1.5% ‐0.1 pp
ES 4 15% 5.5% 6.4% ‐0.9 pp
FI 2 35% 2.4% 1.8% 0.6 pp
FR 3 2% 3.0% 3.6% ‐0.6 pp
GB 7 25% 2.2% 2.6% ‐0.4 pp
HR 3 60% 12.5% 11.2% 1.4 pp
IE 3 31% 28.7% 19.4% 9.3 pp
IT 5 33% 8.9% 15.1% ‐6.2 pp
LT 2 52% 5.2% 5.6% ‐0.4 pp
LU 1 19% 1.6% 1.8% ‐0.2 pp
NL 1 3% 0.5% 1.5% ‐1.0 pp
PT 1 22% 5.1% 10.3% ‐5.2 pp
SE 2 5% 1.3% 0.3% 1.0 pp
SI 1 18% 8.1% 7.4% 0.7 pp
Average 2.3 20% 8.8% 8.2% 0.6 pp
Counterparty in
Foreign banks NPL

EBA REPORT ON THE DYNAMICS AND DRIVERS OF NON‐PERFORMING EXPOSURES IN THE EU BANKING SECTOR
27
69 The three tables provide NPL ratios for domestic and foreign banks for a given country of the
counterparty. Under the – admittedly strong – assumption that the only determinant on NPLs
is the country of the counterparty, the NPL figures, both, from domestic and foreign banks,
should be relatively similar, as they represent NPL ratios of banks domiciled in different
countries but exposed towards the same counterparty‐country.
70 In total, apart from some notable exceptions, foreign domiciled banks tend to have lower NPL
ratios (on average, NPL ratios 2.1pp lower) than their domestic peers in the NFC segment and
higher NPL ratios than their domestic peers in the HH segment (NPL ratio on average 0.6pp
higher). There can be many reasons behind these differences, such as higher risk‐taking in the
HH segment due to stronger competition, different business types (more consumer finance
rather than mortgage financing) or established links with domestic healthy corporations for
the NFC segment.
71 In the NFC segment such differences will most likely be attributable to
advantageous/detrimental corporate client selection of banks, especially when they are non –
domestic. In the HH segment such a client selection is more difficult and differences in NPL
ratios within one country are harder to explain.
72 Taking retail business in IE as an example; while weighted average HH NPL ratio of domestic
banks is 19.4%, foreign banks report an average 28.7% HH NPL ratio. With the data available,
there is no obvious explanation to such large divergences. Similarly, it seems that foreign
banks have significantly higher NPL ratios in the retail business in DE than German banks.
Some supervisors have indicated that foreign banks might lend to clients from the same home
country, but resident abroad. In case clients use these loans for financing in their home
country, economic weakness there could indirectly affect these clients’ creditworthiness.
73 On the other hand, there are banks, which seem to have much lower NPL ratios in the retail
business than their domestic competitors: for instance, in IT foreign banks report much lower
retail ‐ NPL than the IT banks themselves do. One possible explanation could again be that
foreign banks tend to lend more to foreigners from the bank’s home country, which might be
less affected by the local economy than locals.
74 Overall, it seems as if some level of client selection is also performed in the retail space, even
though the result of such selection is mostly disadvantageous for foreign banks. Drawing
definitive conclusions is difficult lacking more detailed data on banks’ counterparties.
FBL ratio dispersion between regions
75 The same analysis performed for NPL was also carried out for forborne loan ratios (FBL), once
again focussing on the geographical breakdown of assets by residence of the counterparty.
The results for total L&A can be seen in Figure 10.
EBA REPORT ON THE DYNAMICS AND DRIVERS OF NON‐PERFORMING EXPOSURES IN THE EU BANKING SECTOR
28
Figure 10: Weighted FBL ratio for total loans and advances in different regions of EU banks’ business activity
76 In general, FBL‐ratios are less dispersed than NPL‐ratios, both between region and between
banks’ domicile countries. Outliers within countries, notably LT, stem from small relative
allocations and concentrated business in the respective regions.16
Qualitative findings from survey on NPL across EU countries
77 In the last few years, EU supervisors have taken several steps to improve bank balance sheet
stability. In 2013, the EBA issued a recommendation to CAs to run asset quality reviews for
their banks, based on the then incoming EBA harmonised definitions of NPLs. In 2014, EU
authorities and the SSM for the euro area carried out comprehensive reviews of banks’ assets
in preparation for the EU‐wide stress test.
78 In addition, the significant capital strengthening has boosted EU banks’ capital ratios notably,
providing the conditions for the cleansing of banks’ balance sheets. These efforts brought to a
reduction of NPL ratios over the past quarters, but the improvement remain uneven across
countries and slow, particularly in jurisdictions where the level of NPLs is higher.
16 For more details about NFC and HH dispersion of FBL – ratios please refer to the graphs in the appendix. Again, it is notable, that the retail ‐ FBL ratio in the US (12%) is higher than in any other selected non‐EU countries.

EBA REPORT ON THE DYNAMICS AND DRIVERS OF NON‐PERFORMING EXPOSURES IN THE EU BANKING SECTOR
29
79 It is therefore clear that more work needs to be done for understanding the remaining
constraints to a full repair of the EU banking sector. Some of the main factors affecting banks’
asset quality were part of the stock‐take on NPL. These factors include:
a. Parameters to support, enhance and supervise by banking regulators and supervisors:
i. A sufficiently and competently staffed separate organisational unit within
banks, with adequate processes in place to manage bad debt and to make
effective decisions as to the disposal of such debt.
b. Aspects to support and enhance by legislators:
i. A tax system providing adequate incentives to provision for bad debt;
ii. A legal and judicial system supporting a reliable and reasonably fast
insolvency or – alternatively – out of court restructuring procedure.
c. Aspects to support by legislators and regulators alike:
i. A clear legal and regulatory framework for unambiguous and timely
identification of bad debt;
ii. The option to set up dedicated bad bank – structures to manage large
portfolios of bad debt outside of banks’ balance sheets.
d. Further important aspects, which can be supported by legislators and regulators, but
not enforced, are related to an enhanced market efficiency:
i. A transparent collateral market to ensure adequate and marketable collateral
values, used for provisioning calculation and to support the sales process,
once the collateral has been repossessed;
ii. A sufficiently deep international secondary market for loan portfolios and the
ability to securitize such portfolios, to further enhance its marketability.
80 To complement the quantitative analyses a survey was conducted on national regulatory and
legal framework with implications for the level of NPL, including‐definitions, NPL identification
and troubled debt resolution.
NPL adoption
81 Reporting NPL according to the EBA ITS on Forbearance and NPL has been compulsory since
September 2014 for all IFRS and, thus, FINREP‐reporting banks in the EU. The survey
investigated if and to what extent this definition has been also applied beyond mandatory
reporting, e.g on accounting or on regulatory statistics (Figure 11).

EBA REPORT ON THE DYNAMICS AND DRIVERS OF NON‐PERFORMING EXPOSURES IN THE EU BANKING SECTOR
30
Figure 11: Use on NPL reporting in # of EU countries based on the local accounting standards
82 Out of 28 EU countries, 17 countries have local accounting standards, which differ from IFRS
and banks, which report their financial statements according to these local accounting
principles. From these 17 countries, in 10 countries the NPL definition according to the EBA
ITS on forbearance and NPE is mandatory for non‐IFRS banks. In addition, in Hungary IFRS
accounting will become mandatory in 2017, while in Poland FINREP reporting will become
mandatory for all banks in 2018. Latvia (LV) has announced that regulations on supervisory
provisioning will be revised to ensure full compliance with the EBA NPL definition. In addition,
Croatia (HR) will start collecting forbearance and NPE data on individual basis (non‐
consolidated) for all credit institutions starting from June 2016
83 Only in 4 (BE, FR, HR, IE) out of 28 EU countries, there are national definitions of NPL other
than the CRR definition of default and other than the EBA ITS17.
84 In IE, for example, the local NPL definition is largely similar to the EBA ITS. According to the
Irish Central Bank, however, an identification of a loan as being NPL should also lead to a
review related to impairment and default.
85 When connecting these specifications to the quantitative data, this should be reflected in
lower average spreads between NPL and default ratios than in other countries. For BE, FR, HR
this indeed is the case, in LV (latest delta for total L&A ‐1.13%) and in IE (latest delta for total
L&A ‐2.47%), this is not at all the case, even though in IE an identification of a loan as being
NPL should also lead to a review related to impairment and default.
86 Not only has the EBA ITS been used for supervisory reporting, but most NCAs have started to
include NPL data into their research and reporting. Out of 27 respondents, only 2 NCAs
17 In some cases a specific definition apply for exposure classification for accounting purpose (national GAAP); nevertheless, the EBA definition of NPL applies for regulatory reporting purpose even for banks, which reports in national GAAP.

EBA REPORT ON THE DYNAMICS AND DRIVERS OF NON‐PERFORMING EXPOSURES IN THE EU BANKING SECTOR
31
currently do not use EBA ITS data internally. One NCA considers the NPL time series too short
for their research needs, the other NCA mentions initial data quality problems.
Rules for risk taking, default and impairment
87 Through the use of IFRS accounting for largest EU banks, accounting rules across Europe have
been widely harmonized. Impairment identification and provisioning calculation are
performed by banks, checked by auditors and supervised by regulatory authorities. In some
cases, regulators have defined additional rules, adding to or re‐enforcing accounting rules.
88 In general, such specific prudential rules on provisioning are meant to lead to earlier
provisioning. Moreover, through predefined provisioning levels, coverage ratios might be
affected in countries where banks are forced to provision according to predefined ratios.
89 In 7 countries (ES, HR, HU, MT, PL, PT18, RO) there are local provisioning schemes which differ
from or extend IFRS or nGAAP provisioning. These rules are different across countries, not all
of them affect accounting (in RO, only prudential reporting is affected). In any case, these
rules influence provisioning by imposing minimum levels on them.
90 In some countries (ES19 and HU) minimum provisions are prescribed while in other countries,
like PT and PL, more specific provisioning levels are prescribed, depending on risk category
and days past due. In MT, an additional allocation of funds to a “Reserve for General Banking
Risks” is required. In HR, the NCA influences provision‐levels through specific collateral
valuation rules, aiming at an increase in provisions.
91 Furthermore, in 6 countries (BE, DE, FR, HR, HU, LV) there are rules for banks related to FX‐
lending, which have a direct effect on provisioning and NPL identification. In some countries,
FX risk has to be measured and provisioned for separately (LV), or it leads to a Pillar II capital
add‐on (LV, BE and HR). In DE, as an interpretation of the general German provisioning rules,
FX‐risk is treated and booked as country risk instead of being assigned to certain debtors. In
PL the Chancellery of the President is working on a bill on FX mortgages, which would enable
debtors to pay future instalments according to a preferential FX‐rate. The details and the date
of implementation of new law are yet uncertain.
92 The extent to which local provisioning schemes (in ES, HR, HU, MT, PL, PT, RO) affect coverage
ratios is unclear. And no obvious pattern can be identified when looking at the quantitative
analyses, neither in absolute level nor in evolution of the figures. The lack of country of the
counterparty coverage information can be a reason for such seemingly unrelated data.
18 In PT the differences between local and IFRS provisioning schemes ceased to exist in 31 December 2015. 19 The current approach of prescribing a minimum level of provisions has been discontinued. From October 2016 onwards, Bank of Spain expects that credit institutions use their own internal models for the calculation of their provisioning levels. In accordance with the proportionality principle, Bank of Spain provides a methodology for those institutions that are not able to develop their own models.

EBA REPORT ON THE DYNAMICS AND DRIVERS OF NON‐PERFORMING EXPOSURES IN THE EU BANKING SECTOR
32
93 There are two countries (HR and HU), where local legislators have defined specific
preferential conversion rates for FX‐loans, which banks are obliged to use for calculation of
such loan’s present value. This has led to immediate loss realisation at respective banks at the
time of the implementation of these laws. In HU the further extension of the forced
conversion of FX‐loans at a fixed rate towards car loans is planned.
94 The EBA ITS on forbearance does not explicitly prescribe a probation period for NPL, which
may be considered to have ceased being non‐performing, unless there have been forbearance
measures extended to these debtors. In case of forborne non performing exposures, at least
one year must have passed until the exposure may be considered to have ceased being non‐
performing. In 4 countries (FR, HU, IE, LV) this minimum probation period of one year has
been extended to non‐performing loans even without forbearance measures.
Legal foundations affecting sufficient provisioning and resolving of NPLs
95 Major factors for NPL resolution are the legal and the judicial system, within which banks
operate in. The faster banks are able to repossess collateral, the faster insolvency procedures
are carried out. Furthermore, the lower banks process risk, the higher the expected recovery
rate for creditors and ultimately the lower the discount required by potential secondary
market buyers of loan portfolios. A transparent market for collateral assets and standardised
valuation approaches enhances the quality of impairment calculations. All these factors have
been analysed in the survey.
96 CAs have been asked to assess major impediments of the local legal and judicial system in
supporting an efficient corporate NPL workout, if there were any. A “severity value” between
1 and 3 was then to be assigned to each of the mentioned impediments. The number of NCAs
mentioning such impediments, per severity grade, can be seen in Figure 12.

EBA REPORT ON THE DYNAMICS AND DRIVERS OF NON‐PERFORMING EXPOSURES IN THE EU BANKING SECTOR
33
Figure 12: Importance of impediments to the local legal and judicial system across EU countries
97 The major (high and medium importance) impediments mentioned in relation to the legal
system were the following:
a. Low average recovery (PL, HU): due to long duration and high cost of the legal
process;
b. Expensive legal proceeding (HU, PL);
c. Long duration of the proceeding (PL, HU);
d. Complicated legislation, prolonging the process (SI);
e. Tax effects on write‐off of credits only possible, if the credit was overdue for more
than 2 years, fully covered by provisions/impairment, and claimed in a court (PT);20
f. Loss realisation under IAS 39: A main barrier to resolving NPLs is the loss realisation
under IAS 39 and the resulting capital pressure. Banks with large NPL‐portfolios are
constrained in the selling process since it would result in a significant accounting loss.
Banks are thus reluctant to change their policy. The problem will very likely not
improve under the IFRS 9 regime: IFRS 9 requires lower market values as soon as a
bank adopts a selling strategy, so banks are dis‐incentivised from adopting such a
policy;
g. Frequent changes in legal provisions on taxes (RO).
98 Italian NCA did not indicate any major impediments, but mentioned that there have already
been significant changes to the legal system in 2015: before then, the tax treatment of loan
loss provisions (LLPs) was of major concern. In the previous regime, new credit losses were
20 There has been a legal change with regards to the fiscal treatment of write‐offs in May 2016, for which reason the sentence in this point is no longer totally accurate.

EBA REPORT ON THE DYNAMICS AND DRIVERS OF NON‐PERFORMING EXPOSURES IN THE EU BANKING SECTOR
34
indeed deductible in 5 years (in 18 years until 2013). The new regime permits immediate full
deductibility and thereby should increase banks’ incentives to provision in a timely fashion.
99 Impediments to the legal system, which were considered of lower importance in supporting
an efficient corporate NPL workout, were the following:
a. No Securitisation Law (CY): the right to securitise loan portfolios would increase its
marketability;
b. Application by customers to courts for postponement orders which are usually being
granted by the court, result in delays in the conclusion of legal measures (CY);
c. Duration of the insolvency proceeding (LT);
d. Complexity of the insolvency law (LU): consecutive corporate insolvencies cause legal
complexities as well as factors like, inter alia, set‐off clauses, netting, pledges,
securities and property reservation clauses;
e. For retail clients: there is a limit of exemption from the execution of salary to secure a
minimum wage for the debtor (DE).
100 The major (high and medium importance) impediments mentioned in relation to the judicial
system were the following:
a. Long duration of the insolvency proceeding (PL, PT, CY, HR, IT, SI, GR, BE, CZ – Italian
NCA expects an improvement after a new Civil Procedure Code was introduced in
2015) – often due to lack of judges. Since the assignment of a severity value to the
effect of lengthy judicial proceeding is somewhat subjective, NCAs were also asked to
estimate – to the extent possible – the average duration of corporate insolvency
proceedings. The results are summarised in Figure 13;
b. Complexity of the insolvency proceeding (PT);
c. Rules allowing for easy postponement delay in enforcement (GR, LT): There are
several procedural rules offering relatively easy possibilities to the borrower to
dispute actions of the creditor in order to further prolong the process of foreclosure,
to impose stand still orders etc.21
101 Impediments to the judicial system, which were considered of lower importance, in
supporting an efficient corporate NPL workout, were the following:
a. No equivalent of US Chapter 11 – debt restructuring (NO): From time to time there
are discussions regarding the introduction of a form of Chapter 11. But this is not
affected In the due course.
102 Reputational risk – being directly attributable to neither the legal, nor the logistic system ‐
was highlighted as another impediment in supporting an efficient NPL workout in AT: In
21 In GR, some changes have improved the situation lately: secured creditors have priority over 2/3 of the collateral liquidation proceeds, the auction process has been streamlined and new judges have been hired.

EBA REPORT ON THE DYNAMICS AND DRIVERS OF NON‐PERFORMING EXPOSURES IN THE EU BANKING SECTOR
35
contrast to a resolution entity, a living bank cannot afford aggressive workout practices due to
its bad reputation effect on existing and potential future clients. While it could transfer its
NPLs to a third party using aggressive workout practices, this is also hindered by the
accounting loss stemming from those sales, resulting in substantial capital pressure.
103 Countries, for which the NCAs did identify neither legal nor judicial impediments in supporting
an efficient Corporate NPL workout were: SE, DK, EE, ES, FI, GB, IE, LV, MT, SK.
104 Since the assignment of a severity value to the effect of lengthy judicial proceeding is
somewhat subjective, NCAs were also asked to estimate – to the extent possible – the
average duration of corporate insolvency proceedings. The results can be seen in Figure 13.
Figure 13: Estimated average duration of corporate insolvency proceedings across EU countries
105 From the 20 NCAs, which were able to estimate the average duration of local insolvency
proceedings, 13 estimated it to last longer than 2 years, 3 between 3 and 4 years (PL, RO and
MT, where it was not considered an impediment, though), 3 even longer than 4 years (GR, SI,
IT).
106 Increased uncertainty as to the ultimate recovery value of insolvency procedures should in
theory lead to higher coverage ratios in countries with longer duration of the insolvency
proceedings.22 This assumption was tested, using data from the quantitative analyses above.
107 To correct for the uncertainties of rough estimates by local NCAs, just the extremes were
compared: in countries, where banks face extremely long durations (MT, PL, RO, GR, IT, IS
22 Other things being equal, in particular as regards recovery rates.

EBA REPORT ON THE DYNAMICS AND DRIVERS OF NON‐PERFORMING EXPOSURES IN THE EU BANKING SECTOR
36
above3 years) of insolvency proceedings it is to be expected that the level of provisions
should be markedly higher than in countries with very short durations (EE, NL, GB, IE, NO
below 1 year).
108 Even bearing in mind that the available data only allow for coverage calculation at the highest
consolidation level of banks, on average, indeed there seems to be a positive relationship
between the expected average duration of insolvency proceedings and the level of provisions.
For detailed September 2015 – data, see the graph below:
Figure 14: Coverage ratios in countries with long and short duration of insolvency proceedings
109 Should there be a causal relationship between these 2 parameters (which needs to be
reconfirmed over time and with better country‐level data), it would be warranted to look
beyond the average.
110 The restructuring of debt out of court23 pre insolvency or as an alternative to a full insolvency
procedure could help alleviate the burden on the judicial system and speed up bad debt
resolution processes at banks.24 To address some of these issues, in March 2014 the European
Commission issued a recommendation setting out a series of common principles for national
insolvency frameworks, whose aim was to encourage the restructuring at an early stage of
23 The term “out of court restructuring” refers to a restructuring procedure between debtors and creditors, which follow predefined legal structures (i.e. mostly including approval requirements by judges) and can also take place pre‐bankruptcy. 24 The important role of efficient pre‐insolvency frameworks in fostering a culture of early restructuring and second chances in EU Member States and the positive impact that this has on entrepreneurship, as well as the timeliness and cost of corporate and household deleveraging has been analysed in: European Economy Discussion Papers: The Economic Impact of Rescue and Recovery Frameworks in the EU, 2015, http://ec.europa.eu/economy_finance/publications/eedp/pdf/dp004_en.pdf

EBA REPORT ON THE DYNAMICS AND DRIVERS OF NON‐PERFORMING EXPOSURES IN THE EU BANKING SECTOR
37
viable businesses in financial distress as opposed to their insolvency and liquidation, as well as
to give a second chance to entrepreneurs.25
111 Still, there is not much knowledge about the frequency of this, potentially easier and quicker
alternative to the insolvency proceedings, at local NCAs. From 27 NCAs, 18 could not estimate
the share of out of court debt restructuring as of the total number of insolvency proceedings.
In 5 countries (GR, HU, LT, EE, IE) this share is estimated to be below 15%, in one country (RO)
between 15% and 30%, and in one country (AT) above 30%.
112 While most European countries with significant impediments mentioned are among the
macro‐economically more fragile countries, this is most likely as much an evidence of the
unexpected severity and longevity of the financial crisis in these countries, as it is of the
structural weaknesses within the local legal and judicial system.
113 The option for private individuals to file for insolvency proceedings has almost become
standard law in all member states of the EU. Private insolvency law has been introduced by
legislators mostly aiming at entrepreneurs who are personally liable for businesses and to
enable the private individual to restructure their debt and to recover from insolvency after a
fixed amount of time. The immediate effect of private insolvencies on banks is negative, as a
large part of receivables have to be written off. Research indicates, however, that he overall
effect on the economy is positive, especially related to entrepreneurs, as early and cost‐
effective rescue of viable businesses in order to avoid subsequent liquidation could limit the
economic and social consequences of bankruptcy for them. Less adverse legal consequences
of personal insolvency can even promote entrepreneurship by providing entrepreneurs with
partial insurance against the consequences of failure.26
114 In 24 out of 27 countries there is an insolvency regime for private individuals. Only RO, DK and
FI do not provide a legal framework for insolvency of private individuals. It has to be noted,
though, that in only 12 out of these 24 countries the law is actively and widely used.
115 Prior to the financial crisis banks were regularly faced with the incentive to provision for
individual loan losses as a tax minimisation strategy.27 For that reason the level of tax
deductibility of individual loan loss provisions (ILLPs) differed a lot between countries, if they
were tax‐deductible at all. Since the onset of the crisis the incentive has changed for many
European banks and tax deductibility of ILLPs has become an incentive for a proactive and
adequate identification of loan losses. This is why ILLPs tax‐deductibility is possible in most EU
countries now.
25 European Commission, "Commission recommendation on a new approach to business failure and insolvency", 12.3.2014 C (2014) 1500 final 26 European Economy Discussion Papers: The Economic Impact of Rescue and Recovery Frameworks in the EU, 2015 27 World Bank Working Paper 1: Bank Loan Classification and Provisioning Practices in Selected developed and Emerging Countries, 2003.
EBA REPORT ON THE DYNAMICS AND DRIVERS OF NON‐PERFORMING EXPOSURES IN THE EU BANKING SECTOR
38
116 In only 3 countries (PL28, SE, MT) out of 28, loan losses are generally not deductible from
taxable profits. In HU, ILLPs are deductible for corporate tax purposes, but not for bank tax.
117 In some countries the deductibility of LLPs is allowed, but limited: Up to 31 December 2015 PT
tax law allowed for fiscal deduction of provisions up to a maximum limit, which was defined
by Banco de Portugal’s regulation. A new accounting regime started in 2016 and changes to
fiscal law are expected. In GR and CZ, provisions for credit risk are tax deductible up to a
certain percentage (1% in GR) of the loan book per year.
118 In NO, individual LLPs are fully deductible. But there is a strict regime for definition of loss‐
events allowing recording of NPLs. The NO regulator explicitly refers to a disincentivisation of
the use of LLPs for tax management purposes. NO seems to be the only country left with pre‐
crisis incentivisation concerns.
119 In theory one would expect a connection between coverage ratios and tax – deductibility of
provisions. In countries with limited tax‐deductibility of LLPs, it should be expected that
impairment levels were on average lower than in countries, which allow for tax deductibility
of LLPs. The data, however, from the respective countries (PT, PL, SE, MT, NO) do not show an
identifiable pattern of lower coverage ratios. Again, the lack of country‐of‐risk coverage
information can be the reason for a lack of trends in these data.
Collateral valuation
120 Frequent monitoring of collateral valuation is requested according to CRD IV, Article 208. Real
estate collateral values shall be reassessed at least annually for Commercial Real Estate (CRE)
and at least once every three years for Residential Real Estate (RRE).
121 To achieve stable and reliable Real Estate valuations as basis for adequate provisioning, it is
important to base them on well‐established, transparent RE market information, coming from
reliable sources such as public indices or, alternatively, provided by independent appraisers
using internationally accepted appraisal standards. Detailed information about transactions
facilitates the appraisal process and reduces variability of value estimates within markets
between different appraisers and banks.
122 Building on CRD IV and relevant accounting rules, in 7 out of 28 countries (EE, ES, HR, IE, NL,
PT, RO) the regulator has explicitly defined additional rules for valuing collateral. In all of
these countries, these rules include reference is to national or international valuation
28 In specific cases, the provisions of Polish CIT Act provide some exceptions. According to these provisions, only strictly defined uncollectable debts (which based on the CIT law were booked as taxable revenues) may be considered by the taxpayer as a tax‐deductible cost, provided that their non‐collectability was properly documented (e.g. by a court decision). In some cases, non‐collectability may be considered probable (e.g. debtor’s death).

EBA REPORT ON THE DYNAMICS AND DRIVERS OF NON‐PERFORMING EXPOSURES IN THE EU BANKING SECTOR
39
standards and the focus on external independent valuation specialists without conflict of
interest. Apart from that, in HR and in ES the local regulator defines minimum discounts on
collateral market values per type of collateral for calculation of provisions.
123 The results of the survey, however, show a significant lack of transparency in most countries,
especially in the CRE area. Details can be seen in Figure 15.
Figure 15: Transparency of Residential‐ and Commercial Real Estate markets across EU countries
124 RRE ‐ markets are relatively more transparent than CRE markets across EU member states.
Still, there are only 3 countries (CY, ES, SE) for which the local NCA considers both, CRE and
RRE markets as very transparent. On the other hand, the NCAs of GR and HU consider both
markets as non‐transparent.
125 In RO, a RE database was set up in 2015, for the purpose of centralising the information about
RE appraisals. Its purpose is to ensure transparency and to minimise business risk on collateral
guarantees. The database will not be public but banks and independent appraisers will have
access to it.
EBA REPORT ON THE DYNAMICS AND DRIVERS OF NON‐PERFORMING EXPOSURES IN THE EU BANKING SECTOR
40
Alternative ways of getting bad loans off the balance sheet
126 Reducing the level of NPLs in an effective and timely manner must be a key focus for banks
with elevated levels of distress. In principle, this can be achieved by quickly identifying
troubled debt, calculating adequate provisions, deciding upon a resolution/restructuring path
and by pursuing that path timely and effectively.
127 To ensure efficient management of high risk clients and workout of non‐performing debt,
local regulators across the EU have started to request the setup of dedicated management
units (sometimes called “arrears management units”) at banks, which exclusively deal with
high risk clients and bad debt resolution issues and who are separated from the banks’
sales/market units. NCAs have been asked to assess the effectiveness of these units at local
banks.
128 Looking at the answers by NCAs, an effective management of high‐risk and defaulted debt
seems to have taken centre stage at banks. Regulators are focussing on it, too, as each and
every NCA was able to assess the effectiveness of such units. All 27 replies from NCAs assess
banks’ arrears management units as “effective” (16) or “somewhat effective” (11). While the
large the backlog of unresolved debt at banks is due to a variety of factors, this still seems a
little optimistic. Most likely they have been set up at banks not only due to regulatory, but
also due to economic pressure.
129 Since the onset of the financial crisis, so called “bad banks”, being dedicated corporate debt
workout entities, often subject to different capital regimes, have been used in many countries
to transfer large bad debt portfolios off of banks’ balance sheets. While managing non
performing debt in a “bad bank” can be an effective – yet not cost free ‐ way of cleaning bank
balance sheets, such “bad bank” structures are not legally and prudentially provided for in
many member countries of the EU.
130 According to the survey results, only 15 countries have a widely accepted and utilised
licencing and regulatory regime prescribed for bad banks. The existence of such law is spread
across most of the EU, in both small (e.g. LV, BE, AT) and large (e.g. IT, ES, DE, GB) countries as
well as in economically fragile (e.g. GR) and more stable (e.g. CZ, DK) countries.
131 The same argument holds for the opposite, countries which have not legally provided for bad
banks. CESEE countries and economically fragile countries, however, are slightly
overrepresented. In the remaining countries, there is no possibility to set up a bad bank
(Figure 16).
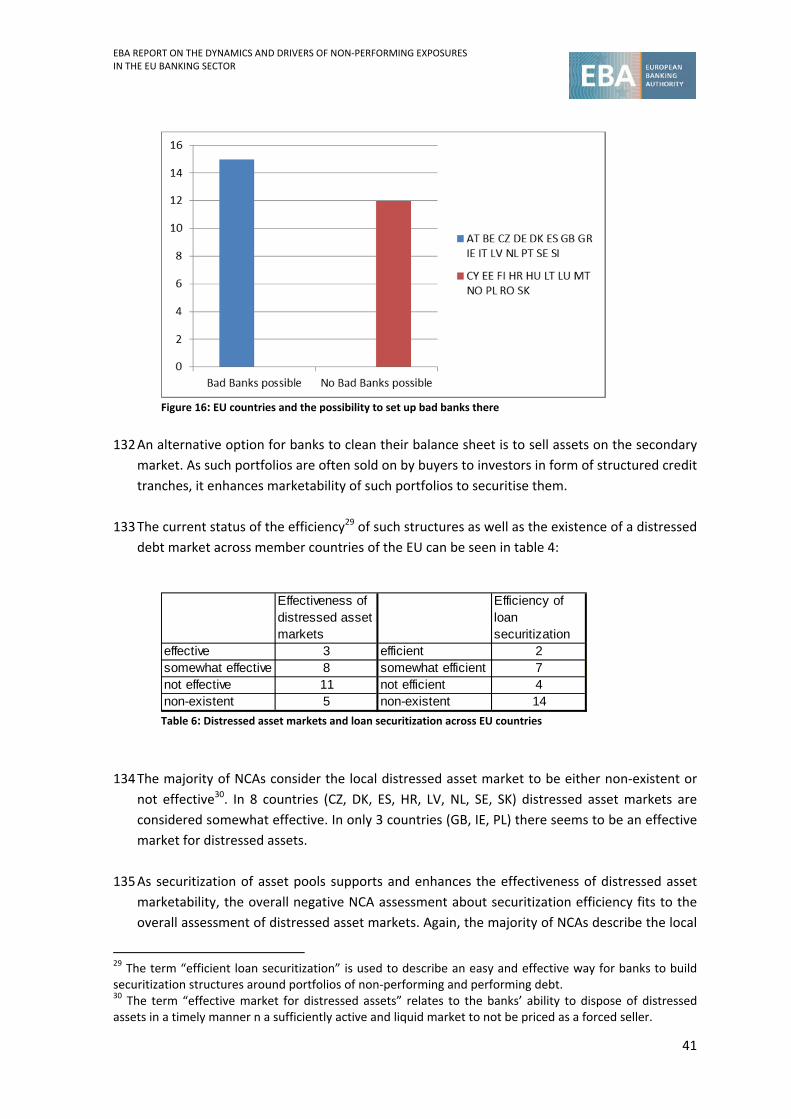
EBA REPORT ON THE DYNAMICS AND DRIVERS OF NON‐PERFORMING EXPOSURES IN THE EU BANKING SECTOR
41
Figure 16: EU countries and the possibility to set up bad banks there
132 An alternative option for banks to clean their balance sheet is to sell assets on the secondary
market. As such portfolios are often sold on by buyers to investors in form of structured credit
tranches, it enhances marketability of such portfolios to securitise them.
133 The current status of the efficiency29 of such structures as well as the existence of a distressed
debt market across member countries of the EU can be seen in table 4:
Table 6: Distressed asset markets and loan securitization across EU countries
134 The majority of NCAs consider the local distressed asset market to be either non‐existent or
not effective30. In 8 countries (CZ, DK, ES, HR, LV, NL, SE, SK) distressed asset markets are
considered somewhat effective. In only 3 countries (GB, IE, PL) there seems to be an effective
market for distressed assets.
135 As securitization of asset pools supports and enhances the effectiveness of distressed asset
marketability, the overall negative NCA assessment about securitization efficiency fits to the
overall assessment of distressed asset markets. Again, the majority of NCAs describe the local
29 The term “efficient loan securitization” is used to describe an easy and effective way for banks to build securitization structures around portfolios of non‐performing and performing debt. 30 The term “effective market for distressed assets” relates to the banks’ ability to dispose of distressed assets in a timely manner n a sufficiently active and liquid market to not be priced as a forced seller.
Effectiveness of distressed asset markets
Efficiency of loan securitization
effective 3 efficient 2somewhat effective 8 somewhat efficient 7not effective 11 not efficient 4non-existent 5 non-existent 14

EBA REPORT ON THE DYNAMICS AND DRIVERS OF NON‐PERFORMING EXPOSURES IN THE EU BANKING SECTOR
42
ability for banks to securitize loans to be either not efficient or non‐existent. Only for BE and
GB loan securitization is considered efficient, the NCAs of 7 countries (IE, DE, GR, IT, ES, NL,
SK) assess local securitization somewhat efficient.
136 According to NCAs’ answers, within the last 24 months NPL transactions (including
securitization) at the local banks were recorded in only 13 (CZ, DE, GB, HR, IE, IT, LV, NO, PL,
PT, RO, SI, ES) out of 27 countries. Furthermore, the share of these transactions of the total
amount of NPLs is very low.
137 Wherever information on prices is available, the discount to the gross carrying amount of
such portfolios is mostly ranging between ‐50% and ‐90%. Given these pricing levels, it comes
as no surprise that banks in the EU have been reluctant to sell big chunks of distressed assets
on the secondary market.
Policy implications and way forward
138 Regulators and supervisors across the European Union have taken significant steps to
strengthen the EU banking sector since the onset of the financial crisis. In addition to the
strengthening and harmonisation of banking regulation per se they have also taken specific
steps on addressing NPLs. Notably, the common definition of NPE and FBE has been
important and a prerequisite for repairing banks’ balance sheets after the crisis. In parallel to
regulatory reforms, EU supervisors have taken several steps to improve asset quality, with
comprehensive AQRs carried out in 2014. This has resulted in more clarity on bank exposures,
sounder provisioning policy and, on average, a gradual reduction in the stock on non‐
performing exposures. Still, the improvements are slow and uneven, also due to some
structural impediments to the management and resolution of NPLs.
139 There are therefore additional actions to be considered. In many cases, there are already
initiatives in place and co‐operation of EU institutions and supervisors in this field has been
strong. After the 2014 AQRs, supervisors have strengthened their regular monitoring of asset
quality, with initiatives carried out by national competent authorities and, particularly, the
SSM for the euro area banks.
140 The first area relates to ongoing supervisory work. These include:
a. Definitions: A more harmonised application of the definition of default is a necessary
complement to the common definition of NPLs. The EBA is already working on
guidelines on this topic. This paper shows that the harmonisation of definitions plays
an important role also outside the EU borders, particularly for banks operating on a
global scale. Available data is not harmonised for exposures outside the EU and this
makes comparisons less reliable as some of the largest banks in the EU do have assets

EBA REPORT ON THE DYNAMICS AND DRIVERS OF NON‐PERFORMING EXPOSURES IN THE EU BANKING SECTOR
43
abroad. Therefore the BCBS consultative document on NPL and FBL is an important
step in the direction of a global definition for the prudential treatment of assets.
b. Guidance: There is a need for supervisory guidance on tackling NPLs. An area where
additional guidance might be helpful is collateral valuation. This includes valuation
methodology and possibly minimum requirements for re‐valuation in terms of timing
and ad hoc methods. In view of the entry into force of the IFRS 9 and the divergent
calculation of provisioning requirements amongst different jurisdictions and banks,
some harmonised criteria is also needed on provisioning requirements. Clearly, this is
realizable up to the extent that the accounting regime has a direct impact on the
prudential framework and the calculation of capital requirements. Guidance may also
be needed on supervisory approaches towards effective arrears management and
NPL resolution governance inside banks. Banks will need to be called to strengthen
their internal procedures, strategy for dealing with NPLs, arrears management,
making NPL management active, efficient and informed. To this end banks should also
be encouraged to enhance their ICT systems so as to enhance quality, accuracy and
completeness of data related to NPLs.
141 The second area relates to structural issues such as judicial system and processes,
transparency and assets management.
a. First, it is clear that the length of recovery procedures has an impact on the ask‐bid
spread. Therefore, the judicial system could be strengthened through improvements
in the process, as well as adaptation of regulatory framework. This would have a
positive effect on timeliness of the procedure.
b. Judicial system could be relieved through a more frequent usage of out‐of‐court
restructuring. Out‐of‐court restructuring should be available to banks in a clearly
defined format, ideally under judicial supervision.
c. Accounting and tax regimes can also influence the incentives for banks to deal
promptly with NPLs.
142 The third area relates to the importance of a functioning secondary market in loans to
facilitate the disposal of NPLs. This needs several factors, including some structural issues as
above. However, two specific steps can be taken:
a. Transparency: Steps can be taken to enhance transparency regarding the state of
NPLs in general and associated factors, for example, real estate collateral valuation.
Collateral values play a significant part in the calculation of provisions. A transparent
and sufficiently large database of RE values enhances the stability and reliability of
such values, which ultimately facilitates the sales process and leads to lower
discounts in secondary market transactions.

EBA REPORT ON THE DYNAMICS AND DRIVERS OF NON‐PERFORMING EXPOSURES IN THE EU BANKING SECTOR
44
b. Asset Management Companies: The establishment of asset management companies
or bad banks can play a key role in resolving NPLs, especially in countries where poor
asset quality is not idiosyncratic but it is rather a systemic problem. Such AMCs are
also a key factor in price discovery. Banks may establish an internal bad bank for
easier management of distressed assets, but in some cases the solution should be
systemic and may involve public support, which can trigger resolution and the bail‐in
of certain liabilities. It is important that financial stability considerations are duly
taken into account and that possible repercussions on retail investors are not
underestimated.
c. Securitisation: The revival of the European market for debt securitisation could also
contribute to widen the range of options banks can consider to dealing with NPLs.
Securitization of loan portfolios is often a prerequisite for buyers, which tend to
distribute such portfolios in parts to other buyers. While markets for CDOs and
comparable instruments have been stigmatized during the financial crisis, there are
some benefits for NPL markets. Supervisors would nevertheless have to monitor
securitization efforts of banks closely to detect adverse developments. As markets for
such structures need certain critical mass, an EU‐wide approach to such rules is
warranted.

EBA REPORT ON THE DYNAMICS AND DRIVERS OF NON‐PERFORMING EXPOSURES IN THE EU BANKING SECTOR
45
Appendix
Figure A 1: Weighted non‐performing FBL % for forborne loans and advances to NFC and range per bank’s home
country and across countries since Sept. 2014
Figure A 2: Weighted non‐performing FBL % for forborne loans and advances to HH and range per bank’s home
country and across countries since Sept. 2014

EBA REPORT ON THE DYNAMICS AND DRIVERS OF NON‐PERFORMING EXPOSURES IN THE EU BANKING SECTOR
46
Figure A 3: Change of Coverage Ratio I for loans and advances to NFC per bank’s home country since Sept. 2014
Figure A 4: Change of Coverage Ratio I for loans and advances to HH per bank’s home country since Sept. 2014

EBA REPORT ON THE DYNAMICS AND DRIVERS OF NON‐PERFORMING EXPOSURES IN THE EU BANKING SECTOR
47
Figure A 5: Weighted domestic exposures loans and advances to NFC and number of significant foreign exposures per
country
Figure A 6: Weighted domestic exposures loans and advances to HH and number of significant foreign exposures per
country.

EBA REPORT ON THE DYNAMICS AND DRIVERS OF NON‐PERFORMING EXPOSURES IN THE EU BANKING SECTOR
48
Figure A 7: Weighted exposures for loans and advances to NFC in EU Countries plus NO and to non‐EU countries.
Figure A 8: Weighted exposures for loans and advances to HH in EU Countries plus NO and to non‐EU countries.
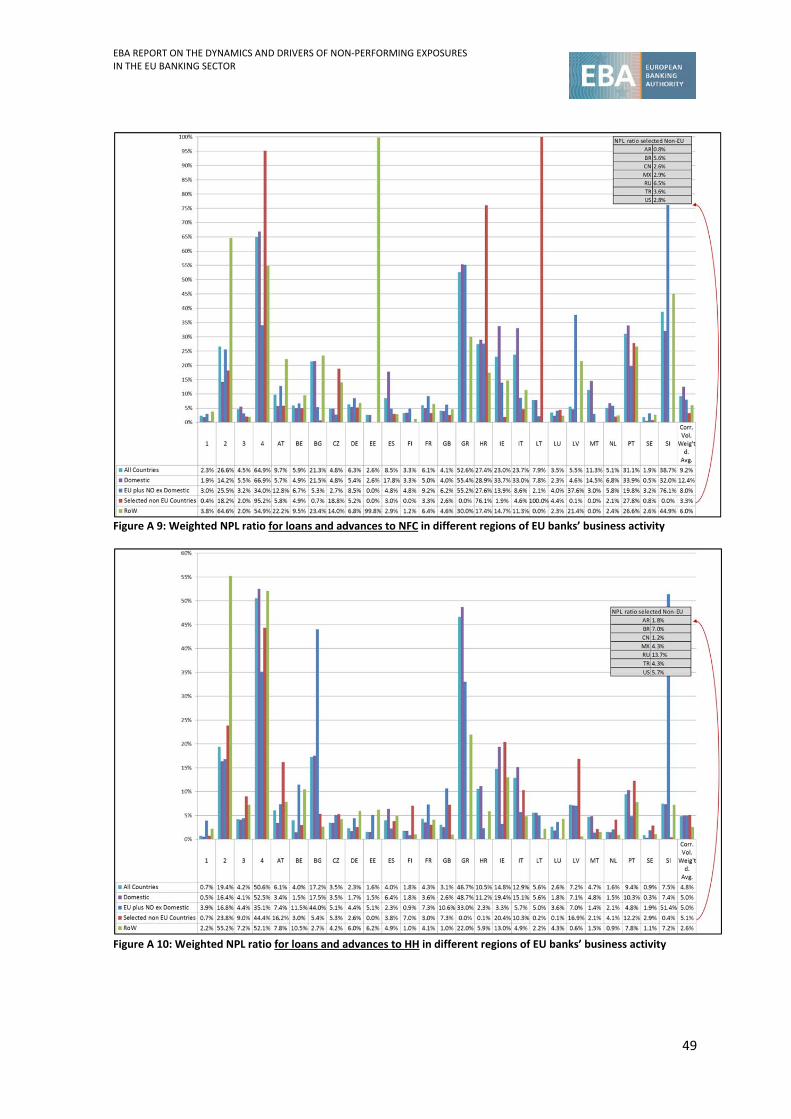
EBA REPORT ON THE DYNAMICS AND DRIVERS OF NON‐PERFORMING EXPOSURES IN THE EU BANKING SECTOR
49
Figure A 9: Weighted NPL ratio for loans and advances to NFC in different regions of EU banks’ business activity
Figure A 10: Weighted NPL ratio for loans and advances to HH in different regions of EU banks’ business activity
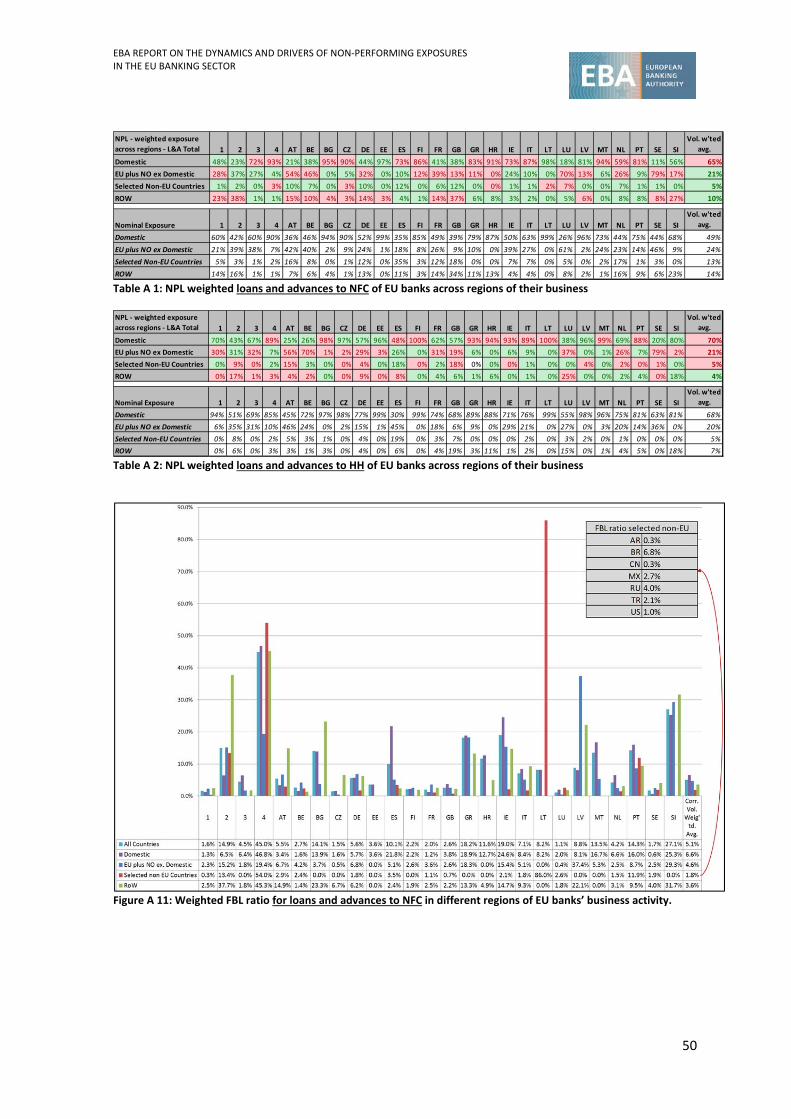
EBA REPORT ON THE DYNAMICS AND DRIVERS OF NON‐PERFORMING EXPOSURES IN THE EU BANKING SECTOR
50
Table A 1: NPL weighted loans and advances to NFC of EU banks across regions of their business
Table A 2: NPL weighted loans and advances to HH of EU banks across regions of their business
Figure A 11: Weighted FBL ratio for loans and advances to NFC in different regions of EU banks’ business activity.
NPL ‐ weighted exposure
across regions ‐ L&A Total 1 2 3 4 AT BE BG CZ DE EE ES FI FR GB GR HR IE IT LT LU LV MT NL PT SE SI
Vol. w'ted
avg.
Domestic 48% 23% 72% 93% 21% 38% 95% 90% 44% 97% 73% 86% 41% 38% 83% 91% 73% 87% 98% 18% 81% 94% 59% 81% 11% 56% 65%
EU plus NO ex Domestic 28% 37% 27% 4% 54% 46% 0% 5% 32% 0% 10% 12% 39% 13% 11% 0% 24% 10% 0% 70% 13% 6% 26% 9% 79% 17% 21%
Selected Non‐EU Countries 1% 2% 0% 3% 10% 7% 0% 3% 10% 0% 12% 0% 6% 12% 0% 0% 1% 1% 2% 7% 0% 0% 7% 1% 1% 0% 5%
ROW 23% 38% 1% 1% 15% 10% 4% 3% 14% 3% 4% 1% 14% 37% 6% 8% 3% 2% 0% 5% 6% 0% 8% 8% 8% 27% 10%
Nominal Exposure 1 2 3 4 AT BE BG CZ DE EE ES FI FR GB GR HR IE IT LT LU LV MT NL PT SE SI
Vol. w'ted
avg.
Domestic 60% 42% 60% 90% 36% 46% 94% 90% 52% 99% 35% 85% 49% 39% 79% 87% 50% 63% 99% 26% 96% 73% 44% 75% 44% 68% 49%
EU plus NO ex Domestic 21% 39% 38% 7% 42% 40% 2% 9% 24% 1% 18% 8% 26% 9% 10% 0% 39% 27% 0% 61% 2% 24% 23% 14% 46% 9% 24%
Selected Non‐EU Countries 5% 3% 1% 2% 16% 8% 0% 1% 12% 0% 35% 3% 12% 18% 0% 0% 7% 7% 0% 5% 0% 2% 17% 1% 3% 0% 13%
ROW 14% 16% 1% 1% 7% 6% 4% 1% 13% 0% 11% 3% 14% 34% 11% 13% 4% 4% 0% 8% 2% 1% 16% 9% 6% 23% 14%
NPL ‐ weighted exposure
across regions ‐ L&A Total 1 2 3 4 AT BE BG CZ DE EE ES FI FR GB GR HR IE IT LT LU LV MT NL PT SE SI
Vol. w'ted
avg.
Domestic 70% 43% 67% 89% 25% 26% 98% 97% 57% 96% 48% 100% 62% 57% 93% 94% 93% 89% 100% 38% 96% 99% 69% 88% 20% 80% 70%
EU plus NO ex Domestic 30% 31% 32% 7% 56% 70% 1% 2% 29% 3% 26% 0% 31% 19% 6% 0% 6% 9% 0% 37% 0% 1% 26% 7% 79% 2% 21%
Selected Non‐EU Countries 0% 9% 0% 2% 15% 3% 0% 0% 4% 0% 18% 0% 2% 18% 0% 0% 0% 1% 0% 0% 4% 0% 2% 0% 1% 0% 5%
ROW 0% 17% 1% 3% 4% 2% 0% 0% 9% 0% 8% 0% 4% 6% 1% 6% 0% 1% 0% 25% 0% 0% 2% 4% 0% 18% 4%
Nominal Exposure 1 2 3 4 AT BE BG CZ DE EE ES FI FR GB GR HR IE IT LT LU LV MT NL PT SE SI
Vol. w'ted
avg.
Domestic 94% 51% 69% 85% 45% 72% 97% 98% 77% 99% 30% 99% 74% 68% 89% 88% 71% 76% 99% 55% 98% 96% 75% 81% 63% 81% 68%
EU plus NO ex Domestic 6% 35% 31% 10% 46% 24% 0% 2% 15% 1% 45% 0% 18% 6% 9% 0% 29% 21% 0% 27% 0% 3% 20% 14% 36% 0% 20%
Selected Non‐EU Countries 0% 8% 0% 2% 5% 3% 1% 0% 4% 0% 19% 0% 3% 7% 0% 0% 0% 2% 0% 3% 2% 0% 1% 0% 0% 0% 5%
ROW 0% 6% 0% 3% 3% 1% 3% 0% 4% 0% 6% 0% 4% 19% 3% 11% 1% 2% 0% 15% 0% 1% 4% 5% 0% 18% 7%

EBA REPORT ON THE DYNAMICS AND DRIVERS OF NON‐PERFORMING EXPOSURES IN THE EU BANKING SECTOR
51
Figure A 12: Weighted FBL ratio for loans and advances to HH in different regions of EU banks’ business activity

EUROPEAN BANKING AUTHORITY
Floor 46 One Canada Square, London E14 5AA
Tel. +44 (0)207 382 1776
Fax: +44 (0)207 382 1771
E‐mail: [email protected]
http://www.eba.europa.eu


![EBA Guidelines on non-performing and forborne exposures · forborne exposures and foreclosed assets. ... ive percent Non-Performing Loan [NPL] ... Central Bank’s (ECB) guidance](https://img.dokumen.tips/doc/110x75/5b3a2b307f8b9a0e628b5327/eba-guidelines-on-non-performing-and-forborne-exposures-forborne-exposures-and.jpg)