Embed Size (px)
Citation preview
THIS REPORT WAS PREPARED BY OLGA MILKIEWICZ, A MASTERS IN FINANCE STUDENT OF THE NOVA SCHOOL OF BUSINESS AND ECONOMICS, EXCLUSIVELY FOR ACADEMIC PURPOSES. THIS REPORT WAS SUPERVISED BY ROSÁRIO ANDRÉ WHO REVIEWED THE VALUATION METHODOLOGY
AND THE FINANCIAL MODEL. (SEE DISCLOSURES AND DISCLAIMERS AT END OF DOCUMENT)
See more information at WWW.NOVASBE.PT Page 1/35
We initiate coverage of easyJet (EZJ) with a [BUY]
recommendation and a FY15 target price of £21.90. The stock
is currently trading at a discount to its main European peers
(EV/EBITDA of 8.06x vs industry avg. 14.21x) and is clearly
undervalued in terms of the P/E ratio 14.69 EZJ vs 20.58 RYA
Dividends. EZJ capital discipline is expected to support
further ad hoc cash returns, which will continue to be an important
part of EZJ equity story
EZJ is the best positioned low cost carrier (LCC) to
take further material revenue share from weak legacy carriers
– capacity is expected to further “free up” due to legacy carriers’
(FSC) retrenchment. FSC share in all European flights has fallen
(58% 2008 to 55% 2013) and with a number of legacy-dominated
countries, characterized by low LCC penetration remaining,
potential growth markets for EZJ exist – this market change
story is, in our opinion, equally important as economic
variable variations (i.e. GDP growth or fuel prices)
Although risk of increased capacity is becoming more
evident, EZJ is rightly positioned in this crowded space.
Additionally, EZJ has proven time over time that it is capable of
growing its business and profits under fierce competition, which
adds confidence in the company’s business model.
Company description
EZJ is a British LCC operating in the European short haul segment with a market share of 8.3%. It is the largest airline in the UK with strong positions in a number of key European markets (#1 in 24 airports – 48% of capacity and #2 in 29 airports – 29% capacity)
easyJet plc COMPANY REPORT
INDUSTRIALS | EUROPEAN TRANSPORTATION 7TH JANUARY 2015
STUDENT: Olga Milkiewicz [email protected]
Lean, strong and determined
Recommendation: BUY
Price Target FY15: 21.90 £
Price (as of 7-Jan-15) 16.82 £
Trading data
52-week range (£) 12.07 - 18.53
Market Cap (£B) 6.76
Outstanding Shares (m) 393
Free- Float 63.11%
Source: Bloomberg
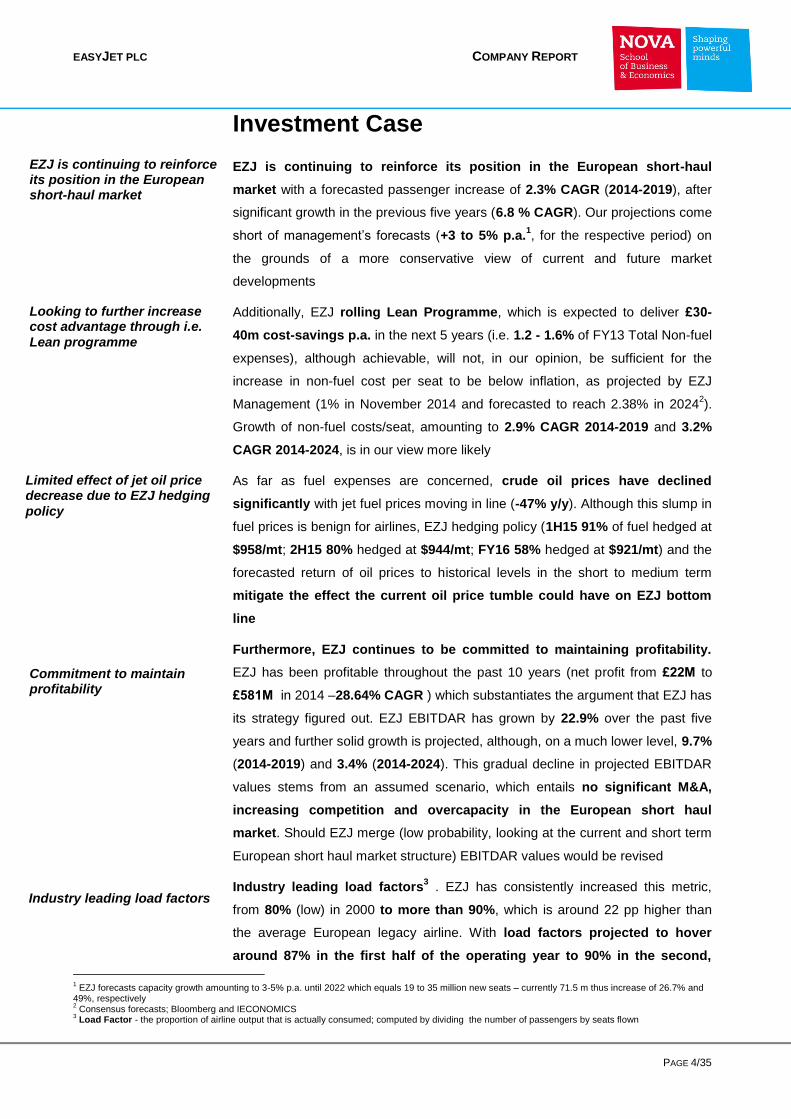
Performance
Source: Bloomberg
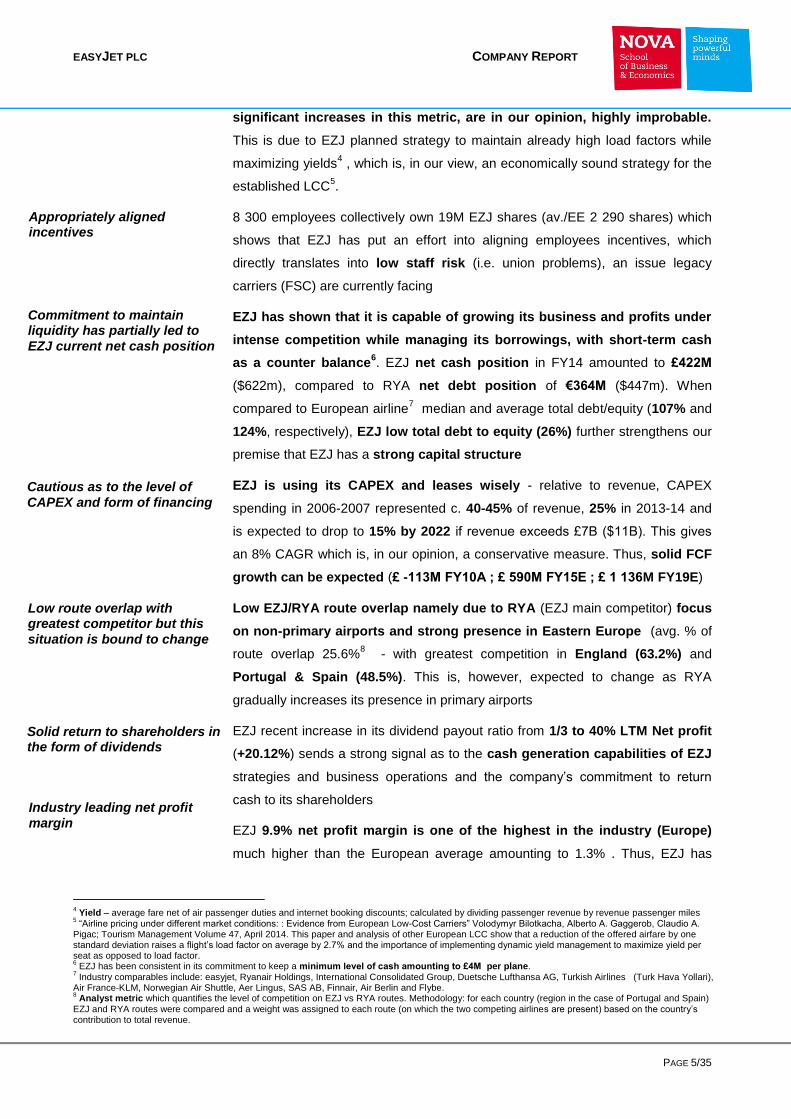
Highlights
(Values in £ millions) 2014A 2015F 2016F
Revenues 4 527 5 038 5 461
EBITDA 701 948 1208
Net Profit 450 628 862
EPS 1.15 1.61 2.21
P/E (x) 14.69x 10.47x 7.62x
Dividend Yield(%) 3.19% 2.77% 4.11%
EV/EBITDA (x) 8.06x 5.26x 4.77x
Net Debt/EBITDA(x) -0.63 -0.3 -0.59
ROA (%) 10% 13.7% 16.7%
ROIC (%) 17.2% 25.1% 30%
ROCE (%) 21.2% 25.7% 35%
Source: Company Data; Analyst’s estimates
EASYJET PLC COMPANY REPORT
PAGE 2/35
Table of Contents
INVESTMENT CASE ................................................................................ 4
EU AIRLINES INDUSTRY ........................................................................ 6
OVERVIEW............................................................................................................. 6 2014 – CURRENT MARKET STRUCTURE AND KEY DEVELOPEMENTS ................. 7 MEDIUM AND LONG TEM PERSPECTIVE (2015-20124) ....................................... 8
MACROECONOMIC OUTLOOK .............................................................. 9
GDP GROWTH ...................................................................................................... 9 EUR/USD .......................................................................................................... 10 JET FUEL PRICES ............................................................................................... 10 OTHER VARIABLES .............................................................................................. 11
Inflationary environment ............................................................ 11 Business Confidence and Consumer Spending .................... 11 Regulatory Environmet .............................................................. 11
EASYJET PLC ........................................................................................12
COMPANY DESCRIPTION .................................................................................... 12 SHAREHOLDER STRUCTURE ............................................................................... 12 DIVIDEND POLICY ............................................................................................... 12
BUSINESS OPERATIONS ......................................................................13
AIR TRAVEL ......................................................................................................... 13 Key Business Trends ................................................................. 13 EZJ Key Markets ...................................................................... 15 o United Kingdom ....................................................................... 15 o France ......................................................................................... 16 o Switzerland ................................................................................ 16 o Germany .................................................................................... 17 o Spain and Portugal ................................................................. 17 o Italy .............................................................................................. 18 o Other Markets ........................................................................... 18
ANCILLARY BUSINESS ......................................................................................... 19
FINANCIAL ANALYSIS AND FORECASTS ...........................................19
KEY REVENUE DRIVERS ..................................................................................... 19 ASK and seats flown.................................................................. 19 Revenue per passenger (RPP) ................................................ 20 Load Factors ............................................................................... 21
DIVISIONAL BREAKDOWN OF REVENUE.............................................................. 21 KEY EXPENSE DRIVERS ..................................................................................... 21
Fuel Expense .............................................................................. 21 Non-Fuel Expense ..................................................................... 22
EBITDAR AND EBITDAR MARGIN (%) ............................................................. 22 CAPEX, DEPRECIATION AND FLEET PROJECTIONS .......................................... 22 KEY REVENUE AND EXPENSE DRIVERS –SENSITIVITY ANALYSIS ..................... 24
EBITDAR ..................................................................................... 25 ROCE ........................................................................................... 25
LEVERAGE AND FCF .......................................................................................... 27

EASYJET PLC COMPANY REPORT
PAGE 3/35
VALUATION ............................................................................................28
WACC ................................................................................................................ 28 TERMINAL VALUE ................................................................................................ 28 SCENARIO ANALYSIS .......................................................................................... 29 CONCLUSION ...................................................................................................... 29
APPENDIX ..............................................................................................30
APPENDIX 1 ........................................................................................................ 30 RESEARCH RECOMMENDATIONS ........................................................................ 35
EASYJET PLC COMPANY REPORT
PAGE 4/35
Investment Case
EZJ is continuing to reinforce its position in the European short-haul
market with a forecasted passenger increase of 2.3% CAGR (2014-2019), after
significant growth in the previous five years (6.8 % CAGR). Our projections come
short of management’s forecasts (+3 to 5% p.a.1, for the respective period) on
the grounds of a more conservative view of current and future market
developments
Additionally, EZJ rolling Lean Programme, which is expected to deliver £30-
40m cost-savings p.a. in the next 5 years (i.e. 1.2 - 1.6% of FY13 Total Non-fuel
expenses), although achievable, will not, in our opinion, be sufficient for the
increase in non-fuel cost per seat to be below inflation, as projected by EZJ
Management (1% in November 2014 and forecasted to reach 2.38% in 20242).
Growth of non-fuel costs/seat, amounting to 2.9% CAGR 2014-2019 and 3.2%
CAGR 2014-2024, is in our view more likely
As far as fuel expenses are concerned, crude oil prices have declined
significantly with jet fuel prices moving in line (-47% y/y). Although this slump in
fuel prices is benign for airlines, EZJ hedging policy (1H15 91% of fuel hedged at
$958/mt; 2H15 80% hedged at $944/mt; FY16 58% hedged at $921/mt) and the
forecasted return of oil prices to historical levels in the short to medium term
mitigate the effect the current oil price tumble could have on EZJ bottom
line
Furthermore, EZJ continues to be committed to maintaining profitability.
EZJ has been profitable throughout the past 10 years (net profit from £22M to
£581M in 2014 –28.64% CAGR ) which substantiates the argument that EZJ has
its strategy figured out. EZJ EBITDAR has grown by 22.9% over the past five
years and further solid growth is projected, although, on a much lower level, 9.7%
(2014-2019) and 3.4% (2014-2024). This gradual decline in projected EBITDAR
values stems from an assumed scenario, which entails no significant M&A,
increasing competition and overcapacity in the European short haul
market. Should EZJ merge (low probability, looking at the current and short term
European short haul market structure) EBITDAR values would be revised
Industry leading load factors3 . EZJ has consistently increased this metric,
from 80% (low) in 2000 to more than 90%, which is around 22 pp higher than
the average European legacy airline. With load factors projected to hover
around 87% in the first half of the operating year to 90% in the second,
1 EZJ forecasts capacity growth amounting to 3-5% p.a. until 2022 which equals 19 to 35 million new seats – currently 71.5 m thus increase of 26.7% and
49%, respectively 2 Consensus forecasts; Bloomberg and IECONOMICS
3 Load Factor - the proportion of airline output that is actually consumed; computed by dividing the number of passengers by seats flown
EZJ is continuing to reinforce its position in the European short-haul market
Looking to further increase cost advantage through i.e.
Lean programme
Limited effect of jet oil price decrease due to EZJ hedging
policy
Commitment to maintain profitability
Industry leading load factors
EASYJET PLC COMPANY REPORT
PAGE 5/35
significant increases in this metric, are in our opinion, highly improbable.
This is due to EZJ planned strategy to maintain already high load factors while
maximizing yields4 , which is, in our view, an economically sound strategy for the
established LCC5.
8 300 employees collectively own 19M EZJ shares (av./EE 2 290 shares) which
shows that EZJ has put an effort into aligning employees incentives, which
directly translates into low staff risk (i.e. union problems), an issue legacy
carriers (FSC) are currently facing
EZJ has shown that it is capable of growing its business and profits under
intense competition while managing its borrowings, with short-term cash
as a counter balance6. EZJ net cash position in FY14 amounted to £422M
($622m), compared to RYA net debt position of €364M ($447m). When
compared to European airline7 median and average total debt/equity (107% and
124%, respectively), EZJ low total debt to equity (26%) further strengthens our
premise that EZJ has a strong capital structure
EZJ is using its CAPEX and leases wisely - relative to revenue, CAPEX
spending in 2006-2007 represented c. 40-45% of revenue, 25% in 2013-14 and
is expected to drop to 15% by 2022 if revenue exceeds £7B ($11B). This gives
an 8% CAGR which is, in our opinion, a conservative measure. Thus, solid FCF
growth can be expected (£ -113M FY10A ; £ 590M FY15E ; £ 1 136M FY19E)
Low EZJ/RYA route overlap namely due to RYA (EZJ main competitor) focus
on non-primary airports and strong presence in Eastern Europe (avg. % of
route overlap 25.6%8 - with greatest competition in England (63.2%) and
Portugal & Spain (48.5%). This is, however, expected to change as RYA
gradually increases its presence in primary airports
EZJ recent increase in its dividend payout ratio from 1/3 to 40% LTM Net profit
(+20.12%) sends a strong signal as to the cash generation capabilities of EZJ
strategies and business operations and the company’s commitment to return
cash to its shareholders
EZJ 9.9% net profit margin is one of the highest in the industry (Europe)
much higher than the European average amounting to 1.3% . Thus, EZJ has
4 Yield – average fare net of air passenger duties and internet booking discounts; calculated by dividing passenger revenue by revenue passenger miles
5 “Airline pricing under different market conditions: : Evidence from European Low-Cost Carriers” Volodymyr Bilotkacha, Alberto A. Gaggerob, Claudio A.
Pigac; Tourism Management Volume 47, April 2014. This paper and analysis of other European LCC show that a reduction of the offered airfare by one standard deviation raises a flight’s load factor on average by 2.7% and the importance of implementing dynamic yield management to maximize yield per seat as opposed to load factor. 6 EZJ has been consistent in its commitment to keep a minimum level of cash amounting to £4M per plane.
7 Industry comparables include: easyjet, Ryanair Holdings, International Consolidated Group, Duetsche Lufthansa AG, Turkish Airlines (Turk Hava Yollari),
Air France-KLM, Norwegian Air Shuttle, Aer Lingus, SAS AB, Finnair, Air Berlin and Flybe. 8 Analyst metric which quantifies the level of competition on EZJ vs RYA routes. Methodology: for each country (region in the case of Portugal and Spain)
EZJ and RYA routes were compared and a weight was assigned to each route (on which the two competing airlines are present) based on the country’s contribution to total revenue.
Appropriately aligned incentives
Commitment to maintain liquidity has partially led to
EZJ current net cash position
Cautious as to the level of
CAPEX and form of financing
Low route overlap with greatest competitor but this
situation is bound to change
Solid return to shareholders in the form of dividends
Industry leading net profit
margin
EASYJET PLC COMPANY REPORT
PAGE 6/35
proven the profitability of its operations, even in the wake of struggling European
carriers, gives further confidence in EZJ business model
Despite a significant appreciation in its valuation, EZJ remains undervalued9
compared to rivals – EZJ stock is currently trading at a discount to its main
European peers (EV/EBITDA of 8.06x vs industry mean 14.21x) and clearly
undervalued when the P/E ratio is considered - 14.69 EZJ vs 20.58 RYA
Finally, EZJ share price may have reached a consolidation phase after having
appreciated quite rapidly (+271% over 5 years), thus we expect the growth
momentum to subside (forecasted upside +30.0%)
EU Airlines Industry
Overview
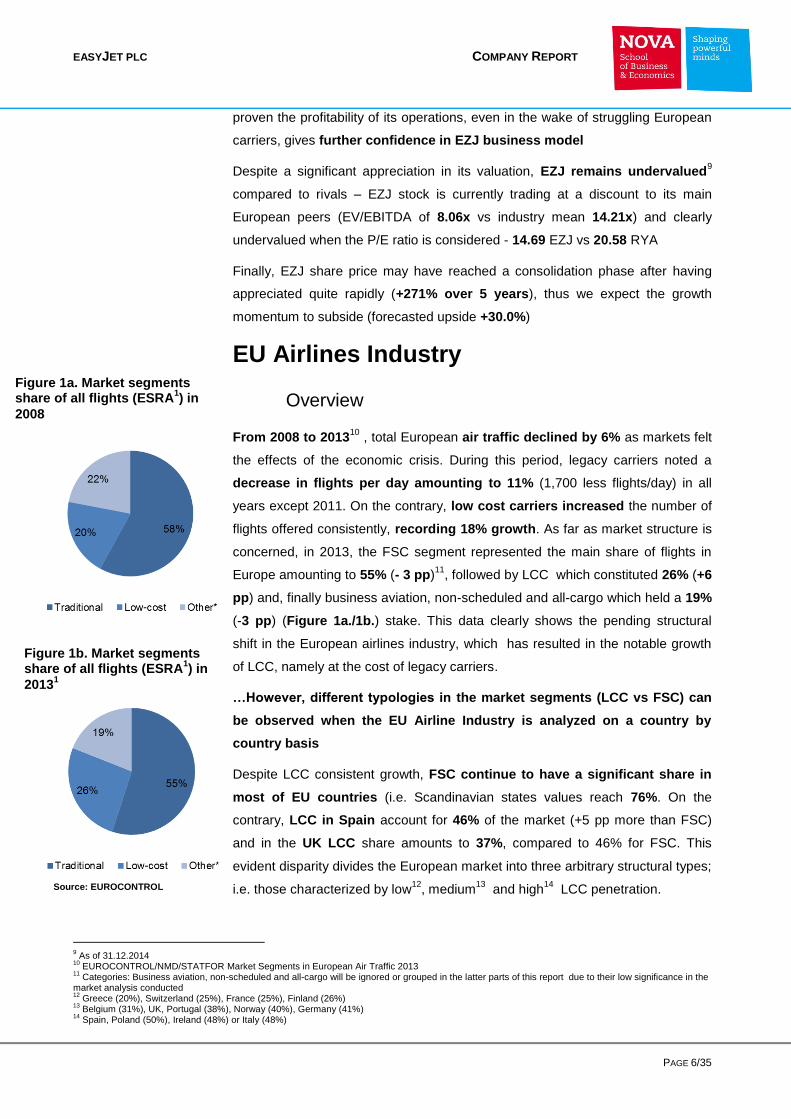
From 2008 to 201310
, total European air traffic declined by 6% as markets felt
the effects of the economic crisis. During this period, legacy carriers noted a
decrease in flights per day amounting to 11% (1,700 less flights/day) in all
years except 2011. On the contrary, low cost carriers increased the number of
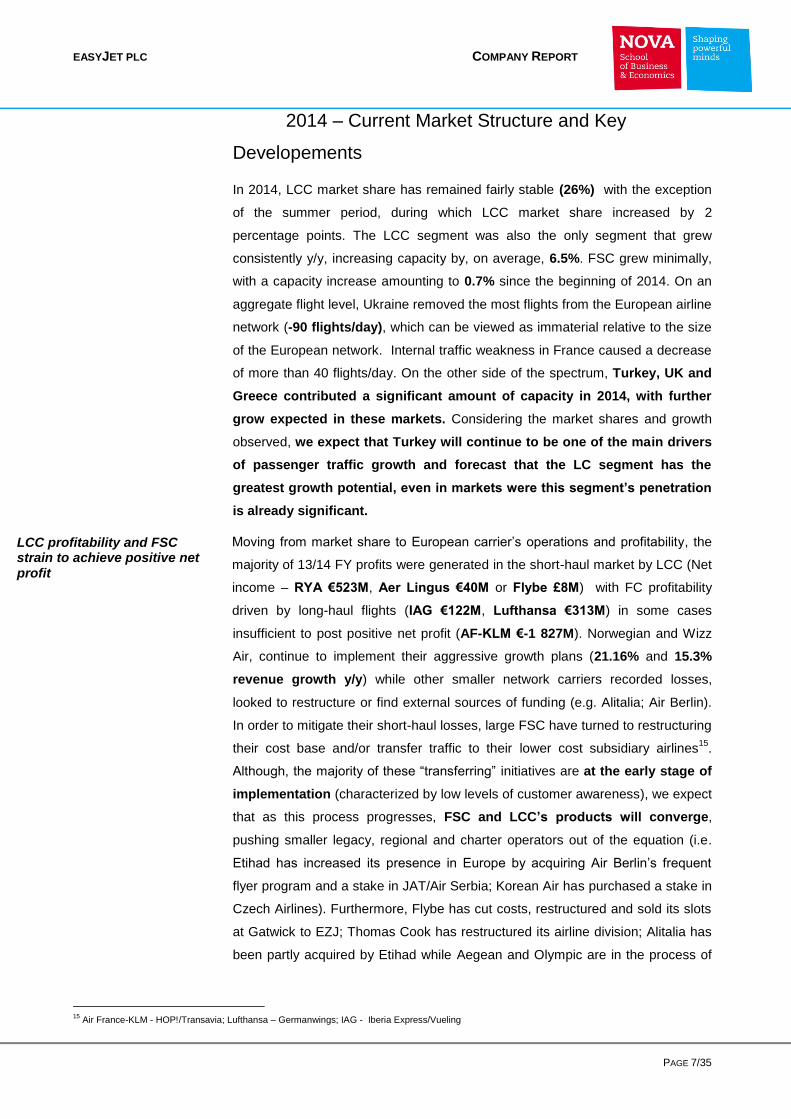
flights offered consistently, recording 18% growth. As far as market structure is
concerned, in 2013, the FSC segment represented the main share of flights in
Europe amounting to 55% (- 3 pp)11
, followed by LCC which constituted 26% (+6
pp) and, finally business aviation, non-scheduled and all-cargo which held a 19%
(-3 pp) (Figure 1a./1b.) stake. This data clearly shows the pending structural
shift in the European airlines industry, which has resulted in the notable growth
of LCC, namely at the cost of legacy carriers.
…However, different typologies in the market segments (LCC vs FSC) can
be observed when the EU Airline Industry is analyzed on a country by
country basis
Despite LCC consistent growth, FSC continue to have a significant share in
most of EU countries (i.e. Scandinavian states values reach 76%. On the
contrary, LCC in Spain account for 46% of the market (+5 pp more than FSC)
and in the UK LCC share amounts to 37%, compared to 46% for FSC. This
evident disparity divides the European market into three arbitrary structural types;
i.e. those characterized by low12
, medium13
and high14
LCC penetration.
9 As of 31.12.2014
10 EUROCONTROL/NMD/STATFOR Market Segments in European Air Traffic 2013
11 Categories: Business aviation, non-scheduled and all-cargo will be ignored or grouped in the latter parts of this report due to their low significance in the
market analysis conducted 12
Greece (20%), Switzerland (25%), France (25%), Finland (26%) 13
Belgium (31%), UK, Portugal (38%), Norway (40%), Germany (41%) 14
Spain, Poland (50%), Ireland (48%) or Italy (48%)
Figure 1a. Market segments share of all flights (ESRA
1) in
2008
Source: EUROCONTROL
Figure 1b. Market segments share of all flights (ESRA
1) in
20131
EASYJET PLC COMPANY REPORT
PAGE 7/35
LCC profitability and FSC strain to achieve positive net profit
2014 – Current Market Structure and Key
Developements
In 2014, LCC market share has remained fairly stable (26%) with the exception
of the summer period, during which LCC market share increased by 2
percentage points. The LCC segment was also the only segment that grew
consistently y/y, increasing capacity by, on average, 6.5%. FSC grew minimally,
with a capacity increase amounting to 0.7% since the beginning of 2014. On an
aggregate flight level, Ukraine removed the most flights from the European airline
network (-90 flights/day), which can be viewed as immaterial relative to the size
of the European network. Internal traffic weakness in France caused a decrease
of more than 40 flights/day. On the other side of the spectrum, Turkey, UK and
Greece contributed a significant amount of capacity in 2014, with further
grow expected in these markets. Considering the market shares and growth
observed, we expect that Turkey will continue to be one of the main drivers
of passenger traffic growth and forecast that the LC segment has the
greatest growth potential, even in markets were this segment’s penetration
is already significant.
Moving from market share to European carrier’s operations and profitability, the
majority of 13/14 FY profits were generated in the short-haul market by LCC (Net
income – RYA €523M, Aer Lingus €40M or Flybe £8M) with FC profitability
driven by long-haul flights (IAG €122M, Lufthansa €313M) in some cases
insufficient to post positive net profit (AF-KLM €-1 827M). Norwegian and Wizz
Air, continue to implement their aggressive growth plans (21.16% and 15.3%
revenue growth y/y) while other smaller network carriers recorded losses,
looked to restructure or find external sources of funding (e.g. Alitalia; Air Berlin).
In order to mitigate their short-haul losses, large FSC have turned to restructuring
their cost base and/or transfer traffic to their lower cost subsidiary airlines15
.
Although, the majority of these “transferring” initiatives are at the early stage of
implementation (characterized by low levels of customer awareness), we expect
that as this process progresses, FSC and LCC’s products will converge,
pushing smaller legacy, regional and charter operators out of the equation (i.e.
Etihad has increased its presence in Europe by acquiring Air Berlin’s frequent
flyer program and a stake in JAT/Air Serbia; Korean Air has purchased a stake in
Czech Airlines). Furthermore, Flybe has cut costs, restructured and sold its slots
at Gatwick to EZJ; Thomas Cook has restructured its airline division; Alitalia has
been partly acquired by Etihad while Aegean and Olympic are in the process of
15
Air France-KLM - HOP!/Transavia; Lufthansa – Germanwings; IAG - Iberia Express/Vueling
EASYJET PLC COMPANY REPORT
PAGE 8/35
Issue of restructuring FSC – as struggling carriers restructure and take out capacity, top discount airlines will most surely take advantage
Hope to increase route density in the European airline network amid airline’s hindered hunt for growth
Observable changes in LCC strategy leading to the creation of hybrid LCC’s
merging their operations. Thus, further consolidation cannot be ruled out and
potential for both organic growth and M&A opportunities seems imminent..
In the absence of Chapter 11 in Europe, restructuring will most probably not
achieve the harmonization between FSC and LCC observed in the US and
European restructuring efforts are not likely to limit the significant growth
appetites of LCC, which are expected to continue expanding and take market
share to the detriment of European FSC. As such, LCC, particularly those with
low costs, superior growth prospects, and strong balance sheets, can be
viewed as best positioned to take advantage of current and future market
developments.
Looking for growth, European carriers have shown a substantial increase in
sector length16
, ranging from i.e. a 40% increase in the case of EZJ to 75%
growth for RYA between 2001 and 2010. However, this strategy i.e. looking
further to find new, economically viable routes is close to running out, due to the
currently developed network of connections throughout Europe. Furthermore,
with the rigid capacity increase, specific to the airline industry (i.e. due to lag in
plane orders and actual delivery - min 1 year or 1-2 years to optimize route
specifics) airlines, both FSC and LCC, will inevitably attempt to increase
capacity by increasing flight frequencies; an action potentially detrimental
to load factors and revenue per seat measures.
With LCC (i.e. RYA) recent strive to increase its presence in primary airports17
, a
certain shift in the LCC model can be observed. Altering and hybridizing the LCC
business strategy is expected to be characterized by greater presence in primary
airports (as opposed to cheaper secondary airports), facilitating transfers,
engaging in code sharing, entering alliances or finally through acquiring other
airlines (further consolidation). LCC’s use of code sharing in the near term is
assessed to be low, however, the currently random connect system between a
LCC and a hub carrier may result in more substantial feeder flows from unique
LCC routes at the hub airport should airlines look to capitalize on this potential –
e.g. only 17.2% of RYA passengers are connected to other flights at
secondary airports. Thus, airlines can achieve this by improving
coordination between the LCC and FSC schedules without incurring costs
associated with fully fledged hubing.
Medium and Long tem Perspective (2015-20124)
16
Sector length - the length of the journey flown by the aircraft, usually provided as an average for a given airline 17
Classification of airport that concerns airports which are among the 100 busiest airports in EU, ranked by total passengers per year, including both terminal and transit passengers

EASYJET PLC COMPANY REPORT
PAGE 9/35
Airline travel reacts strongly to changes in GDP growth rates, thus GDP growth forecasts shed much light on the potential of demand for airline service in a given country
European carriers are expected to record an increase in capacity amounting to
1.8% (+ 0.3 pp) in 2014 and 2.4% (+1.6 pp) for 2015. From 2016, growth is
forecasted to return to stable rates of 3%, however, airport capacity will
increasingly constrain growth in 2017 and 2018. By 2020, it is anticipated that
the annual number of flights will reach 11.2 million, c. 19% more than in 2013.
During the following period (2019-2024) flight growth rates are expected to
continue to hover around 3% (mid/high 2%) as additional capacity is brought into
the market; mainly in Turkey and a number of Eastern European countries
(growth >6%). The 2008 peak of traffic (10.1 million flights) is expected to be
reached again in 2016 (8 year period of growth recovery). Annual growth in
revenue per kilometer is predicted to amount to 2% (pessimistic scenario),
3.5% (base) 3.9% (optimistic) between 2013 and 202418
. We also forecast that
LCC penetration rates will converge towards 40-45% (on the aggregate
European level, currently 36%), creating a much smaller range in LCC
penetration % between countries with high LCC penetration i.e. Spain 65% and
that of low i.e. Switzerland 25% (range currently equal to c.40 pp) to c. 35%.
Macroeconomic Outlook
GDP growth
The growth in airline travel depends greatly on GDP growth and GDP per capita.
Historical data analysis depicts that airline industry growth is high when large
segments of the population reach middle-income status (emerging economies);
it then falls towards the trend rate of GDP growth when the size of the middle
class begins to stabilize. Keeping this relationship in mind, we will now proceed
to analyze GDP growth in Europe.
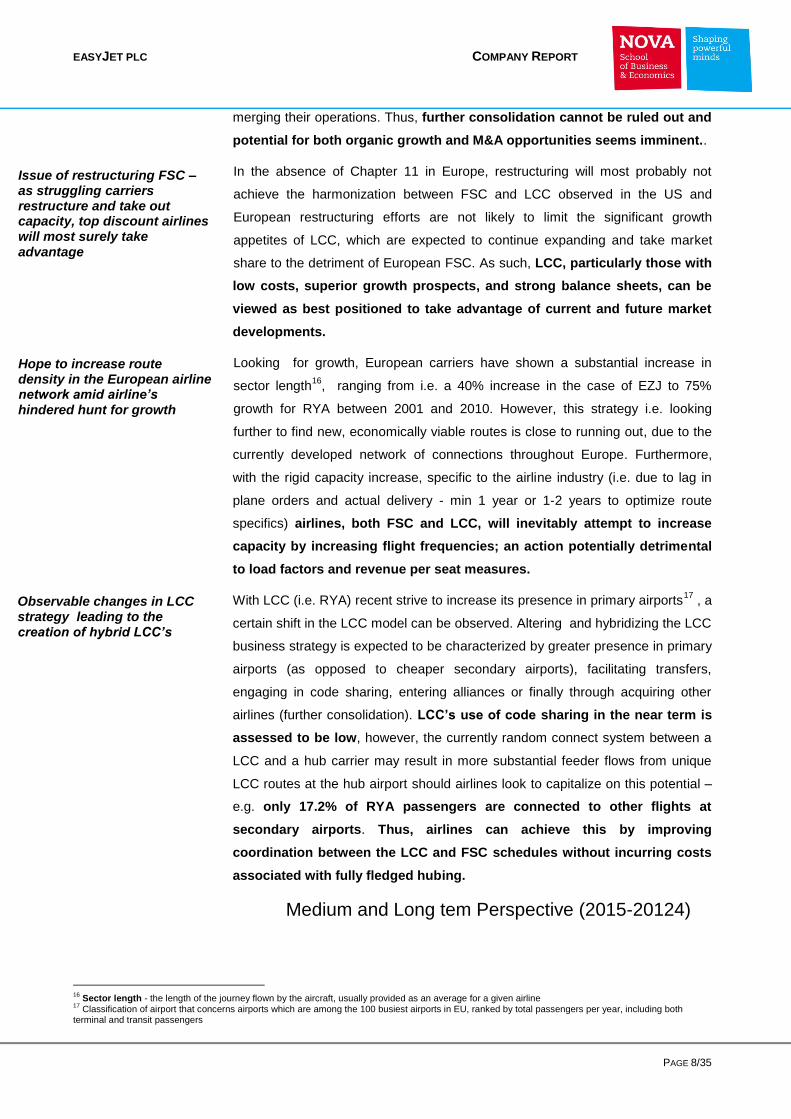
GDP appears to have slightly improved (+0.4% 2013) after -0.2% GDP growth in
2012. Furthermore, GDP growth is projected to increase to +1.5% in 2014
(Figure 2.) but not consistently and some EU states continue to look weak
(2014F; Cyprus -3.9%, Greece -0.1%, Italy -0.2%, Ukraine -5.4%). On an
aggregate level, although ESRA Mediterranean19
is expected to rebound (-0.8%)
and achieve +2.10% in 2020, ESRA East20
and Other Europe21
regions will
experience greater growth (+2.7% and +3.10% respectively) signaling the
potential for airline travel growth in these markets.
18
Based on Airbus Global Market Forecast (GMF) and Analyst estimates. Scenerio analysis will be conducted for EZJ in a latter part of this report 19
Coutries in the Eastern part of Europe: GC, LC, LE, LG, LI, LM, LP ,LT 20
Eastern Europe BK, EP, LA, LB, LD, LH, LJ,LK, LQ, LR, LU, LW, LY, LZ,UK 21
Other European countries not included in the above mentioned categores: BG, BI, EE, EK (Faroe Islands), ENSB (Bodo Oc.),EV, EY, GE, LX, UB, UD, UG,UH, UI, UL, UM, UN, UO, UR, US, UU, UW, Shanwick, Santa Maria, FIR
EASYJET PLC COMPANY REPORT
PAGE 10/35
EUR/USD
USD / EUR exchange rates and jet fuel prices are two common risks factors for
European airlines, both of which are affected significantly by macroeconomic
developments. Apart from influencing airlines’ operating costs and bottom line
(although mitigated by natural or derivative hedging), we have observed that
European airlines’ (i.e. EZJ, RYA, IAG, AF-KLM and Lufthansa) stock price
movements have demonstrated an observable correlation with the EUR/USD FX
rate (Appendix Table 1a./ 1b.) Namely, the depreciation of the USD since Q1
2014 has been parallel to the decrease in main European airline stocks. As of the
date of this analysis22
, EUR has depreciated by (-9%) vs USD, with the MSCI
Europe Airline Index moving in unison (-7%). With the EUR / USD forecasted to
reach 1.2623
(September 2015), when a simple linear regression is applied on
the MSCI Europe Airlines Index, strong predicting power is achieved (R2 = 0.6).
This results in forecasted downside movement in the index (-11%) and a
13% decrease in EZJ stock price EZJ. As for the GBP/USD, a moderate but
significant negative relationship (-0.51) could be observed with the GBP/USD FX
rate and EZJ share price movement (Appendix Table 1c.). This downside
movement in EZJ share price stands in contradiction to our projected share price
upside potential (see valuation section of this report).
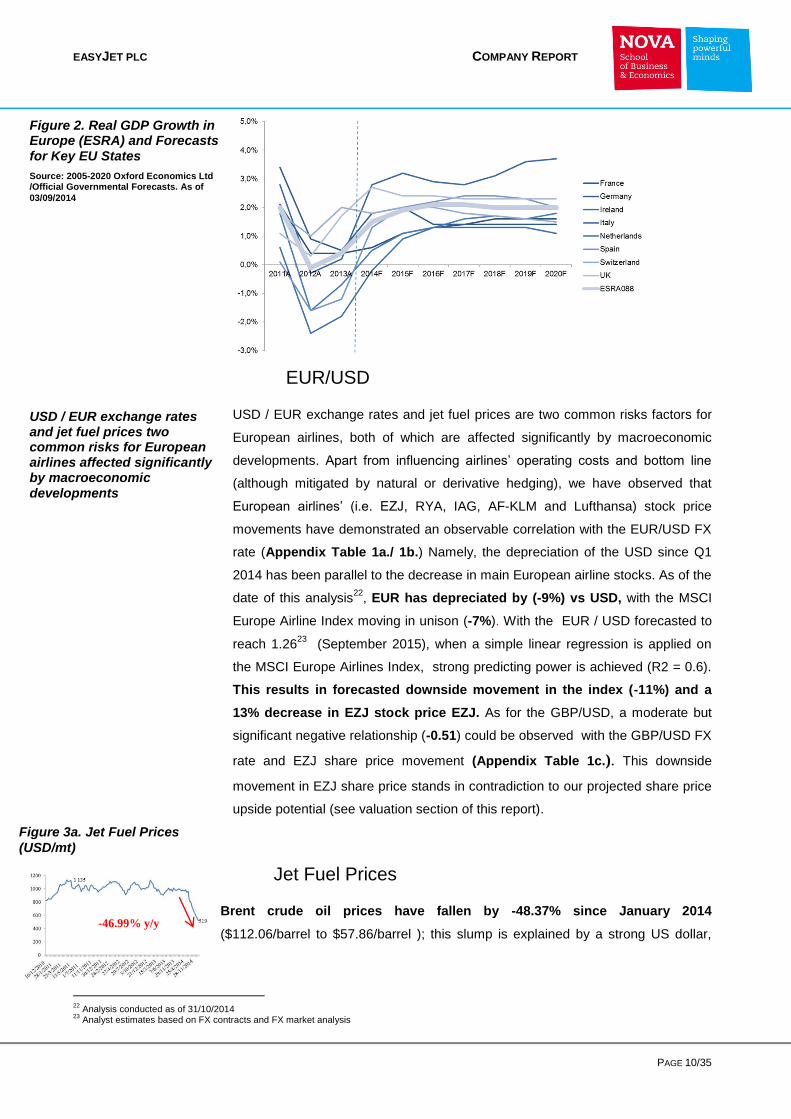
Jet Fuel Prices
Brent crude oil prices have fallen by -48.37% since January 2014
($112.06/barrel to $57.86/barrel ); this slump is explained by a strong US dollar,
22
Analysis conducted as of 31/10/2014 23
Analyst estimates based on FX contracts and FX market analysis
USD / EUR exchange rates and jet fuel prices two common risks for European airlines affected significantly by macroeconomic developments
Figure 2. Real GDP Growth in Europe (ESRA) and Forecasts for Key EU States
Source: 2005-2020 Oxford Economics Ltd /Official Governmental Forecasts. As of
03/09/2014
-46.99% y/y
Figure 3a. Jet Fuel Prices
(USD/mt)

EASYJET PLC COMPANY REPORT
PAGE 11/35
abundant supply (held up by OPEC’s24
decision to maintain production levels
despite price slash) and slowing demand growth (i.e. China). Jet Oil reached
$65.5/barrel or c. $519/metric ton (-46.99% y/y) (Figure 3a). The EUR
depreciated to its lowest level against the dollar since May 2013, therefore
making it more expensive for European airlines to purchase oil (priced in USD).
Fuel price of $99.90/barrel is anticipated in 201525
, down significantly from
$116.60/b in 2014 and $124.50/b in 2013. On this note, European airline profits
are expected to increase in line with the decreasing fuel prices but much of
the potential cost savings will be mitigated by hedging policies
implemented by airlines (on average airlines hedge 70-90% of fuel needed in
FY+1 and 50-60% in FY+2). Brent crude forward curves forecast slight upward
movement in the following two years, supported by markets participants
expectations as to price increase in the medium term (Figure 3b.)
Other variables
Inflationary environment
Inflation rate in the Europe is projected to remain fairly low (+0.3% 2014;
0.19% 202426
). Thus, we expect changes in airline fares (due to inflation) to
remain miniscule, while changes in airline’s inflation-linked operating costs (e.g.
regulated/non-regulated airport charges) to remain stable.
Business Confidence and Consumer Spending
With GDP growth improving sluggishly business confidence, consumer
confidence and spending are sending mixed messages. Business confidence is
up from low 0.02 to 0.18 in Nov 2014 and is projected to hover around 0.12 in
202427
. Consumer confidence is decreasing (-11.6 Nov 2014) and is expected to
remain at that given level. In line with this, consumer spending (1 417.1) is also
forecasted to rise minimally and remain fairly constant in the medium and long
term (1 423 in 2024).
Regulatory Environmet
The regulatory environment continues to have a significant impact on
European LCC (despite progress made in airspace costs and increased
competition on restricted routes), as protectionism (e.g. state subsidy of failing
carriers) is still present. Additionally, uneconomic increases in prices by
24 OPEC at a Nov. 27 meeting this year decided against cutting output. Despite its own forecasts of a growing surplus, the group opted to defend its market share against shale oil and other rival supply sources. 25
IATA estimates 26
ECB and official governmental data for remaining EU countries 27
European Commission and official governmental data for remaining EU
As economic data (consumer and employment numbers in particular) start to rebound, airline stocks often follow. Thus inflation, business an
EU Regulation – no significant changes expected although the current regulatory environment is certainly more
harsh for LCC
Inflationary environment is expected to remain benign for the European Airline Industry
Business Confidence and Consumer Spending as Key Variables Effecting Air Travel Propensity
Figure 3b.Jet Fuel Futures (USD/mt)

EASYJET PLC COMPANY REPORT
PAGE 12/35
monopoly infrastructure providers, continual increases in taxes on aviation across
Europe and aviation’s reduced role in (EU ETS28
) remain a threat, especially for
the LCC business model
.
easyJet plc
Company Description
EasyJet is a British low cost carrier operating in the European short haul segment
with a market share (Europe) of 8.3%. It is the largest airline in the United
Kingdom, considering the number of passengers carried, operating domestic
and international scheduled services on 675 routes in 32 countries. The airline
has developed strong positions in a number of key European markets (#1 in 24
airports with 48% of total capacity allocated and # 2 in 29 airports – 29%
capacity29
)
Shareholder Structure
EasyGroup Holdings Ltd (investment vehicle belonging to EZJ founder Sir Stelios
Haji-loannou and family) and Polys Haji-loannou, both directly or indirectly held
by Sir Stelios Haji-loannou, are combined the company’s largest stakeholder with
a 36.9% stake (Table 2.).
Dividend Policy
EZJ adopted a dividend policy with a dividend payout ratio amounting to 33 1/3%
of profits in 2011 only to raise it to 40% in September 2014 (LTM Dividend Yield
amounting to 3.19%). EZJ has over the past 3 years paid out in total £589M, both
in the form of ordinary and special dividends, setting a precedence for LCC. Rival
European LCC, RYA implemented a share buyback paying out €390M ($480M)
in 2014 which is expected to expand to €600M ($738M) by 2015 (equivalent to
3.7% and 5.5% LTM dividend yield). Legacy carriers, on the other hand,
troubled with achieving sustainable profitability, have in the past, and
currently shun away from paying out dividends (excl. Lufthansa 2.94%).
28
EU efforts to increase the importance of its emission trading scheme (ETS) and the expected increase in price of carbon whose price has been benign for the airline industry till the date of this report 29
Company estimates based on OAG data
Table 2. Shareholder’s Structure

EASYJET PLC COMPANY REPORT
PAGE 13/35
Thus, continued dividend payouts will continue to stand at the core of EZJ’s
equity story with the probability of special dividends being paid greater in the
next 5-10 years as the company further increases ( EPS - £1.61 FY15, £2.74
FY19, £2.40 FY24 and DPS – £0.45 FY15, £1.00 FY19, £1.23 FY24 )30
its net
cash position (£1 659M FY19, £1 999M FY24)
Business Operations
Air Travel
In the 12 months to September 2014, European short-haul capacity increased by
4.3% (3.0% in EZJ markets) while EZJ seat growth surpassed this rate (5.1%).
However, capacity and demand are not expected to be broadly aligned over
the next 5 years due to the following factors: significant increase in short-haul
European fleet orders (4 year highs for both Boeing (1 083 orders) and Airbus (1
068), conservative assumptions on aircraft retirements and GDP growth in EZJ
main markets31
Key Business Trends
Focus on Yield Management – targeting both business and affluent older
passengers (PAX) - EZJ is attracting more affluent older PAX (av. age of EZJ
customers 41.5; +1.2 years vs 2009) and business passengers (market share
+4%; 12M PAX p.a.32
). These two groups of customers are characterized by
significant growth potential, firstly, due to EZJ current business passenger
penetration (20%) being much lower than the average for European legacy
carriers – 49%33
. Secondly, in terms of trade-offs between price and quality34
, at
least a proportion of business travelers currently flying short or medium haul
flights are ready to sacrifice i.e. in-flight service in exchange for lower prices.
Greater awareness of the traits of low cost flights may affect how they are valued.
Huse and Evangelho (2007) found that travelers who had flown often with LCC
put smaller strain on loyalty programs or inflight services. This observation could
be viewed as favourable for EZJ, since in the case of business travelers, Huse
and Evangelho underline that greater experience of flying with LCCs is positively
and significantly correlated to higher perception of flight quality and a smaller to
that of price. For the tourist travelers (min 25% on each EZJ flight35
), the
relationship is statistically significant, and positively correlated to flight quality and
30
Given no M&A activity or other developments requiring a significant amount of cash 31
EZJ key markets include: United Kingdom, France, Switzerland, Italy, Germany, Portugal and Spain. Developments in these markets will be presented in the EZJ Key Markets section of this report 32
20-24% of seats sold targeted in 2014/15 vs 18% in 2010/11 which implies passenger growth above the expected market trend 33
Analyst estimation based on data provided by the following legacy carriers: International Consolidated Group, Duetsche Lufthansa AG and Air France-KLM 34
Analysis of the profile of business and leisure travelers using LCC 35
Company Data
EASYJET PLC COMPANY REPORT
PAGE 14/35
proximity of airport to destination, yet not price. Thus, EZJ could maximize its
revenues by fare differentiation, and in particular, charging higher fares to those
who book closer to take-off time, often business travelers that are fairly fare
insensitive because they have to make the flight at short notice. EZJ has done
just that in the previous FY, i.e. continuing to drive sales of new business
products, such as inclusive fare and flexi fare (+48% y/y). EZJ also grew its
managed business with those corporates where EZJ has a contractual
relationship (by 10% y/y). EZJ sales through dedicated business channels (e.g.
Global Distribution Systems, API and on-line booking tools) increased by 34%.
These efforts, in our opinion will translate into both an increase in business
travelers (+ 6.23% p.a. 2014-2019) and revenue per seat (+3.8% CAGR 2014-
2019).
Capitalizing on FSC Retrenchment – Potential Market Share. Retrenchment
by less efficient FSC can be viewed as an opportunity for EZJ to continue to take
profitable share in its core markets (greater overlap with FSC than other LCC due
to EZJ great presence in primary airports – remains FSC bridgehead). FSC are
only at the beginning of their restructuring efforts and this market structure
change story is, in our opinion, equally important to economic variables (i.e. GDP
growth or fuel prices)36
.
End of EZJ and RYA Duopoly? - RYA previous strategy, which focused on
presence in secondary airports resulted in RYA with a market share c.75% at
nearly 50% of its bases and 80% of routes not contested by any other
carrier (shows how EZJ and RYA have been able to function not disturbing each
other i.e. duopoly). This strategy has, however, reached its limits and is no longer
sustainable since the density on RYA routes is insufficient to allow RYA to
generate greater frequencies. Furthermore, RYA strong growth shows (4.13%
CAGR PAX 2010-2014) that RYA is mainly capable of starting thin routes, an
indication of a saturating market and future/existing route density problems
in both RYA markets and the European network as a whole . This further
explains RYA recent announced plans to increasingly shift from low yield
secondary airports to major airports, which will result in an imminent increase in
capacity concentrated mainly at major airports. Although, the implementation of
this strategy is expected to take time (due to e.g. slot constrains), EZJ is
expected to be affected in the medium term (2-5 years). Additionally, the EC
lenient approach to regional airport sweeteners37
will further, although not on a
scale expected, had the approach been different, strengthen RYA cost
36
Potential opportunities within current network; c. 86M (28M – thickening routes; 33M – connecting network points; 25M- expanding existing network); based on Management projections and analysts analysis 37
European Commission guidelines will allow airports with < 3M PAX per year to offer cut-price deals to airlines and receive public funds for investment in infrastructure – to end by 2024. It will means that 28 ongoing investigations into subsidized regional airports – majority involving RYA – will now be decided under the new, more lenient rules.

EASYJET PLC COMPANY REPORT
PAGE 15/35
advantage (highly dependent on indirect state subsidies) and incentivize RYA to
pursue its change in strategy.
EZJ Key Markets
o United Kingdom
EZJ is UK’s largest short-haul carrier (Market share c. 20%38
; 5.6% Retail Value
RSP39
Figure 4.). EZJ forecasted capacity growth in the UK amounts to +2.5%
in H1 2015. London Gatwick is currently facing yield pressure as EZJ optimizes
the slot portfolio it acquired from Flybe. This is expected to continue until the 2H
2015, based on management forecasts and historical analysis, which show that it
takes EZJ around 12 to 18 months to optimize its slot portfolios. Furthermore,
given EZJ significant concentration (c. 45% of EZJ capacity and 56% market
share) at Gatwick, continued yield weakness is expected to have a large impact
on EZJ yields. Advanced plans to build a “LCC single terminal” is expected to
bring, on the one hand, operational efficiencies and the threat of an increase in
landing charge on the other40
. An increase in new slots available due to airport
enlargement is unavoidable with further yield pressure viewed as imminent.
Norwegian plans to increase capacity (+4.6% - mainly international flights) and
potential for a decrease in demand as RYA increases capacity at Stanstead by
1M ( 5% route overlap) stand behind EZJ moderate projected growth in UK.
38
Market share computed based on capacity provided by each airline (same approach throughout this section of the report) 39
RSP – market share computed based on revenue – calculated as the percentage of total revenue generated by airlines in a given market (same approach throughout this section of the report) 40
EasyJet makes on average £8 profit per seat. If Gatwick’s charges double ( £9 to £18 predicted by Airports Commission) EZJ will be materially effected
IAG +20 pp – BA & Iberia merger 2011
Source: Passport Euromonitor International
Figure 4. UK - Top 5 Airlines - Company Market Shares (% of
Total revenues)
Strong IAG
+ 14.2pp over EZJ (#4)

EASYJET PLC COMPANY REPORT
PAGE 16/35
o France
France continues to be EZJ fortress41
(Market share c.14%; RSP 6.4% 2013
(Figure 5.)) EZJ is expected to grow its capacity in 1H15 by +4.6%. Looking
forward, EZJ aims to address regional demand ( domestic42
and international
flights) and become the alternative carrier to Air France (RSP 42.8% 2013). AF-
KLM recently decided to abandon expansion of Transavia (planned investment
amounting to €1B) which entailed the further international expansion (increase
the number of international flights to and from 3 main French airports) of the low
cost segment of AF-KLM operations. We view this as a positive development for
EZJ since AF-KLM decision to scale back on its plans, Air France-KLM plans to
expand Transavia on its domestic market but EZJ cost base is more competitive
o Switzerland
EZJ grew its capacity in this market by + 6.8% y/y and plans to continue solid
growth in 1H115 (+6.3%) and is currently number 2 (Figure 6.) with a 55.8 pp
differential to Lufthansa, ranked first. Growing Etihad Regional in Switzerland
41
Orly – 13th largest airport in Europe, c.29m seats/year, EZJ #2 with 12% MS; Charles de Gualle – 4th largest airport in Europe, c.45m seats/ year, EZJ #2 with 11% MS. Capacity growth amounting to 11% CAGR and returns 13% CAGR over the past 5 years. 42
Air France (via Hop!) account for 76% of French domestic capacity
Source: Passport Euromonitor
International
Figure 5. France - Top 5 Airlines - Company Market Shares (%)
Figure 6. Switzerland - Top 5 Airlines - Company Market
Shares (%)
Strong AF-KLM
+ 36.4pp over EZJ (#2)
Lufthansa (#1)
+ 55.8 pp above EZJ (#2)
Source: Passport Euromonitor International

EASYJET PLC COMPANY REPORT
PAGE 17/35
(business founded from former Swiss regional airline Darwin) whose regional
proposed product will in no way compete with EZJ unit cost, could certainly,
however, destabilize yields on short-haul routes.
o Germany
EZJ increased its capacity in this market by +6.7% y/y and plans to continue
with expected 1H115 capacity growth amounting to +14%. However, EZJ
market share continues to be minuscule (c. 0% RSP 2013 (Figure 7.). EZJ has
performed well in Berlin (taking share from Lufthansa as it transfers domestic
traffic to Germanwings) and is in a strong position to drive substantial returns
when the new Brandenburg airport eventually opens (c. 2017) due to planned
greater slot allocation . Germany has very low penetration of its domestic market
by foreign carriers, with 99% of domestic market seats operated by German
carriers (71% Germanwings; Air Berlin43
27%), making EZJ efforts to expand in
the packed German market a great effort. Moreover, only 16% of Germany’s
domestic capacity is operated by LCC, which explains EZJ “tip-toe” approach to
the German market.
o Spain and Portugal
43
Expected to increase in the medium term as Etihad Airways (49% stake in airberlin) planes to increase its involvement in Europe (esp. in the German market)
Figure 7. Germany - Top 5 Airlines - Company Market
Shares (%)
Figure 8. Spain and Portugal - Top 5 Airlines - Company
Market Shares (%)
Lufthansa (#1) EZJ market share c.0%
Spain – IAG (#1), EZJ not in the Top 5 with market share of 2.2% Portugal – TAP (#1), EZJ (#4) with market share of 4.6%
Source: Passport Euromonitor
International
Source: Passport Euromonitor
International

EASYJET PLC COMPANY REPORT
PAGE 18/35
Spain has a similar profile to France in that 81% of domestic capacity is operated
by Spanish FSC carriers (51% LCCs). After reallocating its Spanish bases, EZJ
has held its ground with 2.2% RSP 2013 (Figure 8.) and has achieved a
noteworthy presence in Lisbon (12% MS). In the case of Spain, projected
1H115 capacity decrease amounting to -2% reflects our anticipation of LCC
overcapacity in the Spanish market (i.e.Vueling planned to increase its capacity
by +22% in 4Q14).
o Italy
EZJ is the third largest carrier in Italy, with a market share of 12% and 5.6%
RSP 2013 (Figure 9.). Like Spain, Italy also has a relatively high penetration of
LCC in its domestic market; 52% seats operated by LCCs. Italy is the only
country in Europe where almost half of all domestic seats are operated by foreign
carriers. Alitalia accounts for 42% of domestic capacity; RYA (31%) and EZJ
(11%). EZJ grew in capacity + 6.2% over the previous year and with solid
positions at its key bases (Milan Malpensa, Rome Fiumicino and Naples) we
project an increase in capacity amounting to +5.3% in 1H15. Overcapacity in
Rome Fiumicino poses a relatively small risk to EZJ since Vueling (main capacity
contributor) and RYA have and plan to grow capacity in the domestic Italian
market while EZJ is strong in international routes in and out of Italy. As far as
recent developments are concerned, Ethihad’s further stake purchase of Alitalia
will, we expect, to continued “taking out” of capacity. However, since both Vueling
and RYA plan to increase capacity at their Italian bases, incremental capacity
will be minimal.
o Other Markets
EZJ plans to increase its capacity significantly in the Netherlands 1H115 by
+13.4% y/y. Longer distance routes - Israel (250,00 seats <1% of the group
capacity) and Moscow remain in EZJ strategy with the yield on the latter route
severely marked by the Ukraine-Russian conflict. A potential threat to EZJ
Russian and Middle East operations stands RYA who could potentially “step into
Figure 9. Italy - Top 5 Airlines - Company Market Shares (%)
Source: Passport Euromonitor
International
EASYJET PLC COMPANY REPORT
PAGE 19/35
” EZJ territory, should RYA receive a Cypriot Aircraft Operators Certificate (AOC)
from Cyprus’ Department of Civil Aviation. This would negatively affect EZJ since
Cyprus’ bilateral agreements with third non EU countries would enable RYA to fly
to Russia and the Middle East thus, increasing capacity (potential yield pressure).
EZJ also plans to increase capacity in Brussels and Greece (i.e. Athens) which
we view positively due to low LCC penetration in both of these areas.
Ancillary Business
EZJ ancillary business remains non - core (1.4% of total revenues FY14).
Partnerships with service providers e.g. EZJ Holidays & Hotelopia, Booking.com,
Europcar have contributed minimally to developing EZJ core product as the
actual conversion rates of these initiatives remain minuscule (non-seat revenue
decreased in 2H14 to £0.99 after having high of £1.14 in 2H13). Looking
forward, we project that EZJ non-seat revenue/seat performance will stabilize
and hover around £1.04 to £1.14 as commissions from travel insurance and in-
flight sales increase only slightly. With growth of seat revenue surpassing that of
non-seat, this figure/value as % of total revenue will amount to 1.28% in 2019
and 1.23% in 2024.
Financial Analysis and Forecasts
Key Revenue Drivers
ASK and seats flown
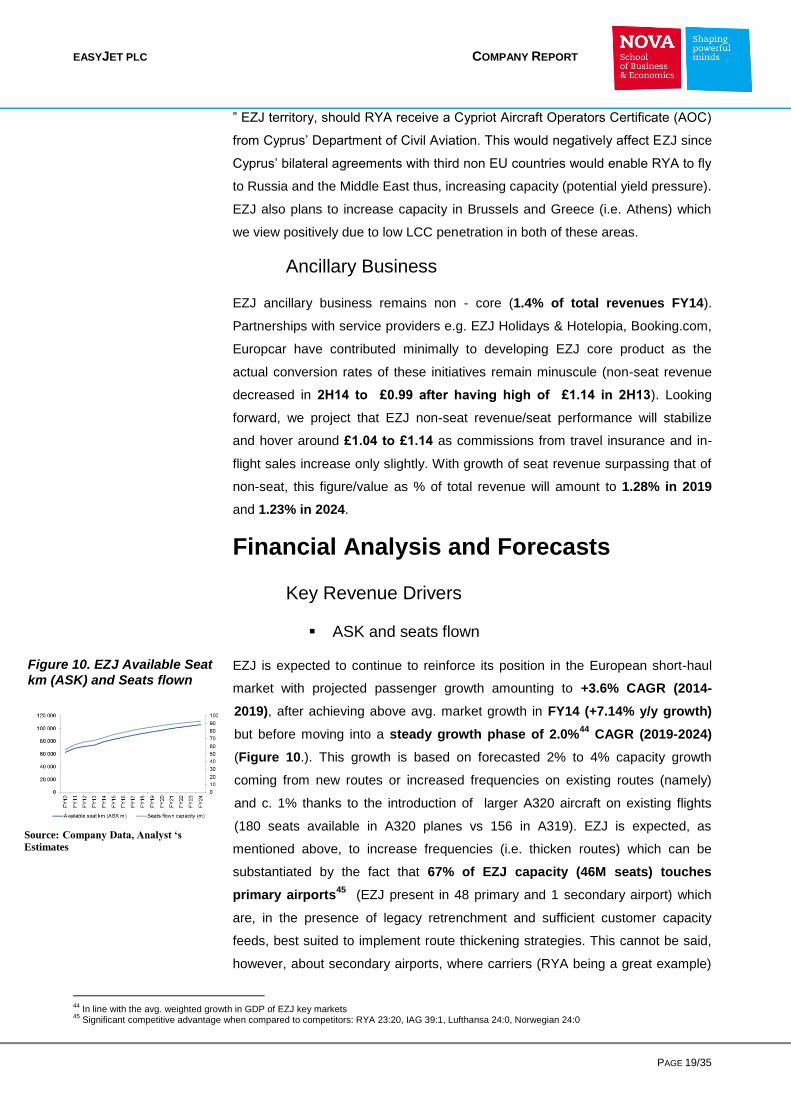
EZJ is expected to continue to reinforce its position in the European short-haul
market with projected passenger growth amounting to +3.6% CAGR (2014-
2019), after achieving above avg. market growth in FY14 (+7.14% y/y growth)
but before moving into a steady growth phase of 2.0%44
CAGR (2019-2024)
(Figure 10.). This growth is based on forecasted 2% to 4% capacity growth
coming from new routes or increased frequencies on existing routes (namely)
and c. 1% thanks to the introduction of larger A320 aircraft on existing flights
(180 seats available in A320 planes vs 156 in A319). EZJ is expected, as
mentioned above, to increase frequencies (i.e. thicken routes) which can be
substantiated by the fact that 67% of EZJ capacity (46M seats) touches
primary airports45
(EZJ present in 48 primary and 1 secondary airport) which
are, in the presence of legacy retrenchment and sufficient customer capacity
feeds, best suited to implement route thickening strategies. This cannot be said,
however, about secondary airports, where carriers (RYA being a great example)
44
In line with the avg. weighted growth in GDP of EZJ key markets 45
Significant competitive advantage when compared to competitors: RYA 23:20, IAG 39:1, Lufthansa 24:0, Norwegian 24:0
Figure 10. EZJ Available Seat
km (ASK) and Seats flown
Source: Company Data, Analyst ‘s
Estimates
EASYJET PLC COMPANY REPORT
PAGE 20/35
are finding it hard to find demand to match increased frequencies. Our estimates
indicate that c. 91 million seats are currently offered by non-LCC carriers
on point-to-point routes, which when juxtaposed with EZJ significant cost
advantage, sets economically sound foundations for successful route
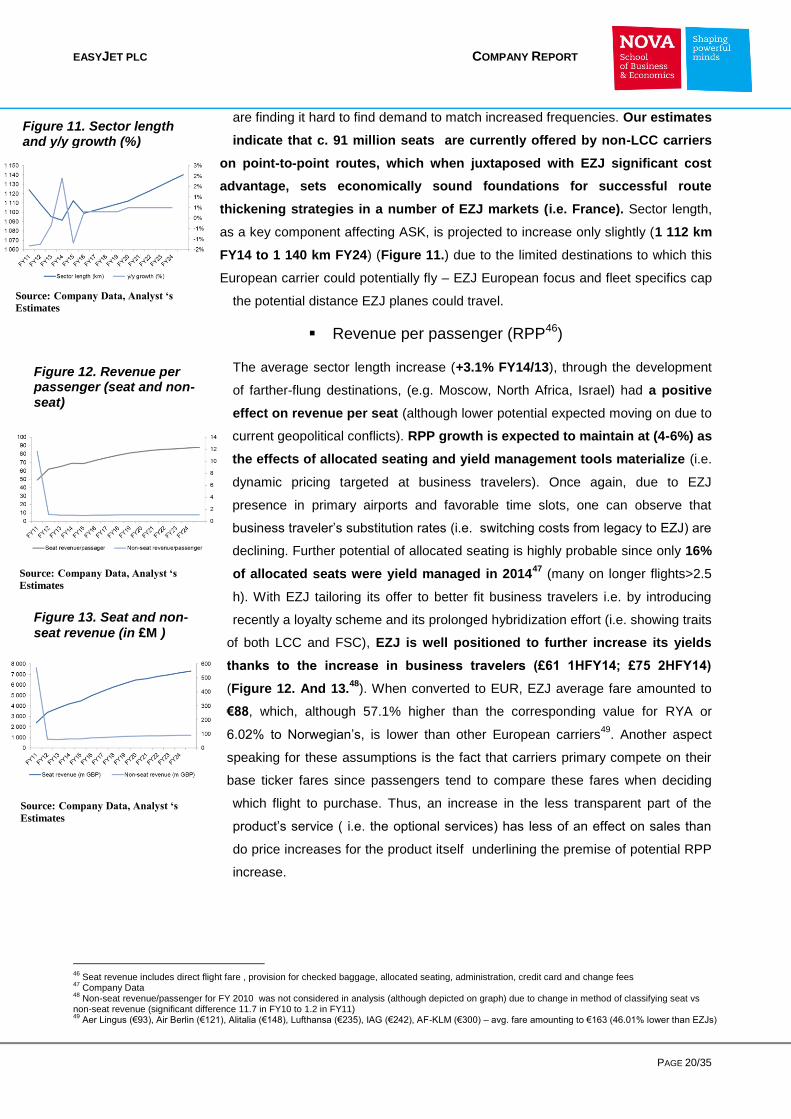
thickening strategies in a number of EZJ markets (i.e. France). Sector length,
as a key component affecting ASK, is projected to increase only slightly (1 112 km
FY14 to 1 140 km FY24) (Figure 11.) due to the limited destinations to which this
European carrier could potentially fly – EZJ European focus and fleet specifics cap
the potential distance EZJ planes could travel.
Revenue per passenger (RPP46)
The average sector length increase (+3.1% FY14/13), through the development
of farther-flung destinations, (e.g. Moscow, North Africa, Israel) had a positive
effect on revenue per seat (although lower potential expected moving on due to
current geopolitical conflicts). RPP growth is expected to maintain at (4-6%) as
the effects of allocated seating and yield management tools materialize (i.e.
dynamic pricing targeted at business travelers). Once again, due to EZJ
presence in primary airports and favorable time slots, one can observe that
business traveler’s substitution rates (i.e. switching costs from legacy to EZJ) are
declining. Further potential of allocated seating is highly probable since only 16%
of allocated seats were yield managed in 201447
(many on longer flights>2.5
h). With EZJ tailoring its offer to better fit business travelers i.e. by introducing
recently a loyalty scheme and its prolonged hybridization effort (i.e. showing traits
of both LCC and FSC), EZJ is well positioned to further increase its yields
thanks to the increase in business travelers (£61 1HFY14; £75 2HFY14)
(Figure 12. And 13.48
). When converted to EUR, EZJ average fare amounted to
€88, which, although 57.1% higher than the corresponding value for RYA or
6.02% to Norwegian’s, is lower than other European carriers49
. Another aspect
speaking for these assumptions is the fact that carriers primary compete on their
base ticker fares since passengers tend to compare these fares when deciding
which flight to purchase. Thus, an increase in the less transparent part of the
product’s service ( i.e. the optional services) has less of an effect on sales than
do price increases for the product itself underlining the premise of potential RPP
increase.
46
Seat revenue includes direct flight fare , provision for checked baggage, allocated seating, administration, credit card and change fees 47
Company Data 48
Non-seat revenue/passenger for FY 2010 was not considered in analysis (although depicted on graph) due to change in method of classifying seat vs non-seat revenue (significant difference 11.7 in FY10 to 1.2 in FY11) 49
Aer Lingus (€93), Air Berlin (€121), Alitalia (€148), Lufthansa (€235), IAG (€242), AF-KLM (€300) – avg. fare amounting to €163 (46.01% lower than EZJs)
Figure 16. Seat and non-seat per passenger (in £)
Figure 13. Seat and non-
seat revenue (in £M )
Figure 11. Sector length and y/y growth (%)
Figure 12. Revenue per passenger (seat and non-seat)
Source: Company Data, Analyst ‘s
Estimates
Source: Company Data, Analyst ‘s
Estimates
Source: Company Data, Analyst ‘s
Estimates
EASYJET PLC COMPANY REPORT
PAGE 21/35
Load Factors
EZJ is expected to maintain its load factors at c. 87% in 1H and c. 90% 2H (avg.
industry – 80%) as the company attempts to maximize yields in a less benign,
characterized by “overcapacity” state of the world (2016-2020).
Divisional Breakdown of Revenue
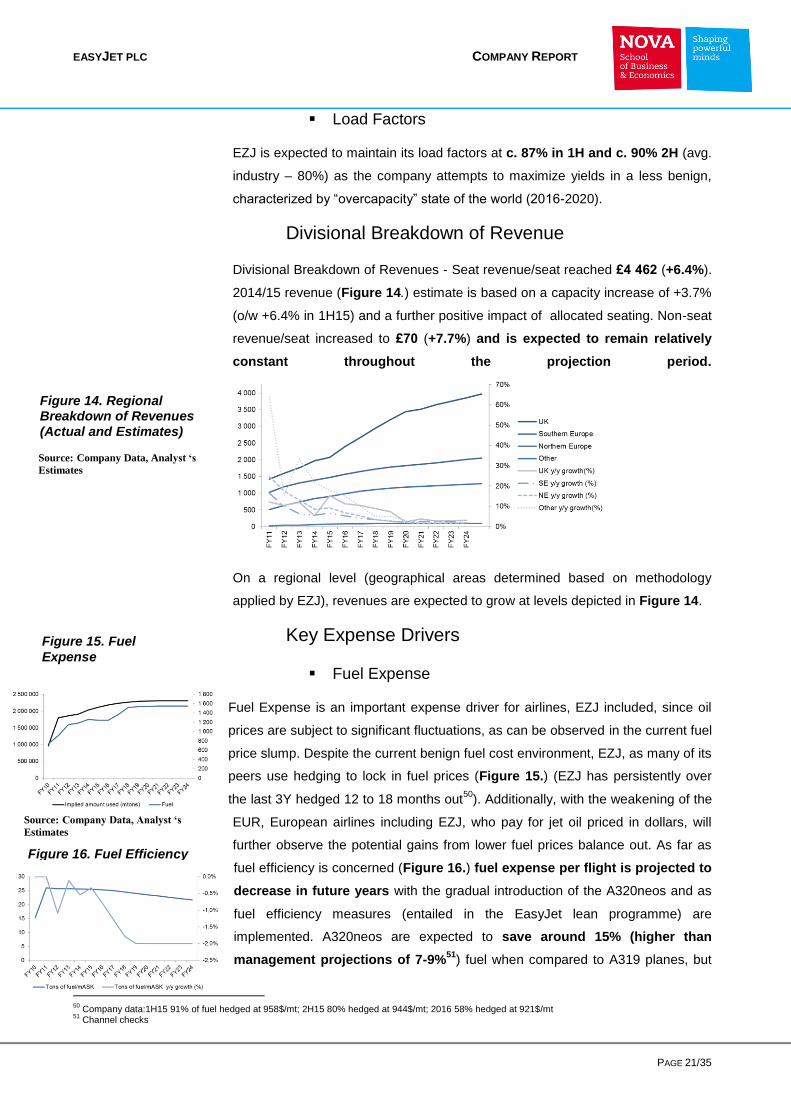
Divisional Breakdown of Revenues - Seat revenue/seat reached £4 462 (+6.4%).
2014/15 revenue (Figure 14.) estimate is based on a capacity increase of +3.7%
(o/w +6.4% in 1H15) and a further positive impact of allocated seating. Non-seat
revenue/seat increased to £70 (+7.7%) and is expected to remain relatively
constant throughout the projection period.
On a regional level (geographical areas determined based on methodology
applied by EZJ), revenues are expected to grow at levels depicted in Figure 14.
Key Expense Drivers
Fuel Expense
Fuel Expense is an important expense driver for airlines, EZJ included, since oil
prices are subject to significant fluctuations, as can be observed in the current fuel
price slump. Despite the current benign fuel cost environment, EZJ, as many of its
peers use hedging to lock in fuel prices (Figure 15.) (EZJ has persistently over
the last 3Y hedged 12 to 18 months out50
). Additionally, with the weakening of the
EUR, European airlines including EZJ, who pay for jet oil priced in dollars, will
further observe the potential gains from lower fuel prices balance out. As far as
fuel efficiency is concerned (Figure 16.) fuel expense per flight is projected to
decrease in future years with the gradual introduction of the A320neos and as
fuel efficiency measures (entailed in the EasyJet lean programme) are
implemented. A320neos are expected to save around 15% (higher than
management projections of 7-9%51
) fuel when compared to A319 planes, but
50
Company data:1H15 91% of fuel hedged at 958$/mt; 2H15 80% hedged at 944$/mt; 2016 58% hedged at 921$/mt 51
Channel checks
Figure 15. Fuel
Expense
Figure 16. Fuel Efficiency
Figure 14. Regional Breakdown of Revenues (Actual and Estimates)
Source: Company Data, Analyst ‘s
Estimates
Source: Company Data, Analyst ‘s
Estimates

EASYJET PLC COMPANY REPORT
PAGE 22/35
the cost effect will not be material until only at the end of the projection period
when this A320neo planes start to make up a significant portion of EZJ fleet i.e.
12% of fleet by 2019 and 29% by 2024.
Non-Fuel Expense
Non- fuel expenses are expected to be affected by a number of efficiency
measures, one of which is the EZJ Lean programme, a cost savings plan
whose overarching aim is to ensure cost/seat (excluding fuel costs) growth be
below inflation in the next 5 years. In FY13, cost savings amounted to a £43M
(cumulative £143M) and were the result of various actions, such as:
renegotiation of ground handling contracts, agreements with non-regulated
airports (potential for decrease in Airport and Navigation charges), the
introduction of lightweight trolleys and one engine taxing. In this fiscal year, EZJ
set ground operations, crew flexibility and engineering and maintenance
(renegotiation of 95% of annual contracts, review of options available from full
insource to full outsource) at the focal point. In FY15 and onwards, EZJ is
expected to focus on decreasing fuel consumption (i.e. by introducing lightweight
seats), navigation, maintenance and engineering and maintenance through a
number of lobbying measures, working with European authorities to optimize
airspace fees. The extent of measures entailed in the programme are,
however, in our opinion, insufficient to achieve the overarching aim of
ensuring cost/seat (excluding fuel costs) growth below inflation (1% in
November 2014 and forecasted to reach 2.38% in 2024). Our more conservative
non-fuel expense estimates are depicted in Figure 17.
EBITDAR and EBITDAR margin (%)
EBITDA/ R & EBITDA/ R margin (%) EZJ benefited from higher load factor
(89%), more A320s in its fleet, a moderate increase in fuel costs (+7.3%) and
non-fuel cost management which attenuated the higher charges at regulated
airports and de-icing costs. 2014/15 EBITDA/R (21%) estimate takes into
account a stable load factor at a historic high level, a moderate decrease in fuel
costs (a significant proportion already hedged) and further cost-savings related to
the EZJ Lean programme.
CAPEX, Depreciation and Fleet Projections
EZJ has exercised 33 options and two purchase rights over current generation
A320s (35 aircraft are to be delivered between 2015 and 2017) and continues to
have six options and 29 purchase rights. The company has also entered into a
new contract for 100 new generation A320neo 180 seat aircraft for delivery
between 2017 and 2022 as well as additional purchase rights (for A320neo family
Figure 17. Non-Fuel Expense
Source: Company Data, Analyst ‘s
Estimates
EASYJET PLC COMPANY REPORT
PAGE 23/35
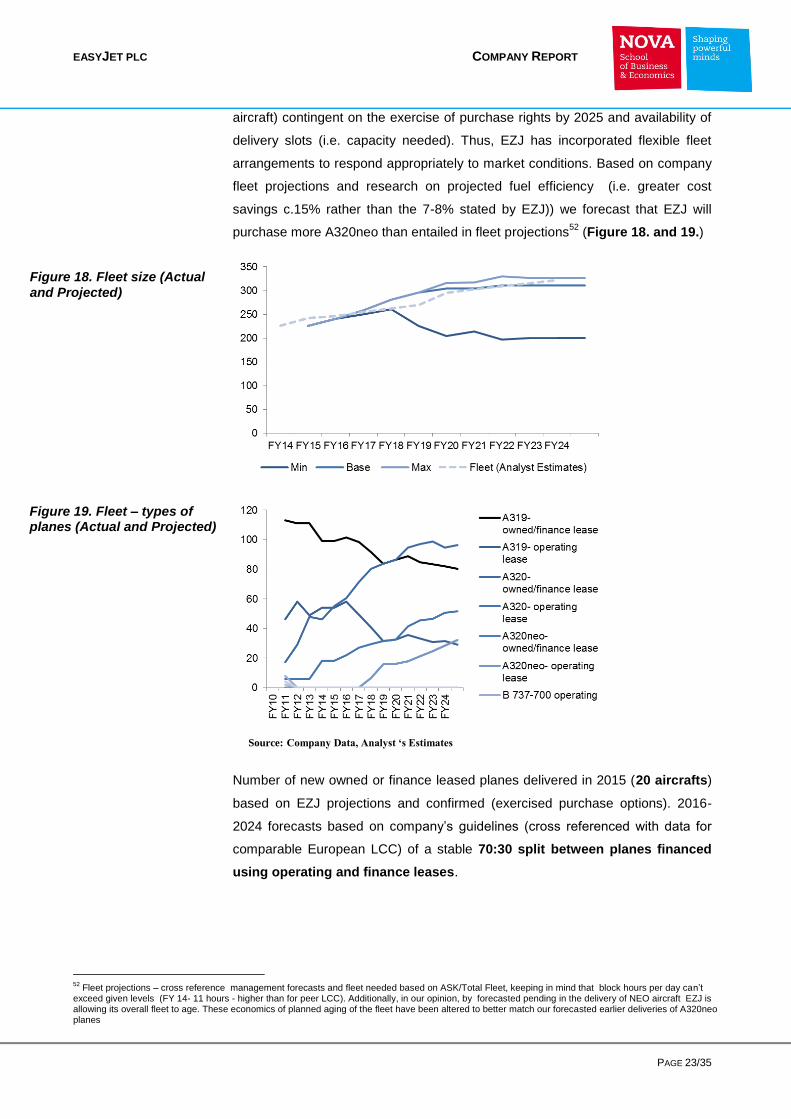
aircraft) contingent on the exercise of purchase rights by 2025 and availability of
delivery slots (i.e. capacity needed). Thus, EZJ has incorporated flexible fleet
arrangements to respond appropriately to market conditions. Based on company
fleet projections and research on projected fuel efficiency (i.e. greater cost
savings c.15% rather than the 7-8% stated by EZJ)) we forecast that EZJ will
purchase more A320neo than entailed in fleet projections52
(Figure 18. and 19.)
Number of new owned or finance leased planes delivered in 2015 (20 aircrafts)
based on EZJ projections and confirmed (exercised purchase options). 2016-
2024 forecasts based on company’s guidelines (cross referenced with data for
comparable European LCC) of a stable 70:30 split between planes financed
using operating and finance leases.
52
Fleet projections – cross reference management forecasts and fleet needed based on ASK/Total Fleet, keeping in mind that block hours per day can’t exceed given levels (FY 14- 11 hours - higher than for peer LCC). Additionally, in our opinion, by forecasted pending in the delivery of NEO aircraft EZJ is allowing its overall fleet to age. These economics of planned aging of the fleet have been altered to better match our forecasted earlier deliveries of A320neo planes
Figure 19. Fleet – types of planes (Actual and Projected)
Figure 18. Fleet size (Actual
and Projected)
Source: Company Data, Analyst ‘s Estimates
EASYJET PLC COMPANY REPORT
PAGE 24/35
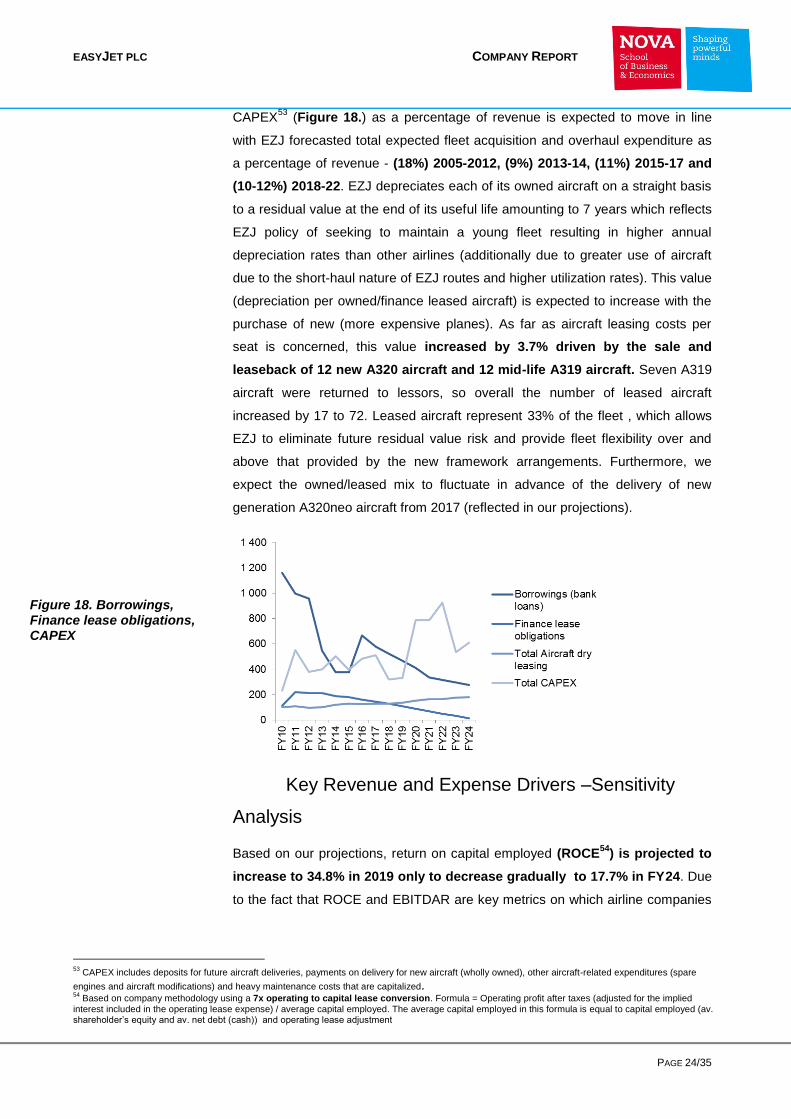
CAPEX53
(Figure 18.) as a percentage of revenue is expected to move in line
with EZJ forecasted total expected fleet acquisition and overhaul expenditure as
a percentage of revenue - (18%) 2005-2012, (9%) 2013-14, (11%) 2015-17 and
(10-12%) 2018-22. EZJ depreciates each of its owned aircraft on a straight basis
to a residual value at the end of its useful life amounting to 7 years which reflects
EZJ policy of seeking to maintain a young fleet resulting in higher annual
depreciation rates than other airlines (additionally due to greater use of aircraft
due to the short-haul nature of EZJ routes and higher utilization rates). This value
(depreciation per owned/finance leased aircraft) is expected to increase with the
purchase of new (more expensive planes). As far as aircraft leasing costs per
seat is concerned, this value increased by 3.7% driven by the sale and
leaseback of 12 new A320 aircraft and 12 mid-life A319 aircraft. Seven A319
aircraft were returned to lessors, so overall the number of leased aircraft
increased by 17 to 72. Leased aircraft represent 33% of the fleet , which allows
EZJ to eliminate future residual value risk and provide fleet flexibility over and
above that provided by the new framework arrangements. Furthermore, we
expect the owned/leased mix to fluctuate in advance of the delivery of new
generation A320neo aircraft from 2017 (reflected in our projections).
Key Revenue and Expense Drivers –Sensitivity
Analysis
Based on our projections, return on capital employed (ROCE54
) is projected to
increase to 34.8% in 2019 only to decrease gradually to 17.7% in FY24. Due
to the fact that ROCE and EBITDAR are key metrics on which airline companies
53
CAPEX includes deposits for future aircraft deliveries, payments on delivery for new aircraft (wholly owned), other aircraft-related expenditures (spare
engines and aircraft modifications) and heavy maintenance costs that are capitalized. 54
Based on company methodology using a 7x operating to capital lease conversion. Formula = Operating profit after taxes (adjusted for the implied interest included in the operating lease expense) / average capital employed. The average capital employed in this formula is equal to capital employed (av. shareholder’s equity and av. net debt (cash)) and operating lease adjustment
Figure 18. Borrowings, Finance lease obligations, CAPEX

EASYJET PLC COMPANY REPORT
PAGE 25/35
like EZJ are valued, the following part of this report will present the findings of a
sensitivity analysis conducted on the above two values.
EBITDAR
Firstly, the year 5 EBITDAR value was tested by altering the following key
revenue and expense drivers i.e. ASK, non-fuel expense, jet fuel price. By
changing the revenue per passenger and ASK by a differential range (-4% to 4%
to assumptions made), we found that EBITDAR is expected to increase with the
growth in ASK. Furthermore, EBITDAR could potentially increase under many
scenarios including i.e. 4% more ASK than expected, each year, or 1% higher
seat revenue per passenger. Since our projections, as to both of these measures
are in our opinion optimistic, we view that the most likely range of year 5 (2019)
EBITDAR values equal to £1 568 - £1 599. (our forecast £1 584).
Next looking at non fuel expenses, in order for EBITDAR to achieve a higher (£1
600 - £1 800 range), a 3-4% improvement of non-fuel expenses (higher than
base case assumptions) or an 3-4% improvement in revenue per passenger
would be required. Looking at the values, one can be fairly confident that year
5 EBITDAR will stay above £1 500, without the occurrence of extreme
circumstances but a value in the £1 600 - £1 800 range seems fairly improbable,
since the base case assumptions already reflect solid improvements in both non-
fuel expenses and revenue per passenger (2.5% CAGR 2015-2024)
Knowing that jet fuel prices materially affect airlines’ bottom line, we
assessed how changes in non-fuel expense differentials (ranging from -4%
to 4%) and those of jet fuel prices (range from -20% to +20%) would affect
year 5 EBITDAR. Keeping in mind the current benign fuel cost environment and
expected return of fuel prices to pre-slump prices, we found that Y5 EBITDAR is
likely to increase to min £1 500 with significant upwards potential if jet fuel
prices decrease (instead of increasing as forecasted).
ROCE
By analogy to the analysis conducted above, the year 5 ROCE was tested by
altering the following key revenue and expense drivers i.e. ASK, non-fuel
expense, jet fuel price. As revenue per passenger (RPP) and ASK were altered,
we observed that as ASK increases Y5 ROCE decreased ( -4% differential X%
and for +4% differential Y%). This is exactly the opposite to what we have
observed in the EBITDAR analysis discussed above. Since EZJ fleet plan is
pretty set (although there is potential flexibility), we view EZJ ASK as relatively
rigid too (i.e. no “wiggle” room for significant differential). For ROCE to exceed
40% (FY15) RPP would have to increase by 4% p.a. above already, in our

EASYJET PLC COMPANY REPORT
PAGE 26/35
opinion, optimistic projections. Value at the bottom/middle 30% or high 20% is
more plausible. This shows that small changes to seat revenue per passenger
can make a significant difference in this metric.
As for revenue per passenger and non-fuel expense (NFE) effects on ROCE,
RPP confirms to be important but non-fuel expenses seem to be relatively
immaterial (e.g. base case 0% differential in RPP and -4% to 4% NFE differential
shows that a 8% difference in NFE causes a change in ROCE of around 6.5%.
For ROCE to increase above 40%, NFE would have to be 3-4% of revenue less
than expected each year and RPP would have to be greater by 3-4%.
When analyzing fuel efficiency and jet fuel price changes one needs to keep
in mind that planned future fuel efficiency isn’t expected to be significant until the
end of the projection period when c. 20% of the fleet will be A320neo.
Interesting to see is that small changes in jet fuel price affects ROCE
significantly. Each 5% increase in fuel prices decreases ROCE by c.2%. We
view that the probability of jet fuel falling further by a significant amount are very
low (keeping in mind the already substantial decrease in oil price),thus, ROCE
growth due to drop in fuel prices was taken out of the equation. Surprising is the
small variation in ROCE when taking into account the changes in fuel
efficiency (3p.p difference).
Finally, when changes in non-fuel expense and CAPEX per Aircraft were
analyzed, we found that CAPEX per aircraft doesn’t seem to affect ROCE
greatly. It is true that more CAPEX spending reduces i.e. ROE but when CAPEX
values are decreased or increased by e.g. 40%, this results in a 4-5% ROCE
difference. Thus, changes in CAPEX effect ROCE forecasts marginally.
To conclude, this analysis has shown that ROCE is a key metric and thus
deserves appropriate scrutiny. ROCE is likely to hover around the 30% mark
in Y5 of our projections. ASK and non-fuel expenses unlikely to differ when
compared to analyst projections and EZJ fuel efficiency measures are
expected to have a very minuscule impact on ROCE. After the recent jet fuel
price decrease it is expected that fuel prices will return to avg. levels,55
which will
lead to the reducing of ROCE (each 5% increase in fuel prices reduces ROCE
by c.2%). Bearing in mind the sensitivity of ROCE to changes in revenue per
passenger growth, we view that the company should focus on improving
revenue per passenger via more allocated seating, marketing to companies
or by increasing spending to optimize its load factor. Finally, the impact of
this analysis on EZJ valuation is as follows. We view that the fact that, EZJ
generates industry leading ROCE and has a cost advantage over all European
55
EZJ Annual reports and Investor Presentations

EASYJET PLC COMPANY REPORT
PAGE 27/35
airlines (excl. RYA) is already reflected in EZJ stock price (i.e. increased c. 3
times over the past 4 years) making further capital gains purely on this
measure (ROCE) highly unlikely. Significant growth potential could come in
effect of i.e. catalyst such as M&A activity or divestiture, continued lower than
expected fuel prices, greater than expected revenue per passenger growth.
Leverage and FCF
EZJ cash holdings are currently above the required net level of cash set by the
company (min £4M per plane). Furthermore, this value is expected to grow from
2017 onwards (Figure 19.), thus, we view this development as positive and look
to (a) EZJ needing cash holdings to potentially support a rating in advance
of financing or (b) EZJ looking to hold cash to offer strategic M&A options
as potential explanations for EZJ growing cash balance. As far as leverage is
concerned, EZJ has the following targets set in place to ensure its capital
structure remains both robust and efficient: (1) maximum gearing of 50%, thus
committing to keep its capital providers and investor assured that it will not over-
leverage; (2) limit of £10M net debt per aircraft; and the target of £4M
liquidity per aircraft mentioned above. We view these targets as economically
sound and vital for a company operating in this competitive industry. That being
said, we found it appropriate to incorporate these assumptions into our
projections
As far as dividends paid are concerned, EZJ dividend payout ratio was recently
increased to 40% (September 2014) and is expected, on the grounds of strong
projected operating cash flows (Figure 19.) to remain at this level throughout the
projection period (potential special dividends payouts should not be ruled out).
Thus, EZJ capital discipline is expected to support further ad-hoc cash
returns, which will remain an important part of EasyJet’s equity story.
Figure 19. Operating, Investing and Finance Cash
Flow
EASYJET PLC COMPANY REPORT
PAGE 28/35
Valuation
EZJ was valued using the DCF (discounted cash flow) model with this choice
substantiated by the fact that the company has over the last 5 years clearly
communicated and has acted in the direction to keep leverage below 30% debt
(currently Debt to Enterprise value (at market values) 8.19% and Equity to
Enterprise Value 91.81%). Thus, we have accordingly set EZJ target D/EV and
E/EV at 15% and 85%, respectively.
WACC
When computing EZJ beta, the MSCI World Index was used as the market
portfolio and stock data (5Y daily data) of 4 peer companies (Ryaniar, Aer
Lingus, Norwegian Air Shuttle, Turkish Airlines) was regressed to arrive at
levered beta values. After unlevering the computed betas, a simple average was
calculated and assumed further as the unlevered beta for the LCC industry. As
far as taxation is concerned, due to the change expected to take place in 2015
(decrease in tax rate from 23.5% to 20%), 20% was assumed and used. Next,
the computed industry beta was relevered using the target debt-to-equity ratio,
giving a value amounting to 1.1.
In order to estimate EZJ cost of debt, the company’s interest coverage ratio
was used to estimate EZJ implied bond rating (EZJ has not been assigned a
credit rating and has not issued any bonds). With EZJ high interest coverage
ratio amounting to 52.82, a synthetic AAA rating was assigned with a spread
equal to 0.4 pp over the risk-free rate (cost of debt equal to 2.9%).
The cost of equity was calculated using the Capital Asset Pricing Model
(CAPM), with the market risk premium set at 5.6% and risk free rate equal to
2.51%. The risk free rate used is the average 2014UK 10Y Bond yield since we
believe that the current rate, amounting to 1.756% (-42.16% down from Dec 31st
2013) will surely not remain at this low level throughout the projection period. The
final component, target D/D+E and E/D+E amounting to 15% and 85%
respectively was used to arrive at our estimated 7.71% WACC.
Terminal Value
As for the terminal value, two approached were used i.e. the Gordon Growth
Model and the Exit multiple method (although difficult to use for cyclical
companies i.e. EZJ). The perpetuity growth rate was set at 2% on the grounds of
the expected growth of the British economy (EZJ main market). For the second
method, an exit EBITDA amounting to 6x (average for a group of airlines) was
applied, which implied a terminal growth rate of 1.6%. The forecasted out-year

EASYJET PLC COMPANY REPORT
PAGE 29/35
FY 24 EBITDA equal to £1 505M (EBITDA margin 20%) gives a discounted
terminal value amounting to £4 151 (54% of implied EV). In the GGM, the
discounted terminal value is equal to £4 690 (57% of implied EV). After summing
both the discounted cash flows and terminal values i.e. calculating the implied
EV, the EV was adjusted to arrive at the implied equity value (Exit multiple - £7
648 and GGM - £8 187). Lastly using the current number of shares outstanding,
393M, the implied share price was computed £20.52 (22% premium to
06.01.2015 share price) and £21.90 (30.2% premium), for the exit multiple and
GGM, respectively.
Scenario Analysis
Each scenario has different input assumptions: economic growth, fuel prices,
load factors, hub-and spoke versus point-to-point etc. This leads to different
volumes of traffic, and different underlying patterns of growth: long- vs. short-
haul, rates of up-gauging of aircraft.
(a) (30%) Upside scenario assumes $100/barrel oil (Brent) for the unhedged
part of EZJ fuel expenses, and 5% growth in revenue per seat in 2015-16 in a
very benign capacity environment. Such a scenario also implies some multiple
expansions with such a positive backdrop for airlines (Implied Share Price –
£26.52)
(b) (50%) Base Scenario (Implied Share Price – £21.90)
(c) (20%) Downside scenario assumes $130/barrel oil (Brent) for the unhedged
part of EZJ fuel expenses, and 2% growth in revenue per seat in 2015,
decreasing to flat pricing in 2016-18 with increased competitive pressures
(Implied share price – £15.93)
The weighted implied share price amounts to £ 22.09 and is in close range to the
value arrived at using the normal DCF approach above.
Conclusion
EZJ is valued at £ 21.90 using the discounted cash flow (DCF) method. Our buy
recommendation is further strengthen by the projected dividend yield (2.68%).
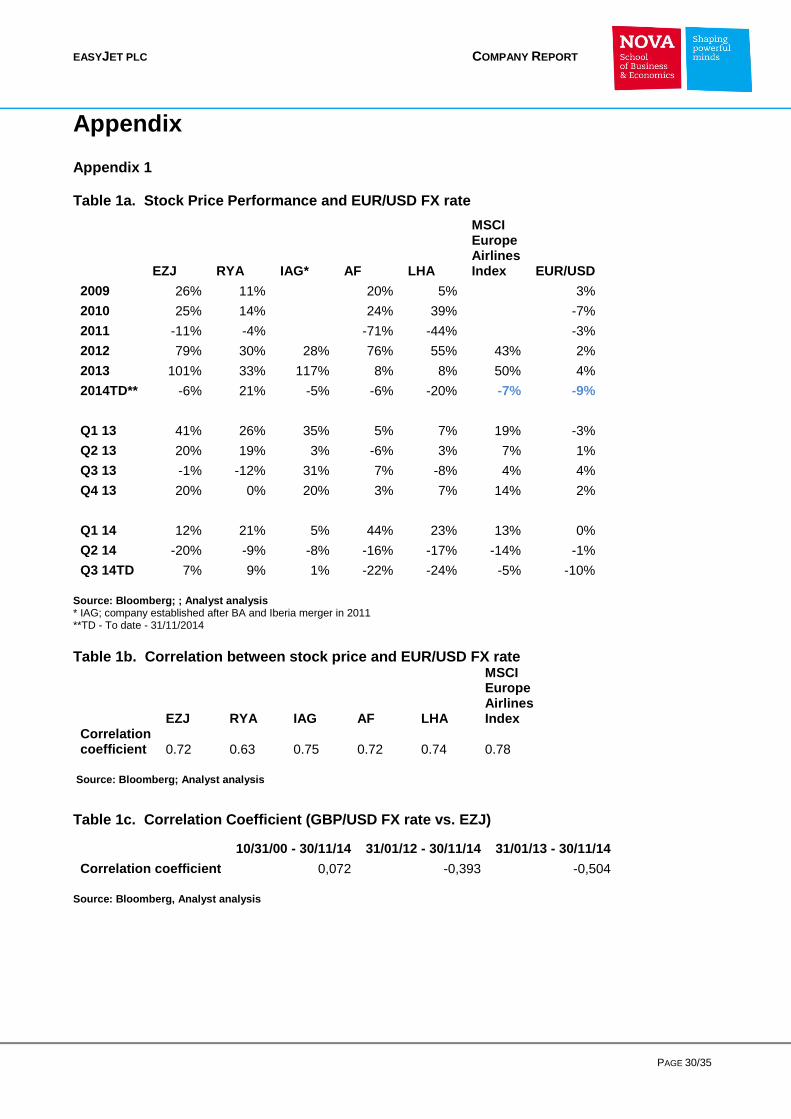
EASYJET PLC COMPANY REPORT
PAGE 30/35
Appendix
Appendix 1
Table 1a. Stock Price Performance and EUR/USD FX rate
MSCI Europe Airlines Index
EZJ RYA IAG* AF LHA EUR/USD
2009 26% 11% 20% 5% 3%
2010 25% 14% 24% 39% -7%
2011 -11% -4% -71% -44% -3%
2012 79% 30% 28% 76% 55% 43% 2%
2013 101% 33% 117% 8% 8% 50% 4%
2014TD** -6% 21% -5% -6% -20% -7% -9%
Q1 13 41% 26% 35% 5% 7% 19% -3%
Q2 13 20% 19% 3% -6% 3% 7% 1%
Q3 13 -1% -12% 31% 7% -8% 4% 4%
Q4 13 20% 0% 20% 3% 7% 14% 2%
Q1 14 12% 21% 5% 44% 23% 13% 0%
Q2 14 -20% -9% -8% -16% -17% -14% -1%
Q3 14TD 7% 9% 1% -22% -24% -5% -10%
Source: Bloomberg; ; Analyst analysis * IAG; company established after BA and Iberia merger in 2011 **TD - To date - 31/11/2014
Table 1b. Correlation between stock price and EUR/USD FX rate
MSCI Europe Airlines Index EZJ RYA IAG AF LHA
Correlation coefficient 0.72 0.63 0.75 0.72 0.74 0.78
Source: Bloomberg; Analyst analysis
Table 1c. Correlation Coefficient (GBP/USD FX rate vs. EZJ)
10/31/00 - 30/11/14 31/01/12 - 30/11/14 31/01/13 - 30/11/14
Correlation coefficient 0,072 -0,393 -0,504
Source: Bloomberg, Analyst analysis

EASYJET PLC COMPANY REPORT
PAGE 31/35
Income Statement FY10 FY11 FY12 FY13 FY14 FY15 FY16 FY17 FY18 FY19 FY20 FY21 FY22 FY23 FY24
Seat revenue 2 402 2 733 3 794 4 194 4462 4966 5386 5788 6141 6453 6595 6794 6964 7139 7318
Non-seat revenue (ancillary) 571 719 60 64 65 72 75 78 81 83 85 87 88 89 91
Total Revenue 2 973 3 452 3 854 4 258 4527 5038 5461 5867 6223 6537 6680 6881 7052 7228 7409
Growth y/y (%) NA 16% 12% 10% 6% 11% 8% 7% 6% 5% 2% 3% 2% 2% 2%
Operating Expenses:
Ground operations -805 -923 -955 -1 182 -1107 -1182 -1267 -1353 -1438 -1526 -1611 -1701 -1787 -1877 -1972
Fuel -733 -917 -1 149 -1 078 -1251 -1241 -1243 -1364 -1521 -1535 -1542 -1549 -1548 -1548 -1547
Crew -336 -407 -432 -454 -479 -513 -550 -587 -624 -663 -699 -738 -776 -815 -856
Navigation -256 -285 -280 -294 -307 -329 -352 -376 -400 -424 -448 -473 -497 -522 -549
Maintenance -177 -179 -203 -212 -212 -244 -245 -239 -247 -254 -291 -308 -314 -344 -351
Selling and marketing -92 -102 -104 -101 -103 -134 -137 -145 -162 -162 -166 -171 -175 -179 -184
Aircraft wet leasing -14 0 0 0 0 0 0 0 0 0 0 0 0 0 0
Volcanic ash disruption -27 0 0 0 0 0 0 0 0 0 0 0 0 0 0
Royalty 0 -4 0 0 0 -71 -72 -74 -76 -78 -81 -84 -86 -89 -92
Other costs -172 -167 -200 -226 -245 -250 -262 -272 -298 -309 -316 -327 -334 -343 -352
Total Operating Expenses -2 612 -2 984 -3 323 -3 547 -3 704 -3 965 -4 128 -4 410 -4 768 -4 952 -5154 -5351 -5518 -5718 -5903
EBITDAR 361 468 531 711 823 1 074 1 333 1 456 1 455 1 584 1 526 1 530 1 535 1 510 1 505
EBITDAR margin (%) 12,1% 13,6% 13,8% 16,7% 18,2% 21,3% 24,4% 24,8% 23,4% 24,2% 22,8% 22,2% 21,8% 20,9% 20,3%
Aircraft dry leasing -102 -109 -95 -102 -124 -126 -126 -126 -128 -134 -153 -162 -162 -177 -180
Depreciation -72 -83 -97 -102 -106 -113 -121 -130 -139 -147 -161 -162 -182 -182 -182
Amortization of intangible assets -6 -7 -8 -10 -12 -14 -16 -18 -20 -20 -20 -20 -20 -20 -20
Loss on disposal of assets held for sale -7 0 0 0 0 0 0 0 0 0 0 0 0 0 0
Operating profit 174 269 331 497 581 821 1071 1182 1167 1283 1192 1185 1171 1132 1123
Operating profit margin (%) 6% 8% 9% 12% 13% 16% 20% 20% 19% 20% 18% 17% 17% 16% 15%
Interest receivable and other financing income 7 9 11 5 11 10 19 27 37 46 50 48 44 44 47
Interest payable and other financing charges -27 -30 -25 -24 -11 -9 -13 -13 -11 -10 -9 -7 -6 -6 -5
Foreign Exchange, net gain/ (loss) 0 0 0 0 0 0 0 0 0 0 0 0 0 0 0
Net finance charges -20 -21 -14 -19 0 0 6 14 25 36 42 41 38 38 42
Profit before tax 154 248 317 478 581 821 1077 1196 1193 1319 1234 1226 1209 1170 1165
Profit before tax margin (%) 5% 7% 8% 11% 13% 16% 20% 20% 19% 20% 18% 18% 17% 16% 16%
Tax credit (charge) -33 -23 -62 -80 -131 -193 -215 -239 -239 -264 -247 -245 -242 -234 -233
Effective tax rate (%) 21,4% 9,3% 19,6% 16,7% 22,5% 23,5% 20% 20% 20% 20% 20% 20% 20% 20% 20%
Profit for the period/year 121 225 255 398 450 628 862 957 954 1055 987 981 967 936 932
Net Profit margin (%) 4% 7% 7% 9% 9,9% 12% 16% 16% 15% 16% 15% 14% 14% 13% 13%
Historical Projected
Appendix 2
Financial Statements (Income Statement, Balance Sheet, Cash Flow Statement)
Assets FY10 FY11 FY12 FY13 FY14 FY15 FY16 FY17 FY18 FY19 FY20 FY21 FY22 FY23 FY24
Current assets
Trade and other receivables 227 158 211 273 200 261 291 314 318 351 366 374 385 394 404
Derivative financial instruments 86 174 104 64 53 41 41 0 0 0 0 0 0 0 0
Short-term Investments 418 386 362 259 584 580 570 559 547 534 523 517 510 503 495
Cash and cash equivalents 1 069 1 130 979 937 424 258 972 1 149 1 453 2 008 1 933 1 767 1 492 1 726 1 887
Total Current Assets 1 800 1 848 1 656 1 533 1 261 1 140 1 874 2 022 2 318 2 892 2 822 2 657 2 386 2 623 2 786
Non-current assets
Goodwill 365 365 365 365 365 365 365 365 365 365 365 365 365 365 365
Other intangible assets 85 86 87 91 113 126 159 198 247 299 351 403 455 507 559
Property, plant and equipment (net) 1 739 1 932 2 193 2 192 2 542 2 881 3 024 3 401 3 788 3 973 4 633 5 255 6 008 6 360 6 785
Derivative financial instruments 26 46 43 39 36 27 27 0 0 0 0 0 0 0 0
Other non-current assets 116 111 103 176 165 170 188 204 218 231 241 246 253 259 266
Total Non-Current Assets 2 332 2 540 2 791 2 863 3 221 3 569 3 763 4 168 4 618 4 867 5 590 6 269 7 081 7 492 7 975
Total Assets 4 132 4 388 4 447 4 396 4 482 4 709 5 636 6 189 6 936 7 760 8 412 8 927 9 467 10 115 10 761
Equity and Liabilities
Current liabilities
Trade and other payables 1 070 1 182 1 308 1 440 1 110 1 612 1 689 1 791 1 913 2 038 2 075 2 154 2 230 2 304 2 384
Derivative financial instruments 34 9 12 34 87 87 87 0 0 0 0 0 0 0 0
Maintenance provisions and Other 130 73 38 75 132 134 153 161 158 176 192 209 217 228 243
Total Current Liabilities 1 233 1 264 1 358 1 549 1 329 1 832 1 929 1 952 2 071 2 214 2 266 2 363 2 447 2 532 2 627
Non-current liabilities
Borrowings (bank loans) 1 162 998 957 548 377 377 667 578 523 468 413 337 316 295 274
Finance lease obligations 114 219 212 213 186 178 162 144 126 108 88 69 49 31 14
Derivative financial instruments 1 3 6 21 23 23 23 0 0 0 0 0 0 0 0
Non-current deferred income 62 63 52 63 62 32 35 38 41 43 45 46 48 49 50
Maintenance provisions 133 185 175 155 147 156 158 147 132 138 151 164 171 179 191
Deferred tax liabilities 85 147 181 180 186 159 286 417 550 691 831 957 1 075 1 180 1 277
Total Non-Current liabilities 1 557 1 615 1 583 1 180 981 924 1 332 1 324 1 372 1 448 1 528 1 573 1 657 1 733 1 806
Total Liabilities 2 790 2 879 2 941 2 729 2 310 2 757 3 261 3 276 3 442 3 662 3 795 3 936 4 105 4 265 4 433
Equity
Shareholder's equity
Share capital and premium 758 762 763 765 766 772 793 820 847 876 908 946 985 1 026 1 068
Hedging reserve and Translation reserve 57 155 101 39 -16 -21 -25 -29 -33 -37 -41 -45 -49 -54 -58
Retained earnings 527 592 642 863 1 422 1 201 1 607 2 122 2 680 3 258 3 750 4 089 4 426 4 877 5 319
Total Equity 1 342 1 509 1 506 1 667 2 172 1 952 2 375 2 913 3 494 4 098 4 617 4 991 5 362 5 850 6 328
Total Equity and Liabilities 4 132 4 388 4 447 4 396 4 482 4 709 5 636 6 189 6 936 7 760 8 412 8 927 9 467 10 115 10 761
Historical Projected
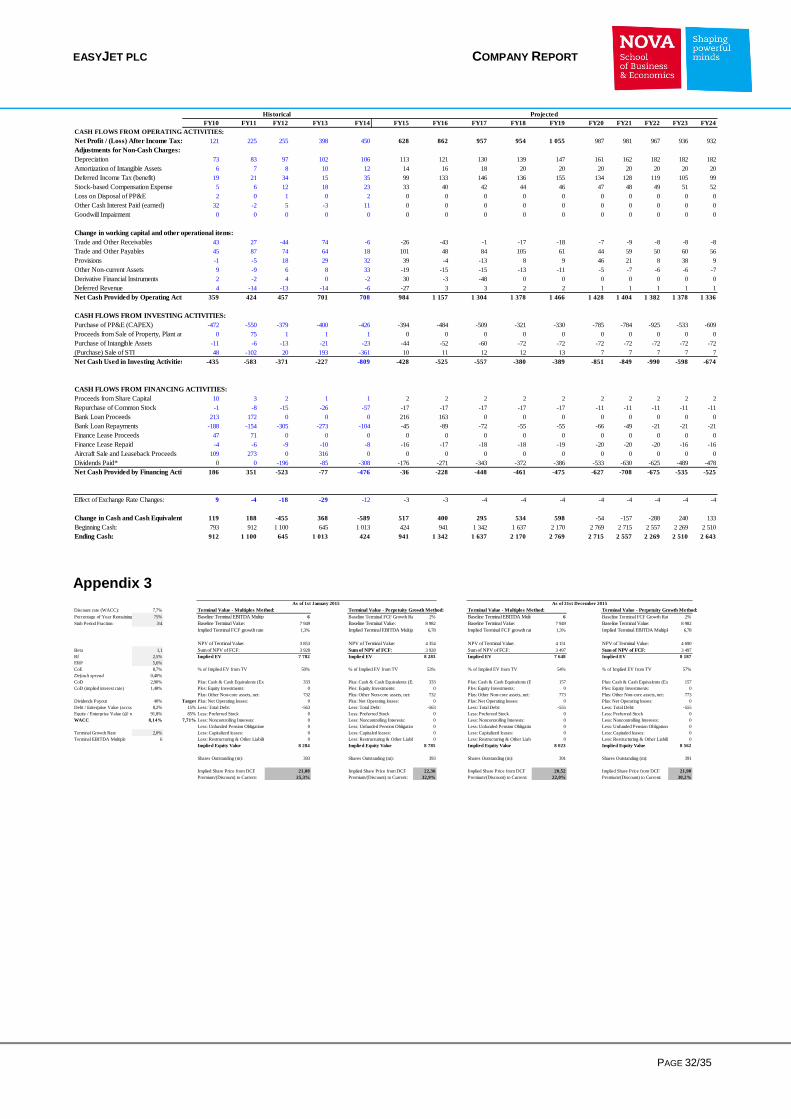
EASYJET PLC COMPANY REPORT
PAGE 32/35
FY10 FY11 FY12 FY13 FY14 FY15 FY16 FY17 FY18 FY19 FY20 FY21 FY22 FY23 FY24
CASH FLOWS FROM OPERATING ACTIVITIES:
Net Profit / (Loss) After Income Tax: 121 225 255 398 450 628 862 957 954 1 055 987 981 967 936 932
Adjustments for Non-Cash Charges:
Depreciation 73 83 97 102 106 113 121 130 139 147 161 162 182 182 182
Amortization of Intangible Assets 6 7 8 10 12 14 16 18 20 20 20 20 20 20 20
Deferred Income Tax (benefit) 19 21 34 15 35 99 133 146 136 155 134 128 119 105 99
Stock-based Compensation Expense 5 6 12 18 23 33 40 42 44 46 47 48 49 51 52
Loss on Disposal of PP&E 2 0 1 0 2 0 0 0 0 0 0 0 0 0 0
Other Cash Interest Paid (earned) 32 -2 5 -3 11 0 0 0 0 0 0 0 0 0 0
Goodwill Impairment 0 0 0 0 0 0 0 0 0 0 0 0 0 0 0
Change in working capital and other operational items:
Trade and Other Receivables 43 27 -44 74 -6 -26 -43 -1 -17 -18 -7 -9 -8 -8 -8
Trade and Other Payables 45 87 74 64 18 101 48 84 105 61 44 59 50 60 56
Provisions -1 -5 18 29 32 39 -4 -13 8 9 46 21 8 38 9
Other Non-current Assets 9 -9 6 8 33 -19 -15 -15 -13 -11 -5 -7 -6 -6 -7
Derivative Financial Instruments 2 -2 4 0 -2 30 -3 -48 0 0 0 0 0 0 0
Deferred Revenue 4 -14 -13 -14 -6 -27 3 3 2 2 1 1 1 1 1
Net Cash Provided by Operating Activities: 359 424 457 701 708 984 1 157 1 304 1 378 1 466 1 428 1 404 1 382 1 378 1 336
CASH FLOWS FROM INVESTING ACTIVITIES:
Purchase of PP&E (CAPEX) -472 -550 -379 -400 -426 -394 -484 -509 -321 -330 -785 -784 -925 -533 -609
Proceeds from Sale of Property, Plant and Equipment and Other0 75 1 1 1 0 0 0 0 0 0 0 0 0 0
Purchase of Intangible Assets -11 -6 -13 -21 -23 -44 -52 -60 -72 -72 -72 -72 -72 -72 -72
(Purchase) Sale of STI 48 -102 20 193 -361 10 11 12 12 13 7 7 7 7 7
Net Cash Used in Investing Activities: -435 -583 -371 -227 -809 -428 -525 -557 -380 -389 -851 -849 -990 -598 -674
CASH FLOWS FROM FINANCING ACTIVITIES:
Proceeds from Share Capital 10 3 2 1 1 2 2 2 2 2 2 2 2 2 2
Repurchase of Common Stock -1 -8 -15 -26 -57 -17 -17 -17 -17 -17 -11 -11 -11 -11 -11
Bank Loan Proceeds 213 172 0 0 0 216 163 0 0 0 0 0 0 0 0
Bank Loan Repayments -188 -154 -305 -273 -104 -45 -89 -72 -55 -55 -66 -49 -21 -21 -21
Finance Lease Proceeds 47 71 0 0 0 0 0 0 0 0 0 0 0 0 0
Finance Lease Repaid -4 -6 -9 -10 -8 -16 -17 -18 -18 -19 -20 -20 -20 -16 -16
Aircraft Sale and Leaseback Proceeds 109 273 0 316 0 0 0 0 0 0 0 0 0 0 0
Dividends Paid* 0 0 -196 -85 -308 -176 -271 -343 -372 -386 -533 -630 -625 -489 -478
Net Cash Provided by Financing Activities: 186 351 -523 -77 -476 -36 -228 -448 -461 -475 -627 -708 -675 -535 -525
Effect of Exchange Rate Changes: 9 -4 -18 -29 -12 -3 -3 -4 -4 -4 -4 -4 -4 -4 -4
Change in Cash and Cash Equivalents: 119 188 -455 368 -589 517 400 295 534 598 -54 -157 -288 240 133
Beginning Cash: 793 912 1 100 645 1 013 424 941 1 342 1 637 2 170 2 769 2 715 2 557 2 269 2 510
Ending Cash: 912 1 100 645 1 013 424 941 1 342 1 637 2 170 2 769 2 715 2 557 2 269 2 510 2 643
Historical Projected
Appendix 3 WACC
Discount rate (WACC): 7,7% Terminal Value - Multiples Method: Terminal Value - Perpetuity Growth Method: Terminal Value - Multiples Method: Terminal Value - Perpetuity Growth Method:
Percentage of Year Remaining: 75% Baseline Terminal EBITDA Multiple 6 Baseline Terminal FCF Growth Rate 2% Baseline Terminal EBITDA Multiple 6 Baseline Terminal FCF Growth Rate 2%
Stub Period Fraction: `3/4 Baseline Terminal Value: 7 949 Baseline Terminal Value: 8 982 Baseline Terminal Value: 7 949 Baseline Terminal Value: 8 982
Implied Terminal FCF growth rate 1,3% Implied Terminal EBITDA Multiple: 6,78 Implied Terminal FCF growth rate 1,3% Implied Terminal EBITDA Multiple: 6,78
NPV of Terminal Value: 3 853 NPV of Terminal Value: 4 354 NPV of Terminal Value: 4 151 NPV of Terminal Value: 4 690
Beta 1,1 Sum of NPV of FCF: 3 928 Sum of NPV of FCF: 3 928 Sum of NPV of FCF: 3 497 Sum of NPV of FCF: 3 497
Rf 2,5% Implied EV 7 782 Implied EV 8 283 Implied EV 7 648 Implied EV 8 187
ERP 5,6%
CoE 8,7% % of Implied EV from TV 50% % of Implied EV from TV 53% % of Implied EV from TV 54% % of Implied EV from TV 57%
Default spread 0,40%
CoD 2,90% Plus: Cash & Cash Equivalents (Excess Cash) 333 Plus: Cash & Cash Equivalents (Excess Cash)333 Plus: Cash & Cash Equivalents (Excess Cash) 157 Plus: Cash & Cash Equivalents (Excess Cash)157
CoD (implied interest rate) 1,48% Ples: Equity Investments: 0 Ples: Equity Investments: 0 Ples: Equity Investments: 0 Ples: Equity Investments: 0
Plus: Other Non-core assets, net: 732 Plus: Other Non-core assets, net: 732 Plus: Other Non-core assets, net: 773 Plus: Other Non-core assets, net: 773
Dividends Payout 40% Target Plus: Net Operating losses: 0 Plus: Net Operating losses: 0 Plus: Net Operating losses: 0 Plus: Net Operating losses: 0
Debt / Enterprise Value (accounting) 8,2% 15% Less: Total Debt: -563 Less: Total Debt: -563 Less: Total Debt: -555 Less: Total Debt: -555
Equity / Enterprise Value (@ market) 91,8% 85% Less: Preferred Stock 0 Less: Preferred Stock 0 Less: Preferred Stock 0 Less: Preferred Stock 0
WACC 8,14% 7,71% Less: Noncontrolling Interests: 0 Less: Noncontrolling Interests: 0 Less: Noncontrolling Interests: 0 Less: Noncontrolling Interests: 0
Less: Unfunded Pension Obligations: 0 Less: Unfunded Pension Obligations: 0 Less: Unfunded Pension Obligations: 0 Less: Unfunded Pension Obligations: 0
Terminal Growth Rate 2,0% Less: Capitalized leases: 0 Less: Capitaled leases: 0 Less: Capitalized leases: 0 Less: Capitaled leases: 0
Terminal EBITDA Multiple 6 Less: Restructuring & Other Liabilities 0 Less: Restructuring & Other Liabilities 0 Less: Restructuring & Other Liabilities 0 Less: Restructuring & Other Liabilities 0
Implied Equity Value 8 284 Implied Equity Value 8 785 Implied Equity Value 8 023 Implied Equity Value 8 562
Shares Outstanding (m): 393 Shares Outstanding (m): 393 Shares Outstanding (m): 391 Shares Outstanding (m): 391
Implied Share Price from DCF 21,08 Implied Share Price from DCF 22,36 Implied Share Price from DCF 20,52 Implied Share Price from DCF 21,90
Premium/(Discount) to Current: 25,3% Premium/(Discount) to Current: 32,9% Premium/(Discount) to Current: 22,0% Premium/(Discount) to Current: 30,2%
As of 1st January 2015 As of 31st December 2015
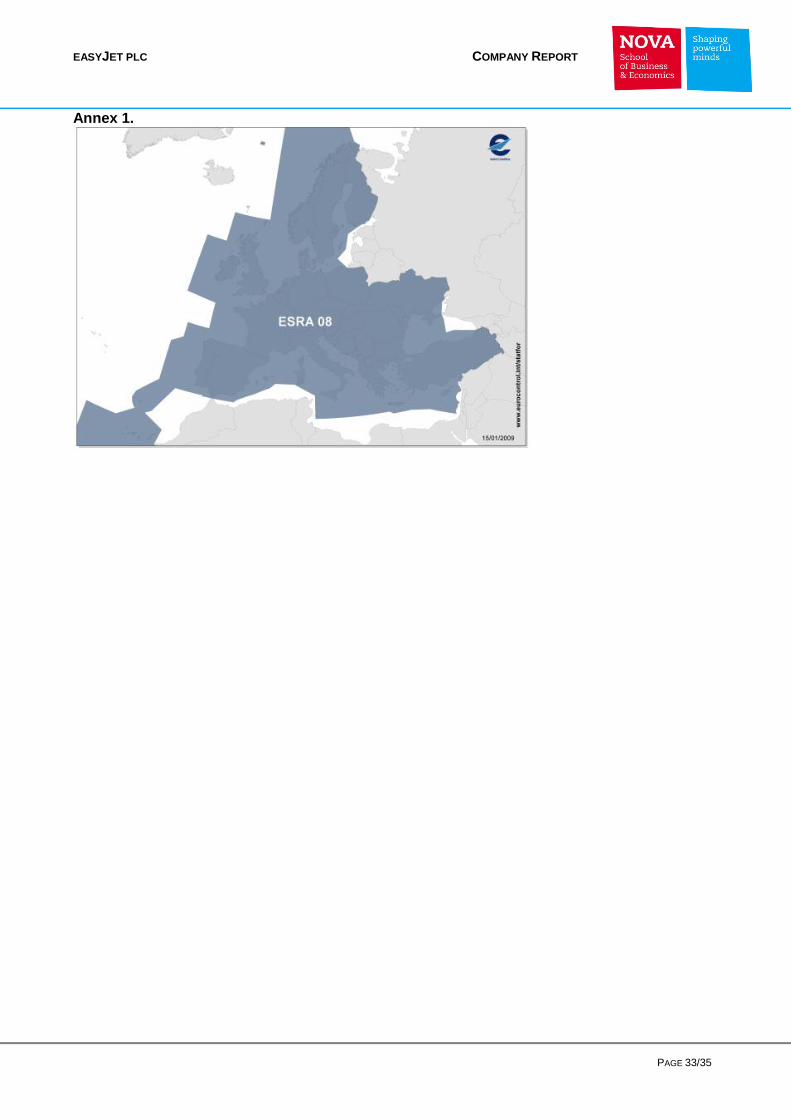
EASYJET PLC COMPANY REPORT
PAGE 33/35
Annex 1.

EASYJET PLC COMPANY REPORT
PAGE 34/35
EZJ has a strong pan-European airport network - 134 airports across Europe, North Africa and the Middle East (675 routes). Presence in 49/100 top pairs in Europe (mainly primary airports). Winter seat capacity a share of 6.5%, behind RYA on 9.8% and Lufthansa on 7.6% (OAG data). summer seat share of 8.1% ranks it second only to RYA 11.7%
EZJ low pricing vs. main competitors - ~ 44,4 % lower (avg. fare/ TRPP - RYA EUR 46, Norwegian EUR83, EZJ EUR 84, Aer Lingus EUR 93, airberlin EUR 121, Alitalia EUR 148, Lufthansa EUR 121, IAG EUR 135, AF-KLM EUR 151(For legacy carriers – average fare/total revenue per passenger adjusted to reflect short-haul routes to aid appropriate comparison)
Relative cost position is powerful - CASK ~ is 20% to 45% below FSCs with a similar average sector length
EZJ brand is strengthening - EZJ has successfully raised its brand awareness in recent years substantiated in the upward trajectory of RPS in recent years.
EZJ financial performance ranks among the best in Europe - EZJ FY2014 (pre-tax profit GBP 581M - pre-tax margin of 12.8% vs. FY2011 GBP248 million - 7.2% margin. Over the same period, FY2011 to FY2014, its pre-tax profit per seat has more than doubled from GBP 3.97 to GBP 8.12 and its return on capital employed (ROCE) has grown from 9.8% to 20.5%. EZJ is one of the few airlines consistently earning returns > WACC
Cost base is not as low as that of Europe's ultra-LCCs - EZJ has a unit cost advantage vs. most competitors excl. Europe's three ultra-LCC; RYA, Wizz Air and Pegasus. EZJ CASK ~ 70% > than RYA - vulnerable to direct competition. Although, RYA and EZJ only compete head to head rarely, competition is likely to increase as RYA grows its presence in primary airports and attacks the business traveler segment where EZJ has had a head start.
Seasonal earnings pattern persists - EZJ annual profits rely heavily on 2H (April to September) to offset a loss-making winter (October to March) - seasonality of demand. However, over the past 2Y, EZJ has reduced its 1H loss (-2/3) and increased its 2H profit (+1/2). Although 2H still accounts for more than 100% of its annual profit, EZJ dependency on 2H has reduced slightly
Further profitable growth opportunities exist - focusing on its top 20
airports in the year to Sep-2014, EZJ has a total market share of around 20% by number of seats
1. Excluding market already taken by other LCCs
and non-LCC transfer traffic, EZJ estimates potential of +86M seats1
operated by non-LCCs on point- to - point routes at its top 20 airports - relatively low risk opportunity for growth within its current
Further growth potential in business segment - number of EZJ business passengers has increased (~10M FY2011-12M FY2014 (+6.27% CAGR)). Business travelers are attracted by; (a) primary airports, (b) high frequencies on key business routes and (c) offer of a bundled product with features aimed at business travelers. In addition, EZJ has an appropriate distribution strategy (implemented agreements with GDS, online travel agents and corporate accounts) - an approach now followed by RYA. With lower fares vs. direct competitors in its markets, EZJ is well positioned to increase short-haul business travel market penetration
Aircraft orders have a flexible delivery schedule –EZJ is expected to need 20-30 planes to accommodate natural market growth of 2.2% p.a.; 40-65 to capture growth in its existing network (thickening existing routes and joining the dots); and 30 to 45 from new network points and routes. Net of route churn - requirement of 296 - 356 will be needed in FY2019. EZJ has exercised its final 27 purchase rights over A320 neo aircraft delivery (2015 – 2017) and will take delivery of 100 A320 neo aircraft (2017 – 2022). Under the base case, the fleet plan will take the FY2019 total to 304 aircraft, at the lower end of its requirement range, with flexibility to raise it to 316, or to cut quite significantly to 204, depending on market conditions. The base case total for FY2019 (+6% CAGR) from FY2014. The up-gauging of the fleet - growing proportion of A320s vs. A319s and the introduction of the A320 neo will contribute to savings in cost per seat
Unit cost reduction opportunities still exist - identified in EZJ lean
program (incl. engineering and maintenance, airport deals, engine selection, the up-gauging of the fleet (see above) and the introduction of the A320 neo)
Competitor response (i.e. RYA) - One of the main threats to EZJ strategic plans is
possible competitor response. As FSC increasingly offer unbundled short haul fares, seat pricing is expected to converge. Provided that EZJ maintains its relative cost advantage, underpricing most competitors on avg. can be expected to continue. RYA recent strategic shift (i.e. increase in number of primary airports in its network and targeting business passengers) should be viewed as a more credible threat, especially given RYA unit cost advantage vs. EZJ. This threat relatively insignificant in the short-term (relative lack of airport overlap) but could potentially become material in the long term.
External events/accident - air travel is vulnerable to geopolitical events and natural
phenomena (e.g. earthquakes, volcanic ash disruption). EZJ relatively focused geographic exposure arguably mitigates this exposure relative to airlines with a global network. However, a Europe-wide event would affect EZJ significantly
The European economy - the airline industry is economically cyclical, although LCCs
in Europe have often performed well in a downturn as FSCs have often accelerated their capacity cuts and passengers have traded down in times of austerity. However, with EZJ relative dependency on primary airports and premium product features (relative to other European LCC) may leave it more exposed to the economic cycle than a pure LCC whose passengers are mainly price-motivated
Cost creep - EZJ efforts to increase its attraction to business travelers (aim: yield
maximization) only makes sense if this is not offset by corresponding growth in unit costs. The shift towards a more premium product positioning comes might lead to growing cost – low risk - EZJ track record shows that management is effective in managing this issue
Labor unrest - airlines are vulnerable to labor unrest (e.g. staff or key airport-based
suppliers - ATC, ground-handling, security and ground transport). EZJ has been successful in keeping its labor relations in tact (same can’t be said about FSC) and this is currently of no specific cause for concern. However, as EZJ size, geographical diversity and growing unionization increase, the risk of internal labor disputes will surely rise.
EZJ founder Stelios’ shareholder activism - EZJ has two major shareholders
(easyGroup Holdings Limited and Polys Holding Limited – brand owner) which together control 34.6% of EZJ common shares. Shareholder activism could adversely impact the reputation of EasyJet and potentially cause a distraction to management.
STRENGTHS
WEAKNESSES
OPPORTUNITIES
THREATS
EASYJET PLC COMPANY REPORT
PAGE 35/35
Disclosures and Disclaimer
Research Recommendations
Buy Expected total return (including dividends) of more than 15% over a 12-month period.
Hold Expected total return (including dividends) between 0% and 15% over a 12-month period.
Sell Expected negative total return (including dividends) over a 12-month period.
This report was prepared by “Olga Milkiewicz”, a student of the NOVA School of Business and Economics, following the Masters in Finance Equity Research – Field Lab Work Project, exclusively for academic purposes. Thus, the author, which is a Masters in Finance student, is the sole responsible for the information and estimates contained herein and for the opinions expressed, which reflect exclusively his/her own personal judgement. This report was supervised by professor Rosário André (registered with Comissão do Mercado de Valores Mobiliários as financial analyst) who revised the valuation methodology and the financial model. All opinions and estimates are subject to change without notice. NOVA SBE or its faculty accepts no responsibility whatsoever for the content of this report nor for any consequences of its use. The information contained herein has been compiled by students from public sources believed to be reliable, but NOVA SBE or the students make no representation that it is accurate or complete, and accept no liability whatsoever for any direct or indirect loss resulting from the use of this report or its content. The author hereby certifies that the views expressed in this report accurately reflect his/her personal opinion about the subject company and its securities. He/she has not received or been promised any direct or indirect compensation for expressing the opinions or recommendation included in this report. The author of this report may have a position, or otherwise be interested, in transactions in securities which are directly or indirectly the subject of this report. NOVA SBE may have received compensation from the subject company during the last 12 months related to its fund raising program. Nevertheless, no compensation eventually received by NOVA SBE is in any way related to or dependent on the opinions expressed in this report. The Nova School of Business and Economics, though registered with Comissão do Mercado de Valores Mobiliários, does not deal for or otherwise offers any investment or intermediation services to market counterparties, private or intermediate customers. This report may not be reproduced, distributed or published without the explicit previous consent of its author, unless when used by NOVA SBE for academic purposes only. At any time, NOVA SBE may decide to suspend this report reproduction or distribution without further notice.


![k]hl]eZj] LGMDGMK= 9;;M=ADD=](https://img.dokumen.tips/doc/110x75/61943764c6749017051278e6/khlezj-lgmdgmk-9madd.jpg)


