Embed Size (px)
Citation preview
July 2010NOAA’s National Weather Service
Mission StatementTo enhance aviation safety
by increasing the pilot’s knowl-edge of weather systems and
processes and National Weather Service products and services.
Program Manager: Michael Graf
Managing Editor: Melody Magnus
Editor: Darcey Dodd
Inside
The 2009-2010 El Nino and
Aviation Operations: Understanding ENSO and PDO
Page 5
When’s the Next Front?
Would you like an email when a new edition of The Front is published? Write [email protected].
Eastern Region Digital Aviation ServicesBy Joe DelliCarpini, Science and Operations Officer, NWS Boston, MA
Requirements for the Next Generation Air Transportation System (NextGen), mandate that the Weather Information Database, provided by the NWS, “will include at least the elements of turbulence, icing, ceiling, visibility, convection and winds.” While specific roles of the Aviation Weather Center, Center Weather Service Units, and NWS Weather Forecast Offices (WFOs) have not yet been defined in NextGen, WFOs have a unique opportunity to provide meaningful input to the process.
In addition, stakeholders such as the FAA, U.S. Coast Guard, helicopter medical services, state police and general aviation have expressed interest in digital and graphical ceiling and visibility forecasts, since these groups require information beyond the scope of the Terminal Aerodrome Forecast (TAF).
In preparation for NextGen, and to provide enhanced services to our stakeholders, NWS Eastern Region (ER) has been exploring how digital aviation services can be integrated into forecast operations. ER formed a regional Aviation Science Steering Team to assess the state of the science for producing digital aviation forecasts, particularly ceiling and visibility. In tandem, three Eastern Region WFOs: Boston, MA; Greenville-Spartanburg, SC; and Charleston, WV; are developing tools and
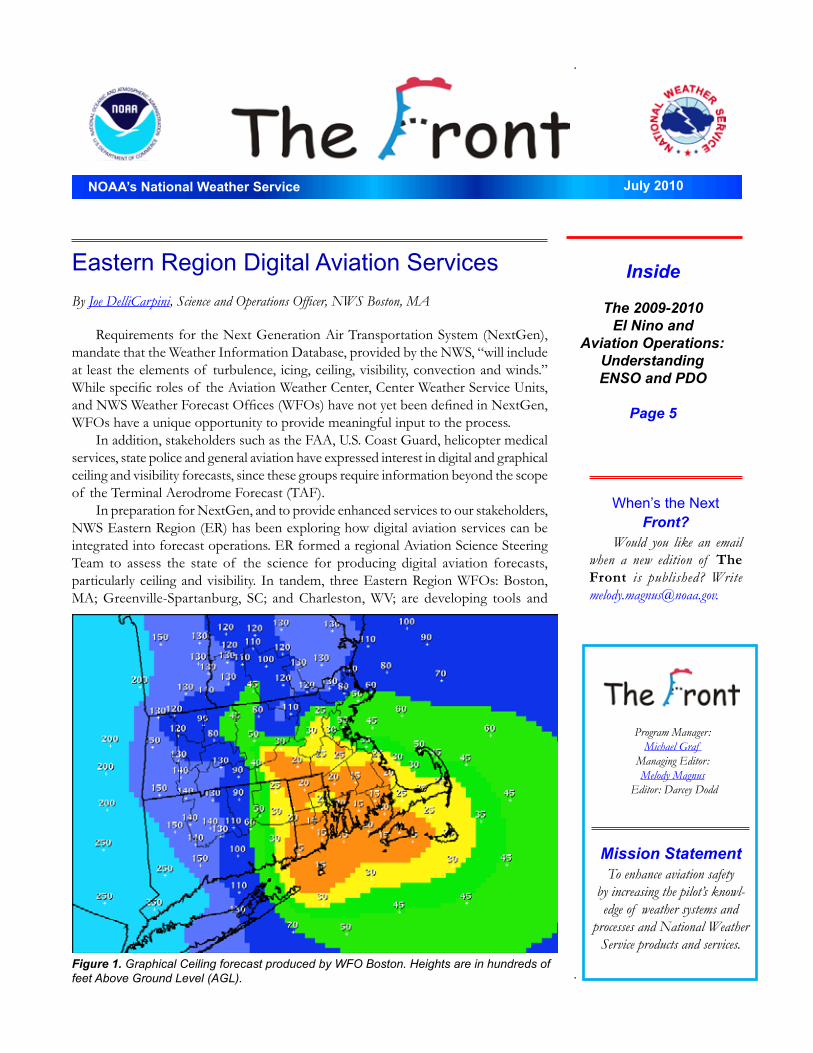
Figure 1. Graphical Ceiling forecast produced by WFO Boston. Heights are in hundreds of feet Above Ground Level (AGL).
2
methodologies for preparing experimental gridded aviation forecasts. These efforts are being coordinated with the NWS Aviation Services Branch and NextGen Program Office.
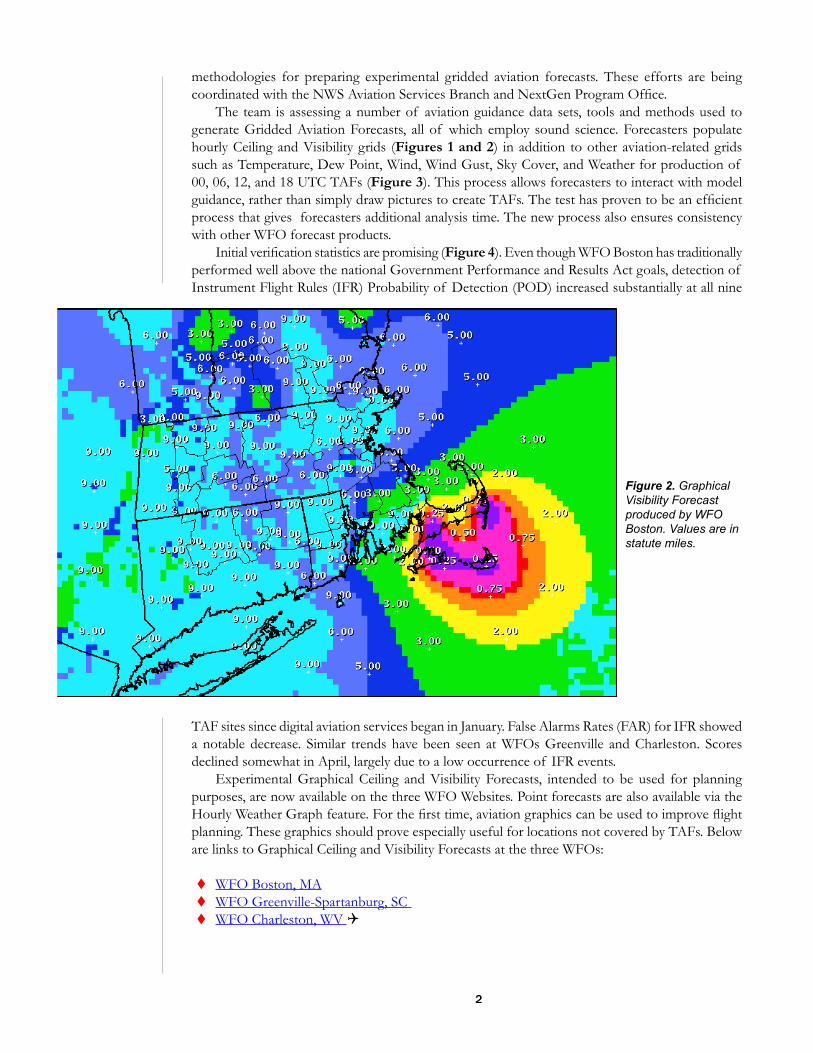
The team is assessing a number of aviation guidance data sets, tools and methods used to generate Gridded Aviation Forecasts, all of which employ sound science. Forecasters populate hourly Ceiling and Visibility grids (Figures 1 and 2) in addition to other aviation-related grids such as Temperature, Dew Point, Wind, Wind Gust, Sky Cover, and Weather for production of 00, 06, 12, and 18 UTC TAFs (Figure 3). This process allows forecasters to interact with model guidance, rather than simply draw pictures to create TAFs. The test has proven to be an efficient process that gives forecasters additional analysis time. The new process also ensures consistency with other WFO forecast products.
Initial verification statistics are promising (Figure 4). Even though WFO Boston has traditionally performed well above the national Government Performance and Results Act goals, detection of Instrument Flight Rules (IFR) Probability of Detection (POD) increased substantially at all nine
TAF sites since digital aviation services began in January. False Alarms Rates (FAR) for IFR showed a notable decrease. Similar trends have been seen at WFOs Greenville and Charleston. Scores declined somewhat in April, largely due to a low occurrence of IFR events.
Experimental Graphical Ceiling and Visibility Forecasts, intended to be used for planning purposes, are now available on the three WFO Websites. Point forecasts are also available via the Hourly Weather Graph feature. For the first time, aviation graphics can be used to improve flight planning. These graphics should prove especially useful for locations not covered by TAFs. Below are links to Graphical Ceiling and Visibility Forecasts at the three WFOs:
� WFO Boston, MA � WFO Greenville-Spartanburg, SC � WFO Charleston, WV
Figure 2. Graphical Visibility Forecast produced by WFO Boston. Values are in statute miles.

3
Figure 3. TAFs that were generated from the gridded database.

4
Figure 4. Monthly POD, FAR, Critical Success Index (CSI) scores for IFR conditions for TAFs issued by WFO Boston, MA. The frequency of Visual Flight Rules (VFR) conditions is also noted. Months in red coincide with digital aviation services.

5
The 2009-2010 El Niño and Aviation Operations: Understanding ENSO and PDOBy Joseph V. Clark, WFO Eureka, CA; Shawn Byrne, WFO Topeka, KS; Edited by Mike Bettwy, WFO Miami, FL
From delays and cancellations to de-icing and additional fuel, the cost of weather on the aviation industry can be crippling. According to the FAA, commercial airline delays cost the United States approximately $10 billion per year. While weather cannot be changed, an airline’s ability to plan and prepare go a long way toward mitigating the profit lost by adverse weather.
A powerful determinant of large-scale weather patterns is El Niño and the Southern Oscillation (ENSO). El Niño is a cyclical warming of the ocean waters in the central and eastern tropical Pacific, generally occurring every 3-7 years. ENSO is associated with changes in air pressure and the movement of high-level winds that can affect weather worldwide. Typically peaking during the winter months, El Niño the warm phase of the ENSO, alternates with La Niña, the cooling of ocean waters in the same region of the Pacific.
The winter (December, January and February) of 2009-2010 featured a late-peaking strong El Niño and represents a unique example of both typical and atypical El Niño characteristics. As an El Niño develops, an enhanced jet stream over the eastern Pacific often focuses the storm track on California and the South, while the Pacific Northwest is warmer and drier than normal (Figure 1). Strong west-to-east flow typically results in cold air remaining north of the continental United States for much of the winter. More frequent and stronger storms, combined with an influx of subtropical moisture, affect the South, resulting in cloudy, wet and relatively cool conditions.
Another large-scale circulation, the Pacific Decadal Oscillation (PDO), occurs in the North Pacific Ocean, but usually on much longer time scales. Research has shown that the cycle of the PDO is roughly 30 years, with smaller occurrences within as little as 2 years. The PDO is marked by a high (warm) and low (cold) phase, just like ENSO (Figure 2).
During the warm phase of the PDO, warmer water temperatures help reinforce and stabilize the Aleutian low. This trend is a key to driving a storm track farther south than its normal position. The opposite is true during
Figure 1. Schematic of typical weather patterns in seasons dominated by El Nino (top) and La Nina (bottom), courtesy of the NWS Climate Prediction Center.

6
the cold phase. When El Niño and PDO are out of phase, the effects of ENSO on North America are often suppressed. Typically this results in comparatively weak low pressure over the Aleutians and west coasts of North America and decreased westerly flow in the upper atmosphere, which played a key role in the 2009-10 winter weather patterns.
The 2009-2010 Winter and Aviation Impacts
For various reasons, the El Niño of 2009-2010 is often said to have never fully coupled with the mid-latitude weather pattern, despite being the fourth strongest El Niño on record at its peak, and the strongest since the “Super Niño” of 1997-98.
The prevailing flow this past winter was often highly amplified and featured ridging in the West and particularly deep troughing in the East. This troughing was well captured in the
Figure 2. Pacific Decadal Oscillation positive (warm) phase and negative (cool) phases. Image depicts surface temperature (units are degrees Celsius). Arrows are wind stress patterns. Source: NASA JPL
Figure 3. Temperature (top) and precipitation (bottom) anomalies associated with the El Nino of 1997-1998 (left) and El Nino of 2009-2010 (right). Image: NCDC Climate Division Dataset provided by the NOAA/Earth System Research Laboratory Physical Sciences Division, Boulder, CO.

7
strong and persistently negative Arctic Oscillation (AO) index. Strong polar westerlies are associated with a positive AO index, which generally suggests a pattern that blocks cold air outbreaks across the lower 48 states, while weak westerlies are associated with the negative phase and more frequent cold air intrusions.
A deep trough and negative AO index were observed frequently throughout the 2009-2010 winter season. Temperatures across the eastern two-thirds of the country were well below normal and exhibit a pattern characteristic of a negative AO index (Figure 3, top right).
While extraordinarily strong, the El Niño of 1997-1998 was more representative of a winter dominated by an El Niño-driven pattern. A comparison of temperature and precipitation anomalies associated with 1997-1998 and 2009-2010 is shown in Figure 3.
One feature of the 2009-2010 El Niño remained consistent with the 1997-1998 episode: a persistent feed of subtropical moisture into the Southeast. (Figure 3, bottom). The atypical combination of an abundance of cold air and an enhanced influx of subtropical moisture resulted in a snowy winter of historic proportions from Texas, Oklahoma and Mississippi to the Mid-Atlantic, including our nation’s capital, where all-time snow records were shattered.
In an effort to determine possible correlations between ENSO and impacts on aviation, delay and cancellation statistics were studied. Delay statistics were gathered from the Bureau of Transportation Statistic.
There were Nat iona l Aviation System (NAS) delays for all airports in the system, including general aviation airports, as well as delays in the “Extreme Weather” category.
The ha l lmark of the 2009-2010 winter was the frequency of blockbuster snowstorms. These storms were more likely to shut down airports altogether, not just cause delays. Cancellation statistics from selected airports reveal s ignif icant impact on the aviat ion industr y (Figure 4). The number of flight cancellations that occurred at multiple airports across the South and East was significant and far exceeded 2003-2009 normals. Nationally, there were 107,688 cancellations (arrivals and departures), about 116% of the average for 2003-2009. The impact increased dramatically at airports which faced the brunt of the winter’s impacts, ranging from 135% of normal at Oklahoma City International Airport to 388% of normal at Baltimore/Washington International Airport.
From the perspective of impacts on flight, Marginal Visual Flight Rules (MVFR) conditions were observed notably more frequently in the Midwest (Dallas/Fort Worth and Oklahoma City)
Figure 4. The 2003-2009 average number of weather-related winter flight cancellations (green) for select airports compared to the total for winter 2009-2010 (red). Percent of average is in text.

8
when compared to the 2005-2009 average, while significant departures from the average were not observed in the selected sites along the eastern seaboard, Baltimore and Philadelphia (Figure 5, top). IFR conditions, however, occurred more frequently at all locations, particularly the two Midwestern sites (Figure 4, bottom).
While the increase in IFR may have been expected with the winter storms, the relative increase in frequency of both MVFR and IFR in the central portion of the country is interesting to note. The difference may merely be a coincidence resulting from the choice of sampled sites, but a more likely contributor is the multiple episodes of fog and stratus across the Midwest from December 2009 through February 2010.
References
� Bureau of Transportation Statistics � Climate Prediction Center � Centre for Asia Pacific Aviation. Weather Costs
Keep on Mounting for US Airlines � NWS Performance Management � Science News. Minor Air Traffic Delays Add
up to Big Costs � National Climatic Data Center, 1994,
Time Bias Corrected Divisional Temperature-Precipitation-Drought Index. Documentation for dataset TD-9640. Available from: DBMB, NCDC, NOAA, Federal Building, 37 Battery Park Ave. Asheville, NC, 28801-2733. 12pp
Figure 5. Frequency of MVFR (top) and IFR (bottom) flight conditions for the 2005-2009 and 2009-2010 winter periods.