Embed Size (px)
DESCRIPTION
Data collected from the class of 2013/14 reflect employment trends. Also data reflecting Career Center programming and usage is available.
Citation preview
Annual Report
2014


About Us 1
Executive Summary 3
Career Development Student/Alumni Appointments 4Presentations/Workshops 5Career Boot Camp 6Employer Site Visits 7
Recruitment ActivitiesCareer Fairs 8On-Campus Interviews 8
Employment ReportsUndergraduate Degrees – Served vs. Non-Served 11Undergraduate Degrees- All students surveyed 13 Where they are working 15 How they learned about the job 15Employment Summary by Gender 16Graduate Degrees – All students surveyed 17Graduate Degrees- Served students only 18
Salaries Reported Undergraduate Degrees 19Graduate Degrees 20
eiu.edu/careers1301 Human Services Center217-581-2412
Contents

American Counseling Association American Association for Employment in EducationIllinois Association for Employment in Education Midwest Association of Colleges and Employers National Association of Colleges and EmployersNational Career Development Association
Our Staff Student and alumni counseling is provided by:
• Three Counselors who specialize in specific occupational areas plus assessment. These counselors hold professional designations by the American Counseling Association and/or the National Career Development Association
• One Career Advisor who is also specialized in Educational fields
• One Assistant Director of Employer Relations focusing on outreach, cultivation, and acquisition of employers that have full time and internship opportunities
• One Program Advisor focusing on professional development through the externship program
• One Graduate Assistant with advising for Sociology, Psychology and Communications
An Operations Team provides employer, student and alumni support for navigating services and event registration.
Our Facilities The Career Services Office at Eastern Illinois University is a centralized career guidance, professional development, and recruitment resource for Eastern Illinois University students and alumni as well as for local and global employers.
Our centrally located office includes curb-side reserved parking for our clients and visiting recruiters. The facilities provide interview rooms, wired and wireless access, a training room, reception areas, private counseling offices, and group meeting rooms.
Our staff and resources are not bound by our facilities, as Career Services is frequently found at many campus kiosks in order to conveniently bring professional development to our clients.
12014 Annual Report
about us
Memberships and Associations

Students and Alumni The focus of our service is predominantly for EIU students and alumni. When compared to service benchmarks available through NACE Career Services Surveys (2013), the EIU Career Services programs for student and alumni clientele are comprehensive and reflect an activity level found more at major U.S. research universities rather than the activity level found at a regional university.
Our philosophy of responsiveness to a changing and global society is the defining characteristic of EIU Career Services. Well before it was popular, EIU Career Services recognized the impact of the cost of college, longer matriculation rates, and challenging economic conditions upon the well-being of our students and alumni. In response to those trends, early development programs were implemented over the past decade. We engage students beginning with their first days on campus and address their professional development from a holistic human perspective. For our alumni, we have extended the length of our active outreach to young alumni to support their transition from college into a competitive and confusing labor market. In additon, we have provided greater support to alumni who are transitioning in the workplace.
Employers Employer services include the standard recruiting options but with greater flexibility and service. We understand that employers are impeded by rigid protocols as they recruit on various campuses. In contrast, we help employers find campus partners for their outreach activities and consult with employers on effective strategies and/or timing that will deliver qualified candidates worthy of their recruiting time and budgets.
Services offered to all students/alumni
Online Career AssessmentCareer Counseling & PlanningExternship ProgramResume Preparation & CritiqueCover Letter Preparation & CritiqueInterviewing Skill DevelopmentMock InterviewsCareer Fairs & Graduate School DayOn-Campus InterviewsOnline Job Listings and Resume ReferralsCareer Field TripsInternship Search StrategyJob Search StrategyOnline Portfolio Secure Storage & ManagementGourmet Dining Etiquette DinnersNetworking WorkshopsCareer Boot CampDress for Success WorkshopsGraduate School Planning & EssaysJob Searching Through Social Media Career Transitioning
2 2014 Annual Report
what we do
our qualifications Our services consist of specialized professional practices based on evidence based programs. Our professionals are not advice givers, but rather counselors and facilitators who focus on the holistic development of the individual within their environmental context. We maintain membership in the American Counseling Association and the National Career Development Association to stay abreast of counseling issues and practices. To address programming issues, recruiting trends, university issues, and labor market information, we maintain memberships in the National Association of Colleges and Employers and the Society of Human Resources Management.
Campus and Public Career Services believes that WE ARE EIU and supports many campus endeavors ranging from new student recruitment, new student programming, academic accreditation, quantitative and qualitative feedback for academic program development, support for student groups and linking promising young alumni to our Institutional Advancement programs. Additionally, Career Services acts as a regional resource for middle and high schools, professional associations, and businesses.

EIU graduates were successful in obtaining professional positions or acceptance to graduate school during the 2013-2014 academic year in an improving labor market.
Eighty-seven percent of EIU undergraduates made plans to attend graduate school or secured employment in professional positions by December 31, 2014. Career outcome data standards and collection procedures established by the National Association of Colleges and Employers (NACE) were followed.
In lieu of the term “placement rate,” these standards instead focus on the notion of a “career outcomes rate.” This is decribed as the percentage of graduates who fall into the following categories: • Employed full time• Employed part time• Participating in a program of voluntary service• Serving in the U.S. Armed Forces• Enrolled in a program of continuing education
Our career outcome data is not a measurement of academic program quality, but rather is an indicator of the success of a cohort of students in successfully transitioning from college.
32014 Annual Report
executive summary
Data reflecting student, alumni and employer usage of EIU Career Services during the previous academic year is analyzed each fall semester. Employer ratings about service quality and candidate preparedness are gathered throughout the year by surveying each employer during each campus recruiting event.
Student and alumni data is collected throughout the year, particularly through surveys at graduation, periodic phone and email surveys. Each student who did not indicate employment upon graduation receives at least one email survey and one phone call in order to solicit employment data as well as to offer further job search assistance. Additionally, faculty or academic department documentation of student employment is solicited by Career Services and used in our job placement data.
For career outcomes data, the National Association of Collges and Employers (NACE) standards for each data set was followed for this report.
Report Methodology

Student/Alumni Appointments
EIU students and alumni are eligible for free career and professional development counseling that is customized to their individual goals, career demands, environmental factors, personal histories and skill levels.
To deliver the specialized career guidance for our diverse client base, counselors focus on holistic counseling for students or alumni within each college, as well as providing some career advising and programming. Our Career Advisors specialize in either a service area such as job shadowing or perform advising for students and alumni on non-confidential topics such as resume writing, professional attire, and how to prepare for a job fair.
Appointments typically occur in the office; however counselors and advisors are able to provide some non-confidential services, such as job correspondence reviews, online. Both confidential and non-confidential services are increasing in prevalence by telephone and online appointments.
Resume Assistance was the principle reason for users to seek assistance from Career Services. Most resume advising was for conversion of generic resumes developed in class or through online guidance into the highly specialized personal advertisements that are required for successful application in today’s job market.
The second most popular service was the Career Assessment. Concerns about getting the most value from a college degree, career transitions by alumni, identification of personally satisfying careers were the main reasons our clients sought assessment.
Career Counseling was the third most popular service that clients requested. Career Counseling involves analyzing specific career specialties that are achievable given each person’s assets and liabilities, ongoing intervention to address personal deficits that could impede achievement of career goals and exploration of the thoughts and feelings associated with the process of self-exploration, career identification and job application.
4 2014 Annual Report
career development 2773 students and alumni sought the assistance of Career Services through
individualized appointments
Appointments 2014
Resumes868Focus Career Assessment Follow-up 732Career Counseling
438Choosing/Changing a Major 76Cover Letters/Correspondence 98Externship/Job Shadow Planning 61Graduate School Prep/Selection 96Internship Search149Interview Skills/Mock Interviews 85LinkedIn Training
15Job Search Skills/Preparation 155TOTAL2773

Presentations & Workshops
Career counselors and advisors provide an array of professional development information to students, alumni and faculty through on and off campus presentations.
Our service offerings continue to mirror the service level delivered by high research universities (Carnegie.) The 2013-2014 academic year resulted in 170 separate events being attended by 3953 students. EIU offered 23% more workshops than large, well-funded research universities according to NACE benchmarks.
TOPIC #Events #AttendeesResume Writing (in office) 11 274
Resume Writing (classrooms & RSO’s) 22 601
Cover Letter Clinics 5 45
Mock Interviews with Employers (Ask an Expert) 2 35
Interview Workshops (in office) 9 100
Interview Workshops (classrooms & RSO’s) 1 14
Job Search Strategies (in office) 10 97
Job Search Strategies (classroom & RSO’s) 1 44
Job Fair Preparation 5 81
Internships Workshops (classroom) 1 18
Internships Workshops (in office) 6 91
Graduate School Workshops/Panels 2 44
Dining Etiquette 1 16
Networking & LinkedIn 2 29
Career Boot Camp 1 70
Job Shadowing 5 21
Freshmen Foundations Career Planning/Services Presentations 2 41
Services Presentations (classrooms, RSO’s & foundations) 24 679
Panther Recruiting PLUS+ Workshops 11 23
Career Planning/Major Selection workshop (in office) 1 7
Career Planning Presentations (classrooms & RSO’s) 3 31
Open House/Transfer Days,College Nights 16 896
Freshmen Orientation (students & parents) 25 377
Move-In Day Presentation- Undecided Students 1 280
Student Teacher Career Preparation Presentation 1 30
Veterans Transition 2 9
TOTALS 170 3953
52014 Annual Report
career development
EIU Career Services outreach exceeds the national benchmarks by 247%.

The sixth annual Career Boot Camp was held on Saturday, August 24, 2013. Despite the intensive 10:00 a.m. to 4 p.m. schedule, 70 students ranging from sophomores to graduate students attended sessions provided by 25 alumni on the following topics:
Ì Successful Transitions: College to Professional
Ì Company Research
Ì How to Leverage Internships, Externships & Field Trips
Ì GLBTQA: Finding Supportive Employers & Transition Tips
Ì Graduate School and How to Pay for it
Ì Interviewing: Developing Great Answers & Questions
Ì Preparing for the K-12 Education Interview
Ì Breaking into Advertising, Marketing & Public Relations
Ì How to Network
Ì Breaking into Social Work and Counseling
Ì How to Stand Out in Sports Marketing & Exercise Science fields
Ì The Financial Services Industry
Ì Consulting Careers and how to approach a sample case
Ì Social Media and the Job Search
Ì Hot Jobs in Healthcare: The fastest growing industry
6 2013 Annual Report 6 2014 Annual Report
“Great day packed with outstanding info and EIU alumni passionate about their careers and helping students be successful!”
BOOT campCareer

Employer Site Visits & Conferences
Throughout the 2013 – 2014 academic year, Career Services sponsored four employer site visits. Twenty-seven students travelled with Career Services counselors to meet with professionals in their chosen field. Site visits serve as good tools to enhance the student’s applied knowledge of a profession, acquire a realistic perspective of the work culture in their field, practice their professional skills and establish professional networks.
72014 Annual Report
career development
DCC Marketing Chicago Board of Trade & Federal Reserve BankNew Harmony Historic SitesRISE (Redefining Investment Strategy Education) Conference
2013-2014 site visits included:

240 Employers & universities recruited on our campus The NACE benchmark for number of employers recruiting on campus is 188.
82014 Annual Report
recruitment activities
443
Career Network Day-Job Fair
91
Grad School Information Day
178
Education Job Fair
348
Career Network Day-Job Fair
223
Educators’ Job Fair
64
Broadcast Industry Fair
Fall Student Attendees Spring Student Attendees
employers
71
universities
23
employers
26
employers
65
employers
43
employers
12
On-Campus Interview ProgramCareer Services conducts on-campus interviews during the fall and spring semesters. EIU students who are registered with Career Services are eligible to compete for and obtain interviews with the participating employers.
Survey results show that employers were very satisfied with the professional Career Services facilities and customer service.
Student candidates met expectations in all areas of the campus interview process.
Comments by Employers: “Career Services at EIU is my favorite place to conduct interviews-easiest place to work with.”
Mean number of job fairs held per year is 4.

92014 Annual Report
“All of the individuals that I met with were very helpful in describing their programs and how I can benefit; This is a wonderful opportunity to meet potential employers and I am glad that EIU offers this fair.”

64%
36%
0% 10% 20% 30% 40% 50% 60% 70%
Used Career Services
Not Served by Career Services
Found Full Time Employment
Students who utilized Career Services for professional development and preparation had 28% greater success in getting jobs than students who did not.
The comparative table on page 11 provides a comparison of data collected from survey respondents who used the services provided by Career Services versus students who elected not to use Career Services.
A side-by-side comparison for each area is noted for each category including Career Employment, Graduate School, Not Seeking, and Still Seeking/Unemployed.
employment summary
10 2014 Annual Report

Major
Grand Total of Student Responses Collected
Accounting 34 32 2 21 18 3 55Africana Studies 1 1 1Applied Engineering and Tech 12 4 8 4 2 2 1 1 2 1 1 19ART: Art History 1 1 0 1ART: Graphic Design 12 1 11 1 1 1 1 0 1 1 2 2 17Art: Studio Art 3 1 2 2 1 1 7 4 3 2 1 1 14ART: Teacher Certification 2 1 1 2Athletic Training 4 4 0 6 2 4 1 1 4 1 3 15BIO: Environmental Biology 4 1 3 1 1 0 4 1 3 1 1 10Biological Sciences 11 3 8 1 1 24 6 18 1 1 3 1 2 40Board of Trustees 1 1 1 1 2Business Administration 5 1 4 1 1 0 1 1 7Career & Organizational Studies 4 4 1 1 0 5Chemistry 2 2 2 1 1 2 2 6CMN: Comm Society Pop Culture 2 2 0 2CMN: Corporate Communication 42 30 12 1 1 0 4 2 2 4 3 1 51CMN: Interpersonal Communicatn 5 4 1 4 2 2 9CMN: Mass Communication 12 12 0 1 1 0 5 5 1 1 1 1 20CMN: Public Relations 41 26 15 2 1 1 10 6 4 2 2 0 55Communication Disorders Sci 1 1 0 1 1 0 25 14 11 2 1 1 29CTE: FCS Education 7 5 2 7CTE: Technology Education 1 1 1Early Childhood Education 4 3 1 1 1 5Economics 1 1 0 5 3 2 1 1 7ELE: General 25 22 3 1 1 0 9 9 0 3 3 38ELE: Middle School 7 3 4 1 1 1 1 0 2 2 0 11ENG: Language Arts Teach Cert 6 6 0 1 1 7Engineering Cooperative 1 1 1English 4 2 2 1 1 6 1 5 4 1 3 15FCS: Apparel/Consumer/Hosp/Mer 22 19 3 4 3 1 1 1 0 1 1 28
FCS: Dietetics 2 2 0 1 1 11 10 1 1 1 15FCS: Family Services 29 27 2 4 3 1 28 27 1 2 1 1 3 3 66Finance 19 13 6 7 4 3 1 1 27FLG: French Sel I 1 1 0 1FLG: German Sel I 1 1 1FLG: German Teacher Cert. 1 1 0 1FLG: Spanish Sel I 1 1 0 1 1 2General Studies 70 9 61 2 2 0 21 6 15 4 1 3 4 1 3 101Geography 9 5 4 1 1 0 5 5 3 1 2 18GST: Childcare Education 1 1 1HIS: Teacher Certification 6 5 1 1 1 0 2 1 1 2 2 11History 11 4 7 2 2 0 8 5 3 1 1 2 1 1 24
112014 Annual Report
employment summary E
mpl
oyed
FT
, M
ilita
ry, o
r Se
rvic
es
Serv
ed
NO
T Se
rved
Em
ploy
ed P
T
Serv
ed
NO
T Se
rved
Gra
d Sc
hool
Serv
ed
NO
T Se
rved
Serv
ed
NO
T Se
rved
Not
See
king
Serv
ed
NO
T Se
rved
Still
See
king
U
nem
ploy
ed

12 2014 Annual Report
employment summaryE
mpl
oyed
Gra
d Sc
hool
Not
See
king
Still
See
king
/U
nem
ploy
ed
Major
Grand Total of Student Responses Collected
HST: Community Health 12 8 4 4 1 3 2 1 1 18HST: Health Administration 12 11 1 1 1 4 4 0 6 5 1 23HST: Teacher Certification 1 1 1Journalism 14 7 7 1 1 2 2 2 1 1 19Kinesiology and Sports Studies 46 27 19 7 4 3 37 22 15 1 1 0 8 6 2 99KSS: Teacher Certification 11 7 4 1 1 4 3 1 1 1 17Management 44 41 3 1 1 0 7 6 1 1 1 3 3 0 56Management Information Systems 14 10 4 1 1 0 3 2 1 18Marketing 27 23 4 2 1 1 8 6 2 1 1 0 38MAT: Teacher Certification 6 6 0 1 1 0 1 1 0 8Mathematics 1 1 1Mathematics Computer Science 1 1 0 1 1 0 2MUS: Performance 2 1 1 2MUS: Teacher Certification 8 6 2 2 1 1 4 3 1 14Nursing 5 5 5Organizational and Prof Devel 27 4 23 2 1 1 8 3 5 4 2 2 41PED: Teacher Cert. K-12 1 1 1 1 1 1 0 1 1 4Philosophy 2 1 1 1 1 0 3PHY: Applied Physics 1 1 1PHY: Engineering Physics 1 1 1Physics 0 0 2PLS: International Studies 1 1 0 1 1 0 2Political Science 5 3 2 2 1 1 10 4 6 1 1 1 18Psychology 37 31 6 1 1 0 51 42 9 2 2 8 5 3 99REC: Therapeutic Recreation 5 3 2 1 1 1 1 7Recreation Administration 7 5 2 2 2 1 1 10Science Teacher Cert Biology 8 6 2 8Science Teacher Cert Chemistry 1 1 0 1Sociology 18 13 5 2 1 1 21 10 11 1 1 3 1 2 45SPE: Early Childhood 9 9 0 9
SPE: ECSE/EC Dual 5 5 0 5SPE: Elementary Ed Dual 8 8 0 1 1 0 9SPE: Standard Special 10 9 1 1 1 0 11THA: Teacher Cert. 1 1 0 1Theatre Arts 4 1 3 1 1 2 2 1 1 1 1 9Grand Total 774 498 276 58 35 23 404 247 157 22 7 15 97 55 42 1355
Em
ploy
ed F
T,
Mili
tary
, or
Serv
ices
Serv
ed
NO
T Se
rved
Em
ploy
ed P
T
Serv
ed
NO
T Se
rved
NO
T Se
rved
Serv
ed
NO
T Se
rved
Serv
ed
NO
T Se
rved
Still
See
king
U
nem
ploy
ed
Gra
d Sc
hool
Serv
ed
Not
See
king

132014 Annual Report
employment summary Major
Employed FT, Military or
Svc. Employed PT Grad School Not SeekingStill Seeking/Unemployed Grand Total
Career Outcomes Rate
Accounting 34 21 55 100%Africana Studies 1 1 100%Applied Engineering and Tech 12 4 1 2 19 84%ART: Art History 1 1 0%ART: Graphic Design 12 1 1 1 2 17 76%Art: Studio Art 3 2 7 14 71%ART: Teacher Certification 2 2 100%Athletic Training 4 6 1 4 15 67%BIO: Environmental Biology 4 1 4 1 10 80%Biological Sciences 11 1 24 1 3 40 88%Board of Trustees 1 1 2 100%Business Administration 5 1 1 7 86%Career & Organizational Studies 4 1 5 100%Chemistry 2 2 2 6 67%CMN: Comm Society Pop Culture 2 2 100%CMN: Corporate Communication 42 1 4 4 51 90%CMN: Interpersonal Communicatn 5 4 9 100%CMN: Mass Communication 12 1 5 1 1 20 85%CMN: Public Relations 41 2 10 2 55 93%Communication Disorders Sci 1 1 25 2 29 90%CTE: FCS Education 7 7 100%CTE: Technology Education 1 1 100%Early Childhood Education 4 1 5 80%Economics 1 5 1 7 86%ELE: General 25 1 9 3 38 89%ELE: Middle School 7 1 1 2 11 73%ENG: Language Arts Teach Cert 6 1 7 100%
Engineering Cooperative 1 1 100%English 4 1 6 4 15 67%FCS: Apparel/Consumer/Hosp/Mer 22 4 1 1 28 82%FCS: Dietetics 2 1 11 1 15 87%FCS: Family Services 29 4 28 2 3 66 86%Finance 19 7 1 27 96%FLG: French Sel I 1 1 100%FLG: German Sel I 1 1 100%FLG: German Teacher Cert. 1 1 100%FLG: Spanish Sel I 1 1 2 100%General Studies 70 2 21 4 4 101 90%Geography 9 1 5 3 18 78%GST: Childcare Education 1 1 100%HIS: Teacher Certification 6 1 2 2 11 73%History 11 2 8 1 2 24 79%
ALL
Und
ergr
ads
Surv
eyed

14 2014 Annual Report
employment summary Major
Employed FT, Military or
Svc. Employed PT Grad School Not SeekingStill Seeking/Unemployed Grand Total
Career Outcomes Rate
HST: Community Health 12 4 2 18 89%HST: Health Administration 12 1 4 6 23 70%HST: Teacher Certification 1 1 0%Journalism 14 1 2 2 19 79%Kinesiology and Sports Studies 46 7 37 1 8 99 84%KSS: Teacher Certification 11 1 4 1 17 88%Management 44 1 7 1 3 56 91%Management Information Systems 14 1 3 18 94%Marketing 27 2 8 1 38 92%MAT: Teacher Certification 6 1 1 8 88%Mathematics 1 1 100%Mathematics Computer Science 1 1 2 100%MUS: Performance 2 2 100%MUS: Teacher Certification 8 2 4 14 86%Nursing 5 5 100%Organizational and Prof Devel 27 2 8 4 41 85%PED: Teacher Cert. K-12 1 1 1 1 4 25%Philosophy 2 1 3 100%PHY: Applied Physics 1 1 100%PHY: Engineering Physics 1 1 100%Physics 1 1 2 50%PLS: International Studies 1 1 2 50%Political Science 5 2 10 1 18 83%Psychology 37 1 51 2 8 99 89%REC: Therapeutic Recreation 5 1 1 7 71%Recreation Administration 7 2 1 10 90%Science Teacher Cert Biology 8 8 100%
Science Teacher Cert Chemistry 1 1 100%Sociology 18 2 21 1 3 45 87%SPE: Early Childhood 9 9 100%SPE: ECSE/EC Dual 5 5 100%SPE: Elementary Ed Dual 8 1 9 100%SPE: Standard Special 10 1 11 100%THA: Teacher Cert. 1 1 100%Theatre Arts 4 1 2 1 1 9 67%Grand Total 774 58 404 22 97 1355 87
Career Outcomes 57% 4% 30% 2% 7% 87%
* See executive summary on page 3 for definition and clarification of the new Career Outcomes rate that has replaced the former “placement rate” terminology and standards.

86% of graduates reported finding jobs throughout Illinois while 14% found jobs in other locations.
The main out of state destinations were:
employment summary
152014 Annual Report
86%
14%
Illinois Out of State
Where they are working
ArizonaColoradoIndianaIowaMissouriTexas
How students found jobs - The Top 4 methods
11
2
3
4
16 2014 Annual Report
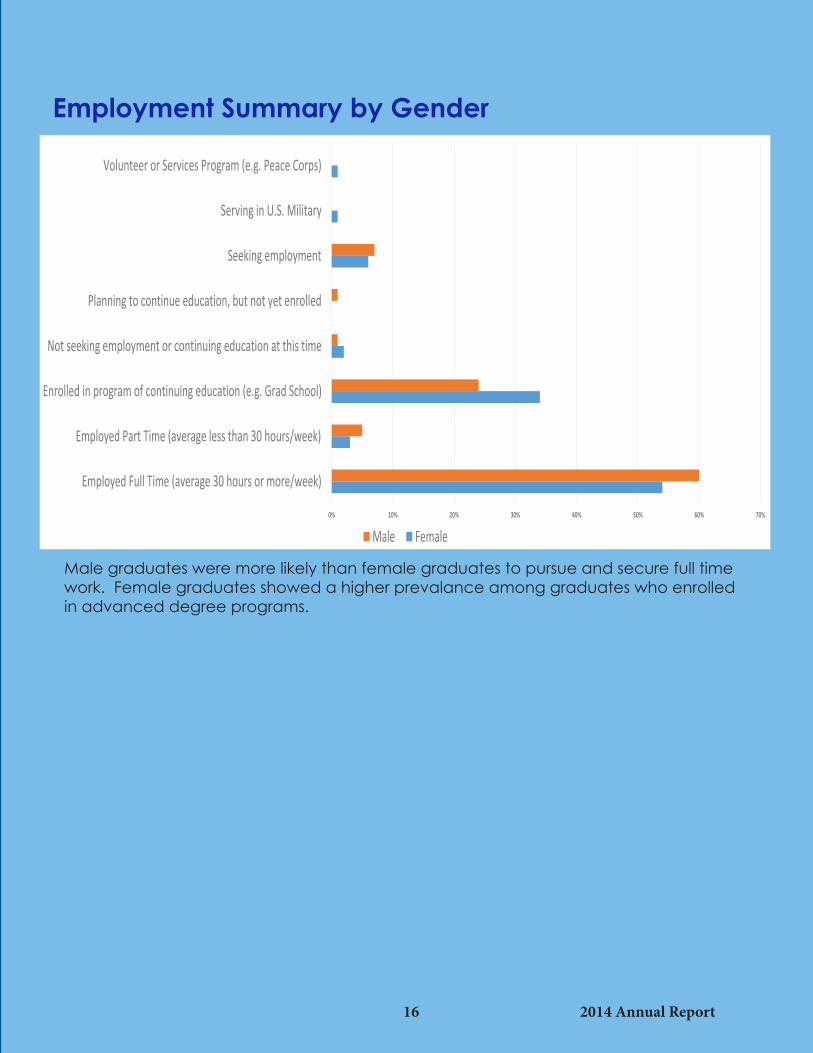
0% 10% 20% 30% 40% 50% 60% 70%
Employed Full Time (average 30 hours or more/week)
Employed Part Time (average less than 30 hours/week)
Enrolled in program of continuing education (e.g. Grad School)
Not seeking employment or continuing education at this time
Planning to continue education, but not yet enrolled
Seeking employment
Serving in U.S. Military
Volunteer or Services Program (e.g. Peace Corps)
Male Female
Employment Summary by Gender
Male graduates were more likely than female graduates to pursue and secure full time work. Female graduates showed a higher prevalance among graduates who enrolled in advanced degree programs.

employment summary
18
ALL Graduate Level Students Surveyed
172014 Annual Report
Major
Employed FT, Military or
Svc. Employed PT Grad School Not SeekingStill Seeking/Unemployed Grand Total
Art 3 2 5 100%ART: Art Education 2 2 100%Biological Sciences 6 2 1 9 67%Business Admin: Applied MGT 17 2 19 100%Business Administration 7 7 100%Chemistry 2 1 3 100%Clinical Psychology 2 1 2 5 60%CMN: Comm. College Pedagogy 1 1 0%College Student Affairs 21 21 100%Communication Disorders Sci 14 14 100%Communication Studies 3 3 100%Counseling 16 2 2 20 90%Dietetics 3 2 1 6 50%Dual Tech Sustainable Energy 1 1 100%Economics 1 2 3 100%Educational Administration 77 7 3 3 90 93%Educational Leadership 1 7 8 100%Elementary Education 5 4 1 10 90%English 4 1 1 6 83%Family and Consumer Sciences 9 1 2 1 1 14 79%Gerontology 4 1 5 100%HIS: Historical Administration 6 1 1 8 75%History 2 1 3 67%Kinesiology and Sports Studies 26 2 2 2 5 37 76%MAT: ELE/MLE Math Education 1 1 100%MAT: Secondary Math Ed 3 3 100%Music 1 2 3 33%Physical Education 2 2 100%Political Science 3 3 6 50%Professional Science Master’s 2 2 100%School Psychology 3 3 100%Special Education 1 1 100%Sustainable Energy 1 1 2 50%Technology 30 2 1 33 97%Grand Total 278 10 40 11 17 356 89%
Career Outcomes 78% 3% 11% 3% 5% 89%

Served Grad Level Students Only
employment summary
18 2014 Annual Report
Major
Employed FT, Military or
Svc. Employed PT Grad School Not SeekingStill Seeking/Unemployed Grand Total
ART: Art Education 1 1 100%Biological Sciences 2 1 3 67%Business Admin: Applied MGT 6 1 7 100%Business Administration 6 6 100%Clinical Psychology 1 1 1 3 67%CMN: Comm. College Pedagogy 1 1 0%College Student Affairs 4 4 100%Communication Studies 1 1 100%Counseling 8 1 9 100%Dietetics 1 1 0%Educational Administration 1 1 100%Elementary Education 1 1 100%English 1 1 100%Family and Consumer Sciences 5 1 6 83%Gerontology 1 1 100%History 1 1 100%Kinesiology and Sports Studies 11 1 1 1 3 17 71%Music 1 1 0%Political Science 1 1 100%Technology 6 2 8 100%Grand Total 56 3 7 4 4 74
Career Outcomes 76% 4% 9% 5% 5% 85%
* See executive summary on page 3 for definition and clarification of the new Career Outcomes rate that has replaced the former “placement rate” terminology and standards.

19
salariesMajor # of Responses High Salary Low Salary Average Salary Major # of Responses High Salary Low Salary Salary MeanAccounting 27 $57,000 $27,500 $44,063Applied Engineering and Tech 6 $54,000 $25,000 $38,333
ART: Graphic Design 6 $40,000 $30,000 $36,167Art: Studio Art 2 $35,000 $20,000 $27,500ART: Teacher Certification 2 $35,000 $34,000 $34,500Athletic Training 2 $33,800 $25,000 $29,400BIO: Environmental Biology 2 $31,628 $25,000 $28,314Biological Sciences 5 $45,000 $20,000 $26,800Board of Trustees 1 $100,000 $100,000Business Administration 3 $48,000 $31,500 $38,000Career & Organizational Studies 4 $70,000 $35,000 $52,250Chemistry 2 $38,000 $34,000 $36,000CMN: Comm Society Pop Culture 1 $30,000 $30,000CMN: Corporate Communication 13 $50,000 $24,000 $35,230CMN: Interpersonal Communicatn 2 $50,000 $22,000 $36,000CMN: Mass Communication 2 $40,000 $40,000 $40,000CMN: Public Relations 14 $50,000 $20,000 $34,500CTE: FCS Education 4 $45,000 $30,000 $35,250Early Childhood Education 1 $30,000 $30,000ELE: General 13 $40,000 $18,000 $33,968ELE: Middle School 4 $45,000 $25,000 $35,500Engineering Coop 1 $60,000 $60,000
ENG: Language Arts Teach Cert 2 $36,000 $30,000 $33,000English 2 $35,000 $20,000 $27,500FCS: Apparel/Consumer/Hosp/Mer 11 $40,000 $18,000 $26,918FCS: Dietetics 2 $25,000 $20,000 $22,500FCS: Family Services 15 $37,000 $20,000 $28,650Finance 7 $56,000 $25,000 $42,214FLG: German Teacher Certification 1 $48,400 $48,400General Studies 26 $120,000 $22,000 $54,008Geography 5 $40,000 $27,500 $34,500GST: Childcare Education 1 $53,000 $53,000HIS: Teacher Certification 5 $40,000 $20,000 $31,800History 5 $55,000 $25,000 $36,300HST: Community 7 $35,000 $20,000 $30,429HST: Health Admin 5 $38,000 $18,250 $27,750Journalism 6 $45,000 $20,000 $32,667Kinesiology and Sports Studies 14 $45,000 $20,000 $31,964KSS: Teacher Certification 2 $60,000 $29,000 $38,200
Undergraduate Degrees
2014 Annual Report

20
salariesMajor # of Responses High Salary Low Salary Salary Mean
Management 19 $54,500 $24,000 $36,605Management Information Systems 8 $65,880 $30,000 $44,245Marketing 16 $67,500 $25,000 $39,843MAT: Teacher Certification 4 $35,000 $33,000 $28,000Mathematics 1 $28,000 $28,000Mathematics Computer Science 1 $43,000 $43,000MUS: Teacher Certification 6 $41,600 $20,000 $29,933Nursing 3 $80,000 $55,000 $65,000Organizational and Prof Devel 18 $100,000 $17,000 $46,324PED: Teacher Certification 1Philosophy 1 $36,000 $36,000Political Science 4 $38,000 $18,000 $29,000Psychology 20 $50,000 $14,400 $30,466REC: Therapeutic 3 $41,000 $24,000 $35,000Recreation Admin 2 $40,000 $25,000 $32,500Science Teacher Cert Biology 7 $41,000 $32,000 $37,000Science Teacher Cert Chemistry 1 $33,500 $33,500Sociology 13 $60,000 $18,000 $28,964SPE: Early Childhood 5 $42,000 $20,000 $35,700SPE: ECSE/EC Dual 4 $44,000 $33,000 $38,000SPE: Elementary Ed Dual 6 $44,000 $29,000 $36,500SPE: Standard Special 6 $55,000 $19,000 $36,000Theatre Arts 1 $25,000 $25,000
TOTAL RESPONSES 383
Undergraduate Degrees
2014 Annual Report

Major # of Responses High Salary Low Salary Salary Mean
Biological Sciences 1 $25,000Business Admin: Applied MGT 3 $55,000 $38,000 $47,667Chemistry 1 $30,000
Clinical Psychology 1 $24,000
College Student Affairs 12 $57,000 $29,000 $36,625Communication Disorders Sci 6 $76,000 $48,000 $58,500Counseling 6 $52,000 $25,000 $36,833Dietetics 3 $42,000 $37,000 $39,667Educational Administration 23 $96,000 $30,000 $46,543Educational Leadership 1 $37,500Elementary Education 3 $47,000 $35,000 $39,666English 2 $24,000 $22,000 $23,000Family and Consumer Sciences 6 $49,000 $25,000 $40,300Gerontology 1 $28,700HIS: Historical Administration 3 $37,500 $30,000 $32,500Kinesiology and Sports Studies 12 $54,000 $25,000 $37,075MAT: ELE/MLE Math Ed 1 $40,000MAT: Secondary 3 $47,500 $33,000 $40,167Political Science 1 $35,000Professional Science 2 $60,000 $40,000 $50,000School Psychology 2 $43,000Sustainable Energy 1 $60,000Technology 16 $120,000 $32,000 $55,450
TOTAL RESPONSES 110
salariesGraduate Degrees
212014 Annual Report

22 2014 Annual Report
“This is a great networking and employment opportunity! I really enjoyed it and gained experience with interviewing.”