Embed Size (px)
Citation preview

Eastern Enlargement of the EU: A Comprehensive Welfare Assessment
by
Wilhelm Kohler*)
Working Paper No. 0316 December 2003
DDEEPPAARRTTMMEENNTT OOFF EECCOONNOOMMIICCSS
JJOOHHAANNNNEESS KKEEPPLLEERR UUNNIIVVEERRSSIITTYY LLIINNZZ
Johannes Kepler University LinzDepartment of Economics
Altenberger Strasse 69A-4040 Linz - Auhof, Austria
*) corresponding author:[email protected]
phone +43 (0)70 2468 -8239

Eastern Enlargement of the EU:A Comprehensive Welfare Assessment
by
Wilhelm KohlerJohannes Kepler University Linz
December 2003
Abstract
This paper takes a welfare-view on eastern enlargement of the EU, focusing on incumbent countries.Enlargement is decomposed into three elements: Single-market integration on commodity markets, bud-getary costs from EU-expenditure policies, and single-market-induced migration from new to presentmember countries. I first use an analytical model to derive a welfare equation that identifies the principlechannels for incumbent country welfare gains and losses from enlargement, including product differen-tiation, capital accumulation, and unemployment due to search-costs. I then propose a method thatallows to extend welfare results obtained from a detailed calibrated version of this model for Germany toother incumbent countries. The approach relies on model elasticities extracted from the German modelwhich are then applied to other countries’ idiosyncratic “enlargement-shocks”. Constructing detailedindices for such country-specific “enlargement shocks”, I arrive at a characteristic inter-country patternof enlargement-induced welfare effects for all EU15 countries. Aggregating these across countries revealsenlargement to be beneficial for the union as a whole, although several countries stand to suffer welfarelosses.
Address: Johannes Kepler University Linz, Department of Economics, Altenberger Strasse 69, A-4040 Linz-Auhof, Austria, phone:+43-732-2468-8239, fax:-8238, [email protected], http://www.econ.jku.at/kohler.
A preliminary version of this paper was presented at the International Workshop on “EU Enlargement: Economicand Institutional Reforms”, Catholic University of Milan, June 20-21, 2003. Thanks are due to Carlo Altomonteand Gabriel Felbermayr for extensive and very constructive comments. I am also grateful to the Hamburg Instituteof International Economics (HWWA) for its hospitality during a Visiting Fellowship in July 2003 which has allowedme to complete the paper. Part of this research was conducted under a project entitled “Public Finance, Growthand Employment” and funded by the Austrian Science Fund (FWF) under grant no. P14702.

1 Introduction
In 1993, at a summit in Copenhagen, the European Union heads of state have issued a firm
commitment to an eastern enlargement of the union. The Luxembourg summit of December
1997 marks the start of formal negotiations for accession, and in its summit of December 2002,
again held in Copenhagen, the European Council has decided to endorse the negotiation results
achieved to that date for as many as 10 countries. In an informal European Council meeting in
Athens on April 16, 2003, the heads of state have signed an accession treaty, and membership
of these countries is due to commence on May 1st, 2004.1
Although the primary driving force behind eastern enlargement has always been political in
nature, its economic effects on incumbent and new members determine whether it will eventually
also be seen as an economic success story, which will certainly shape the attitude towards future
enlargements of the EU. The scenario is surely not a marginal one. Enlargement will increase the
EU’s geographic area by about 23 percent, its population will rise by about 20 percent, and its
GDP (2001 at PPP) will increase by about 9 percent. Moreover, being relatively poor and more
agricultural than most incumbent countries, new members are likely to draw significant sums
from union agricultural and cohesion funds.2 Hence, enlargement involves a direct budgetary
cost for present member countries.
However, both old and new member countries expect further economic effects, over and
above transfers payments, from enlargement. Most importantly, gains should arise from ex-
tending EU vehicles of market integration (Customs Union, Single Market) to a larger set of
partner countries. From an incumbent’s perspective, a crucial question is whether such gains are
likely to outweigh the direct budgetary cost, so that the overall economic effect of enlargement
is positive. There is a host of different effects that are often pointed out. Firms may find im-
proved export conditions, boosting their profit opportunities and thus investment, growth and
employment. They should also benefit through cheaper imports from new members, as will pri-
vate households and government procurement. But, as always, such gains do not come without
1The new member countries are the Czech Republic, Estonia, Cyprus, Latvia, LIthuaniea, Hungary, Malta,Poland, Slovenia, and the Slovak Republic. Two further countries, Bulgaria and Romania, are expected to becomemembers by 2007, while formal negotiations with Turkey, a further candidate country, have yet to begin.
2The expected strain for EU cohesion funds may be indicated by comparing GDP per capita. In 2001, the10 acession countries overall have reached a GDP per capita which, at 10.700 Euro, is less than half the EU-15figure of 23.210 Euro, measured in purchasing power parities. They show significant variation, ranging from 7.750for Latvia up to 16.210 for Slovenia which has already overtaken Greece (15.020) and Portugal (16.059). Thebudgetary cost from EU common agricultural policy (CAP) is particularly evident from a high employment sharein agriculture, which is 13.3 percent for accession countries, compared to 4.2 for the EU-15. For the agriculturalshare in gross value added the difference is much less pronounced, with 4.1 percent for accession countries and2.1 percent for the EU-15. Again, the dispersion is quite large within accession countries, with most concernarising from a high agricultural employment share of 19.2 percent for populous Poland, whereas countries like theCzech Republic (4.9) and Hungary (6.1) are already quite close the the overall EU-15. See Eurostat, StatisticalYearbook on Candidate Countries, 5th edition, Luxembourg, 2003.
1

costs of adjustment. On labor markets, integration of commodity and factor markets is likely to
entail both job displacement and job creation, with the net effect on the rate of unemployment
being unclear a-priori. In addition to employment perspectives, domestic workers with low skill
levels may be hurt in terms of wage income, due to import competition and immigration, par-
ticularly if migrant labor from candidate countries is a close substitute. Other types of labor
and other factor owners may gain, if they are complementary to migrant labor. Thus, there are
distributional implications, in addition to the overall welfare effect of enlargement.
Given such a vast array of effects, any overall assessment of enlargement faces two key
challenges. First, can we develop a summary measure that may consistently be set against the
direct budgetary cost of enlargement, for individual member countries and – ultimately – for
the union as a whole? An obvious way to proceed is to look at economic welfare as a “bottom-
line”. Arguably, economic welfare is an important criterion for all economic policy, hence an
assessment of enlargement against this criterion seems called for. But welfare is a concept which
is notoriously difficult to grasp, particularly when a multiplicity of different effects is at work, as
in the case of enlargement. It thus seems important to develop a unified framework, revealing
how the various expected enlargement effects relate to economic welfare. The second challenge,
of course, is quantification. Can we quantify the various economic effects towards a single net
welfare figure for each and every incumbent and, ultimately, for the EU15 as a whole? Since
the primary forces behind enlargement have always been political in nature, it was clear from
the outset that the whole endeavor would not depend on a clear and convincing proof of an
affirmative answer. Nevertheless, this is an important question worth trying to answer.
In this paper, I attempt to do two things. First, I develop a theoretical framework, based on
normative theory of (preferential) market integration, that allows me to identify, in a unified way,
the principal channels through which various enlargement effects influence economic welfare of an
incumbent country. And secondly, I venture to quantify the welfare effect of enlargement for each
of the 15 present member states of the EU, taking into account their idiosyncratic positions with
respect to the enlargement scenario. The empirical quantification is based on two elements. The
first is a numerical simulation model for Germany, which renders crucial elasticities for various
parts of the enlargement scenario. The second is a calculation of country-specific “enlargement
shocks” that allow us to apply the German elasticities to all other EU15 countries. Treating
inter-country differences in a consistent way ultimately allows us to aggregate across countries,
and to arrive at an EU15-wide welfare effect.
Eastern enlargement is treated as a “shock” to an incumbent country that emanates from
extending the EU vehicles of market integration to new members, in addition to the direct
budgetary cost from EU expenditure policies in an enlarged union. Market integration means
preferential trade liberalization from tariff and non-tariff barriers, as well as free movement of
capital and labor – the so-called Single Market of the EU. Labor migration is assumed to respond
2

to wage differences, whereby immigration from new members is determined for each incumbent
on the basis of available evidence form migration models. As regards international capital flows,
we assume perfect capital mobility, modeled by appropriate no-arbitrage conditions. Trade is
assumed to take place in an environment of product differentiation based on the country of
origin. Lower trade barriers boost export demand and cause substitution in favor of imports
from new member countries, reflecting both trade creation and trade diversion. Enlargement
also affects domestic production where we assume an environment of monopolistic competition
with endogenous capital accumulation. Employment is subject to costly search with endogenous
unemployment.
Section 2 first develops a theoretical framework for a welfare calculus of enlargement. The
primary purpose is to show, in a single equation, how enlargement of the EU affects economic
welfare of an incumbent country in a production and trading environment of the kind just
outlined. The overall effect is decomposed into a) static gains from trade, including variety
and scale effects in addition to the conventional effects of trade creation vs. trade diversion,
b) dynamic effects from trade integration via capital accumulation with growth externalities
deriving from product differentiation, and c) employment effects in labor markets characterized
by unemployment due to costly search and matching. The equation proves useful, not only
by revealing the essential ingredients of the benefits and costs of enlargement, but also by
pointing out certain country-specific characteristics that need to be observed when attempting
to quantify the overall welfare effect for all present member countries. The equation reveals an
overall welfare effect which is ambiguous a priori, hence the empirical investigation in sections 3
and 4. Section 3 presents the approach pursued towards quantification which draws on welfare
results obtained by means of numerical simulations with an applied dynamic general equilibrium
model for the German economy. The approach involves a) extracting welfare elasticities from the
German model, and b) applying these elasticities to country-specific “enlargement shocks” for all
other incumbents. The section first develops the approach in general terms and then constructs
appropriate measures for such shocks. Section 4 presents the results obtained from applying this
approach to all EU15 member countries. In addition, the country-specific results are aggregated
in three alternative ways to an EU15-wide overall welfare effect of eastern enlargement.
This is, of course, not the first attempt to quantify the incumbent country effects of an
eastern enlargement of the EU. However, a large part of the existing literature lacks an explicit
welfare focus in the sense proposed below. For instance, the study on enlargement by ECOFIN
(2001), looking at both incumbents and candidate countries, boils down all enlargement effects
to their influence on economic growth. But it is well known that, tempting as it may be, GDP-
or growth-effects should not be equated with welfare effects. Indeed, the relationship between
the two is far from straightforward, as will become apparent from the framework suggested
below. The well-known study by the European Integration Consortium (2001) treats trade
3

effects, as well as FDI and migration effects, in great detail, but similarly lacks a unified welfare-
oriented framework. Baldwin, Francois & Portes (1997) employ a computational model of market
integration which comes very close to a welfare-oriented treatment of the kind envisioned above.
But when looking at the EU15, they do not follow a country-by-country approach, thus ignoring
all inter-country differences, which are surely important in this case. Among the single-country
studies, Kohler & Keuschnigg (2000,2001) and Keuschnigg & Kohler (2002), focusing on Austria,
as well as Keuschnigg, Keuschnigg & Kohler (2001) and Heijdra, Keuschnigg & Kohler (2002,
2003), focusing on Germany, feature a multiplicity of market integration effects, in addition to the
direct budgetary cost, with a clear “bottom-line” welfare evaluation. These studies emphasize
that eastern enlargement implies “shocks” that are highly county-specific, hence their results
and conclusions should not be taken as representative for other incumbents, or the EU15 as a
whole. However, this paper shows that they form a suitable basis on which to proceed towards
a more comprehensive analysis looking at all incumbent countries of the EU.
2 A welfare calculus of enlargement
This section develops a framework for identifying the channels through which enlargement of
the EU affects economic welfare of an incumbent country. The framework is quite ambitious
in that it incoprorates several key aspects of the modern theory of integration, including scale
economies and imperfect competition, as well as growth and unemployment. But it is still quite
stylized, relying on a host of simplifications for the sake of analytical tractability. Many of these
simplifications will be relaxed when turning to the empirical part in sections 3 and 4 below.
Formally speaking, the analysis aims at a total differential of the indirect utility (or welfare)
function, revealing the welfare effects of enlargement. A full reduced-form solution would have
enlargement-related exogenous changes on “the right-hand side” of this welfare differential, with
all endogenous changes “substituted out”. We shall, however, be willing to accept (changes in)
variables on the right-hand side that are actually endogenous, in particular goods prices. Instead
of fully tracing these changes back to the exogenous elements of an enlargement scenario, we
observe certain key “tangency conditions” that must be satisfied in the adjustment. Thus, the
welfare calculus in this section effectively aims at an intermediate level of complexity where the
key welfare channels are clearly identified, but where important endogenous variables are yet to
be determined from appropriate equilibrium conditions. A full determination of all endogenous
variables is left to the computational part in subsequent sections of the paper. The virtue of
focusing on the welfare differential on such an intermediate level of complexity is that it reveals
how the various effects of eastern enlargement often pointed out in policy discussions are related
to economic welfare as a primary bottom-line criterion for economic policy. The analysis will
focus on trade effects, product differentiation and growth effects, and on labor market and
4
migration.
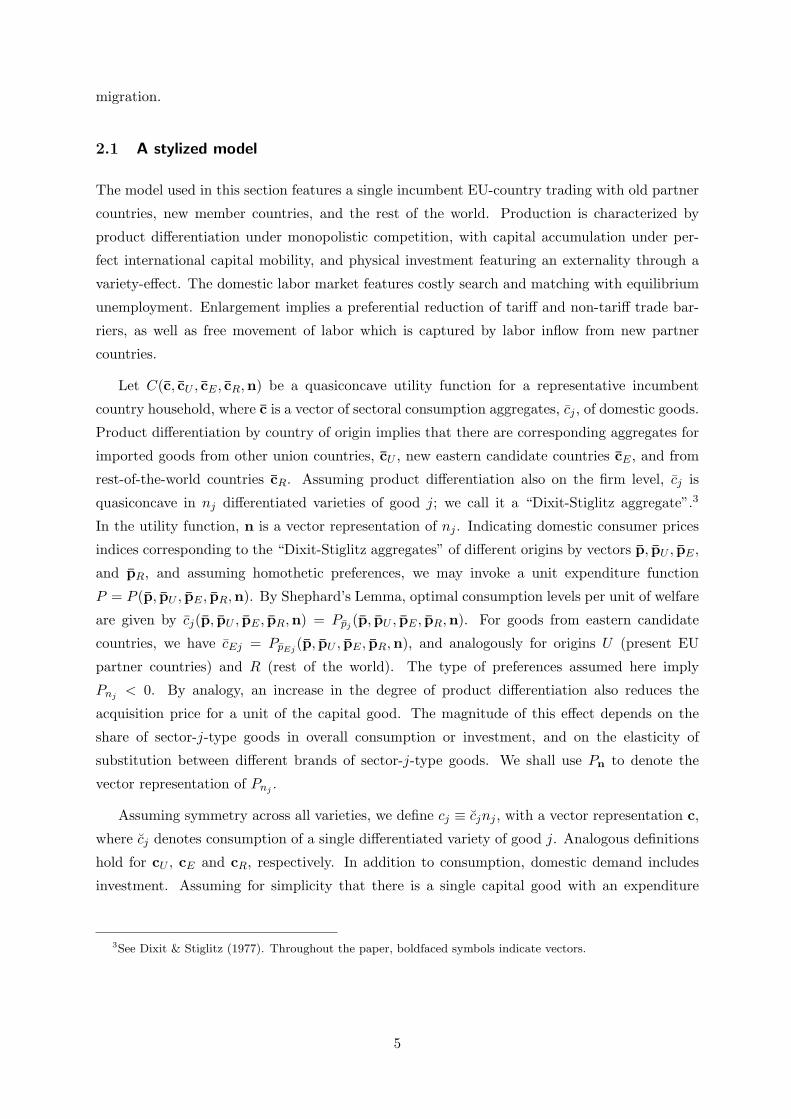
2.1 A stylized model
The model used in this section features a single incumbent EU-country trading with old partner
countries, new member countries, and the rest of the world. Production is characterized by
product differentiation under monopolistic competition, with capital accumulation under per-
fect international capital mobility, and physical investment featuring an externality through a
variety-effect. The domestic labor market features costly search and matching with equilibrium
unemployment. Enlargement implies a preferential reduction of tariff and non-tariff trade bar-
riers, as well as free movement of labor which is captured by labor inflow from new partner
countries.
Let C(c, cU , cE , cR,n) be a quasiconcave utility function for a representative incumbent
country household, where c is a vector of sectoral consumption aggregates, cj , of domestic goods.
Product differentiation by country of origin implies that there are corresponding aggregates for
imported goods from other union countries, cU , new eastern candidate countries cE , and from
rest-of-the-world countries cR. Assuming product differentiation also on the firm level, cj is
quasiconcave in nj differentiated varieties of good j; we call it a “Dixit-Stiglitz aggregate”.3
In the utility function, n is a vector representation of nj . Indicating domestic consumer prices
indices corresponding to the “Dixit-Stiglitz aggregates” of different origins by vectors p, pU , pE ,
and pR, and assuming homothetic preferences, we may invoke a unit expenditure function
P = P (p, pU , pE , pR,n). By Shephard’s Lemma, optimal consumption levels per unit of welfare
are given by cj(p, pU , pE , pR,n) = Ppj (p, pU , pE , pR,n). For goods from eastern candidate
countries, we have cEj = PpEj (p, pU , pE , pR,n), and analogously for origins U (present EU
partner countries) and R (rest of the world). The type of preferences assumed here imply
Pnj < 0. By analogy, an increase in the degree of product differentiation also reduces the
acquisition price for a unit of the capital good. The magnitude of this effect depends on the
share of sector-j-type goods in overall consumption or investment, and on the elasticity of
substitution between different brands of sector-j-type goods. We shall use Pn to denote the
vector representation of Pnj .
Assuming symmetry across all varieties, we define cj ≡ cjnj , with a vector representation c,
where cj denotes consumption of a single differentiated variety of good j. Analogous definitions
hold for cU , cE and cR, respectively. In addition to consumption, domestic demand includes
investment. Assuming for simplicity that there is a single capital good with an expenditure
3See Dixit & Stiglitz (1977). Throughout the paper, boldfaced symbols indicate vectors.
5

function identical to P (·), overall levels of domestic demand for domestic goods are
d = c(CL + I), (1)
where L is the population size and I is the economy-wide level of investment demand.4 By
complete analogy, demand for imports from partner countries are mU = cU (CL + I), and
analogously for imports from outside the initial EU, mE and mR.5
We now introduce a GNP-function to describe aggregate income and production:
p′y = G[p,K, Le]. (2)
This function simply states that the overall value of domestic output, at domestic prices, depends
on these prices and on the capital stock K as well as the amount of labor Le effectively used in
production. Domestic output level in sector j is measured by yj ≡ yjnj , where yj is output of
a single variety, and y is a vector representation of yj . For the sake of simplicity, this stylized
exposition assumes intersectoral mobility of both labor and capital.6 Allowing for unemployment
due to costly search, we have
L = Le + Lu + Lv, (3)
where L is the stock of domestic labor, and Lu unemployed labor, while Lv is labor employed
for search on the labor market; see below.
The link between the GNP-function and outputs of the economy is not straightforward, due
to market power associated with product differentiation and increasing returns to scale. We
invoke the notion of monopolistic competition to jointly determine the number of varieties and
output per variety, given the economy’s resource base in the form of its capital stock K and its
directly productive labor force Le. All of this will be dealt with in somewhat more detail below.
Both production and demand respond to domestic prices. The extent of market integration
determines how these are related to foreign prices. More specifically, there are policy-induced
price-wedges which will partly disappear if enlargement extends the single market to new member
countries. We use tUj to indicate formal barriers to external trade (common external tariff), and
4The computational model does, of course, take into account the different compositions of composite con-sumption and capital goods, as empirically observed. Moreover it makes a distinction between high-skilled andlow-skilled components of the labor force L which is, in turn, composed of Blanchard-type overlapping generations;see Blanchard (1985). For the sake of simplicity, these features may be ignored in this stylized model.
5Notice the conceptual difference between cj (a concave quantity aggregator for differentiated varieties of goodj) and cj ≡ cjnj which is simply a summary measure of good j consumption. If pj is the dual price index for cj ,and if pj is the price of a single variety of good j, we have pj cj = cjnjpj .
6In the computational model, capital is sector-specific in the short run, but mobile across sectors in the long runsince it is subject to depreciation and accumulation. Moreover, the computational model differentiates betweenlabor with a high and low level of skills.
6

τUj to denote the technical (non-tariff) barriers that are targeted by the EU’s Single Market
program. Then, expressing all barriers in specific terms, we have
pSj = pSj + τUj + tUj , and pSj = pj + tSj + τSj , for S = E,R (4)
where a tilde denotes foreign market prices. Thus, prior to enlargement, all barriers equally
apply for E and R. Note the difference between (producer) prices for goods from country S
prevailing in that country, pSj , and prices paid by consumers in country S for goods exported
by the incumbent country, pSj .
Following common practice of normative theory of economic integration, per capita utility
C is determined by equating domestic expenditure on consumption and investment to the econ-
omy’s aggregate income, plus redistributed tariff revenues, minus net budgetary transfers to the
union, denoted by B.7 Normalizing utility such that the marginal utility of income is equal to
one initially, we have
P (p, pU , pE , pR,n)CL = G(p,K, Le)− P (p, pU , pE , pR,n)I + t′UmE + t′UmR −B, (5)
where a prime indicates scalar vector multiplication, and tU is a vector of common external
tariffs of the union. Notice that P (p, pU , pE , pR,n)C = p′c + p′U cU + p′
E cU + p′RcU = p′c +
p′UcU + p′
EcE + p′RcR, where a bar indicates Dixit-Stiglitz aggregates, while c is a vector
representation of cj ≡ cjnj , where cj is consumption of a single variety, and similarly for goods
of foreign origin. An analogous equality holds for investment demand P (p, pU , pE , pR,n)I. To
keep matters simple, this formulation ignores various elements of the computational, such as the
role of intermediate inputs and all government policies other than the ones related to the single
market. Notice that there are no tariffs on intra-union imports mU , and technical barriers τU ,
while importantly driving domestic prices, do not give rise to any revenue. Moreover, with trade
policy being a common policy of the EU, all tariff revenue is direct EU revenue. Hence, B must
include the tariff revenue collected by the incumbent on behalf of the EU.
Since equation (5) has the total labor force L appearing on the left-hand side (the expenditure
side), whereas income on the right-hand side is determined by productive labor input Le, we
may treat C as welfare per capita of the labor force which is partly unemployed. The level of
welfare is determined by a) the economy’s endowment and its employment rate Le/L, b) by
the policy-wedges and the amount of transfers to be paid to the EU, and of course c) by the
various goods prices determined on commodity markets. As indicated above, a full solution
of the model is left to its computational version which incorporates goods market equilibrium
7See for instance Baldwin & Venables, 1995). A similar exposition which rules out unemployment is found inKohler & Keuschnigg (2001).
7

conditions. Suffice it to say that market equilibrium for domestic goods require that domestic
export supply, x = y − d, is equal to the sum of export demand in all possible destinations,
U , E, and R. Export demand, in turn, is subject to distortions analogous to import trade, as
evidenced by (4).
We now proceed to a welfare calculus of enlargement by differentiating equation (5) above.
With respect to the price wedges in (4), eastern enlargement reduces tUj and technical barriers
τUj for imports from new partner countries, mE , while retaining them for outside countries
R. Similarly, barriers tEj and τEj are abolished for exports to new partner countries, while
retaining tRj and τRj . Moreover, enlargement leads to an increase the domestic workforce L
from inward migration caused by extending single market status to migrants from new partner
countries. And finally, it implies a higher level of net-transfers B to the European Union.
Even if we are willing to leave aside how goods prices will evolve from the market equilibrium
conditions, such a welfare calculus proves highly revealing if we duly take into account the
relevant “tangency conditions” of adjustment. We fist look at a key static condition governing
production adjustment. For distortion-free markets without product differentiation and fixed
cost, and with a stationary resource base, we would have Gp dp = y′dp, plus the usual tangency
condition p′ dy = 0. However, with growth and monopolistic competition, things look different.
Assuming a mobile capital stock and mobile labor, with marginal value productivities in their
variable input use equal to wK and wL, respectively, the relevant “tangency condition” is
q′ dy + f ′ dn− wK dK − wL dLe = 0, (6)
where q is a vector of marginal cost in the different sectors, and f is a vector of fixed costs.8
Based on condition (6), and taking into account Shephard’s Lemma, we obtain a welfare change
dC which satisfies
PLdC = −m′E dτU −m′
R dτU + t′U dmE + t′U dmR
+x′ dp−m′U dpU −m′
E dpE −m′R dpR
+(p− q)′ dy − [(CL + I) Pn + f)]′ dn
+wK dK − P dI + wL dLe − PC dL− dB. (7)
This equation must be interpreted as a change across steady states. Assuming a depreciation
rate δ and perfect international capital mobility with a given world interest rate i∗, the change
8A somewhat more detailed derivation of this condition is given in Kohler & Keuschnigg (2001) where we ruleout unemployment.
8

in investment demand and the capital stock are related according to
dI = (i∗ + δ) dK, (8)
where i∗ dK is the annuitized opportunity cost of increasing the domestic capital stock by dK.9
Translating the enlargement scenario into formal modeling parlance, the exogenous changes
in (7) are dτU = −τU for mE , and dτU = 0 for mR. Moreover, there is a change dtU = −tU
which is applied to mE , while tU is left in place for mR. Similarly, we have dtE = −tE and
dτE = −τE , while dtR = 0 and dτR = 0. Moreover, since this model is obviously no migration
model, we we must similarly treat the migration-induced change in the domestic work force
dL > 0 as an exogenous variable. In our computational analysis below, this will be specified by
relying on extraneous econometric estimates. And finally, the scenario involves an exogenous
change in net transfers to the union, dB > 0, which we similarly specify from extraneous
sources below. All other changes in equation (7) must be seen as endogenously determined by
general equilibrium conditions. Although, as mentioned before, we leave a full solution to the
computational part of the paper, several important insights may be obtained by looking more
closely at the various components of equation (7).
2.2 Trade effects
Trade effects are the most conventional and most readily understood effects of enlargement.
Nonetheless, equation (7) serves to highlight a few points worth mentioning. Thus, we first
note that dτU appears as directly welfare-relevant, while dtU , dtE and dτE do not. Single-
market-induced reductions in real trade costs, dτU < 0, are directly beneficial, in accordance
with the incumbent’s initial level of imports from new partner countries, as captured by the
term −m′E dτU > 0. They entail a savings in real resource use, without any loss in tariff
revenues. Formally speaking, there is a positive first-order “rectangle-effect” on welfare. By
way of contrast, reductions in pure distortions, such as dtU < 0, involve a loss in tariff revenue,
hence the corresponding welfare effects are “triangular”, or second-order. In equation (7), they
appear in the form of −dt′U dmE−dt′U dmR, with dtU = −tU . These terms also remind us that
enlargement involves preferential liberalization, with a risk of trade diversion. Any increase in
mE has a positive welfare effect on account of the initial distortion tU > 0 which gets reduced,
but if it comes at the expense of third-country imports where barriers remain in place, then the
welfare gain is eroded on account of the term t′U dmR. As regards exports, “rectangular” single-
market-effects would by analogy show up in a symmetric welfare calculation for new partner
9The computational model features sector-specific capital stocks and gradual adjustment through time, dueto convex installation cost for capital.
9
countries. From an incumbent’s point of view, the crucial point is that lower price wedges in
partner countries boost demand for its exports, contributing to a positive terms-of-trade effect
x′ dp. While any terms-of-trade improvement, dp > 0, affects domestic welfare on the basis of
total exports, the extent of the price increase is determined by size of the export demand shift
initiated by enlargement, which depends on the significance of new member counties’ demand
for an incumbent countries output. Moreover, equilibrating price changes dp are, of course,
also determined by the domestic supply response dy, which is driven by the resource base effect
of enlargement through endogenous accumulation of capital, and through enlargement-induced
immigration. These supply reactions, and their welfare relevance, will be taken up in the next two
subsections. The final three terms in line two of equation (7) indicate terms-of-trade changes
on the import side. These are determined from world market equilibrium conditions for the
respective goods and do not warrant further comment here.
2.3 Product differentiation and growth effects
With monopolistic competition, supply responses have several direct welfare consequences. First,
the third line in (7) highlights the typical variety vs. efficiency trade-off. With prices above
marginal cost, p − q > 0, any output expansion, dy > 0, as such has a positive effect. This
is further reinforced if output expansion comes in the form of additional varieties, dn > 0,
since Pn < 0, due to Dixit-Stiglitz-type “love of variety”. However, this is potentially offset
by the implied duplication of fixed cost f , as highlighted by the term −f ′ dn in (7), and the
net-effect seems ambiguous a priori. We can, however, say more by observing further “tangency
conditions”.
Profit-maximizing firm behavior implies a restriction on possible equilibrium outcomes. Sup-
pose that each sector is characterized by monopolistic competition. Then, output response is
governed by a zero-profit-condition. Moreover, output response needs to be considered jointly
with changes in the productive resource base, dK and dLe, which importantly drive the zero-
profit monopolistic competition equilibrium. More specifically, what shows up in the form of a
scale-effect on the rate of growth in many endogenous growth models, may in this context be
described as a positive influence of capital accumulation and and higher employment, , dK > 0
and dLe > 0, on the degree of domestic product differentiation n. We denote the reduced form
derivatives of the numbers of varieties, within each sector, with respect to the overall capital
stock and overall employment by nK and nLe , respectively. If the fixed cost technology and the
10

marginal cost technology are the same, then the change in the zero profit equilibrium satisfies10
(p− q)′ dy − [(CL + I) Pn + f)]′ dn = (CL + I)P ′n[nK dK + nL dLe]. (9)
In this case, the product differentiation effect of a change in the resource base is the dominating
element of adjustment. This establishes a link between lines 3 and 4 of equation (7). In the
single-sector case nK and nL are clearly positive, but in a multi-sector environment this need not
be true for each sector. For our purposes, though, it seems safe to assume nK > 0 and nL > 0,
in which case both capital accumulation and additional overall employment have a positive
first-order welfare effect. The remaining question is how K and Le respond to enlargement.
It seems reasonable to assume that a single private investor treats P as given, thus ignoring
P ′nnK dK in her accumulation decision. The first-order condition on capital accumulation then
requires that the steady state user cost of capital, (i∗ + δ)P , is equal to the marginal value
productivity of capital, wK , for a given price index P . This dynamic “tangency condition”,
together with the steady state relationship (8) implies
wK dK − P dI = 0. (10)
This is not to say that enlargement has no accumulation effect. We need to bear in mind that
the marginal value productivity of capital, wK , depends on the capital intensity and on the
final output price. Hence, with a given world interest rate i∗, any increase in output prices p
relative to the acquisition price of capital P requires an increase the capital intensity to restore
the afore-mentioned accumulation condition. It will, therefore, lead to capital accumulation.
Indeed, this is a likely impact of enlargement, due to a higher export from new members, which
contributes to higher p, coupled with cheaper imported capital goods. Nor does equation (10)
say that there is no distortion in the accumulation decision. Indeed, there is an investment
externality which is captured by the first term on the right-hand side of (9), where dK is left in
the welfare calculus, after the term wK dK−P dI in equation (7) has vanished due to condition
(10).11
2.4 Immigration and labor market effects
The remaining terms to look at in equation (7) relate to the labor market effects of enlargement,
and to the budgetary cost. Suppose, in line with Pissarides (2000), that within a certain industry
at each point in time there is an exogenous rate of job separation equal to s, and hiring new
10This follows reasoning analogous to Kohler & Keuschnigg (2001).
11On this type of externality, see also Keuschnigg (1998).
11

workers requires that firms divert part of employed labor to recruiting activities. Thus, if
employment is equal to L − Lu, then directly productive labor input is equal to L − U − κV ,
where V is the number of vacancies and κ denotes the labor required to search for a posted
vacancy. In terms of equation 3, Lv = κV . Measuring the labor market tightness by θ ≡ V/Lu,
we may stipulate a hiring technology such that at any point in time the inflow into employment is
equal to q(θ)V , where q′ < 0. Using u ≡ Lu/L to denote the fraction of unemployed finding a job
is then equal to f(θ) ≡ q(θ)V/(uL) = q(θ)θ, where it is assumed that f ′ > 0, i.e., the elasticity
of q(θ) is less than one in absolute terms. Equating job separation with the number of people
finding new employment, s(1− u)L = f(θ)uL, we obtain a steady state rate of unemployment
u(θ) = s /[s + f(θ)] . (11)
The unemployment rate shrinks with increasing labor market tightness, u′ ≡ ∂u/∂θ < 0. In
turn, labor market tightness is determined by an optimality condition on the number of vacancies
V that firms wish to maintain at a given point in time. This condition requires that, at the
margin of V , the opportunity cost of a vacancy, κwL, is equal to the present value of this vacancy
to the firm. If the wage rate is denoted by wL, the steady state version of this condition is
(wL − wL)q(θ)/(i∗ + s) = κwL (12)
This is analogous to the first order condition on capital accumulation, and it implies a wedge
between the marginal value productivity of labor, wL, and the wage rate equal to µ(θ) ≡wL/wL = q(θ)/[q(θ)−κ(i∗+s)] > 1. It is clear from condition (12) that labor market equilibrium
depends on the wage rate wL. We follow the established literature in assuming Nash-bargaining
between firms and employees. The bargaining outcome importantly depends on workers’ outside
option, i.e., on unemployment benefits. We shall return to this below.
We can now identify important channels of labor market effects from enlargement. As with
capital accumulation, we must distinguish between two questions. One is whether enlargement
affects labor market tightness, the other is whether this affects domestic welfare and, if so, in
what direction. Any terms-of-trade improvement, dp > 0, implies a rise in the marginal value
product of labor wL, as does a more capital intensive production through capital accumulation,
dK > 0. For a given Nash-bargaining wage rate wL, equilibrium then requires a rise in θ to restore
condition (12), which in turn lowers unemployment according (11). Of course, depending on the
bargaining process, such expansionary effects may be muted by offsetting increases in wL. In
particular, if unemployment benefits are indexed to nominal wages, then the outside option for
workers has risen in line with wL, and the expansionary effect is nullified.12
12See Heijdra, Keuschnigg & Kohler (2003).
12

Returning to the welfare calculus, we now need to explore how changes in labor market
tightness, dθ, in connection with enlargement-induced changes in the labor force, dL, jointly
affect productive employment Le and, thus, per capita welfare according (7), in connection with
(9). The relevant term to look at is ∆ ≡ (C + I)P ′nnL dLe+ wL dLe − PC dL. From (3), and
taking into account that dLz = κ dV = κ d[θuL], we have
dLe = (1 − u − κθu) dL− (u′L + κu′L + κuL) dθ (13)
∆ ={[
(CL + I)P ′nnL + µ(θ)wL
](1− u − κθu) − PC
}dL
−[(CL + I)P ′
nnL + wL
](u′L + κu′L + κuL) dθ (14)
This term looks terribly complicated but it is actually quite straightforward to interpret. As
emphasized by Dixit & Norman (1980, p. 147), under perfect commodity and labor markets, the
direct per-capita welfare effect of immigration is equal to (wL − PC) dL. If domestic residents
have non-labor income, then wL − PC < 0, and an inflow of “pure” labor reduces welfare per
capita. Here, there are three complications. First, there is a variety effect (C + I)P ′nnL raising
the marginal welfare effect of domestic employment above the wage rate. Secondly, there is
a wedge between the direct marginal value productivity of labor and the wage rate, due to
the distortion µ(θ) induced by job separation and hiring costs. These two effects imply that
immigration is less detrimental to per capita welfare than in the standard case. The third effect
works in the opposite direction, since only a share 1− u− κθu = 1− u(1 + κθ) < 1 of the labor
force is directly productive.
While higher labor market tightness, dθ > 0, always implies lower unemployment, its direct
welfare effect is ambiguous. There are two partly offsetting effects. Lower unemployment is
beneficial, but a tighter labor market also means that, for each unemployed worker, more labor
is diverted from productive use towards labor market search and recruiting activities. If the net
effect, given by the term u′L + κu′L + κuL in (14), is positive, then the direct welfare effect of
an increase in labor market tightness is negative. It is easy to show that this holds true, if and
only if
|σu| (1/θκ + 1) < 1, (15)
where σu ≡ θu′/u < 0 is the elasticity of the unemployment rate with respect to labor market
tightness, according to (11). This elasticity captures the “matching-efficiency” of the labor
market and the condition states a lower bound for this elasticity if an increase in labor market
tightness is to be beneficial in welfare terms. Notice that the term 1/θκ+1 is equal to the initial
ratio of unproductive labor (unemployed or engaged in recruiting) per unit of labor diverted for
recruiting.
Putting pieces together we may obtain an overall view on the welfare effects of EU enlarge-
ment on an incumbent country. Assuming constant world prices for all imported goods, we
13

have
P × (LdC) = x′ dp−m′E dτU + t′U (dmE + dmR)
+(CL + I)P ′nnK dK
+{[
(CL + I)P ′nnL + µ(θ)wL
](1− u − κθu) − PC
}dL
−[(CL + I)P ′
nnL + wL
](u′L + κu′L + κuL) dθ
−dB. (16)
Notice that dC is in per-capita terms, hence LdC may be interpreted as a “Benthamite measure”
of welfare change. The first line captures trade effects: terms-of-trade changes, the “rectangular”
single-market effect and the “triangular” trade creation and trade diversion effects. The second
line shows the variety effect arising from the growth, due to the investment externality. The
third line captures the direct welfare effect of single-market-induced immigration, including a
variety effect in addition to the search externality. And the fourth line shows the labor market
effect that arises from job separation and costly search. The final line completes the story
in subtracting increase net transfers to the union arising from the fiscal cost of enlargement,
assuming that this is financed domestically in a non-distortive way.
As emphasized above, some of the terms on the right-hand side of (16) are exogenous changes
directly related to the enlargement scenario: dτU = −τU , dL, and dB. Although we have been
able to identify key driving forces behind endogenous variables, such as the accumulation decision
behind dK and the vacancy decision behind dθ, or the commodity market clearing condition
behind dp, it becomes clear that much more detailed modeling is required to obtain a likely
order of magnitude for the welfare impact of enlargement, dC. Indeed, given the multiplicity of
potentially offsetting effects, even the sign of this welfare effect is ambiguous a priori, which turns
the question into an eminently empirical one. Moreover, any attempt to quantify dC must follow
a country-by-country approach. And finally, given the complexity of the general equilibrium
interactions behind the endogenous changes appearing in (16), a simulation approach based
on calibration seems a natural route to follow. This allows calculating discrete changes in C,
which is surely an important improvement upon the local “small changes approach” underlying
equation (16). And, perhaps most importantly, it allows us to introduce further structural
elements into the model that are crucial for the welfare effects of enlargement, such as a more
realistic government sector including distortionary taxes and government procurement.
3 Indirect quantification based on CGE-results
Ideally, one would have a multi-country model which captures the above mentioned enlargement
effects, and which is calibrated to all of the EU15 countries. Unfortunately, such a model is not
14

available. Indeed, it seems questionable whether one should be aiming for such an ideal model,
given the huge opportunity cost of the necessary research efforts. Faced with a restricted set of
models available, I propose an indirect approach.
3.1 The basic idea
The previous section has revealed three distinct exogenous elements of the enlargement scenario
for an incumbent country. a) A single-market-induced abolition of trade barriers dτU and dtU for
trade with new member countries from eastern Europe. b) Single-market-induced immigration
flows from new member countries, dL. And c), the budgetary cost of enlargement, dB. Suppose
we have at our disposal a fully specified model of the afore-mentioned kind, calibrated to a single
significant EU15 country, which allows us to calculate LdC for this country. In our case this is
Germany. We may then run separate simulations for each of these components of the scenario,
giving welfare effects
a: Ct ≡ (LdC)t/G, b: Cl ≡ (LdC)l/G and c: Cb ≡ (LdC)b/G, (17)
respectively. The term (LdC)t indicates the numerical welfare effect calculated for the trade
component a) of the enlargement scenario, ignoring components b) and c), and analogously for
labor migration, (LdC)l, and budgetary costs, (LdC)b. In our case, these are Hicksian equiv-
alent per-capita measures of present wealth variations, which fully capture all future changes
appearing in the dynamic model, taking into account the entire adjustment path, including for-
gone consumption in the process of capital accumulation. The measures are converted into a
permanent annuity then expressed as fractions of benchmark GDP, to arrive at Ct, Cl.and Cb
appearing in (17).
Suppose, next, that we have information on how the exogenous scenario components for
other EU15 countries differ from the German components. Let ti be an aggregate GNP-based
measure of the magnitude of the “trade-shock” from EU enlargement for incumbent country i,
and analogously for “migration-shocks” and “fiscal-shocks”, li and bi, respectively. We may then
draw on the simulation results from the detailed computational model for Germany to calculate
implied “model-elasticities” as follows:
ηt ≡ Ct/tG, ηl ≡ Cl/lG, and ηb ≡ Cb/bG. (18)
In (18), i = G indicates Germany where we have full simulation results Ct, Cl and Cb, re-
spectively, in line with (17) above. These elasticities can then be applied to the corresponding
“enlargement shocks” of other countries, to obtain their welfare effects:
Cti = ηt × ti, Cli = ηl × li, and Cbi = ηb × bi. (19)
15

Since, by construction, all figures are equivalent variations relative to GNP, an overall welfare
effect may be obtained by simply adding the three components.
This approach, admittedly, rests on a bold assumption. While stressing inter-country differ-
ences when looking at enlargement-induced shocks, we assume that the elasticities η derived from
a German CGE-model may be applied to all countries. It is obvious that the approach permits
no more than approximate results. However, the degree of approximation may to some extent
be improved by a careful construction of appropriate country-specific “enlargement shocks” ti,,
li and bi. Therefore, the following subsection, after briefly describing the computational model
for Germany, turns to a detailed description of how these “enlargement shocks” have been con-
structed towards an empirical analysis for the full set of EU15 member countries. The results
achieved from the approach described above will then be presented in section 4.
3.2 Country-specific “enlargement shocks”
Before turning to the country-specific “enlargement shocks”, I should say a few words about
the computational model used for Germany, which forms the basis of the empirical analysis
undertaken below.13 It should be thought of as a parameterized, multisectoral version of the
model that underlies the welfare equation (16) above. It includes a number of details that I have
deliberately ignored in the analytical section above. Thus, in addition to the sectoral structure,
the model makes a distinction between high-skilled and low-skilled labor, and it includes a
rich specification of the government sector, with several distortive taxes, as well as government
procurement and government debt. The household sector features overlapping generations, as
introduced by Blanchard (1985), with forward-looking consumption and savings decisions. On
the production side, there are forward-looking investment decisions subject to convex installation
costs. A novel feature of the model is the presence and empirical implementation of “search-
unemployment” in a dynamic context with savings and investment. The model is calibrated
to a 1996 benchmark data set. The solution assumes perfect foresight and traces out the full
adjustment path to the new steady state. Unlike the stylized analytical model above, the
welfare measure used for the empirical section below is not restricted to the steady state, but
incorporates the full adjustment path, and it includes a vast array of endogenous variables.14
13The computational model used there extends on Keuschnigg, Keuschnigg & Kohler (2001) by adding searchunemployment as indicated above. These new elements are described in more detail in Heijdra, Keuschnigg &Kohler (2002). The numerical results obtained for Germany are presented in detail in Heijdra, Keuschnigg &Kohler (2004).
14Available space precludes a more detailed description of the model structure and calibration. The interestedreader is referred to Heijdra, Keuschnigg & Kohler (2002), and to Keuschnigg, Keuschnigg & Kohler (2001)for an earlier model without “search-unemployment”. A similar model for Austria is presented and applied inKohler & Keuschnigg (2001) and Keuschnigg & Kohler (2002). The interested reader may also wish to consulthttp://www.econ.jku.at/kohler/eu-new.htm.
16

However, in this paper we exclusively draw on the “bottom-line” welfare results.
Barring such a detailed model for other incumbent countries, how may we construct appro-
priate “enlargement shocks” for each of the EU15 countries that may be combined with the
welfare-elasticities extracted from the German model, as described above? I first turn to the
trade component of enlargement. Enlargement-induced trade integration will have different ef-
fects for each of the EU15 countries, depending on the volume and detailed commodity pattern
of its trade with accession countries. Not only do some incumbent countries trade far less with
accession countries than others, but some countries’ trade with these countries is focused on
goods where the barriers to be dismantled are particularly large, while other countries’ trade
may be concentrated in goods with relatively low barriers. A reliable country-specific measure
of the trade shock from enlargement requires observations on both, the extent of bilateral trade
with new members and the incidence of barriers. The measure used for the present purpose is
based on averages of commodity specific trade barriers, weighted by imports of each commodity
from accession countries. I have constructed such averages for tariff- and non-tariff barriers,
and for exports and imports, in each case relying on the 6-digit level of the Harmonized System
(HS) which comprises over 5,000 different commodities. Moreover, I have refined the measure
by adjusting the resulting indices for the possibility of trade diversion. Full details regarding the
construction and theoretical justification of these measures are presented in Kohler (2000).15
Extending the Single Market to new members from eastern Europe implies that workers may
freely decide upon the country of residence and work, irrespective of their citizenship. Given
the sizable wage gaps between incumbents and new members, and depending on the sensitivity
of these locational decisions with respect to observed and expected future wage differences,
enlargement may thus cause significant further migration from new to old member countries.
These will, however, be vastly different for different incumbents, and they are likely to peter out
as wage gaps disappear.
I construct country-specific measures of enlargement-induced migration, relying on estimates
reported by the European Integration Consortium (2001). These are based on a time-series
model which explains the change in the stock of foreign residents relative to the German home
population by changes in German wages relative to foreign wages, as well as changes in the
15For instance, the average tariff barrier relating to an EU country i is∑
j µijtUj , where tUj is the common
external tariff in commodity j, and µij denotes commodity-j-imports from accession countries into country i,
expressed as a share in country i’s GDP. Analogous calculations are made for non-tariff barriers, and for exportsto accession countries. The data source is the OECD International Trade by Commodity Statistics (ITCS) databank (on CD-DOM), and the corresponding OECD Indicators of Tariff and Non-tariff Barriers (on CD-ROM),as well as Finger et al. (1996). In terms of the notation used in Kohler (2000), the overall measure used for ti iscomposed of the indices T i
O + KiO + N i
O + Xi. There is no direct interpretation of this composite index, but thisdoes not in any way harm its use in the approach described above, since that approach relies on a normalizationsuch that the index value for Germany is 1.
17

unemployment rates in Germany and the foreign country, respectively. The underlying model
thus stipulates an equilibrium relationship between the stock of foreign-born residents and the
difference between German and foreign wages, foreign country in case meaning the group of 10
central and eastern European countries (CEEC). The econometric model allows projections for
the number of people from these countries that will be living in Germany in the years up to 2030.
Looking at how migrants from these countries living in the EU15 in 1998 were distributed within
the EU15, one may extrapolate on the basis of the German projection, to obtain an estimated
increase in the number or eastern migrants living in the EU15 from some 850 thousand in 1998
to roughly 3.9 Mio people in 203016. The corresponding numbers for Germany are 550 thousand
and 2.5 Mio, respectively. I take differences in estimated stocks vis a vis 1998, in order to obtain
net migration flows. Following the European Integration Consortium (2001, p.101), I assume
that 35 percent of that flow will enter the labor market.
Since our computational model emphasizes a distinction between high-skilled and low-skilled
labor, I have attempted a corresponding breakdown also of the migration scenarios. Available
evidence indicates that roughly 40 percent of the people from the 10 accession countries employed
in the EU in 1995 had a formal education level corresponding to secondary education, or higher.17
I therefore assume that 40 percent of the people migrating from east to west will fall into the
model category of high-skilled labor. This gives us two separate flows of migrants entering
EU15-countries’ labor markets for high-skilled and low-skilled labor. In a last step, I express
these inflows as fractions of initial stocks which are calculated using labor force data, plus an
index of formal schooling for each EU15-country. More specifically, if Li is the labor force of
EU15-country i and Si is that country’s formal schooling index, then country i’s low-skilled
labor force is calculated as Li × (SG/Si)/λG, where λG is the share of low-skilled labor in the
calibrated German model.18 The resulting long-run rate of increase in the German labor force
is 6.15 percent for unskilled and 0.84 percent of skilled labor; see table 1 below.
The final exogenous element of the enlargement scenario relates to the fiscal burden that an
incumbent country faces from the budgetary cost of eastern enlargement. This is determined a)
by the magnitude of transfer payments to new members under the EU cohesion and agricultural
policies, and b) by the strategy that the EU adopts to accommodate these transfers, given
the fundamental requirement of a periodic budget balance. For the present purpose, I rely
on an econometric model of EU expenditure policy which explains payments received from
16See European Integration Consortium (2001), Part A, Table 7.11.
17See European Integration Consortium (2001), Part A, Table 5.6.
18This procedure simply takes 1/Si to scale λG up or down to arrive at λi. Si is calculated as the weighted sumof gross school enrollment rates, with weights equal to 0.1, 0.4 and 0.5, respectively, for primary, secondary andtertiary education. Labor force data are from European Integration Consortium (2001), Part A, Table 3.2. Dataon formal schooling are from the Worldbank Development Indicators 2001 (obtained from www.worldbank.org).
18

EU agricultural funds as well as EU cohesion funds by key economic characteristics, such as
agricultural and manufacturing shares in value added.19 Based on the estimated coefficients
of this model, the relevant expected economic variables of the accession countries yield an
estimate of agricultural and cohesion expenditure to be allocated to new members. Subtracting
accession countries’ own contributions to the EU budget (“own resources”), one arrives at the
cost of enlargement that EU15 countries have to share. For the so-called Luxembourg countries,
the estimated total cost to incumbents is 0.184 percent of EU15 GDP.20 According to the
initial financial framework for 1999-2006, the corresponding figure projected by the European
Commission (1997) for the year 2006 is somewhat lower, at 0.113 percent of EU15 GDP. The
later revision of that framework in European Commission (2002), which includes all 10 candidate
countries, seems to corroborate the somewhat higher figure from the econometric method.21
Since incumbent countries are differently positioned within the EU financial framework regarding
their receipts from agricultural and cohesion funds, their fiscal burden from this cost will differ,
and it will depend on the financing strategy adopted. My budgetary “enlargement shock” is
based on the assumption that the enlarged union will cut its cohesion expenditure, proportionally
for all countries, in order to balance the budget.22 The resulting fiscal burden for each of the
EU15 countries, bi, is expressed in percent of its GDP.
4 Empirical results
Table 1 first presents the welfare results obtained from a full solution of the German model
with an appropriate scenario decomposition, and the corresponding welfare elasticities that are
implied by these results, if compared with above country-specific enlargement shocks for i = G.
For instance, the German welfare effect from the trade component of the enlargement scenario,
according to the explicit solution of the CGE model, is 0.554 percent of GDP: Ct = 0.554.23
Confronting this with the German index value for the “trade shock”, tG = 0.397, we obtain
an implied welfare elasticity ηt = 0.554/0.397 = 1.394. Analogous interpretations hold for the
19See Breuss (1995). More details can be found in Kohler & Keuschnigg (2001), and in Keuschnigg & Kohler(1999).
20Luxembourg group: Czech Republic, Estonia, Hungaria, Poland and Slovenia. This is the group that startednegotiationg in 1998, after the Luxembourg summit of December 1997.
21For more details on the comparison between official Commission estimates and the ones used in our com-putational model, see Keuschnigg & Kohler (1999,2001), and – particularly regarding the later revision of theCommission estimates – Heijdra, Keuschnigg & Kohler (2002).
22For more details and alternative calculations, see Keuschnigg & Kohler (1999), as well as Kohler & Keuschnigg(2001).
23For data reasons, the trade scenario underlying the simulation reported on in Heijdra, Keuschnigg & Kohler(2002) is restricted to the so-called Luxembourg countries: Czech Republic, Estonia, Hungary, Poland, and Slove-nia. But these countries together are by far the major part also of the actual accession countries of 2004.
19

Table 1General equilibrium elasticities for a decomposed
enlargement scenario
Scenario decomposition trade budget migration (§)low-skills high-skills
C: CGE-model result for Germany (#) 0.554 -0.091 0.357 0.335“Enlargement shock” for Germany (*) tG = 0.397 bG = 0.070 tlG = 6.152 thG = 0.840“Implied” GE-elasticity ηt = 1.394 ηb = −1.309 ηl
l = 0.058 ηhl = 0.399
(#): C is the welfare effect (Hicksian equivalent variation) in percent of benchmark GDP, obtained for the
various subcomponents of the “enlargement scenario” from explicit solution of a detailed CGE model for
Germany, fully taking into account all adjustment dynamics; see Heijdra, Keuschnigg & Kohler (2002,2004).
(*): The four “enlargement shocks” corresponding to these components, tG, bG, llG and lhG, are calculated as
detailed in section 3, where i = G indicates Germany. Superscripts l and h denote low- and high-skilled labor.
(§): The migration figures lG give accumulated long-run changes in the domestic labor force.
“budget shock” and the “immigration shock”. Notice that we observe a pretty low fiscal burden
equal to 0.07 percent of GDP: bG = 0.07. This follows from the relatively low return flows to
Germany from EU cohesion funds, relative to German GDP. Moreover, the immigration shock
has a heavy bias towards unskilled labor. The welfare results from migration relate to the initial
domestic population. Thus, they are conceptually equivalent to the oft-quoted immigration
surplus. All welfare effects in table 1 must be interpreted as Hicksian equivalent variations in
percent of German benchmark GDP. They are “bottom-line assessments” of a complex process
of dynamic adjustment, incorporating all ingredients emphasized in section 2 above. It must be
emphasized that they do not reflect a mere steady state comparison, but consistently take into
account how welfare of overlapping household generations are affected throughout the entire
adjustment path.24
Table 2 presents country-specific “enlargement shocks” for the full set of EU15 countries,
with German values reappearing from table 1. They may now be combined with the model
elasticities of table 1. For instance, the welfare gain from trade integration accruing to France is
obtained by multiplying the French “trade shock”, tF = 0.103, with the aforementioned welfare
elasticity. Thus, CtF = 0.103× 1.394 = 0.103. This is significantly lower than the German gain,
due to a lower “natural” level of trade between France and new member countries. As a further
example, we may look at the welfare effect from the budgetary cost of enlargement for the case
or Portugal. For obvious reasons, Portugal stands to lose much more from lower cohesion funds
24See Keuschnigg & Kohler (1997) for a detailed description of the appropriate welfare measure to be used incomputational models like this.
20

than does Germany: bP = 1.025, compared to a value of 0.07 for Germany. Applying this to
the corresponding welfare elasticity from table 1, we obtain CtP = −1.025 × 1.309 = −1.342.
Finally, we take an example for the migration component of the scenario by considering Spain,
where migration flows from eastern enlargement are expected to be modest. The calculated
“migration shock” for Spain is, indeed, a mere 5 percent of the German value. Applying the
relevant elasticities, we obtain a welfare effect from low skilled immigration equal to C llS =
0.312 × 0.058 = 0.018. For high-skilled migration we have ChlS = 0.037 × 0.399 = 0.015.
To save space, table 2 does not produce each component of the country-specific welfare result,
but the final column gives the overall welfare effect from eastern enlargement for each incumbent
country of the EU15. These are simply obtained by summing up: Ci = Cti + Cbi + C lli + Ch
ti.
By construction, the interpretation of Ci is that of a Hicksian equivalent variation, expressed
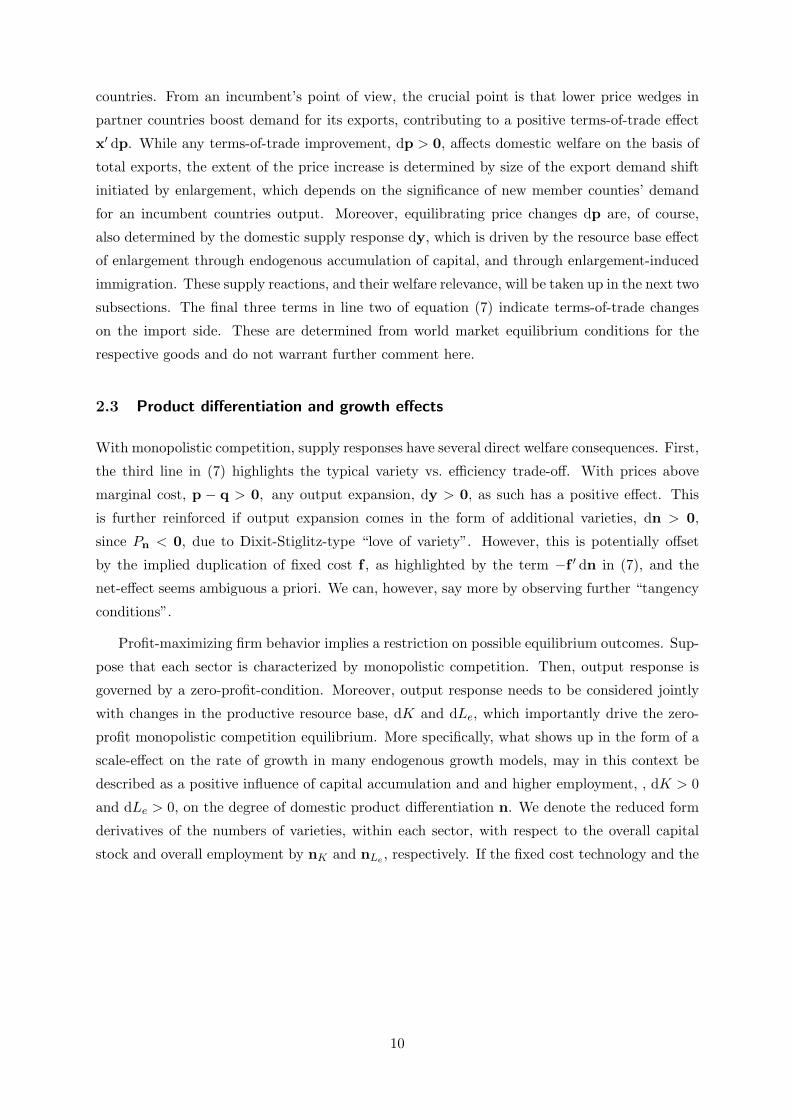
in percent of a country’s GDP. Figure 1 visualizes the inter-country pattern of overall welfare
effects, this time in conjunction with the various components reflecting trade, budgetary costs,
and immigration.
A comparison of countries reveals a great deal of variation. The welfare gain from trade
integration comes close to 1 percent of GDP for Austria and exceeds half a percent for Germany
and Finland, while it is almost negligible for Portugal and Spain. The fiscal implications from
the cost of enlargement are also quite uneven across present member countries. Specifically,
when the budget of the union is balanced through cutting cohesion funds, several countries at
the southern and western periphery of the EU stand to gain only little from integrated markets,
but they nonetheless face a significant fiscal burden from enlargement. Notice also that the
welfare elasticity is larger than one. The welfare loss of a country is higher than its share in the
fiscal burden. The interpretation is that general equilibrium repercussions make net outward
transfers to the union level a contractionary “policy” for an incumbent country’s economy.
Inter-country differences are most pronounced when it comes to migration. Accumulated
migration inflows vary from almost nil in countries like Spain and Portugal to as much 10 percent
for unskilled labor in Austria, or 6 percent in Germany. From a policy perspective, a notable
feature of the immigration scenario is that it yields both negative and positive effects. This is
true even for the marginal welfare calculus summarized by (16) above. The welfare elasticities
for migration reported in the final line of table 1 also reflect the so-called immigration surplus,
deriving from infra-marginal units of labor. It is well known, that the immigration surplus
typically comes at the expense of potentially troublesome distributional effects.25 In the present
case, given the asymmetric composition of the migration flow between high-skilled and low-
skilled labor, redistribution appears in differential wage effects for these two types of labor.
25See, for instance, Borjas (1999).
21

Table 2Welfare effects of enlargement for EU15 countriesbased on country-specific “enlargement shocks”
“enlargement shocks” (§) welfaretrade budget migration effect (*)
ti bi lli lhi Ci
Austria 0.662 0.071 10.526 1.444 2.017Belgium (#) 0.230 0.225 1.419 0.144 0.166Denmark 0.276 0.070 1.481 0.182 0.452Finland 0.454 0.135 2.543 0.268 0.711France 0.103 0.076 0.390 0.049 0.086Germany 0.397 0.070 6.152 0.840 1.154Greece 0.084 0.756 1.858 0.274 -0.655Ireland 0.167 0.684 0.052 0.007 -0.657Italy 0.187 0.100 0.609 0.089 0.201Luxembourg (#) 0.230 0.189 2.121 0.215 0.282Netherlands 0.271 0.072 0.682 0.079 0.355Portugal 0.032 1.025 0.072 0.010 -1.289Spain 0.057 0.409 0.312 0.037 -0.423Sweden 0.235 0.055 3.217 0.349 0.581UK 0.090 0.068 0.689 0.077 0.107
EU15 – GDP-weighted average: 0.342EU15 – population-weighted average: 0.303EU15 – council-votes-weighted average: 0.200
(§): See the text for a detailed description of the different “enlargement shocks”. Thesubscript index i denotes the 15 countries. German values reappear from table 1 above.
(#): bi-estimate based on the assumption of a proportional increase in own resources.For all other countries the underlying assumption is a proportional cut in cohesion funds.
(*): Overall welfare effect Ci = Cti + Cbi + Clli + Ch
li according to equation 19 in the text,where the corresponding eta-values are taken from table 1 above.
Moreover, the employment effects of immigration are also quite different for high-skilled and
low-skilled labor. For lack of space, however, we have to restrict this presentation to welfare
effects.26
Section 2 has revealed that the trade integration and migration components of the enlarge-
ment scenario have both positive and negative effects. In the German case, table 1 shows that
the positive effects are clearly dominating. This, however, need not be the case – a priori – for
other countries. But looking at the pertinent “enlargement-shocks” in table 2, we find that the
index values for the trade and migration shocks are positive throughout. If applied to positive
elasticity values taken from the German model, this effectively rules out negative welfare effects
26See Heijdra, Keuschnigg & Kohler (2004) for a more detailed account of these effects in the simulation resultsfor Germany.
22

-1,8
-1,5
-1,2
-0,9
-0,6
-0,3
0,0
0,3
0,6
0,9
1,2
1,5
1,8
2,1
2,4
Perc
en
t o
f G
DP
AUT GER FIN SWE DK NED LUX ITA BEL UK FR SPA GRE IRE PT
fiscal burden
trade integration
immigration
overall welfare effectSource: see Table 2
Figure 1: Welfare effects of eastern enlargement for EU15-countries
for any of the other countries. In other words, the approach pursued here effectively assumes,
once our CGE model tells us that the trade-related and migration-related effects of enlargement
exert positive net welfare effects on the German economy, that these effects will be positive also
for other countries, but in a scaled-down or scaled-up way, depending on the relative position
of the country-specific “enlargement shocks”. Obviously, the validity of this procedure relies on
an appropriate measurement of the “enlargement shocks”.27 In particular, the measures should
duly capture those elements are responsible for negative integration effects. This would not be
the case if we merely took ordinary trade shares, for instance. But, as I have already pointed
out above, ti is defined in a much more elaborate way. Not only does it take into account the
incidence of trade barriers. It also tries to correct for the likelihood of trade diversion. As
regards migration, I have constructed measures that directly correspond to dL in equation (16).
We may finally wonder about aggregating the country-specific welfare effects to the EU15
as a whole. Table 2 gives three alternative summary measures, all defined as weighted averages.
The first measure is perhaps the most interesting to look at. From equation (17) above, the
country-specific measures must conceptually be interpreted as Ci ≡ (Li dCi)/Gi . Forming a
27Obviously, this problem does not arise with the enlargement-induced change in net budgetary transfers tothe EU, dB, which – as such – has an unambiguously negative welfare effect in equation (16).
23

GDP-weighted average gives15∑i=1
CiGi
GEU=
∑15i=1(Li dCi)
GEU, (20)
which is directly comparable to the single-country measure, and which has a “Benthamite”
interpretation. While this measure and the population-weighted average are about the same,
revealing a 0.3 percent gain for the EU15 as a whole, weighting with council votes reduces the
aggregate figure to 0.2 percent. This is due to the relatively low voting-weight of large countries
like Germany. Interestingly, pre-Nice and post-Nice voting-weights give aggregate numbers that
are virtually the same. While Germany, a large beneficiary country receives a larger weight
post-Nice, Austria, a small beneficiary, looses voting-weight from pre- to post-Nice. These two
effects apparently cancel out.
Although the early results for the EU15 as a whole presented by Baldwin, Francois & Portes
(1997) are based on a vastly different model and on a somewhat different enlargement scenario,
it is worth comparing results. The BFP-results are in the vicinity of a 0.2 percent steady
state real income gain for the EU15. The present result of 0.3 percent is somewhat higher.
Three important points must be made with respect to this comparison. First, the BFP-result
is a long-run real income gain, while the above result is a Hicksian-equivalent welfare measure.
It is clear from section 2 above that long-run real income gains may not be equated to welfare
effects, as they ignore forgone consumption from accumulation as well as steady state investment
expenditure. Hence, conceptually speaking, the BFP-results overstate the effects. By way of
contrast, our Hicksian-equivalent variation fully takes these into account. In a similar vein,
the real income gain reported by BFP only relates to the market-integration-component of our
enlargement scenario. It needs to be set against the budgetary cost. In this sense as well, the
BFP-result overstates the welfare effect. On the other hand, the BFP-scenario does not include
migration which, according to our model elasticities above, is a positive component in welfare
terms. Including this in our scenario, we end up with a somewhat higher aggregate effect, at
least if we look at the “Benthamite” or population-weighted measures.
5 Conclusion
Although this paper is firmly rooted in normative theory, its purpose is not to come up with pol-
icy advice. Indeed, the policy problem in the present case is of a somewhat special nature. There
was an early commitment to eastern enlargement for reasons not directly related to economics,
and the formal decision has already been made in 2002. Hence, policy advice in the true sense
of the word does not appear to be called for. The challenge now – particularly in incumbent
countries, but maybe even in accession countries – is one of “selling” the decision to the domestic
electorate where anxieties still seem to prevail. This is all too often done by referring to some
24

isolated effect, sometimes blown up beyond proportions, and quite remote from quantification.
By way of contrast, this paper attempts a sober “bottom-line” analysis, based on an explicit
welfare calculus focused on market integration as a key economic ingredient of enlargement. It
does so both in qualitative and quantitative terms. It is to be hoped that a comprehensive
analysis of this kind proves a useful input for a well-balanced policy debate, notwithstanding
the fact that it does not unambiguously portray enlargement as a clearly beneficial step for all
countries.
While it is not too difficult to imagine that enlargement should affect trade as well as in-
vestment and employment in incumbent member countries, relating these effects in a coherent
way to changes in national welfare requires substantial modelling effort. This paper first looks
at enlargement by means of a differentiated indirect utility function which reveals the essential
channels for positive and negative welfare effects for an incumbent country. Within a single
equation, it identifies conventional effects from trade creation and trade diversion, as well as
terms-of-trade changes, but also dynamic effects from capital accumulation, and welfare effects
via labor markets characterized by search-unemployment. This proves helpful for a principal
understanding of the forces at work, but it does not tell much about the likely magnitudes
involved for different countries.
The paper therefore also attempts a quantification of welfare effects of enlargement for each of
the present incumbent countries, pursuing an indirect approach based on empirical simulation
results obtained with a complex dynamic model of general equilibrium for Germany. This
allows to portray an approximate picture of what enlargement means, in terms of a quantitative
summary measure of national economic welfare, for each of the EU15-countries. The paper
then takes a natural next step in looking at the EU15 as a whole by explicitly aggregating the
country-specific results.
The results obtained indicate significant inter-country variation, ranging from an estimated
loss of 1.3 percent of GDP for Portugal up to a 2 percent gain for Austria. Further countries at
the “loosing end” are Greece (0.6 percent), Ireland (0.6 percent) and Spain (0.4 percent). Other
countries who expect benefits are Germany (1.1 percent), Finland (0.7 percent) and Sweden
(0.6 percent). Aggregating across all incumbents using GDP or population as weights gives an
overall gain of 0.3 percent of EU15 GDP. Using council votes as weights (pre- or post-Nice)
instead, gives a somewhat lower gain of 0.2 percent.
We know from experience and theory, that welfare gains from market integration hardly ever
come without potentially severe redistribution effects. This paper addresses distributional issues
in an inter-country dimension, while all within-country redistribution is left beyond consider-
ation. In direct applications of CGE models, welfare results for a single country are normally
accompanied by detailed results on redistributive effects. The indirect approach pursued in this
paper did not allow an extension of such redistributive effect, but it is important to bear in mind
25

that such effects are present behind the aggregate results presented for all EU15 countries. If
they are deemed important, further modelling is required to complement the picture portrayed
in this paper.
I closing, we should perhaps remember that eastern enlargement of the EU has been on the
policy agenda for over a decade. It was probably perceived as a fairly credible policy proposal
by the mid 1990s. Indeed, with the Europe Agreements and several years of pre-accession aid,
several enlargement-related policy measures have actually been put into force long before the
formal step of enlargement, due in May 2004. In an environment with forward-looking economic
agents, all of this implies that by this time many of the effects highlighted in this paper have in
fact already materialized. Hence, if we analyze the economic impact of enlargement, more than
ten years on, we are probably dealing more with economic history, than with expected future
effects.
References
[1] Baldwin, Richard E., Joseph F. Francois and Richard Portes (1997), The Costs and Benefitsof Eastern Enlargement: The Impact on the EU and Central Europe, Economic Policy, 127-176.
[2] Baldwin, Richard E. and Anthony J. Venables (1995), Regional Economic Integration, inG. Grossman and K. Rogoff (eds.), Handbook of International Economics, vol. 3, ElsevierB.B., Amsterdam, 1597-1644.
[3] Blanchard, Olivier (1985), Debt, Deficits, and Finite Horizons, Journal of Political Economy93, 223-247.
[4] Borjas, George J. (1999), The Economic Analysis of Immigration, in: Ashenfelter,O. andDavid Card, eds, Handbook of Labor Economics, Volume 3, Amsterdam: Elsevier Science,1697—1760.
[5] Breuss, Fritz (1995), Costs and Benefits of EU’s Eastern Enlargement, Yrio Jahnsson Eu-ropean Integration Lectures, Helsinki.
[6] Dixit, Avinash and Joseph E. Stiglitz (1977), Monopolistic Competition and OptimumProduct Diversity, American Economic Review 67, 297-308.
[7] Dixit, Avinash and Victor Norman (1980), Theory of International Trade, Cambridge Uni-versity Press, Cambridge.
[8] ECOFIN (2001), The Economic Impact of Enlargement, Directorate Generale for Economicand Financial Affairs: Enlargement Papers No. 4.
[9] European Commission (1997), Agenda 2000, Luxembourg.
[10] European Commission (2002), Communication from the Commission: Information NoteCommon Financial Framework 2004-2006 for the Accession Negotiations, Brussels, 2002.
26

[11] European Council (1999), Presidency Conclusions - Berlin European Council, 24 and 25March 1999, Berlin, 1999.
[12] European Integration Consortium (2001), The Impact of Eastern Enlargement on Employ-ment and Labour Markets in the EU Member States, Study on behalf of the Employmentand Social Affairs Directorate General of the European Commission, Berlin and Milano.
[13] Finger, Michael J., Merlinda D. Ingco and Ulrich Reincke (1996), The Uruguay Round:Statistics on Tariff Concessions Given and Received: Washington D.C.: The World Bank.
[14] Heijdra, Ben J. Christian Keuschnigg and Wilhelm Kohler (2002), Eastern Enlargementof the EU: Jobs, Investment and Welfare in Present Member Countries, Munich: CESifoWorking Paper 718.
[15] Heijdra, Ben J. Christian Keuschnigg and Wilhelm Kohler (2004), Eastern Enlargementof the EU: Jobs, Investment and Welfare in Present Member Countries, in Helge Bergerand Thomas Moutos (eds.), Managing European Union Enlargement, Cambridge, Mass.:MIT-Press.
[16] Keuschnigg, Christian (1998), Investment Externalities and a Corrective Subsidy, Interna-tional Tax and Public Finance 5, 449-469.
[17] Keuschnigg, Christian and Wilhelm Kohler (1997), Dynamics of Trade Liberalization, in:Francois, J.F. and K. Reinert, eds., Applied Trade Policy Modeling: A Handbook, Cam-bridge and New York: Cambridge University Press, chapter 13, 383-434.
[18] Keuschnigg, Christian and Wilhelm Kohler (1999), Eastern Enlargement to theEU: Economic Costs and Beneits for the EU Present Member States? StudyXIX/B1/9801 for the European Commission, Johannes Kepler University Linz(http://www.econ.jku.at/kohler/eu-new.htm).
[19] Keuschnigg, Christian and Wilhelm Kohler (2002), Eastern Enlargement of the EU: HowMuch Is It Worth For Austria?, Review of International Economics, 10, 324-342.
[20] Keuschnigg, Christian, Mirela Keuschnigg and Wilhelm Kohler (2001), The German Per-spective on Eastern EU Enlargement, The World Economy 24, 513-542
[21] Kohler, Wilhelm (2000), Wer gewinnt, wer verliert durch die Osterweiterung der EU?, in:Hoffmann, L. ed., Erweiterung der EU, Berlin: Duncker & Humblot, 27-77.
[22] Kohler, Wilhelm and Christian Keuschnigg (2000), An Incumbent Country View on EasternEnlargemnt of the EU - Part I: A General Treatment, Empirica, 27, 325-351.
[23] Kohler, Wilhelm and Christian Keuschnigg (2001), An Incumbent Country View on EasternEnlargemnt of the EU - Part II: The Case of Austria, Empirica, 28, 159-185.
[24] Pissarides, Christopher A. (2000), Equilibrium Unemployment Theory, 2nd ed., Cambridge,Mass.: MIT Press.
27