Embed Size (px)
Citation preview

East Sussex Modified Permit Scheme – Cost Benefit Analysis
© East Sussex County Council
Page 1 of 87
Insert Cover

East Sussex Modified Permit Scheme – Cost Benefit Analysis
© East Sussex County Council
Page 2 of 87
Document Information
Date: June 2018
Project Name: East Sussex Permit Scheme (ESPS)
Service Area: East Sussex County Council Highway Network
Directorate:
Authors: Richard Pelham, Technical Consultant
Jason Setford-Smith, Scheme Consultant
Project Lead:
SRO:
Version: FINAL Version

East Sussex Modified Permit Scheme – Cost Benefit Analysis
© East Sussex County Council
Page 3 of 87
Contents 1 EXECUTIVE SUMMARY ................................................................................................................. 4 2 INTRODUCTION ............................................................................................................................. 5 2.1 objectives ................................................................................................................................... 5 2.2 Scope of work ............................................................................................................................ 5 2.3 Report Structure......................................................................................................................... 5 3 ANALYSIS AND CONTEXT ............................................................................................................ 6 3.1 Introduction ................................................................................................................................ 6 3.2 Legislative context ..................................................................................................................... 6 3.3 Traffic Management Act 2004 .................................................................................................... 6 3.4 WebTAG ...................................................................................................................................... 6 3.5 Research ..................................................................................................................................... 6 3.6 Halcrow Study ............................................................................................................................ 6 3.7 Implications for East Sussex Permit Scheme .......................................................................... 7 4 INPUT DATA ................................................................................................................................... 8 4.1 Introduction ................................................................................................................................ 8 4.2 Cost Benefit Assumption .......................................................................................................... 8 4.3 Data sources .............................................................................................................................. 8 4.4 Discount and Risk Factors ........................................................................................................ 9 4.5 Model Variable specification ..................................................................................................... 9 4.6 Statutory information associated with PERMIT SCHEMEs ..................................................... 9 4.7 East Sussex data...................................................................................................................... 10 4.8 Policy data ................................................................................................................................ 10 4.9 Road works Data ...................................................................................................................... 10 4.10 DfT data .................................................................................................................................... 10 4.11 Works Data ............................................................................................................................... 10 4.12 Traffic Data ............................................................................................................................... 13 5 DELAY MODELLING .................................................................................................................... 33 5.1 Delay Modelling Methodology ................................................................................................. 33 5.2 The valuation of costs in quadro ............................................................................................ 33 5.3 DELAY MODELLING IN QUADRO ........................................................................................... 42 5.4 TRAFFIC input .......................................................................................................................... 43 5.5 Site specific quadro input data ............................................................................................... 48 5.6 Monetized Costs and Benefits ................................................................................................ 49 6 OPERATION ................................................................................................................................. 52 6.1 Introduction .............................................................................................................................. 52 6.2 Fees Matrix ............................................................................................................................... 52 6.3 Scheme Costs .......................................................................................................................... 53 7 FINANCIAL CALCULATIONS ....................................................................................................... 56 7.1 Introduction .............................................................................................................................. 56 7.2 Public Accounts - Local Government Funding ...................................................................... 56 7.3 Public Accounts - Central Government Funding ................................................................... 71 7.4 Transport Economic Efficiency ............................................................................................... 71 8 STATUTORY OUTPUTS ............................................................................................................... 72 8.1 Introduction .............................................................................................................................. 72 8.2 Transport Economic Efficiency (TEE) .................................................................................... 72 8.3 Public Accounts ....................................................................................................................... 72 8.4 Cost Benefit Analysis .............................................................................................................. 72 8.5 Statutory Cost Benefit Analysis .............................................................................................. 72 9 MODIFIED ESPS CBA RESULTS ................................................................................................. 85 9.1 Introduction .............................................................................................................................. 85 9.2 East Sussex Highway Authority Cost Benefit Analysis ........................................................ 85 9.3 Sensitivity Analysis ................................................................................................................. 86 10 APPENDIX A ................................................................................................................................. 87 11 APPENDIX B ................................................................................................................................. 87 12 APPENDIX C ................................................................................................................................. 87

East Sussex Modified Permit Scheme – Cost Benefit Analysis
© East Sussex County Council
Page 4 of 87
1 EXECUTIVE SUMMARY East Sussex is a major investor of public resources and as such, should ensure that new developments, modifications or variations to existing operations make a positive contribution to the local economy and society.
Any new proposal should always answer these two basic questions:
• What are the specific outcomes sought? • Will these outcomes deliver a positive benefit to the local economy and society?
Cost Benefit Analysis (CBA) is a decision-making tool that helps provide assurance around these questions by quantifying all costs and benefits in monetary terms.
East Sussex’s Highways Team has been working on just such a modification and this CBA supports its introduction by demonstrating the positive financial outcome delivering its objectives will provide.
Minimising congestion is a key transport challenge for any Council and especially for a busy Authority like East Sussex.
The ability of people and goods to move freely around the Authority area, meeting the needs of business, accessing essential services and for social and leisure purposes depends largely on the East Sussex’s road network operating effectively.
The proposal to modify the exisitng Permit Scheme tackles head-on one the major causes of congestion, road and street works, in a robust and positive way and is a major opportunity to positively reduce road and street works and the disruption they cause on the road network.
The proposal to modify Permit Scheme is designed to deliver greater effective co-ordination and management of essential road works by enhancing the Permit Authority in East Sussex.
The enhanced Permit Authority is not intended to prevent activities necessary for the maintenance or improvement of the road network or the services running underneath it. It is designed to make available the necessary resources to achieve an appropriate balance between the interests of the various parties and where possible, bring about effective co-ordination between all the different competing interests.
Summary findings of the modified Permit Scheme Cost Benefit Analysis
Values based on 25 Year Operation of the proposed Scheme (2010 prices)
Value of benefits to economy and society £1,494,327,296
Operating costs £34,009,483
Financial benefit to the local economy from introducing the Scheme £1,460,317,812
Benefit to Cost Ratio 43.94

East Sussex Modified Permit Scheme – Cost Benefit Analysis
© East Sussex County Council
Page 5 of 87
2 INTRODUCTION
2.1 OBJECTIVES Swift Argent Ltd was commissioned by East Sussex County Council in 2018 to examine the road works Permit Scheme known as the East Sussex Permit Scheme (ESPS), part of which includes the development of a detailed Cost Benefit Analysis (CBA).
The principal objective of the ESPS was to improve the strategic and operational management of the highway network through better planning, scheduling and management of activities to minimise disruption to road users.
The modified ESPS will enable better co-ordination of all activities throughout the highway network, ensuring those competing for space or time in the street, including traffic, to be resolved in a positive and constructive way.
The objectives and benefits of the ESPS are:
• Reduced congestion on the road network • Improvements to overall network management • A reduction in delays to the travelling public • A reduction in costs to businesses caused by delays • Promotion of a safer environment • Reduced carbon emissions
2.2 SCOPE OF WORK The development of a detailed Cost Benefit Analysis (CBA) is a requirement for making a new Permit Scheme Local Order.
The analysis assesses the impact of Permits over the full range of required social and economic variables that have been specifically agreed in consultation with the UK Department for Transport (DfT).
An effective Cost Benefit Analysis is a mechanism to assess the benefits and costs of an investment both in terms of its overall viability and in relation to other options.
In this analysis, all benefits and costs are quantified in monetary terms and discounted over the length of the proposal to allow comparison on a common basis.
The output of the Cost Benefit Analysis is the presentation of a Benefit to Cost Ratio (BCR) which presents a scale of the Scheme benefits over costs and a Net Present Value (NPV) that is the sum total of the discounted benefits and costs.
This report will identify the costs of operating the modified Scheme, which are to be met by the Permit fees charged to Utility companies and from East Sussex’s existing budget, against the value of the benefits it will deliver to the wider Authority.
It will identify the data used and the methodology undertaken to prepare the Cost Benefit Analysis and present the statutory outputs including the BCR and NPV of the Scheme.
2.3 REPORT STRUCTURE After this introduction, the report is set out as follows:
• Section 3 Analysis and Context; • Section 0 • •

East Sussex Modified Permit Scheme – Cost Benefit Analysis
© East Sussex County Council
Page 6 of 87
• Input Data; • Section 5 Delay Modelling; • Section 6 Operation;
• Section 7 Financial Calculations; • Section 8 Statutory Outputs; and • Section 9 ESPS CBA Results
3 ANALYSIS AND CONTEXT
3.1 INTRODUCTION This section presents the legislative and research context for the ESPS Cost Benefit Analysis.
3.2 LEGISLATIVE CONTEXT The legislative guidance used for this study is contained within:
• 2016 DfT Permit Schemes advice note June 2016
• Statutory Guidance for Highway Authority Permit Schemes October 2015 • The Traffic Management Permit Scheme (England) (Amendment) Regulations 2015 • TMA, Permit Schemes, Decision-making and development (2nd Edition), November 2010 • WebTAG guidance Values of Time and Operating Costs (TAG Unit 3.5.6 October 2013). • Department of Transport’s (DfT) Halcrow study “Assessing the Extent of Streetworks and Monitoring
Effectiveness of Section 74 in Reducing Disruption Volume 3 – Estimation of Cost of the Delay from Utilities’ Street Works, June 2004”
• Chapter 8 of the Traffic Signs Manual DfT 2009 • Design Manual for Roads and Bridges Volume 14 Economic Assessment of Road Maintenance • 2016 DfT Permit Schemes advice note June 2016
3.3 TRAFFIC MANAGEMENT ACT 2004 The Traffic Management Act 2004 (TMA 2004) establishes the guidelines for street works. It has been in operation since April 2008 throughout the United Kingdom. The second edition states that any parties wishing to work on a road will require a Permit from the Highway Authority, who in turn will have additional powers to refuse or specify conditions associated with Permit permission for the overall efficiency of the operation of the road network.
3.4 WEBTAG WebTAG was first issued by the UK Department for Transport in 2003. It is based upon the ‘New Approach to Appraisal’ developed in the late 1990s and is an internet based multimodal guidance on appraising transport projects. WebTAG was recently updated in October 2013 including changes in value of time and operating costs, accident costs, carbon emissions and traffic growth forecasts as described in Road Transport Forecasts 2013.
3.5 RESEARCH The benchmark study for Permit Scheme appraisal was produced by the Halcrow Consultancy at the time of the TMA in 2004.
3.6 HALCROW STUDY In July 2004, Halcrow produced a report for the DfT on the impact of road works. The results (Table 1) estimate an overall cost of disruption caused by Utility works in England in 2002/03 at £4.36 billion.

East Sussex Modified Permit Scheme – Cost Benefit Analysis
© East Sussex County Council
Page 7 of 87
Table 1 Halcrow study results summary
Impact of Roadworks Electric Gas Telco Water Total Number of Roadworks (000s) 234 223 244 499 1200 Average cost (£000) per Roadworks £5.30 £5.40 £2.20 £2.80 £15.70
Annual Roadwork Disruption cost (£bn) £1.24 £1.20 £0.54 £1.40 £4.38 Source: Halcrow Group, quoted in DfT draft s Regulatory Impact Assessment (RIA), July 2007
3.7 IMPLICATIONS FOR EAST SUSSEX PERMIT SCHEME Using the DfT sanctioned report, it is possible to get an idea for the likely implication of the ESPS either using a ‘top down’ approach from the overall saving or a ‘bottom up’ calculation based upon the implied rate per road works.
From a top down perspective, with an estimated 1.45% of utility road works occurring in East Sussex and a 5% reduction in road works associated with the Permit Scheme, it may be expected to produce annual savings of £3.16m in 2002 prices, (£5.28m in 2010 prices).(Table 2)
Table 2 Forecast Benefits – Top Down approach
Halcrow Study £
Annual UK cost of roadworks (£bn) £ 4.36
Proportion of roadworks in East Sussex 1.45%
Annual Thurrock cost of roadworks (£m) £ 63.22
Roadwork Reduction from Permit Scheme 5%
Estimated Permit Scheme saving (2002 prices) (£m) £ 3.16
Estimated Permit Scheme saving (2010 prices) (£m) £ 5.28
However, working up from the actual number of Noticed Works in East Sussex and using the ‘rule of thumb’ estimate from the DfT report of £600 per works per day and an average 6 days, the projected annual savings would be £3.13m in 2002 prices (£5.23m in 2010 prices). (Table 3)
Table 3 Forecast Benefits – Bottom up approach
Annual Number of Utility Works Total
Pre-scheme Number of Utility Works 17,400
Utility Works after 5% reduction
16,530
Total Utility Permit reduction
870 Average Days Duration from Halcrow Study 6
Number of road work days saved
5,220.00
Total Cost at £600 per works per day (£ m) (2002 prices) £ 3.13
Total Cost at £600 per works per day (£ m) (2010 prices) £ 5.23
The figures above give an estimate of the upper and lower expectations from the ESPS of between £5.28m and £5.23m in 2010 prices. As the two methods are within 5% this is considered a reliable

East Sussex Modified Permit Scheme – Cost Benefit Analysis
© East Sussex County Council
Page 8 of 87
estimate. Both methods do have a degree of uncertainty as they are based on sample national data which may not be a correct representation at a local level as this is dependent on the level of congestion. On a heavily congested network this can increase exponentially.
4 INPUT DATA
4.1 INTRODUCTION This section outlines the information sources and assumptions used in the ESPS Cost Benefit Analysis. The Cost Benefit Analysis has been prepared with 2010 as the price base year for presentation values as set out in WebTAG.
4.2 COST BENEFIT ASSUMPTION The objective of the ESPS is a reduction in the disruption caused by road works through improved control and co-ordination.
The central assumption of the analysis is that the introduction will cause a 5% fall in Permit applications and have a commensurate effect on roadwork activity and all associated aspects of the analysis. This 5% reduction is known as the Permit Scheme reduction factor.
Table 4 Central Assumptions
CBA modelled variable Rate Reduction Factor 5% Target year for reduction in works 1
Ratio of Utility permits to overall permits 50%
The analysis worked on the operating assumption that the effects of the Permit Scheme will start on Scheme opening with reductions occurring after operational lead-time in the second month. The breakdown of annual Permit numbers are presented in Table 5 below.
Table 5 Annual Permit Summary
Annual Permits Total Pre-scheme Number of Utility Notices 17,400 Utility Permits after 5% reduction 16,530
4.3 DATA SOURCES The Cost Benefit Analysis has been produced from four sources of information:
• Government guidance; • A modifed Permit Fees Matrix in a format provided by the DfT; • Local data provided by East Sussex; and
• DfT Traffic Flow Data
Standard Cost Benefit Analysis assumptions and sensitivity factors have been used in line with recommendations in DfT’s Annex C of TMA 2004 Decision-making and development (2nd edition).
The Local data provided by East Sussex contained both the number of permits by type and specific information on Scheme operation and costs.
East Sussex Modified Permit Scheme – Cost Benefit Analysis
© East Sussex County Council
Page 9 of 87
4.4 DISCOUNT AND RISK FACTORS The study uses the DfT recommended discount rate for assessment periods under 30 years of 3.5%.
The risk factors are applied to capital expenditure costs and are taken from standard values in Annex C of TMA 2004 Decision-making and development (2nd Edition) and shown in 6.
Table 6 Discount and Risk Factors
CBA modelled variable Rate Discount Rate 3.5% Risk Bias Factor 20% Optimism Bias Factor 15%
Combined Risk-Optimism Bias Factor 38%
4.5 MODEL VARIABLE SPECIFICATION This section identifies the treatment of costs in the period after Scheme implementation. All values used are standard values taken from Annex C of TMA 2004 Decision-making and development (2nd edition) and shown in Table 7.
Table 7 Model Variable specification
CBA modelled variable Rate Cost reduction based on permit reduction 50% Reliability benefit factor 20% Allowance for Phased Works 20%
Proportion of Annually recurring set up costs 0%
The introduction of the Permit Scheme will bring about a reduction in Permit applications, which in turn will mean lower Scheme costs. The TMA 2004 suggested 50% proportion used means that the reduction in Permit numbers of 5% will produce a 2.5% reduction in Scheme costs.
The reliability benefit factor is an approved standard uplift to the time benefit attributed to the reduction of road works on urban roads. The allowance for phased works is a factor applied to the number of Permits applications to get a total number of Permits upon which the calculations are based.
No costs associated with the establishment of the Permit Scheme are projected to extend beyond the Scheme opening.
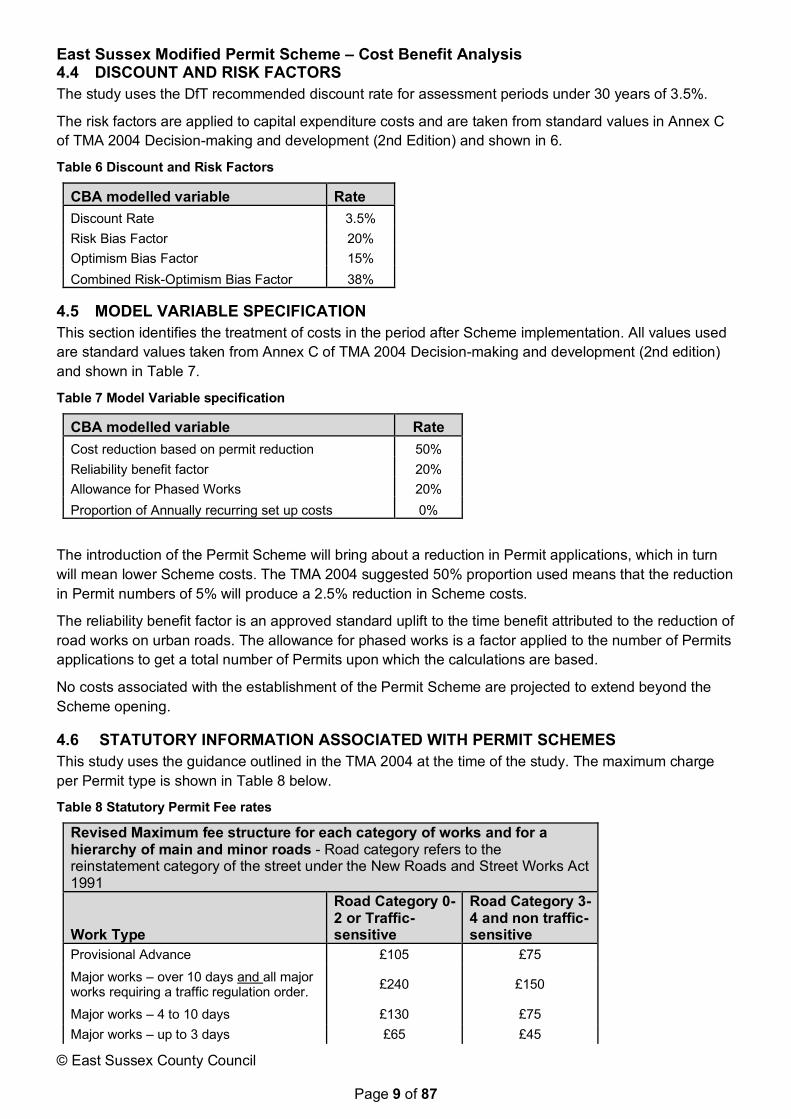
4.6 STATUTORY INFORMATION ASSOCIATED WITH PERMIT SCHEMES This study uses the guidance outlined in the TMA 2004 at the time of the study. The maximum charge per Permit type is shown in Table 8 below.
Table 8 Statutory Permit Fee rates
Revised Maximum fee structure for each category of works and for a hierarchy of main and minor roads - Road category refers to the reinstatement category of the street under the New Roads and Street Works Act 1991
Work Type
Road Category 0-2 or Traffic-sensitive
Road Category 3-4 and non traffic-sensitive
Provisional Advance £105 £75
Major works – over 10 days and all major works requiring a traffic regulation order. £240 £150
Major works – 4 to 10 days £130 £75 Major works – up to 3 days £65 £45

East Sussex Modified Permit Scheme – Cost Benefit Analysis
© East Sussex County Council
Page 10 of 87
Activity Standard £130 £75 Activity Minor £65 £45 Immediate Activity £60 £40 Permit Variation £45 £35
4.7 EAST SUSSEX DATA East Sussex supplied the following data and policy decisions:
• Policy data; and • Road works Data.
4.8 POLICY DATA The policy decisions related to Permit Scheme operation outlined in Table 9 were obtained from East Sussex.
Table 9 Operational Variables
CBA modelled variable Period Number of months to establish 1 Number of months to implement 1
Debtor days 30
4.9 ROAD WORKS DATA East Sussex provided the information on the number of road works and shown on Table 10 below.
Table 10 Roadwork Totals
East Sussex Works Volumes Work Type RC 0-2 RC 3-4 Total Volume Number % Number % Number % Major 257 3% 310 3% 567 3% Standard 1,126 13% 809 9% 1,935 11% Minor with Exc 4,553 54% 4,650 52% 9,203 53% Minor without Exc - 0% - 0% - 0% Urgent 2,457 29% 3,238 36% 5,695 33% Special Urgent - 0% - 0% - 0% Emergency - 0% - 0% - 0% Totals 8,393 48% 9,007 52% 17,400
The table expresses work type by two types RC 0-2 Traffic Sensitive Streets and RC 3-4 Non Traffic Sensitive Streets. RC is an abbreviation of Reinstatement Category which is a function of Commercial Vehicles (CV) traffic volumes.
4.10 DFT DATA The following data was obtained from the Halcrow Study, traffic management requirements and published traffic count data:
4.11 WORKS DATA The Halcrow Study found that the average size of carriageway works is 2 metres width by 20 metres length. Data was collected from 25 authorities across the whole of England on Notices and the

East Sussex Modified Permit Scheme – Cost Benefit Analysis
© East Sussex County Council
Page 11 of 87
percentages of notices by reinstatement category and excavation length is summarised on Table 11 below. This shows that there is a very high proportion of works on minor roads RC 3-4.

East Sussex Modified Permit Scheme – Cost Benefit Analysis
© East Sussex County Council
Page 12 of 87
Table 11 Percentage of Notices by Reinstatement Category and Excavation Length
DfT Study Table 2 - Percentages of Notices by RC and Excavation Length Vol 3: Extents of Street Works and Monitoring Disruption
RC 10m 30m 50m 100m 200m
RC 0-2 % of all works 16.3% 0.1% 1.0% 0.8% 1.0% % of RC 0-2 85% 1% 5% 4% 5%
RC 3-4 % of all works 70.0% 4.2% 2.6% 2.1% 1.7%
% of RC 3-4 87% 5% 3% 3% 2%
The study also reported the average duration by work type and utility. The average for each utility was proportioned by the number of notices to derive an average duration by work type and is summarised in Table 12 below. It was noted that there was a high percentage of water utility works.
Table 12 Average duration by work type by utility
DfT Study Average duration by work type by utility Work Type Elec Gas Telecom Water Avg Duration All Utilities Major 41 40 23 30 33 Standard 7 7 9 15 9 Minor with Exc 3 4 2 2 2 Minor without Exc 3 4 6 2 3 Urgent 6 5 3 3 4 Special 3 3 3 2 2 Emergency 6 7 2 3 7
Works require traffic management to keep workers safe and the requirements are detailed in Chapter 8 of the Traffic Signs Manual DfT 2009 and is summarised in Table 13 below for different road types.
Table 13 Traffic Management for Street works
Traffic Management for Street works Traffic Signs Manual Chapter 8
Road Type
Single 30mph or less
(m)
Single 40mph
(m)
Single 50mph
or more (m)
Dual 40mph or less
(m)
Dual 50mph
or 60mph
(m)
Dual NS (m)
Dual NS Congested
(m) Taper 50 80 100 100 150 200 200 Approach signs 45 110 450 300 800 1609 3218 Min vis to sign 60 60 75 60 75 120 120 End of works sign from end 30 45 45 45 90 90 90 Totals excl works 185 295 670 505 1115 2019 3628
The Halcrow study reported the daily cost of street works by road type and excavation length and is summarised in Tables 14 and 15 below.

East Sussex Modified Permit Scheme – Cost Benefit Analysis
© East Sussex County Council
Page 13 of 87
Table 14 Daily Cost of Rural Works
DfT Study Table 4 Daily Cost of Rural Works (£) by Reinstatement Category and Length
Reinstatement Category Typical AADT 10m 50m 100m 200m
0 <32,000 2,500 3,000 3,300 4,000
1 16000 7,850 9,050 10,250 11,000
2 12000 1,610 2,100 2,600 3,530
3 8000 780 970 1,200 1,625
4 4000 335 415 515 700
Table 15 Daily Cost of Urban Works
DfT Study Table 5 Daily Cost of Urban Works (£) by Reinstatement Category and Length
Reinstatement Category Typical AADT 10m 50m 100m 200m
0 40000
25,000 25,000 25,000 25,000
1 24000
9,000 12,000 15,000 17,000
2 16000
3,450 5,150 7,000 8,800
3 10000
385 535 710 1,025
4 6000
200 280 375 550
4.12 TRAFFIC DATA Traffic data was obtained from the DfT who monitor annual traffic flows for all authorities in the UK,
For East Sussex there are 175 site locations on ‘A’ principal roads and minor roads for Annual Average Daily Flow (AADF) classified by vehicle type.
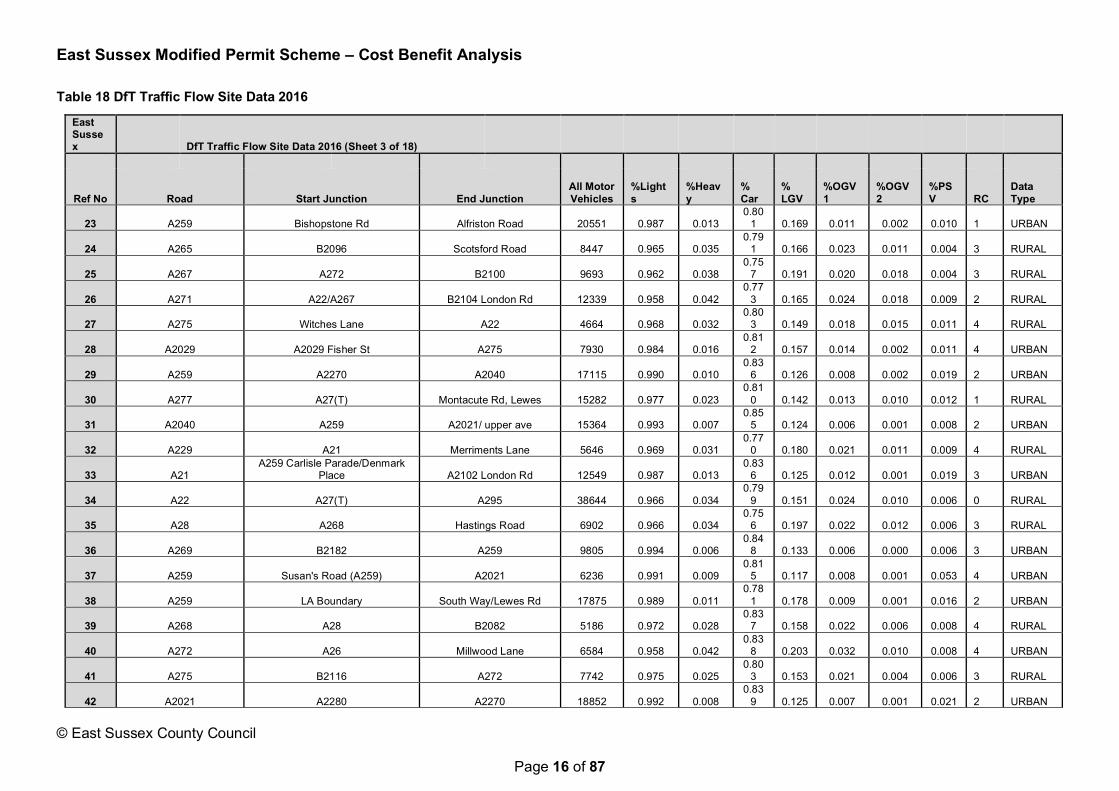
The latest data for 2016 is shown on Tables 16 to 33 below and location plan shown on Figure 1.
The RC has been derived from the typical AADT flows as shown in Table 14 and 15.

East Sussex Modified Permit Scheme – Cost Benefit Analysis
© East Sussex County Council
Page 14 of 87
Table 16 DfT Traffic Flow Site Data 2016
East Sussex DfT Traffic Flow Site Data 2016 (Sheet 1 of 18)
All Motor Vehicles
Ref No Road Start Junction End Junction %Lights %Heavy
% Car
% LGV %OGV1 %OGV2 %PSV RC
Data Type
1 A22 A272 A275 12194 0.968 0.032 0.751 0.203 0.020 0.011 0.001 2 RURAL 2 A22 B2124 A26 15185 0.952 0.048 0.727 0.215 0.029 0.019 0.003 1 RURAL 3 A26 A2029 B2192 22980 0.969 0.031 0.782 0.171 0.018 0.014 0.007 1 URBAN 4 A259 A2101 B2093 10698 0.984 0.016 0.814 0.149 0.010 0.006 0.010 3 URBAN 5 A259 Cherry Garden Rd A2270 13187 0.992 0.008 0.855 0.124 0.007 0.001 0.027 2 URBAN 6 A267 A22 A265 6552 0.958 0.042 0.686 0.259 0.033 0.009 0.002 3 RURAL 7 A272 A26 A267 9406 0.978 0.022 0.801 0.167 0.018 0.004 0.003 3 RURAL 8 A275 A2029 B2116 12657 0.982 0.018 0.823 0.138 0.012 0.006 0.008 2 RURAL 9 A295 High Street/North Street A271 8998 0.974 0.026 0.786 0.174 0.016 0.011 0.009 3 URBAN 10 A2100 B2159 Battle Rd A271 16230 0.985 0.015 0.804 0.164 0.013 0.002 0.009 1 RURAL 11 A2021 A2040 A259 8182 0.987 0.013 0.842 0.154 0.010 0.003 0.002 3 URBAN 12 A259 Brighton Rd South Way 18213 0.988 0.012 0.778 0.190 0.011 0.001 0.015 2 URBAN 13 A259 A2102 London Road A2101 Harold Place 15925 0.976 0.024 0.799 0.139 0.016 0.008 0.026 2 URBAN 14 A269 B2098 roundabout B2182 5381 0.992 0.008 0.862 0.114 0.006 0.002 0.012 4 URBAN 15 A26 B2192 A22 11950 0.966 0.034 0.767 0.187 0.020 0.014 0.006 2 RURAL 16 A275 A277 A2029 8048 0.977 0.023 0.777 0.181 0.019 0.004 0.013 3 URBAN 17 A26 A22 A272 16126 0.960 0.040 0.765 0.185 0.027 0.014 0.006 1 RURAL 18 A21 A2101 St Helens Road A2100 Junction Road 25176 0.988 0.012 0.812 0.156 0.009 0.003 0.009 1 URBAN 19 A22 A267 Coldharbour Road 25115 0.965 0.035 0.804 0.185 0.023 0.012 0.003 1 RURAL 20 A2270 A2021 A27 24206 0.986 0.014 0.836 0.137 0.010 0.004 0.005 1 URBAN 21 A259 A259 Trunk A2102 London Road 15871 0.966 0.034 0.760 0.178 0.031 0.003 0.015 2 URBAN
22 A259 Pacific Drive, Eastbourne A27 11666 0.990 0.010 0.827 0.131 0.009 0.002 0.009 2 RURAL
East Sussex Modified Permit Scheme – Cost Benefit Analysis
© East Sussex County Council
Page 15 of 87
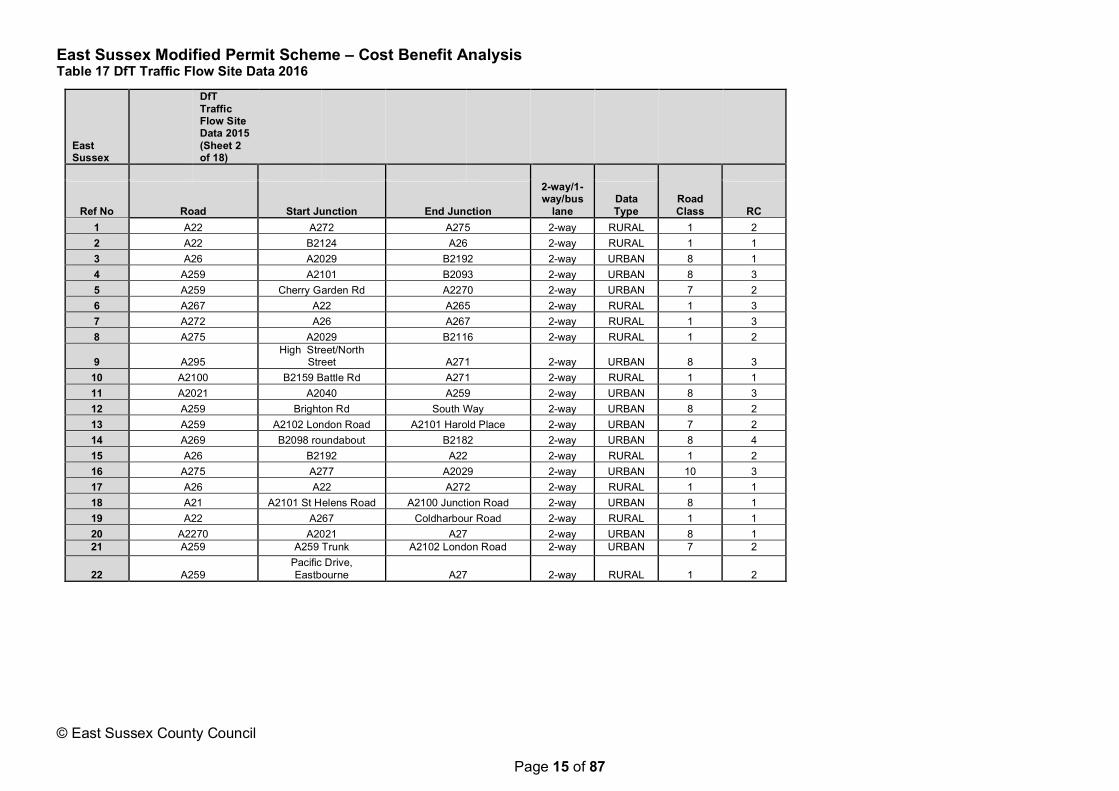
Table 17 DfT Traffic Flow Site Data 2016
East Sussex
DfT Traffic Flow Site Data 2015 (Sheet 2 of 18)
2-way/1-way/bus
lane
Road Class
Ref No Road Start Junction End Junction Data Type RC
1 A22 A272 A275 2-way RURAL 1 2 2 A22 B2124 A26 2-way RURAL 1 1 3 A26 A2029 B2192 2-way URBAN 8 1 4 A259 A2101 B2093 2-way URBAN 8 3 5 A259 Cherry Garden Rd A2270 2-way URBAN 7 2 6 A267 A22 A265 2-way RURAL 1 3 7 A272 A26 A267 2-way RURAL 1 3 8 A275 A2029 B2116 2-way RURAL 1 2
9 A295 High Street/North
Street A271 2-way URBAN 8 3 10 A2100 B2159 Battle Rd A271 2-way RURAL 1 1 11 A2021 A2040 A259 2-way URBAN 8 3 12 A259 Brighton Rd South Way 2-way URBAN 8 2 13 A259 A2102 London Road A2101 Harold Place 2-way URBAN 7 2 14 A269 B2098 roundabout B2182 2-way URBAN 8 4 15 A26 B2192 A22 2-way RURAL 1 2 16 A275 A277 A2029 2-way URBAN 10 3 17 A26 A22 A272 2-way RURAL 1 1 18 A21 A2101 St Helens Road A2100 Junction Road 2-way URBAN 8 1 19 A22 A267 Coldharbour Road 2-way RURAL 1 1 20 A2270 A2021 A27 2-way URBAN 8 1 21 A259 A259 Trunk A2102 London Road 2-way URBAN 7 2
22 A259 Pacific Drive, Eastbourne A27 2-way RURAL 1 2
East Sussex Modified Permit Scheme – Cost Benefit Analysis
© East Sussex County Council
Page 16 of 87
Table 18 DfT Traffic Flow Site Data 2016
East Sussex DfT Traffic Flow Site Data 2016 (Sheet 3 of 18)
All Motor Vehicles
Ref No Road Start Junction End Junction %Lights
%Heavy
% Car
% LGV
%OGV1
%OGV2
%PSV RC
Data Type
23 A259 Bishopstone Rd Alfriston Road 20551 0.987 0.013 0.80
1 0.169 0.011 0.002 0.010 1 URBAN
24 A265 B2096 Scotsford Road 8447 0.965 0.035 0.79
1 0.166 0.023 0.011 0.004 3 RURAL
25 A267 A272 B2100 9693 0.962 0.038 0.75
7 0.191 0.020 0.018 0.004 3 RURAL
26 A271 A22/A267 B2104 London Rd 12339 0.958 0.042 0.77
3 0.165 0.024 0.018 0.009 2 RURAL
27 A275 Witches Lane A22 4664 0.968 0.032 0.80
3 0.149 0.018 0.015 0.011 4 RURAL
28 A2029 A2029 Fisher St A275 7930 0.984 0.016 0.81
2 0.157 0.014 0.002 0.011 4 URBAN
29 A259 A2270 A2040 17115 0.990 0.010 0.83
6 0.126 0.008 0.002 0.019 2 URBAN
30 A277 A27(T) Montacute Rd, Lewes 15282 0.977 0.023 0.81
0 0.142 0.013 0.010 0.012 1 RURAL
31 A2040 A259 A2021/ upper ave 15364 0.993 0.007 0.85
5 0.124 0.006 0.001 0.008 2 URBAN
32 A229 A21 Merriments Lane 5646 0.969 0.031 0.77
0 0.180 0.021 0.011 0.009 4 RURAL
33 A21 A259 Carlisle Parade/Denmark
Place A2102 London Rd 12549 0.987 0.013 0.83
6 0.125 0.012 0.001 0.019 3 URBAN
34 A22 A27(T) A295 38644 0.966 0.034 0.79
9 0.151 0.024 0.010 0.006 0 RURAL
35 A28 A268 Hastings Road 6902 0.966 0.034 0.75
6 0.197 0.022 0.012 0.006 3 RURAL
36 A269 B2182 A259 9805 0.994 0.006 0.84
8 0.133 0.006 0.000 0.006 3 URBAN
37 A259 Susan's Road (A259) A2021 6236 0.991 0.009 0.81
5 0.117 0.008 0.001 0.053 4 URBAN
38 A259 LA Boundary South Way/Lewes Rd 17875 0.989 0.011 0.78
1 0.178 0.009 0.001 0.016 2 URBAN
39 A268 A28 B2082 5186 0.972 0.028 0.83
7 0.158 0.022 0.006 0.008 4 RURAL
40 A272 A26 Millwood Lane 6584 0.958 0.042 0.83
8 0.203 0.032 0.010 0.008 4 URBAN
41 A275 B2116 A272 7742 0.975 0.025 0.80
3 0.153 0.021 0.004 0.006 3 RURAL
42 A2021 A2280 A2270 18852 0.992 0.008 0.83
9 0.125 0.007 0.001 0.021 2 URBAN

East Sussex Modified Permit Scheme – Cost Benefit Analysis
© East Sussex County Council
Page 17 of 87
43 A2100 A271 A21 8815 0.955 0.045 0.73
1 0.208 0.026 0.019 0.006 3 RURAL

East Sussex Modified Permit Scheme – Cost Benefit Analysis
© East Sussex County Council
Page 18 of 87
Table 19 DfT Traffic Flow Site Data 2016
East Sussex
DfT Traffic Flow Site Data 2015 (Sheet 4 of 18)
2-way/1-way/bus
lane
Road Class
Ref No Road Start Junction End Junction Data Type RC
23 A259 Bishopstone Rd Alfriston Road 2-way URBAN 10 1 24 A265 B2096 Scotsford Road 2-way RURAL 1 3 25 A267 A272 B2100 2-way RURAL 1 3 26 A271 A22/A267 B2104 London Rd 2-way RURAL 1 2 27 A275 Witches Lane A22 2-way RURAL 1 4 28 A2029 A2029 Fisher St A275 2-way URBAN 8 4 29 A259 A2270 A2040 2-way URBAN 7 2 30 A277 A27(T) Montacute Rd, Lewes 2-way RURAL 1 1 31 A2040 A259 A2021/ upper ave 2-way URBAN 7 2 32 A229 A21 Merriments Lane 2-way RURAL 1 4
33 A21 A259 Carlisle Parade/Denmark
Place A2102 London Rd 2-way URBAN 8 3 34 A22 A27(T) A295 2-way RURAL 1 0 35 A28 A268 Hastings Road 2-way RURAL 1 3 36 A269 B2182 A259 2-way URBAN 7 3 37 A259 Susan's Road (A259) A2021 2-way URBAN 7 4 38 A259 LA Boundary South Way/Lewes Rd 2-way URBAN 10 2 39 A268 A28 B2082 2-way RURAL 1 4 40 A272 A26 Millwood Lane 2-way URBAN 1 4 41 A275 B2116 A272 2-way RURAL 1 3 42 A2021 A2280 A2270 2-way URBAN 10 2 43 A2100 A271 A21 2-way RURAL 1 3

East Sussex Modified Permit Scheme – Cost Benefit Analysis
© East Sussex County Council
Page 19 of 87
Table 20 DfT Traffic Flow Site Data 2016
East Sussex DfT Traffic Flow Site Data 2016 (Sheet 5 of 18)
All Motor Vehicles
Ref No Road Start Junction End Junction %Lights %Heavy % Car
% LGV %OGV1 %OGV2 %PSV RC
Data Type
44 A259 Brighton Rd North Way 17112 0.983 0.017 0.795 0.172 0.026 0.002 0.011 2 URBAN 45 A2102 A259 A21 6997 0.987 0.013 0.786 0.140 0.013 0.001 0.042 4 URBAN 46 A22 B2124 Coldharbour Road 21726 0.963 0.037 0.784 0.163 0.021 0.015 0.005 1 RURAL 47 A26 A27 A26 Malling St 24431 0.963 0.037 0.796 0.152 0.020 0.017 0.003 1 RURAL 48 A259 Afriston Road Chyngton Lane North 13502 0.989 0.011 0.826 0.146 0.010 0.001 0.012 2 URBAN 49 A265 Peartree Hill A21 5659 0.954 0.046 0.850 0.203 0.027 0.018 0.005 4 RURAL 50 A267 B2100 B2099 11567 0.971 0.029 0.800 0.160 0.020 0.009 0.005 2 RURAL 51 A271 A295 A269 12092 0.962 0.038 0.743 0.206 0.020 0.018 0.003 2 RURAL 52 A272 A275 A22 10460 0.972 0.028 0.756 0.201 0.020 0.008 0.005 2 RURAL 53 A295 Arlington Road East A295 George St/North St 11539 0.985 0.015 0.810 0.158 0.012 0.003 0.014 3 URBAN 54 A2036 A269 A259 10792 0.983 0.017 0.838 0.132 0.014 0.004 0.004 3 URBAN 55 A269 A259 B2098 9220 0.986 0.014 0.823 0.149 0.012 0.002 0.010 3 URBAN 56 A22 A26 A272 19239 0.958 0.042 0.761 0.188 0.025 0.018 0.004 1 RURAL
57 A259 Ashford Road/Terminus
Road Devonshire Place 3404 0.988 0.012 0.734 0.141 0.012 0.000 0.104 4 URBAN 58 A21 A2102 London Road A2101 St Helen's Road 16515 0.971 0.029 0.789 0.161 0.025 0.004 0.012 2 URBAN 59 A22 A295 A271 26865 0.963 0.037 0.753 0.202 0.025 0.012 0.003 1 RURAL 60 A2270 A259 A2021 15258 0.985 0.015 0.833 0.131 0.013 0.002 0.013 2 URBAN
61 A26 B2157 Eridge Rd,
Crowborough A264 14984 0.965 0.035 0.824 0.127 0.017 0.018 0.006 1 RURAL 62 A28 B2089 A268 4706 0.979 0.021 0.801 0.157 0.017 0.005 0.009 4 RURAL 63 A259 A2021 A2290 15415 0.993 0.007 0.835 0.127 0.007 0.001 0.021 2 URBAN 64 A259 A259 North Way/ South Way A259 spur to A26 21196 0.992 0.008 0.817 0.162 0.007 0.001 0.004 1 URBAN 65 A264 B2026 Broad Lane 5902 0.970 0.030 0.780 0.185 0.027 0.004 0.002 4 RURAL 66 A265 A267 B2096 16086 0.974 0.026 0.799 0.160 0.018 0.009 0.008 1 RURAL

East Sussex Modified Permit Scheme – Cost Benefit Analysis
© East Sussex County Council
Page 20 of 87
Table 21 DfT Traffic Flow Site Data 2016
East Sussex
DfT Traffic Flow Site Data 2015 (Sheet 6 of 18)
2-way/1-way/bus
lane
Road Class
Ref No Road Start Junction End Junction Data Type RC
44 A259 Brighton Rd North Way 1-way URBAN 7 2 45 A2102 A259 A21 2-way URBAN 8 4 46 A22 B2124 Coldharbour Road 2-way RURAL 1 1 47 A26 A27 A26 Malling St 2-way RURAL 1 1 48 A259 Afriston Road Chyngton Lane North 2-way URBAN 8 2 49 A265 Peartree Hill A21 2-way RURAL 1 4 50 A267 B2100 B2099 2-way RURAL 1 2 51 A271 A295 A269 2-way RURAL 1 2 52 A272 A275 A22 2-way RURAL 1 2 53 A295 Arlington Road East A295 George St/North St 2-way URBAN 8 3 54 A2036 A269 A259 2-way URBAN 10 3 55 A269 A259 B2098 2-way URBAN 7 3 56 A22 A26 A272 2-way RURAL 1 1
57 A259 Ashford Road/Terminus
Road Devonshire Place 2-way URBAN 7 4 58 A21 A2102 London Road A2101 St Helen's Road 2-way URBAN 8 2 59 A22 A295 A271 2-way RURAL 2 1 60 A2270 A259 A2021 2-way URBAN 8 2
61 A26 B2157 Eridge Rd,
Crowborough A264 2-way RURAL 1 1 62 A28 B2089 A268 2-way RURAL 1 4 63 A259 A2021 A2290 2-way URBAN 8 2 64 A259 A259 North Way/ South Way A259 spur to A26 2-way URBAN 8 1 65 A264 B2026 Broad Lane 2-way RURAL 1 4 66 A265 A267 B2096 2-way RURAL 1 1

East Sussex Modified Permit Scheme – Cost Benefit Analysis
© East Sussex County Council
Page 21 of 87
Table 22 DfT Traffic Flow Site Data 2016
East Sussex DfT Traffic Flow Site Data 2014 (Sheet 7 of 18)
All Motor Vehicles
Ref No Road Start Junction End Junction %Lights %Heavy
% Car
% LGV %OGV1 %OGV2 %PSV Type
Data Type
67 A267 B2102 A272 16669 0.970 0.030 0.763 0.195 0.020 0.010 0.004 S2AP RURAL 68 A272 Hooklands A275 8759 0.964 0.036 0.787 0.163 0.025 0.012 0.005 S2AP RURAL 69 A275 A272 N Hall Lane 4554 0.956 0.044 0.766 0.179 0.030 0.013 0.006 S2AP RURAL 70 A2101 A259 A21 9537 0.991 0.009 0.839 0.114 0.007 0.002 0.030 S2AP URBAN 71 A259 A2040 Ashford Road 17692 0.989 0.011 0.821 0.134 0.010 0.001 0.027 S2AP URBAN 72 A22 A275 Wall Hill Road 17038 0.965 0.035 0.801 0.145 0.022 0.013 0.006 S2AP RURAL 73 A28 A21 B2099 9608 0.973 0.027 0.812 0.146 0.015 0.012 0.005 S2AP RURAL 74 A267 B2099 B2169 12978 0.977 0.023 0.802 0.162 0.014 0.009 0.007 S2AP RURAL 75 A267 B2102 A265 21364 0.975 0.025 0.781 0.180 0.018 0.007 0.005 S2AP RURAL 76 A268 B2087 Fish Market Road 5386 0.969 0.031 0.774 0.181 0.024 0.007 0.006 S2AP RURAL 77 A277 A275 A2029 8495 0.988 0.012 0.762 0.189 0.012 0.000 0.030 S2AP URBAN 78 A26 A26 Eastgate Street 22300 0.991 0.009 0.852 0.122 0.008 0.001 0.011 S2AP URBAN 79 A268 New Road Tower Street 7165 0.975 0.025 0.736 0.214 0.020 0.005 0.009 S2AP RURAL
80 A259 Ashford Road/Terminus
Road Devonshire Place 8443 0.988 0.012 0.841 0.141 0.011 0.000 0.003 S2AP URBAN 81 A22 A26 A26 22272 0.949 0.051 0.743 0.197 0.026 0.025 0.003 S2AP RURAL 82 A268 A259 WEST A259 EAST 7185 0.993 0.007 0.810 0.170 0.007 0.000 0.007 S2AP RURAL 83 A295 High Street A295 15942 0.985 0.015 0.856 0.119 0.012 0.004 0.005 S2AP URBAN

East Sussex Modified Permit Scheme – Cost Benefit Analysis
© East Sussex County Council
Page 22 of 87
Table 23 DfT Traffic Flow Site Data 2016
East Sussex
DfT Traffic Flow Site Data 2014 (Sheet 8 of 18)
2-way/1-way/bus
lane
Road Class
Ref No Road Start Junction End Junction Data Type RC
67 A267 B2102 A272 2-way RURAL 1 1 68 A272 Hooklands A275 2-way RURAL 1 3 69 A275 A272 N Hall Lane 2-way RURAL 1 4 70 A2101 A259 A21 2-way URBAN 7 3 71 A259 A2040 Ashford Road 2-way URBAN 7 2 72 A22 A275 Wall Hill Road 2-way RURAL 1 1 73 A28 A21 B2099 2-way RURAL 1 3 74 A267 B2099 B2169 2-way RURAL 1 2 75 A267 B2102 A265 2-way RURAL 1 1 76 A268 B2087 Fish Market Road 2-way RURAL 1 4 77 A277 A275 A2029 2-way URBAN 7 3 78 A26 A26 Eastgate Street 2-way URBAN 7 1 79 A268 New Road Tower Street 2-way RURAL 7 3
80 A259 Ashford Road/Terminus
Road Devonshire Place 1-way URBAN 7 3 81 A22 A26 A26 2-way RURAL 1 1 82 A268 A259 WEST A259 EAST 2-way RURAL 1 3
83 A295 High Street A295 2-way URBAN 7 2

East Sussex Modified Permit Scheme – Cost Benefit Analysis
© East Sussex County Council
Page 23 of 87
Table 24 DfT Traffic Flow Site Data 2016
East Sussex DfT Traffic Flow Site Data 2014 (Sheet 9 of 18)
Ref No
All Motor Vehicles
Road Start Junction End Junction %Lights %Heavy % Car
% LGV %OGV1 %OGV2 %PSV Type
Data Type
84 A295 North Street North Street 3925 0.978 0.022 0.747 0.185 0.021 0.001 0.037 S2AP URBAN 85 A268 A21 Delmonden Lane 6452 0.963 0.037 0.790 0.157 0.022 0.015 0.014 S2AP RURAL 86 A264 B2110 B2026 6443 0.989 0.011 0.841 0.138 0.008 0.002 0.001 S2AP RURAL 87 A259 A26 A259 The Drove roundabout 6117 0.975 0.025 0.764 0.183 0.019 0.006 0.025 S2AP URBAN 88 A2029 West St East Gate 14933 0.991 0.009 0.825 0.138 0.008 0.001 0.023 D2AP URBAN 89 A2029 North Street Eastgate Street 4581 0.991 0.009 0.849 0.134 0.009 0.001 0.005 S2AP URBAN 90 A277 Fisher St Eastgate Street 4970 0.991 0.009 0.794 0.151 0.008 0.001 0.039 S2AP URBAN 91 A2029 High St Mount Place 6070 0.994 0.006 0.853 0.128 0.006 0.000 0.009 S2AP URBAN 92 A2029 Fisher St Market St 10576 0.995 0.005 0.859 0.123 0.005 0.000 0.007 S2AP URBAN 93 A2029 Fisher St West St 4113 0.987 0.013 0.784 0.145 0.012 0.001 0.050 S2AP URBAN 94 A272 A275 A275 13201 0.956 0.044 0.786 0.155 0.022 0.022 0.007 S2AP RURAL 95 A259 B2093 A259 (trunk) 10778 0.961 0.039 0.753 0.180 0.030 0.009 0.024 S2AP URBAN 96 A259 A259 main route A26 3489 0.965 0.035 0.717 0.231 0.031 0.004 0.004 S2AP URBAN 97 A259 A259 spur toA26 A259 The Drove roundabout 21196 0.992 0.008 0.817 0.162 0.007 0.001 0.004 S2AP URBAN 98 A2029 High St Phoenix Causeway 4970 0.991 0.009 0.794 0.151 0.008 0.001 0.039 S2AP URBAN 99 A259 A2101 Harold Place A2101 Albert Road 19103 0.987 0.013 0.808 0.132 0.009 0.004 0.029 WS2+1 URBAN 100 A26 Sweethaws Lane B2157 Eridge Rd 12279 0.966 0.034 0.791 0.165 0.023 0.010 0.006 D2AP URBAN
101 A26 A22 Sweethaws Lane,
Crowborough 10972 0.955 0.045 0.755 0.186 0.027 0.017 0.006 S2AP RURAL

East Sussex Modified Permit Scheme – Cost Benefit Analysis
© East Sussex County Council
Page 24 of 87
Table 25 DfT Traffic Flow Site Data 2016
East Sussex
DfT Traffic Flow Site Data 2014 (Sheet 10 of 18)
Ref No
2-way/1-way/bus
lane
Road Class
Road Start Junction End Junction Data Type RC
84 A295 North Street North Street 1-way URBAN 7 4 85 A268 A21 Delmonden Lane 2-way RURAL 1 3
86 A264 B2110 B2026 2-way RURAL 1 3 87 A259 A26 A259 The Drove roundabout 2-way URBAN 7 4 88 A2029 West St East Gate 1-way URBAN 7 2 89 A2029 North Street Eastgate Street 1-way URBAN 7 4 90 A277 Fisher St Eastgate Street 1-way URBAN 7 4 91 A2029 High St Mount Place 1-way URBAN 7 4 92 A2029 Fisher St Market St 1-way URBAN 7 3 93 A2029 Fisher St West St 1-way URBAN 7 4 94 A272 A275 A275 2-way RURAL 1 2 95 A259 B2093 A259 (trunk) 2-way URBAN 11 3 96 A259 A259 main route A26 2-way URBAN 8 4 97 A259 A259 spur toA26 A259 The Drove roundabout 2-way URBAN 8 1 98 A2029 High St Phoenix Causeway 1-way URBAN 7 4 99 A259 A2101 Harold Place A2101 Albert Road 2-way URBAN 7 2
100 A26 Sweethaws Lane B2157 Eridge Rd 2-way URBAN 7 3
101 A26 A22 Sweethaws Lane,
Crowborough 2-way RURAL 1 2

East Sussex Modified Permit Scheme – Cost Benefit Analysis
© East Sussex County Council
Page 25 of 87
Table 26 DfT Traffic Flow Site Data 2016
East Sussex DfT Traffic Flow Site Data 2014 (Sheet 11 of 18)
Ref No
All Motor Vehicles
Road Start Junction End Junction %Lights %Heavy % Car
% LGV %OGV1 %OGV2 %PSV Type
Data Type
102 A259 Old Willingdon Road, East
Dean Cherry Garden Rd,
Eastbourne 11727 0.985 0.015 0.814 0.147 0.013 0.002 0.012 S2AP RURAL 103 A259 B2104 Pacific Drive 24476 0.994 0.006 0.866 0.111 0.005 0.002 0.009 D2AP URBAN 104 A295 A22 Arlington Road East 11655 0.985 0.015 0.810 0.158 0.012 0.003 0.014 S2AP RURAL 105 A271 B2104 London Rd A295 8758 0.961 0.039 0.776 0.167 0.022 0.018 0.011 S2AP URBAN 106 A269 Mount Idol View A2036 15666 0.985 0.015 0.817 0.150 0.012 0.004 0.009 S2AP URBAN
107 A2100 A21 B2159 Battle Rd 13066 0.982 0.018 0.818 0.153 0.011 0.007 0.006 S2AP URBAN 108 A277 Montacute Rd A275 16199 0.977 0.023 0.810 0.142 0.013 0.010 0.012 S2AP URBAN
109 A259 A259 Drove Road
roundabout B2109 Avis Rd 32425 0.988 0.012 0.835 0.137 0.009 0.002 0.011 D2AP URBAN 110 A259 B2109 Avis Rd Bishopstone Rd, Seaford 29211 0.988 0.012 0.835 0.137 0.009 0.002 0.011 S2AP RURAL
111 A259 Chyngton Lane, Seaford Old Willingdon Road, East
Dean 11912 0.990 0.010 0.834 0.132 0.009 0.001 0.014 S2AP RURAL 112 A22 A27 B2191 32945 0.972 0.028 0.813 0.149 0.018 0.010 0.003 D2AP RURAL 113 A271 A269 A2100 4873 0.934 0.066 0.749 0.168 0.041 0.025 0.004 S2AP RURAL 114 A2021 A2280 A2040 21760 0.992 0.008 0.851 0.128 0.007 0.002 0.007 S2AP URBAN 115 A2280 A2021 A2290 26356 0.992 0.008 0.865 0.117 0.006 0.002 0.002 S2AP URBAN 116 A2290 A259 A2280 29125 0.980 0.020 0.794 0.175 0.014 0.006 0.004 D2AP URBAN 117 A22 A2290 B2191 34474 0.983 0.017 0.845 0.126 0.011 0.006 0.003 D2AP URBAN 118 A269 A271 Mount Idol View, Bexhill 8621 0.972 0.028 0.728 0.222 0.021 0.006 0.009 S2AP RURAL 119 B2096 A265 C16 7298 0.984 0.016 0.795 0.175 0.014 0.003 0.003 S2AP RURAL 120 B2244 B2089 A229 4602 0.980 0.020 0.746 0.223 0.017 0.004 0.002 S2AP RURAL 121 B2102 A267 B2192 2168 0.975 0.025 0.775 0.190 0.016 0.009 0.002 S2AP RURAL 122 B2088 A28 B2165 1555 1.000 0.000 0.855 0.125 0.000 0.000 0.008 S2AP RURAL 123 B2204 A271 B2095 4775 0.978 0.022 0.794 0.173 0.018 0.005 0.005 S2AP RURAL 124 B2026 A22 B2188 5870 0.981 0.019 0.826 0.150 0.015 0.004 0.001 S2AP RURAL 125 B2110 B2026 A22 3945 0.987 0.013 0.839 0.133 0.010 0.003 0.009 S2AP RURAL

East Sussex Modified Permit Scheme – Cost Benefit Analysis
© East Sussex County Council
Page 26 of 87
Table 27 DfT Traffic Flow Site Data 2016
East Sussex DfT Traffic Flow Site Data 2014 (Sheet 12 of 18)
Ref No
2-way/1-way/bus
lane
Road Class
Road Start Junction End Junction Data Type RC
102 A259 Old Willingdon Road, East
Dean Cherry Garden Rd,
Eastbourne 2-way RURAL 1 2 103 A259 B2104 Pacific Drive 2-way URBAN 10 1 104 A295 A22 Arlington Road East 2-way RURAL 1 2 105 A271 B2104 London Rd A295 2-way URBAN 10 3 106 A269 Mount Idol View A2036 2-way URBAN 7 2
107 A2100 A21 B2159 Battle Rd 2-way URBAN 10 2 108 A277 Montacute Rd A275 2-way URBAN 8 2
109 A259 A259 Drove Road
roundabout B2109 Avis Rd 2-way URBAN 8 1 110 A259 B2109 Avis Rd Bishopstone Rd, Seaford 2-way RURAL 1 1
111 A259 Chyngton Lane, Seaford Old Willingdon Road, East
Dean 2-way RURAL 1 2 112 A22 A27 B2191 2-way RURAL 2 0 113 A271 A269 A2100 2-way RURAL 1 4 114 A2021 A2280 A2040 2-way URBAN 8 1 115 A2280 A2021 A2290 2-way URBAN 10 1 116 A2290 A259 A2280 2-way URBAN 8 1 117 A22 A2290 B2191 2-way URBAN 11 1 118 A269 A271 Mount Idol View, Bexhill 2-way RURAL 1 3 119 B2096 A265 C16 2-way RURAL 1 3 120 B2244 B2089 A229 2-way RURAL 1 4 121 B2102 A267 B2192 2-way RURAL 1 4 122 B2088 A28 B2165 2-way RURAL 1 4 123 B2204 A271 B2095 2-way RURAL 1 4 124 B2026 A22 B2188 2-way RURAL 1 4 125 B2110 B2026 A22 2-way RURAL 1 4

East Sussex Modified Permit Scheme – Cost Benefit Analysis
© East Sussex County Council
Page 27 of 87
Table 28 DfT Traffic Flow Site Data 2016
East Sussex DfT Traffic Flow Site Data 2014 (Sheet 13 of 18)
Ref No
All Motor Vehicles
Road Start Junction End Junction %Lights %Heavy % Car
% LGV %OGV1 %OGV2 %PSV Type
Data Type
126 B2110 B2026 B2188 4134 0.982 0.018 0.795 0.166 0.014 0.004 0.007 S2AP RURAL 127 B2102 A267 B2102 5594 0.971 0.029 0.775 0.176 0.017 0.012 0.004 S2AP RURAL 128 B2089 A268 A28 4140 0.962 0.038 0.744 0.193 0.021 0.017 0.005 S2AP RURAL 129 B2182 A259 A269 6591 0.997 0.003 0.859 0.109 0.003 0.000 0.022 S2AP URBAN 130 B2092 Ironlatch Avenue Church Wood Drive 14184 0.989 0.011 0.845 0.127 0.006 0.005 0.005 S2AP URBAN 131 B2157 A26 B2100 6006 0.985 0.015 0.844 0.132 0.009 0.006 0.002 S2AP URBAN 132 Bourne Lane B2244 A21 1755 0.978 0.022 0.769 0.201 0.021 0.002 0.001 S2AP RURAL 133 Mayfield Road B2101 Castle Hill 2124 0.991 0.009 0.853 0.127 0.008 0.001 0.001 S2AP RURAL 134 C208 C328 C329 1045 0.981 0.019 0.791 0.167 0.016 0.003 0.002 S2AP RURAL 135 Sharpsbridge Lane A272 Mackerel's Rocks 400 0.968 0.033 0.770 0.195 0.020 0.010 0.000 S2AP RURAL 136 Down Street Daleham Lane A272 361 0.970 0.030 0.765 0.202 0.030 0.003 0.000 S2AP RURAL 137 C214 Spring Lane Witherenden Road 1697 0.966 0.034 0.839 0.117 0.026 0.008 0.001 S2AP RURAL 138 C326 B2192 B2124 863 0.975 0.025 0.737 0.227 0.025 0.000 0.001 S2AP RURAL 139 Marley Lane A21 Upper Lake 3023 0.990 0.010 0.806 0.164 0.009 0.001 0.002 S2AP RURAL 140 C13 B2124 C326 398 0.970 0.030 0.714 0.254 0.025 0.003 0.003 S2AP RURAL 141 Lower Park Road Dordrecht Way Bethune Way 2726 0.997 0.003 0.857 0.122 0.004 0.000 0.000 S2AP URBAN 142 Brightling Road High St Bugsell Lane 1494 0.977 0.023 0.781 0.167 0.015 0.009 0.026 S2AP URBAN 143 Firle Road Royal Drive Upper Belgrave Road 1598 0.993 0.007 0.898 0.091 0.007 0.000 0.000 S2AP URBAN 144 Lascelles Terrace Compton Street B2103 848 0.995 0.005 0.864 0.127 0.005 0.000 0.001 S2AP URBAN 145 Kirby Drive Telscombe Cliffs Way Ambleside Avenue 3250 0.994 0.006 0.838 0.143 0.006 0.001 0.000 S2AP URBAN 146 Workhouse Lane A28 Moor Lane 1579 0.992 0.008 0.820 0.169 0.005 0.003 0.001 S2AP URBAN 147 Hurtis Hill High Broom Road Whitehill Road 4046 0.979 0.021 0.814 0.137 0.016 0.005 0.017 S2AP URBAN 148 Northbridge Street A21 Station Road 2234 0.988 0.012 0.819 0.147 0.011 0.000 0.017 S2AP RURAL 149 Kingston Road Southover High Street Wellgreen Lane 6356 0.986 0.014 0.852 0.120 0.010 0.004 0.004 D2AP RURAL

East Sussex Modified Permit Scheme – Cost Benefit Analysis
© East Sussex County Council
Page 28 of 87
Table 29 DfT Traffic Flow Site Data 2016
East Sussex DfT Traffic Flow Site Data 2014 (Sheet 14 of 18)
Ref No
2-way/1-way/bus
lane
Road Class
Road Start Junction End Junction Data Type RC
126 B2110 B2026 B2188 2-way RURAL 1 4 127 B2102 A267 B2102 2-way RURAL 1 4 128 B2089 A268 A28 2-way RURAL 1 4 129 B2182 A259 A269 2-way URBAN 8 4 130 B2092 Ironlatch Avenue Church Wood Drive 2-way URBAN 10 2 131 B2157 A26 B2100 2-way URBAN 8 4 132 Bourne Lane B2244 A21 2-way RURAL 1 4 133 Mayfield Road B2101 Castle Hill 2-way RURAL 1 4 134 C208 C328 C329 2-way RURAL 1 4 135 Sharpsbridge Lane A272 Mackerel's Rocks 2-way RURAL 1 4 136 Down Street Daleham Lane A272 2-way RURAL 1 4 137 C214 Spring Lane Witherenden Road 2-way RURAL 1 4 138 C326 B2192 B2124 2-way RURAL 1 4 139 Marley Lane A21 Upper Lake 2-way RURAL 1 4 140 C13 B2124 C326 2-way RURAL 1 4 141 Lower Park Road Dordrecht Way Bethune Way 2-way URBAN 8 4 142 Brightling Road High St Bugsell Lane 2-way URBAN 10 4 143 Firle Road Royal Drive Upper Belgrave Road 2-way URBAN 8 4 144 Lascelles Terrace Compton Street B2103 2-way URBAN 7 4 145 Kirby Drive Telscombe Cliffs Way Ambleside Avenue 2-way URBAN 8 4 146 Workhouse Lane A28 Moor Lane 2-way URBAN 10 4 147 Hurtis Hill High Broom Road Whitehill Road 2-way URBAN 10 4 148 Northbridge Street A21 Station Road 2-way RURAL 1 4 149 Kingston Road Southover High Street Wellgreen Lane 2-way RURAL 1 3

East Sussex Modified Permit Scheme – Cost Benefit Analysis
© East Sussex County Council
Page 29 of 87
Table 30 DfT Traffic Flow Site Data 2016
East Sussex DfT Traffic Flow Site Data 2014 (Sheet 15 of 18)
Ref No
All Motor Vehicles
Road Start Junction End Junction %Lights %Heavy % Car
% LGV %OGV1 %OGV2 %PSV Type
Data Type
149 Kingston Road Southover High Street Wellgreen Lane 6356 0.986 0.014 0.852 0.120 0.010 0.004 0.004 D2AP RURAL 150 Pebsham Drive Buckholt Avenue Filsham Drive 153 0.961 0.039 0.693 0.255 0.039 0.000 0.000 S2AP RURAL 151 Seaview Road A259 The Promenade 718 0.999 0.001 0.822 0.169 0.001 0.000 0.001 S2AP RURAL 152 Darvel Down B2096 Darvel Down 816 0.995 0.005 0.849 0.136 0.005 0.000 0.002 S2AP RURAL 153 James Avenue West End Bagham Lane 362 1.000 0.000 0.834 0.152 0.000 0.000 0.000 S2AP RURAL 154 Plumpton Lane B2116 South Road 1226 0.988 0.012 0.781 0.187 0.011 0.002 0.011 S2AP RURAL 155 Vine Square Martello Road A259 341 0.994 0.006 0.862 0.129 0.006 0.000 0.000 S2AP URBAN 156 Eisenhower Drive Fairfax Avenue End of Road 341 0.988 0.012 0.853 0.120 0.012 0.000 0.000 S2AP URBAN 157 Gundreda Road Prince Edward's Road Christie Road 641 0.995 0.005 0.871 0.119 0.006 0.000 0.000 S2AP URBAN 158 Church Lane Old Malling Way Mayhew Way 2446 0.998 0.002 0.862 0.116 0.002 0.000 0.011 S2AP URBAN 159 Babylon Way Parkway Upper Ratton Drive 724 0.988 0.012 0.844 0.142 0.012 0.000 0.001 S2AP URBAN 160 Great Cliffe Road Etchingham Road Priory Road 369 0.995 0.005 0.883 0.108 0.005 0.000 0.000 S2AP URBAN 161 St John's Road A2036 B2182 864 0.998 0.002 0.851 0.134 0.002 0.000 0.010 S2AP URBAN 162 Gibraltar Rise Station Road Marshland's Lane 282 1.000 0.000 0.869 0.124 0.000 0.000 0.000 S2AP URBAN 163 Baldwin Avenue Victoria Drive Eldon Road 1489 0.996 0.004 0.882 0.109 0.003 0.001 0.001 S2AP URBAN 164 Beeching Road Terminus Road A269 4098 0.978 0.022 0.680 0.283 0.019 0.004 0.004 S2AP URBAN 165 Grenville Road A259 End of Road 291 0.983 0.017 0.887 0.100 0.017 0.000 0.000 S2AP URBAN 166 Church Road A21 Saint Margaret's Road 2416 0.993 0.007 0.844 0.128 0.007 0.000 0.006 S2AP URBAN 167 Crowmere Avenue Barrack Road St George's Road 1221 0.993 0.007 0.863 0.123 0.007 0.000 0.000 S2AP URBAN 168 Ramsay Way Princes Road Prince William Parade 2984 0.997 0.003 0.831 0.132 0.003 0.000 0.027 S2AP URBAN 169 Cradle Hill Road Valley Drive Alfriston Road 2967 0.966 0.034 0.707 0.249 0.029 0.005 0.000 S2AP URBAN 170 Spences Lane A26 Hereward Way 382 0.987 0.013 0.791 0.154 0.013 0.000 0.016 S2AP URBAN 171 Mendip Avenue Pennine Way Pennine Way 498 0.996 0.004 0.859 0.122 0.004 0.000 0.008 S2AP URBAN 172 St John's Terrace White Hill St John's Hill 406 0.998 0.002 0.842 0.148 0.002 0.000 0.002 S2AP URBAN

East Sussex Modified Permit Scheme – Cost Benefit Analysis
© East Sussex County Council
Page 30 of 87
Table 31 DfT Traffic Flow Site Data 2016
East Sussex DfT Traffic Flow Site Data 2014 (Sheet 16 of 18)
Ref No
2-way/1-way/bus
lane
Road Class
Road Start Junction End Junction Data Type RC
149 Kingston Road Southover High Street Wellgreen Lane 2-way RURAL 1 3 150 Pebsham Drive Buckholt Avenue Filsham Drive 2-way RURAL 1 4 151 Seaview Road A259 The Promenade 2-way RURAL 1 4 152 Darvel Down B2096 Darvel Down 2-way RURAL 1 4 153 James Avenue West End Bagham Lane 2-way RURAL 1 4 154 Plumpton Lane B2116 South Road 2-way RURAL 1 4 155 Vine Square Martello Road A259 1-way URBAN 8 4 156 Eisenhower Drive Fairfax Avenue End of Road 2-way URBAN 8 4 157 Gundreda Road Prince Edward's Road Christie Road 2-way URBAN 8 4 158 Church Lane Old Malling Way Mayhew Way 2-way URBAN 8 4 159 Babylon Way Parkway Upper Ratton Drive 2-way URBAN 8 4 160 Great Cliffe Road Etchingham Road Priory Road 2-way URBAN 8 4 161 St John's Road A2036 B2182 2-way URBAN 8 4 162 Gibraltar Rise Station Road Marshland's Lane 2-way URBAN 10 4 163 Baldwin Avenue Victoria Drive Eldon Road 2-way URBAN 8 4 164 Beeching Road Terminus Road A269 2-way URBAN 8 4 165 Grenville Road A259 End of Road 2-way URBAN 10 4 166 Church Road A21 Saint Margaret's Road 2-way URBAN 8 4 167 Crowmere Avenue Barrack Road St George's Road 2-way URBAN 8 4 168 Ramsay Way Princes Road Prince William Parade 2-way URBAN 8 4 169 Cradle Hill Road Valley Drive Alfriston Road 2-way URBAN 8 4 170 Spences Lane A26 Hereward Way 2-way URBAN 8 4 171 Mendip Avenue Pennine Way Pennine Way 2-way URBAN 8 4 172 St John's Terrace White Hill St John's Hill 1-way URBAN 8 4

East Sussex Modified Permit Scheme – Cost Benefit Analysis
© East Sussex County Council
Page 31 of 87
Table 32 DfT Traffic Flow Site Data 2016
East Sussex DfT Traffic Flow Site Data 2014 (Sheet 17 of 18)
Ref No
All Motor Vehicles
Road Start Junction End Junction %Lights %Heavy % Car
% LGV %OGV1 %OGV2 %PSV Type URBAN
173 Tye View Warren Way Telscombe Cliffs Way 315 1.000 0.000 0.911 0.073 0.000 0.000 0.000 S2AP URBAN 174 Broadway Waites Lane Lower Waites Lane 864 0.991 0.009 0.840 0.150 0.009 0.000 0.000 S2AP URBAN 175 Farthing Lane North Road Church Road 60 1.000 0.000 0.683 0.283 0.000 0.000 0.000 S2AP RURAL
Table 33 DfT Traffic Flow Site Data 2016
East Sussex DfT Traffic Flow Site Data 2014 (Sheet 18 of 18)
Ref No
2-way/1-way/bus
lane
Road Class
Road Start Junction End Junction URBAN RC 173 Tye View Warren Way Telscombe Cliffs Way 2-way URBAN 8 4 174 Broadway Waites Lane Lower Waites Lane 2-way URBAN 10 4 175 Farthing Lane North Road Church Road 2-way RURAL 1 4

East Sussex Modified Permit Scheme – Cost Benefit Analysis
© East Sussex County Council
Page 32 of 87
Figure 1 DfT AADT Locations East Sussex

East Sussex Modified Permit Scheme – Cost Benefit Analysis
© East Sussex County Council
Page 33 of 87
5 DELAY MODELLING
5.1 DELAY MODELLING METHODOLOGY The estimation of delay is detailed in the Halcrow study. Two methods of measurement are listed
(a) live site measured method; and
(b) modelling techniques to replicate works on the ground.
The measured method is described as a restricted illustrative example of the impact at works and a general model is more industry recognised as the more robust technique that can be audited and validated.
There are three types of modelling software that can be used to model delay at works namely;
QUADRO – models queues and delays at road works;
SATURN – macro assignment;
and VISSIM – micro simulation.
The Halcrow study stated in Section 2.1 that on evaluation there were inconsistencies with the latter two types and that QUADRO would give the most consistent results although it is suited more to rural locations with little diversion routes but it is able to model the additional delay on diversion routes when the maximum queuing delay on the main route is exceeded.
QUADRO is able to appraise individual works that are planned in the future on different types of road by modelling the delay experienced by road users, quantify the delay and estimate the cost of the delay.
The software is able to calculate and convert delays in to monetary figures as detailed in WebTAG Unit 3.5.6. with assumptions in regard to valuation of time, operating costs and accidents.
Users are required to input base link specific details including network classification, traffic flows, road type characteristics and any diversion routes. Works details including site length, works type such as lane closures and shuttle working. The latest version released on 4th June 2014 Version 4 release 12.1` will be used for the CBA. The QUADRO Manual is included in the Design Manual for Roads and Bridges Volume 14 Economic Assessment of Road Maintenance DfT 2002.
5.2 THE VALUATION OF COSTS IN QUADRO
5.2.1 The Valuation of Time QUADRO calculates the delays at works and translates these into monetary figures using standard values of time.
The latest values are provided in WebTAG Unit 3.5.6 and is shown in Table 34 and 35 below. QUADRO converts the resource cost to market price to be consistent with the Economic Efficiency of the Transport System (TEE) table. The market price is calculated by multiplying the resource value by (1 + t) where t is the average rate of indirect taxation in the economy.

East Sussex Modified Permit Scheme – Cost Benefit Analysis
© East Sussex County Council
Page 34 of 87
Table 34 WebTAG - Value of Time by Mode and Trip Purpose
Table A 1.3.1: Values of Working (Employers' Business) Time by Mode (£ per hour, 2010 prices, 2010 values)
Mode Resource Perceived Market
Cost Cost Price Car driver 22.74 22.74 27.06
Car passenger 17.25 17.25 20.52 LGV (driver or passenger) 10.24 10.24 12.18 OGV (driver or passenger) 12.06 12.06 14.35 PSV driver 12.32 12.32 14.66 PSV passenger 13.97 13.97 16.63 Taxi driver
10.89 10.89 12.96
Taxi / Minicab passenger 21.96 21.96 26.13 Rail passenger 26.86 26.86 31.96 Underground passenger 22.08 22.08 26.28 Walker 17.54 17.54 20.88 Cyclist 17.47 17.47 20.78 Motorcyclist 19.42 19.42 23.11 Average of all working persons 22.75 22.75 27.07
Values of Non-Working Time by Trip Purpose (£ per hour, 2010 prices, 2010 values)
Trip Purpose Resource Perceived Market
Cost Cost Price Commuting 5.72 6.81 6.81 Other 5.08 6.04 6.04

East Sussex Modified Permit Scheme – Cost Benefit Analysis
© East Sussex County Council
Page 35 of 87
Table 35 WebTAG - Value of Time per Vehicle per hour
Table A 1.3.5: Market Price Values of Time per Vehicle based on distance travelled (£ per hour, 2010 prices and 2010 values)
Vehicle Weekday
Type Journey Purpose 7am –
10am 10am – 4pm
4pm – 7pm
7pm – 7am Average Weekend All
Week Car Work 31.56 30.81 30.34 30.58 30.99 32.54 30.99 Commuting 7.83 7.77 7.65 7.66 7.71 7.72 7.71 Other 10.06 10.46 10.74 10.48 10.49 11.61 10.90 Average Car 12.92 14.20 12.03 11.93 12.98 11.95 12.73 LGV Work (freight) 14.62 14.62 14.62 14.62 14.62 15.35 14.62
Commuting & Other 9.15 9.15 9.15 9.15 9.15 12.72 9.15
Average LGV 13.96 13.96 13.96 13.96 13.96 15.03 13.96 OGV1 Working 14.35 14.35 14.35 14.35 14.35 14.35 14.35 OGV2 Working 14.35 14.35 14.35 14.35 14.35 14.35 14.35 PSV Work 22.57 18.72 22.57 26.22 21.56 17.70 22.57 (Occupants) Commuting 24.93 9.22 30.41 31.66 21.19 5.32 24.93 Other 48.74 64.08 43.88 41.44 52.43 67.84 48.74 Total 96.24 92.02 96.86 99.32 95.18 90.86 94.06
5.2.2 The Valuation of Vehicle Operating Costs QUADRO calculates the vehicle operating costs (VOC) incurred by traffic with and without works.
VOC may increase during works if speeds are reduced or a long diversion route. The effects of temporary blockages caused by accidents are solely assessed on journey time and operating costs are not calculated. As the resource cost of fuel, fuel efficiency and fleet composition change independently, the relationship of resource cost (per kilometre) to market prices changes annually.
The programme is informed of changes in tax rates over time and are shown in Tables 36 to 37 below.
Values for 2010 VOC are shown in Table 38 below.
Carbon emissions are considered in terms of the change in the equivalent tonnes of carbon Table 39 and estimated from fuel consumption Table 40 below.
Table 36 Taxation Rates Base
TAXATION RATES (%) FUEL AVERAGE FUEL NON-FUEL TYPE FINAL FINAL INTER FINAL INTER PETROL 19 339.7 274.2 20 0 DIESEL 19 310.1 249.1 20 0

East Sussex Modified Permit Scheme – Cost Benefit Analysis
© East Sussex County Council
Page 36 of 87
Table 37 Changes to Taxation Rates % Petrol
CHANGES TO TAXATION RATES (%) PETROL AVERAGE FUEL NON-FUEL FROM TO
FINAL FINAL INTER FINAL INTER YEAR YEAR 0 -9.87 -10.41 0 0 2002 2003 0 -9.73 -10.32 0 0 2003 2004 0 -19.56 -20.88 0 0 2004 2005 0 -11 -11.94 0 0 2005 2006 0 0.63 0.69 0 0 2006 2007 0 -18.64 -20.19 0 0 2007 2008 0 29.04 36.78 0 0 2008 2009 0 -16.11 -20.38 0 0 2009 2010 0 -13.72 -18.56 0 0 2009 2010 0 -3.34 -3.85 0 0 2010 2011 0 -1.94 -2.24 0 0 2011 2012 0 -1.6 -1.85 0 0 2012 2013 0 0.53 0.62 0 0 2013 2014 0 0.81 0.95 0 0 2014 2015 0 1.19 1.39 0 0 2015 2016 0 0.98 1.14 0 0 2016 2017 0 0.79 0.92 0 0 2017 2018 0 0.61 0.71 0 0 2018 2019 0 0.43 0.49 0 0 2019 2020 0 0.25 0.29 0 0 2020 2021 0 0.25 0.28 0 0 2021 2022 0 0.29 0.34 0 0 2022 2023 0 0.35 0.4 0 0 2023 2024 0 0.31 0.36 0 0 2024 2025 0 0.36 0.42 0 0 2025 2026 0 0.31 0.35 0 0 2026 2027 0 0.32 0.36 0 0 2027 2028 0 0.32 0.37 0 0 2028 2029 0 0 0 0 0 2030 2099

East Sussex Modified Permit Scheme – Cost Benefit Analysis
© East Sussex County Council
Page 37 of 87
Table 38 Changes to Taxation Rates % Diesel
CHANGES TO TAXATION RATES (%) DIESEL AVERAGE FUEL NON-FUEL FROM TO
FINAL FINAL INTER FINAL INTER YEAR YEAR 0 -7.7 -8.16 0 0 2002 2003 0 -8.4 -8.95 0 0 2003 2004 0 -23.5 -25.18 0 0 2004 2005 0 -9.53 -10.44 0 0 2005 2006 0 3.85 4.26 0 0 2006 2007 0 -27.29 -29.85 0 0 2007 2008 0 37.84 48.13 0 0 2008 2009 0 -10.45 -14.64 0 0 2009 2010 0 -16.24 -21.43 0 0 2009 2010 0 -4.42 -5.14 0 0 2010 2011 0 -3.49 -4.09 0 0 2011 2012 0 -1.56 -1.84 0 0 2012 2013 0 0.54 0.64 0 0 2013 2014 0 0.81 0.96 0 0 2014 2015 0 1.2 1.41 0 0 2015 2016 0 0.98 1.15 0 0 2016 2017 0 0.79 0.93 0 0 2017 2018 0 0.62 0.73 0 0 2018 2019 0 0.45 0.53 0 0 2019 2020 0 0.26 0.3 0 0 2020 2021 0 0.26 0.3 0 0 2021 2022 0 0.31 0.36 0 0 2022 2023 0 0.35 0.41 0 0 2023 2024 0 0.32 0.38 0 0 2024 2025 0 0.35 0.41 0 0 2025 2026 0 0.34 0.39 0 0 2026 2027 0 0.32 0.37 0 0 2027 2028 0 0.32 0.38 0 0 2028 2029 0 0 0 0 0 2030 2099

East Sussex Modified Permit Scheme – Cost Benefit Analysis
© East Sussex County Council
Page 38 of 87
Table 39 WebTAG – Non-Fuel Resource Vehicle Operating Costs
Table A 1.3.14: Non-Fuel Resource Vehicle Operating Costs (2010 prices and 2010 values)
Vehicle Category Parameter Values
a1 p / km b1 p / hr
Car Work Petrol 4.966 135.946 Work Diesel 4.966 135.946 Work Electric 1.157 135.946 Non-Work Petrol 3.846 0.000 Non-Work Diesel 3.846 0.000
Non-Work Electric 1.157 0.000
LGV Work 7.213 47.113 Non-Work 7.213 0.000 Average 7.213 41.458 OGV1 Work 6.714 263.817 OGV2 Work 13.061 508.525 PSV Work 30.461 694.547
Table 40 WebTAG – Carbon dioxide emissions per litre of fuel burnt / kWh used
Table A 3.4: Non Traded Values, £ per Tonne of CO2e (2010 prices)
Year Low Central High 2010 27.06 54.12 81.18 2011 27.46 54.93 82.39 2012 27.88 55.75 83.63 2013 28.29 56.59 84.88 2014 28.72 57.44 86.16 2015 29.15 58.30 87.45 2016 29.59 59.17 88.76 2017 30.03 60.06 90.09 2018 30.48 60.96 91.44 2019 30.94 61.88 92.82 2020 31.40 62.81 94.21

East Sussex Modified Permit Scheme – Cost Benefit Analysis
© East Sussex County Council
Page 39 of 87
Table 41 WebTAG – Fuel consumption parameter values
Table A 1.3.8: Fuel consumption parameter values (litres per km, 2010)
Parameters
Vehicle Category a b c d Petrol Car
0.96402 0.04145 0.00005 2.01346E-06
Diesel Car 0.43709 0.05862 0.00052 4.12709E-06 Petrol LGV 1.55646 0.06425 0.00074 1.00552E-05 Diesel LGV 1.04527 0.05790 0.00043 8.02520E-06 OGV1 1.47737 0.24562 0.00357 3.06380E-05 OGV2 3.39070 0.39438 0.00464 3.59224E-05 PSV 4.11560 0.30646 0.00421 3.65263E-05 Energy consumption parameter values
(kWh per km, 2011) Electric Car 0.12564 Electric LGV Electric OGV1 Electric OGV2 Electric PSV
5.2.3 The Valuation of Accidents Additional accidents may be expected in works and there are two types of cost incurred the cost of delay and the direct cost.
The direct cost includes the casualty, damage to property, insurance administration, police time and an allowance to damage only accidents. QUADRO calculates these values on the network using DfT standard values for average personal injury accidents on various types of road.
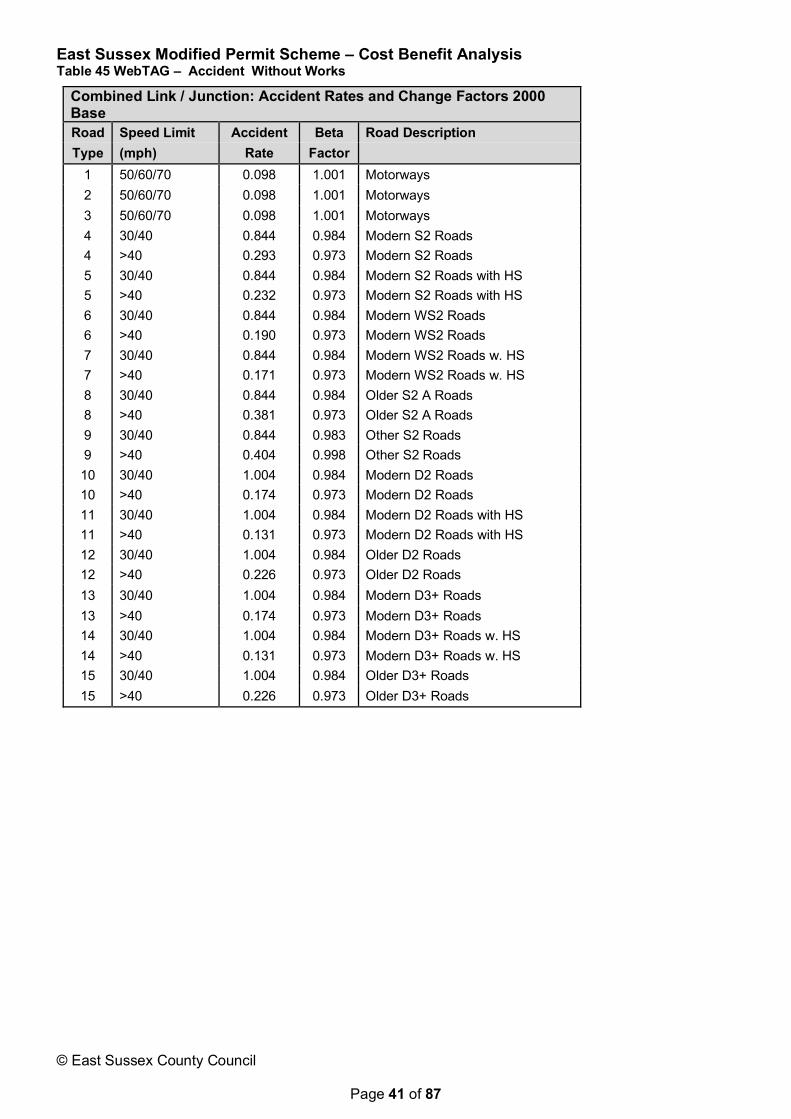
Values of most elements are proportional to national income and for 2010 are shown in Table 42 and 43 below. Accident values increase in line with GDP as shown in Table 44 below. Accident rates are calculated with and without works, combined link and junction rates are used in QUADRO,
Table 45 shows accident rates for 15 road types without works and Table 46 shows accident rates for each type and traffic management layout. Local data can be used only if available for both the without and with works in this CBA these default values are used.
Table 47 shows the number of casualties per accident.
Table 42 WebTAG – Cost per Casualty
Cost per Casualty Severity Cost £ Fatal 1,645,822 Serious 184,944 Slight 14,257

East Sussex Modified Permit Scheme – Cost Benefit Analysis
© East Sussex County Council
Page 40 of 87
Table 43 WebTAG – Cost per Accident
Cost per Accident Severity Insurance Damage to Property Police Cost
Administration Urban Rural Motorway Urban Rural Motorway Fatal 302 7,870 13,347 16,978 16,977 17,433 17,636 Serious 188 4,218 6,085 14,487 1,875 2,341 2,472 Slight 114 2,488 4,033 7,329 485 665 554 Damage 54 1,779 2,660 2,556 36 20 17
Table 44 WebTAG – Accident Growth Rates
Annual Rates of Growth of Accident Values Range of Years Growth Rate
(% p.a.) 2002 - 2003 3.54 2003 - 2004 2.67 2004 - 2005 2.56 2005 - 2006 2.16 2006 - 2007 2.75 2007 - 2008 -1.44 2008 - 2009 -5.77 2009 - 2010 0.89
East Sussex Modified Permit Scheme – Cost Benefit Analysis
© East Sussex County Council
Page 41 of 87
Table 45 WebTAG – Accident Without Works
Combined Link / Junction: Accident Rates and Change Factors 2000 Base Road Speed Limit Accident Beta Road Description Type (mph) Rate Factor
1 50/60/70 0.098 1.001 Motorways 2 50/60/70 0.098 1.001 Motorways 3 50/60/70 0.098 1.001 Motorways 4 30/40 0.844 0.984 Modern S2 Roads 4 >40 0.293 0.973 Modern S2 Roads 5 30/40 0.844 0.984 Modern S2 Roads with HS 5 >40 0.232 0.973 Modern S2 Roads with HS 6 30/40 0.844 0.984 Modern WS2 Roads 6 >40 0.190 0.973 Modern WS2 Roads 7 30/40 0.844 0.984 Modern WS2 Roads w. HS 7 >40 0.171 0.973 Modern WS2 Roads w. HS 8 30/40 0.844 0.984 Older S2 A Roads 8 >40 0.381 0.973 Older S2 A Roads 9 30/40 0.844 0.983 Other S2 Roads 9 >40 0.404 0.998 Other S2 Roads 10 30/40 1.004 0.984 Modern D2 Roads 10 >40 0.174 0.973 Modern D2 Roads 11 30/40 1.004 0.984 Modern D2 Roads with HS 11 >40 0.131 0.973 Modern D2 Roads with HS 12 30/40 1.004 0.984 Older D2 Roads 12 >40 0.226 0.973 Older D2 Roads 13 30/40 1.004 0.984 Modern D3+ Roads 13 >40 0.174 0.973 Modern D3+ Roads 14 30/40 1.004 0.984 Modern D3+ Roads w. HS 14 >40 0.131 0.973 Modern D3+ Roads w. HS 15 30/40 1.004 0.984 Older D3+ Roads 15 >40 0.226 0.973 Older D3+ Roads

East Sussex Modified Permit Scheme – Cost Benefit Analysis
© East Sussex County Council
Page 42 of 87
Table 46 WebTAG – Accident With Works
Combined Link / Junction: Accident Rates and Change Factors 2000 Base
Road Speed Limit Accident Beta Road Description
Type (mph) Rate Factor 16 direction with crossovers 0.130 1.001 D2M
17 direction with lane closure only 0.150 1.001 D2M 18 direction with crossovers 0.130 1.001 D3M 19 direction with lane closure only 0.150 1.001 D3M 20 direction with crossovers 0.130 1.001 D4M 21 direction with lane closure only 0.150 1.001 D4M 22
shuttle working 2.296 0.984 S2 Roads 30/40
22 1.036 0.973 S2 Roads >40 23 lane closure
2.296 0.984 S2 Roads 30/40 23 1.036 0.973 S2 Roads >40 24
shuttle working 2.296 0.984 WS2 Roads 30/40
24 1.036 0.973 WS2 Roads >40 25
lane closure 2.296 0.984 WS2 Roads 30/40
25 1.036 0.973 WS2 Roads >40 28
direction with crossovers 1.788 0.984 D2 Roads 30/40
28 0.31 0.973 D2 Roads >40 29
direction with lane closure only 1.255 0.984 D2 Roads 30/40
29 0.217 0.973 D2 Roads >40 32
direction with crossovers 1.788 0.984 D3+ Roads 30/40
32 0.31 0.973 D3+ Roads >40 33
direction with lane closure only 1.255 0.984 D3+ Roads 30/40
33 0.217 0.973 D3+ Roads >40
Table 47 WebTAG – Casualties per P.I.A.
Combined Link / Junction: Casualty Rates
Road Speed Limit Casualties per P.I.A. Road Description
Type (mph) Fatal Serious Slight 1 – 3 50 / 60 / 70 0.022 0.1520 1.462 Motorways 4 – 8 30 / 40 0.0092 0.1392 1.157 S2 A Roads 4 – 8 >40 0.0436 0.2855 1.286 S2 A Roads 9 30 / 40 0.0075 0.1379 1.124 Other S2 Roads 9 >40 0.0262 0.2513 1.245 Other S2 Roads
10 – 15 30 / 40 0.0093 0.1253 1.222 Dual Carriageways
10 – 15 >40 0.0286 0.1861 1.314 Dual Carriageways
5.3 DELAY MODELLING IN QUADRO
5.3.1 Elements of Delay The delay at works are made up of a number of elements that include the reduce running speeds through the site, traffic signal control for shuttle working, insufficient capacity causing queuing and diversion and are calculated by the General Delay Sub-Model.

East Sussex Modified Permit Scheme – Cost Benefit Analysis
© East Sussex County Council
Page 43 of 87
Accidents and breakdowns can cause further delay and will depend on location, amount of width and time of day and if alternative routes are available and are calculated by the Incident Delay Sub-Model.
5.3.2 The General Delay Sub-Model This model is run in each direction and for the four day types Monday to Thursday, Friday, Saturday and Sunday for each hour, the remaining queue is added to the following hour.
The assumption is that regular drivers would travel on the route that minimises the journey time. A driver may minimise journey time by diverting to an alternative before the work site and re-join past the site or divert the route completely.
If traffic is not expected to divert at a particular site and instead queue this implies there are unattractive routes. It can be found that a specification of a diversion route can be particularly difficult and QUADRO is able to be run with a maximum queuing delay.
For the purpose of the CBA this has been used, sample run data is included in the QUADRO manual for different types of road for maximum queuing delay and shown on Table 48 below. Once the maximum queue time is exceeded drivers will divert to a route and assumed that this would equal the journey time through the work site.
Table 48 Max-Q-Delay
Typical Max-Q-Delay QUADRO Type of Road Max-Q-Delay (mins)
S2 5 WS2 5 D2AP 10 D3AP 15
5.3.3 The Incident Delay Sub-Model If a breakdown or accident occurs within the site length this will restrict the capacity further.
Unlike the General Model drivers will not divert as this would not be a common event. This model is not run for shuttle working sites as it is assumed that the obstruction would be speedily removed.
This sub model is run twice once for breakdown and once for accidents. The sub model assumes that breakdowns occur at a rate shown in Table 49 below. Accident Rates were tabled earlier in Section 4.2.
Table 49 Breakdown Rates
5.4 TRAFFIC INPUT
5.4.1 Network and Route Type Description For each of the work sites certain characteristics are required by QUADRO including the length of the works site, adjoining sections up and downstream of the site (both directions) and the diversion route.
For the purpose of this CBA the diversion length is not modelled as the maximum queue delay method has been used.
The main route is considered to be consistent along its length and no flow variations. A road class is specified as shown on Table 50 below to calculate a speed/flow relationship with default values shown on Table 51 and 52.
Default Breakdown Rates QUADRO Vehicle Type Rate (vkm) Light 10 per 10^6 Heavy 5 per 10^6

East Sussex Modified Permit Scheme – Cost Benefit Analysis
© East Sussex County Council
Page 44 of 87
For each road class the user is able to input geometric parameters such as road width, hilliness, accesses along route, visibility, for the purpose of this CBA, typical values have been applied as set out in Table 53 below. The work site type is defined by the number of lanes open or shuttle working as shown on Table 54 below that selects a default capacity.
QUADRO contains values for average duration of incidents and are shown on Table 55 below.
Table 50 Road Classes
QUADRO Road Classes Road Class Description
Class 1 Rural single carriageway Class 2 Rural all-purpose dual 2 lane carriageway Class 3 Rural all-purpose dual 3 or more lane carriageway Class 4 Motorway (urban or rural), dual 2 lanes Class 5 Motorway (urban or rural), dual 4 or more lanes Class 6 Motorway (urban or rural), dual 3 lanes Class 7 Urban road, Central, single or dual carriageway Class 8 Urban road, Non-central, single or dual carriageway Class 9 Small town road, single or dual carriageway Class 10 Suburban Main Road, single carriageway Class 11 Suburban Main Road, dual carriageway
Table 51 Minimum Speeds
Default minimum speeds QUADRO Road Class Minimum speed
(kph) Classes 1 to 6 45 Class 7 25 Class 8 15 Class 9 30 Class 10 25 Class 11 35

East Sussex Modified Permit Scheme – Cost Benefit Analysis
© East Sussex County Council
Page 45 of 87
Table 52 Speed/Flow
Default Speed/flow Parameters QUADRO
CLASS LIGHT-V (kph) GRAD-A GRAD-B
HEAVY-V GRAD-A GRAD-B CHANGE MINS Qc
kph
reduction (kph) per 1000 veh
reduction (kph) per 1000 veh kph
reduction (kph) per 1000 veh
reduction (kph) per 1000 veh
Factor or vph per lane Kph
vph per lane
1 72.1 15 50 78.2 5.2 5.2 1920 45 2400 2 108 6 33 86 0 0 1080 45 2100 3 115 6 33 86 0 0 1080 45 2100 7 64.5 30 30 64.5 30 30 25 800 8 39.5 30 30 39.5 30 30 15 800
10 70 10 45 64 10 45 1200 25 1500 11 80 10 45 74 10 45 1200 35 1500
Table 53 Geometric Parameters
Default Geometric Parameters QUADRO
CLASS TYPE DESCRIPTION CWID HILLS DEVEL INT BEND MAXS SWID VWID JUNC VIS AXS
1 RURAL Single Carriageway 7.3 15 75 96 0 1 0.6 200 2 RURAL Dual 2 lanes 14.6 15 30 113 3 RURAL Dual 3 lanes 22 15 30 113 7 URBAN Non-central 10 15 70 8 URBAN Central 11 15 4.5 10 URBAN Suburban Single 10 15 0.8 64 30 11 URBAN Suburban Dual 14.6 15 0.8 64 30

East Sussex Modified Permit Scheme – Cost Benefit Analysis
© East Sussex County Council
Page 46 of 87
Table 54 Work Types
QUADRO Work Types Works Type Description
0 No lanes open in this direction 1 One lane open in this direction 2 Two lanes open in this direction 3 Three lanes open in this direction 4 Four lanes open in this direction 5 Five lanes open in this direction 9 Shuttle working
add 10 if layout features contra-flow working
Table 55 Incident Duration
Default Breakdown and Accident Durations in QUADRO Type of Road Breakdown Duration (mins) Accident Duration (mins) Motorway 25 30 Single and Dual AP 40 45
5.4.2 Variation in Traffic Flow Traffic flows vary by hour, day, week and month and different type of vehicles.
QUADRO calculates user costs daily and normally for a 7 day week using the four day types. For the purpose of this CBA AADT flows have been used and QUADRO converts this to Annual Average Hourly Traffic (AAHT) to generate an hourly flow profile.
The QUADRO model uses directional flow as each direction is modelled separately.
Two-way input flows are split by tidal behaviour for example the direction into town in the morning peak and the direction is specified by the user.
5.4.3 Vehicles in Work Time and Vehicle Occupancies QUADRO considers the disaggregation of time spent in work and non-work mode for each vehicle type.
The National Travel Survey (NTS) showed the average car mileage in work mode, commuting mode and non-working mode and are further disaggregated by average hourly percentages.
Averages for weekdays and weekends, vehicles and journey types are shown on Table 56 below.

East Sussex Modified Permit Scheme – Cost Benefit Analysis
© East Sussex County Council
Page 47 of 87
Table 56 WebTAG – Trip Proportions
Table A 1.3.4: Proportion of travel in work and non-work time Proportion of trips made in work and non-work time
Weekday Weekend All Week Weekday Weekend All Week
Mode / Vehicle Type 7am – 10am 10am – 4pm 4pm – 7pm 7pm – 7am Average Average Average 7am – 10am 10am – 4pm 4pm – 7pm 7pm – 7am Average Average Average
& Journey Purpose Percentage of Distance Travelled by Vehicles Percentage of Vehicle Trips
Car Work 18.1 19.9 13.0 12.3 16.4 3.2 13.1 6.8 8.3 5.5 3.6 6.5 1.7 5.0
Commuting 46.0 11.4 40.8 36.2 31.0 8.5 25.3 40.6 11.6 32.3 26.4 25.4 9.1 20.3
Other 35.9 68.7 46.2 51.5 52.5 88.3 61.6 52.7 80.1 62.2 70.0 68.1 89.3 74.7
LGV Work (freight) 88.0 88.0 88.0 88.0 88.0 88.0 88.0 88.0 88.0 88.0 88.0 88.0 88.0 88.0
Non – Work 12.0 12.0 12.0 12.0 12.0 12.0 12.0 12.0 12.0 12.0 12.0 12.0 12.0 12.0
OGV1 Work 100.0 100.0 100.0 100.0 100.0 100.0 100.0 100.0 100.0 100.0 100.0 100.0 100.0 100.0
OGV2 Work 100.0 100.0 100.0 100.0 100.0 100.0 100.0 100.0 100.0 100.0 100.0 100.0 100.0 100.0
Percentage of Distance Travelled by Occupants Percentage of Person Trips
Car Work 15.4 13.8 10.2 9.9 12.6 2.0 9.2 5.2 2.2 4.1 1.2 4.7 1.1 3.4
Commuting 38.3 8.1 32.2 29.1 23.9 5.1 18.0 33.3 15.6 25.8 10.9 20.0 6.4 15.2
Other 46.4 78.1 57.6 61.0 63.5 92.9 72.7 61.5 82.2 70.1 87.9 75.3 92.5 81.4
PSV Work 3.9 2.0 3.9 5.7 3.4 1.5 2.9 1.5 1.2 1.8 2.6 1.5 1.0 1.4
Commuting 30.0 11.1 36.6 38.1 25.5 6.4 20.5 41.7 10.6 43.0 47.4 26.9 12.4 24.3
Other 66.1 86.9 59.5 56.2 71.1 92.0 76.6 56.8 88.2 55.2 50.0 71.5 86.6 74.3

East Sussex Modified Permit Scheme – Cost Benefit Analysis
© East Sussex County Council
Page 48 of 87
5.5 SITE SPECIFIC QUADRO INPUT DATA
5.5.1 Sample Site Data The 175 sites shown on Tables 16 to 33 showed a good spread of data over the ESPS network.
For each site, data files were created and works were run for the site lengths carried out with the Halcrow Study 10, 30, 50, 100 and 200 metres.
In total 875 outputs were created and are provided in Appendix A. The Daily Cost of all sites was averaged for Rural and Urban roads by RC and excavation length and is shown on Table 57 and 58 below.
The number of samples used for the CBA is required to be proportioned to the actual number of works and statistically confident in the data.
The number of samples used for each work type are shown on Table 58 below with the percentages matching the proportions of actual works shown in Table 10. This has been statistically verified at a 95% confidence level with a confidence interval of 5%. A confidence interval within +/- 5% is considered to be reliable.
The samples used for the CBA were selected by separating the sites into the two types RC 0-2 and 3-4 and ranking the sites by impact and making the average cost of sites selected close to the mean. The sample sites were also proportioned by excavation length so that the percentages match the Halcrow study and are shown on Table 59 below.
The sample sites average duration for each work type was matched to the Halcrow Study as shown in Table 11. For example, for Major Works the average duration was 33 days, duration were run between 41 and 23 days and compares to values in the Halcrow Study. High and Low cost forecasts were derived, for High the highest duration of days was applied to the highest ranking site by impact, for Low the highest duration of days was applied to the lowest ranking site by impact. The average of the two forecasts was used to obtain the Total Delay of Works. Summarised impacts are provided in Appendix B.
Table 57 ESPS Delay Modelling Daily Cost of Rural Works
East Sussex Daily Cost of Rural Street Works (£) by Reinstatement Category and Length Reinstatement Category
Typical AADT
Average AADT 10m 30m 50m 100m 200m
0 <32,000 35,795 981,160 981,225 1,001,092 1,026,579 68,323 1 16,000 19,864 286,082 285,953 350,868 435,044 508,914 2 12,000 11,955 2,562 2,562 4,403 9,603 19,267 3 8,000 7,840 1,311 1,318 55,689 4,152 7,695 4 4,000 2,959 452 467 25,913 1,474 47,951

East Sussex Modified Permit Scheme – Cost Benefit Analysis
© East Sussex County Council
Page 49 of 87
Table 58 ESPS Delay Modelling Daily Cost of Urban Works
East Sussex
Daily Cost of Urban Street Works (£) by Reinstatement Category and Length Reinstatement
Category Typical AADT
Average AADT
10m 30m 50m 100m 200m
0 40,000 N/A N/A N/A N/A N/A N/A 1 24,000 25,094 285,003 285,184 368,220 514,227 279,847 2 16,000 16,047 24,201 22,402 39,255 83,755 152,305 3 10,000 9,919 1,565 1,618 2,575 4,999 9,725 4 6,000 2,950 329 385 568 1,128 2,055
Table 59 ESPS Work Samples
East Sussex Street Work Samples
Work Type RC 0-2 RC 3-4 Sample Size % Sample Size %
Major 11 3% 13 3%
Standard 49 13% 33 9%
Minor with Exc 199 54% 190 52%
Minor without Exc 0 0% 0 0%
Urgent 107 29% 132 36%
Emergency 0 0% 0 0%
Totals 367 368
Table 60 ESPS Delay Modelling Percentage of Works by RC and Excavation Length
East Sussex
CBA Percentages of Works by RC and Excavation Length
RC 10m 30m 50m 100m 200m
Total Samples
RC 0-2
Sample Nos 311 3 19 15 19 367 Sample % 84.7% 0.8% 5.2% 4.1% 5.2% Halcrow Study % 84.7% 0.7% 5.2% 4.2% 5.2%
RC 3-4
Sample Nos 319 19 12 10 8 368 Sample % 86.7% 5.2% 3.3% 2.7% 2.2% Halcrow Study % 86.8% 5.2% 3.2% 2.6% 2.1%
5.6 MONETIZED COSTS AND BENEFITS The socio-economic benefits derived from a 5% and 10% Permit Scheme reduction are shown for the opening year in summary on Table 61.
The statutory guidance on reliability benefits achieved from a reduction in the variability in travel times for road users is provided by WebTAG Unit 3.5.7, which recommends a mark-up on travel time-savings for urban roads of between 10% to 20%.
Recent research from Transport for London (TfL) GPS data for inner and central London estimated an uplift figure of 22% for changes in the mean journey time (Modelling journey time variability to assist in designing a journey time variability performance indicator for the transport for London Road Network,

East Sussex Modified Permit Scheme – Cost Benefit Analysis
© East Sussex County Council
Page 50 of 87
Jonathan Turner 2008). This supports the use of the upper end value of 20% for this study and is included as a reliability adjustment in the monetized costs and benefits.
The User Benefits are proportioned between consumer and business users for Vehicle Operating Cost and Travel Time Cost.
The QUADRO rates demonstrate much higher incidents of accidents within road works. The introduction of the Permit Scheme will bring about a proportionate reduction in road works, which will lead to accident cost savings.

East Sussex Modified Permit Scheme – Cost Benefit Analysis
© East Sussex County Council
Page 51 of 87
Table 61 ESPS Monetized Costs and Benefits
East Sussex Sample Sites QUADRO Results Summary Delay Modelling Totals
Total Impact Consumer Vehicle
Operating Cost Consumer Travel Time
Cost High £1,488,791,106 £47,277,087 £784,999,862 Low £902,132,566 £28,507,973 £475,660,026 Average £1,195,461,836 £37,892,530 £630,329,944 Cost Saving 5% £59,773,092 £1,894,626 £31,516,497 Cost Saving 10% £119,546,184 £3,789,253 £63,032,994
Business Vehicle Operating Cost
Business Travel Time Total
PSP Bus & Coach Operating Cost
High £19,895,827 £621,369,314 £5,309,605 Low £12,021,630 £374,651,545 £3,287,576 Average £15,958,729 £498,010,430 £4,298,591 Cost Saving 5% £797,936 £24,900,521 £214,930 Cost Saving 10% £1,595,873 £49,801,043 £429,859 Total Business Accident Cost Carbon High £646,574,746 £7,962,297 £8,498,866 Low £389,960,752 £6,784,613 £5,148,493 Average £518,267,749 £7,373,455 £6,823,680 Cost Saving 5% £25,913,387 £368,673 £341,184 Cost Saving 10% £51,826,775 £737,345 £682,368

East Sussex Modified Permit Scheme – Cost Benefit Analysis
© East Sussex County Council
Page 52 of 87
6 OPERATION
6.1 INTRODUCTION This section assesses the process tasks required to establish and operate the ESPS. It will consist of the following sections:
• Fees Matrix, presentation of anticipated Permit applications by type • Scheme Costs, presentation of staff costs associated with the level of Permit variations
6.2 FEES MATRIX The fees matrix is a DfT prescribed format for presenting the volume and type of Permit applications and anticipated variations. The estimated number of Permits by type was provided by East Sussex and is shown on Table 62 below. The Fees Matrix is attached in Appendix C.
Table 62 Utility Permit Volume before Scheme opening
East Sussex Notice Volumes Work Type RC 0-2 RC 3-4 Total Volume Number % Number % Number % Major 257 3% 310 3% 567 3% Standard 1,126 13% 809 9% 1,935 11% Minor with Exc 4,553 54% 4,650 52% 9,203 53% Minor without Exc - 0% - 0% - 0% Urgent 2,457 29% 3,238 36% 5,695 33% Special Urgent - 0% - 0% - 0% Emergency - 0% - 0% - 0% Totals 8,393 48% 9,007 52% 17,400
The Utility Permit volumes by road categories are shown in Table 63 and Table 64 and with costings based upon statutory fee rates outlined in Table 8.

East Sussex Modified Permit Scheme – Cost Benefit Analysis
© East Sussex County Council
Page 53 of 87
Table 63 Permit Volume on Category 0-2 roads
Category 0-2 and Traffic Sensitive Streets Activity Type Estimated No.
of Permits Estimated
No. of Permit
Variations
Total Cost per Activity
Type
Activity Type
Cost per Permit
Provisional Advance Authorisation 550 290 N/A N/A 159,364 Major 257 258 86 45 70,144
Standard 1,126 102 220 45 124,381 Minor 4,553 53 149 45 248,410
Immediate 2,457 49 672 45 151,397 Sub Total 8,943 N/A 1,127 45 753,696
Table 64 Permit Volume on Category 3-4 roads
Category 3-4 Non-Traffic Sensitive Streets Activity Type Estimated No.
of Permits Estimated
No. of Permit
Variations
Total Cost per Activity
Type
Activity Type
Cost per Permit
Provisional Advance Authorisation 598 142 N/A N/A 85,100 Major 310 117 123 35 40,574
Standard 809 86 132 35 73,920 Minor 4,650 59 71 35 275,771
Immediate 3,238 105 467 35 357,026 Sub Total 9,605 N/A 793 35 832,391
Permit fees are excluded from Public Accounts reporting in line with the DfT guidance. The volume of Utility Permit by road type will fall by 5% across all road types.
6.3 SCHEME COSTS
6.3.1 Operational costs The Permit Scheme required three specific job roles:
• Street Works Officers; • Street Works Co-ordinators; and • Traffic Managers.
The overall staffing costs of the modified Permit Scheme operation are based on information from East Sussex and statutory rates and are outlined in Table 65.

East Sussex Modified Permit Scheme – Cost Benefit Analysis
© East Sussex County Council
Page 54 of 87
Table 65 Staff Costing
Staff Costing Personnel Type Annual Salary Final Hourly Rate Total Annual Cost
Street Works Officer £ 22,067
£ 42.98
£ 70,312.08
Street Works Coordinator
£ 28,400
£ 55.31
£ 90,490.92
Traffic Manager £ 61,905
£ 124.31
£ 203,364.12
National Insurance (%)
10
Pension (superannuation)
(%)
19
Working hours/annum
1636
Employee Overhead Rate
2.47
The breakdown of costing per task for each of the three grades of Permit Scheme workers is shown in Table 66 below.
Table 66 Breakdown of Employer Costing per Permit Task
Employee Costing per Permit Task Category 0-2 and Traffic Sensitive Streets
Street Works Officers PAA Major Standard Minor Immediate TOTAL
Hours per Permit 0.70 0.91 0.45 0.32 0.32 2.69 Total Permits 550.00 257.00 1126.00 4553.00 4553.00 8943.00 Total Hours 382.94 234.73 505.76 1477.83 1477.83 24099.89
No. of Posts Required 0.23 0.14 0.31 0.90 0.90 2.06 Employee Costs 16457.91 10088.09 21736.65 63514.16 63514.16 144690.28
Street Works Coordinators PAA Major Standard Minor Immediate TOTAL
Hours per Permit 1.71 1.69 0.62 0.40 0.40 4.81 Total Permits 550.00 257.00 1126.00 4553.00 4553.00 8943.00 Total Hours 942.33 433.47 693.43 1804.13 1804.13 43000.93
No. of Posts Required 0.58 0.26 0.42 1.10 1.10 2.96 Employee Costs 52122.62 23976.41 38355.11 99790.37 99790.37 268095.81
Traffic Managers PAA Major Standard Minor Immediate TOTAL
Hours per Permit 0.86 0.59 0.23 0.08 0.08 1.80 Total Permits 550.00 257.00 1126.00 4553.00 4553.00 8943.00 Total Hours 473.92 152.49 253.35 379.42 379.42 16067.59
No. of Posts Required 0.29 0.09 0.15 0.23 0.23 0.82 Employee Costs 58910.54 18954.96 31492.85 47163.65 47163.65 166702.64
Category 3-4 Non-Traffic Sensitive Streets Street Works Officers
PAA Major Standard Minor Immediate TOTAL Hours per Permit PAA Major Standard Minor Minor TOTAL
Total Permits 0.51 0.59 0.44 0.37 0.37 2.39 Total Hours 598.00 310.00 809.00 4650.00 4650.00 9605.00
No. of Posts Required 303.49 183.42 353.26 1699.19 1699.19 22948.75

East Sussex Modified Permit Scheme – Cost Benefit Analysis
© East Sussex County Council
Page 55 of 87
Employee Costs 0.19 0.11 0.22 1.04 1.04 2.52
Street Works Coordinators PAA Major Standard Minor Immediate TOTAL
Hours per Permit PAA Major Standard Minor Minor TOTAL Total Permits 0.75 0.84 0.60 0.44 0.44 3.40 Total Hours 598.00 310.00 809.00 4650.00 4650.00 9605.00
No. of Posts Required 450.74 258.98 488.43 2022.75 2022.75 32617.78 Employee Costs 0.28 0.16 0.30 1.24 1.24 3.49
Traffic Managers PAA Major Standard Minor Immediate TOTAL
Hours per Permit PAA Major Standard Minor Minor TOTAL Total Permits 0.41 0.18 0.13 0.06 0.06 0.94 Total Hours 598.00 310.00 809.00 4650.00 4650.00 9605.00
No. of Posts Required 242.19 54.77 106.52 271.25 271.25 9012.69 Employee Costs 0.15 0.03 0.07 0.17 0.17 0.74
The overall costs associated with the operation of the Permit Scheme are summarised in Table 67 below.

East Sussex Modified Permit Scheme – Cost Benefit Analysis
© East Sussex County Council
Page 56 of 87
Table 67 Staff costing summary
Total Number of Employees and Costs Personnel Type No. Salaries Street Works Officers 3.94 £321,738 Street Works Coordinators 6.33 £583,801
Traffic Managers 1.53 £317,658 TOTAL 11.80 £1,223,198
With the addition of a provision for the cost of Permit variations, the final Permit Scheme cost is shown in Table 68.
Table 68 Permit Scheme costing summary
Permit Scheme Cost Breakdown Cost Type Cost Permit Application Employee Costs £1,223,198 Permit Application Operational Factor Costs £305,799
Total Permit Application Costs £1,528,997
Permit Variation Employee Costs £58,853 Permit Variation Operational Factor Costs £19,618
Total Permit Variation Application Costs £78,470
TOTAL PERMIT SCHEME COSTS £1,607,467
7 FINANCIAL CALCULATIONS
7.1 INTRODUCTION This section will present the calculation of financial benefits for the statutory outputs:
• Public Accounts - Local Government Funding • Public Accounts - Central Government Funding • Transport Economic Efficiency • Monetized Costs and Benefits
The calculations will be presented for the opening year and for the 25-year Scheme horizon, and will be discounted where required.
7.2 PUBLIC ACCOUNTS - LOCAL GOVERNMENT FUNDING The Local Government public account reporting has the following categories:
• Revenue • For the purposes of this Cost Benefit Analysis, the Permit fee income is calculated by the
multiplication of the estimated Permit fee volume and the average Permit fee, which is derived using the maximum Permit fee structure as shown on Table 8.
The full cost of the Scheme in the opening year is comprised of any set-up costs and the Scheme operating costs summarized in Tables 69 and 75. The average cost-recovery price of Permits is
East Sussex Modified Permit Scheme – Cost Benefit Analysis
© East Sussex County Council
Page 57 of 87
generated by dividing the total cost in the opening year by the estimated number of Permit volumes at the start of the year.
The number of Permits in the opening month is a monthly pro-rata value based upon the estimated number of Permits in the opening year along with the 20% uplift for phased works.
The modified Permit Scheme is scheduled to become fully operational in the opening month of the opening year of the assessment and from the second and subsequent months, the 5% reduction in Permit volume will come into effect.
• Operating costs • Error! Reference source not found. • Developer and other contributions • Grant / subsidy payments
7.2.1 Revenue For the purposes of this Cost Benefit Analysis, the Permit fee income is calculated by the multiplication of the estimated Permit fee volume and the average Permit fee, which is derived using the maximum Permit fee structure as shown on Table 8.
The full cost of the Scheme in the opening year is comprised of any set-up costs and the Scheme operating costs summarized in Tables 69 and 75. The average cost-recovery price of Permits is generated by dividing the total cost in the opening year by the estimated number of Permit volumes at the start of the year.
The number of Permits in the opening month is a monthly pro-rata value based upon the estimated number of Permits in the opening year along with the 20% uplift for phased works.
The modified Permit Scheme is scheduled to become fully operational in the opening month of the opening year of the assessment and from the second and subsequent months, the 5% reduction in Permit volume will come into effect.
7.2.2 Operating costs The operating costs for the Scheme are comprised of:
• Staff and operation costs; • Asset maintenance costs; and • Unrecoverable fees
No provision has been made for on-going asset maintenance of the Permit Scheme.
The Operational Costs of £136,510 (5%) and £133,397 (10%) in the first month are a pro-rata apportionment of the opening year total of £1,623,978 (5%) and £1,572,478 (10%) contained within Tables 70 and 76.
It has been assumed (Table 7 Model Variable specification) that half of the percentage reduction in Permit volume would be applied to the Scheme costs giving a 2.5% reduction. The full reduction is applied for costs starting in the second year, with a pro-rata increase throughout the opening year.
Non recoverable costs for Highway permits for the Council’s on schemes has been included as an administration charge and is carried out by a Highway Administrative Officer based on approximately 5 minute extra administrative time for each work requiring a permit:
Salary - £18,500 per annum and 1,628 hours worked per year.
With pensions and overheads etc this equates to £22 per hour.
£22 / 60mins x 5mins = £1.83 of cost per Permit Application.

East Sussex Modified Permit Scheme – Cost Benefit Analysis
© East Sussex County Council
Page 58 of 87
Financial calculations for year 2 to 25 are shown on Table 71 to 74 (5% saving) and 77 to 80 (10% saving).

East Sussex Modified Permit Scheme – Cost Benefit Analysis
© East Sussex County Council
Page 59 of 87
Table 69 Financial Calculations 5% Reduction in Works Annual Cost
East Sussex Financial Calculations 5% Reduction in Street Works Opening Closing Values
Annual Cost of Permit Scheme - Closing Values
Year-0 Year-1 Year-2 Year-3 Year-4 Year-5 Year-6 Year-7 Year-8 Year-9 Year-10
Reduction Factor less Permit flex
2.5% 2.5% 2.5% 2.5% 2.5% 2.5% 2.5% 2.5% 2.5% 2.5% Permit Costs 1,607,467 1,567,281 1,567,281 1,567,28
1 1,567,281 1,567,28
1 1,567,28
1 1,567,28
1 1,567,28
1 1,567,28
1 1,567,28
1 Annual Cost For Recovery
1,589,973 1,567,281 1,567,28
1 1,567,281 1,567,28
1 1,567,28
1 1,567,28
1 1,567,28
1 1,567,28
1 1,567,28
1 Cost Recovery Price Permit fee income
1,566,238 1,594,189 1,567,28
1 1,567,281 1,567,28
1 1,567,28
1 1,567,28
1 1,567,28
1 1,567,28
1 1,567,28
1 Cost Recovery Price Permit fee income
(prior year data)
88 92 87 89 89 89 89 89 89 89
(Over) / under-recovery £
23,735 - 26,909
- - - - - - - -
(Over) / under-recovery £ (prior year) - 23,735 - 26,909
- - - - - - - -
Annual Cost Highway permits (non recoverable)
34,005 34,005 32,304 32,304 32,304 32,304 32,304 32,304 32,304 32,304 32,304
Annual Income Max Permit Fee 1,278,440 1,249,142 1,246,479 1,246,479
1,246,479 1,246,479
1,246,479
1,246,479
1,246,479
1,246,479
1,246,479
Overall Scheme Cost 1,641,472 1,625,020 1,540,372 1,567,281
1,567,281 1,567,281
1,567,281
1,567,281
1,567,281
1,567,281
1,567,281
Profit/Loss - 363,032
- 375,878
- 293,893
- 320,802
- 320,802
- 320,802
- 320,802
- 320,802
- 320,802
- 320,802
- 320,802

East Sussex Modified Permit Scheme – Cost Benefit Analysis
© East Sussex County Council
Page 60 of 87
Table 70 Financial Calculations 5% Reduction in Works First Year Cost
Financial Calculations 5% Reduction in Street Works
Year Year-1
Annual Cost of Permit Scheme - Closing Values
Month Month-1
Month-2
Month-3
Month-4
Month-5
Month-6
Month-7
Month-8
Month-9
Month-10
Month-11
Month-12
Permit Cost 133,956
133,677
133,421
133,186
132,971
132,774
132,594
132,428
132,276
132,137
132,010 131,893 130,607
Permit Volumes - 1,546 1,468 1,468 1,468 1,468 1,468 1,468 1,468 1,468 1,468 1,468 1,468 Cost Recovery Price Permit fee income - 88.50 88.50 88.50 88.50 88.50 88.50 88.50 88.50 88.50 88.50 88.50 88.50
Multiplied by number of Permits - 136,789
129,950
129,950
129,950
129,950
129,950
129,950
129,950
129,950
129,950 129,950 129,950
Income derived on Cost recovery basis - 136,789
129,950
129,950
129,950
129,950
129,950
129,950
129,950
129,950
129,950 129,950 129,950
Cost Highway permits (non recoverable) 2,834 2,834 2,834 2,834 2,834 2,834 2,834 2,834 2,834 2,834 2,834 2,834 2,834 Income derived from Max Permit Fee 106,53
7 106,53
7 103,87
3 103,87
3 103,87
3 103,87
3 103,87
3 103,87
3 103,87
3 103,87
3 103,873 103,873 103,873
Permit Scheme - Operational Costs
-136,51
0
-136,25
4
-136,02
0
-135,80
5
-135,60
8
-135,42
7
-135,26
2
-135,11
0
-134,97
1
-134,843
-134,726
-133,440

East Sussex Modified Permit Scheme – Cost Benefit Analysis
© East Sussex County Council
Page 61 of 87
Table 71 Financial Calculations 5% Reduction in Works Second Year Cost
Financial Calculations 5% Reduction in Street Works
Year Year-2
Annual Cost of Permit Scheme - Closing Values
Month Month-1
Month-2
Month-3
Month-4
Month-5
Month-6
Month-7
Month-8
Month-9
Month-10
Month-11
Month-12
Permit Cost - 130,607
130,607
130,607
130,607
130,607
130,607
130,607
130,607
130,607
130,607 130,607 130,607
Permit Volumes - 1,468 1,468 1,468 1,468 1,468 1,468 1,468 1,468 1,468 1,468 1,468 1,468 Cost Recovery Price Permit fee income - 91.82 91.82 91.82 91.82 91.82 91.82 91.82 91.82 91.82 91.82 91.82 91.82
Multiplied by number of Permits - 134,827
134,827
134,827
134,827
134,827
134,827
134,827
134,827
134,827
134,827 134,827 134,827
Income derived on Cost recovery basis - 134,827
134,827
134,827
134,827
134,827
134,827
134,827
134,827
134,827
134,827 134,827 134,827
Cost Highway permits (non recoverable) 2,834 2,834 2,834 2,834 2,834 2,834 2,834 2,834 2,834 2,834 2,834 2,834 2,834 Income derived from Max Permit Fee 103,87
3 103,87
3 103,87
3 103,87
3 103,87
3 103,87
3 103,87
3 103,87
3 103,87
3 103,87
3 103,873 103,873 103,873
Permit Scheme - Operational Costs - -133,44
0
-133,44
0
-133,44
0
-133,44
0
-133,44
0
-133,44
0
-133,44
0
-133,44
0
-133,44
0
-133,440
-133,440
-133,440

East Sussex Modified Permit Scheme – Cost Benefit Analysis
© East Sussex County Council
Page 62 of 87
Table 72 Financial Calculations 5% Reduction in Works Third Year Cost
Financial Calculations 5% Reduction in Street Works Year Year-3 Annual Cost of Permit Scheme - Closing Values Month Month-1 Month-2
Month-3 Month-4
Month-5
Month-6
Month-7
Month-8
Month-9
Month-10
Month-11
Month-12
Permit Cost -
130,607
130,607
130,607
130,607
130,607
130,607
130,607
130,607
130,607
130,607
130,607
130,607
Permit Volumes -
1,468
1,468
1,468
1,468
1,468
1,468
1,468
1,468
1,468
1,468
1,468
1,468
Cost Recovery Price Permit fee income
-
87.42
87.42
87.42
87.42
87.42
87.42
87.42
87.42
87.42
87.42
87.42
87.42
Multiplied by number of Permits -
128,364
128,364
128,364
128,364
128,364
128,364
128,364
128,364
128,364
128,364
128,364
128,364
Income derived on Cost recovery basis
-
128,364
128,364
128,364
128,364
128,364
128,364
128,364
128,364
128,364
128,364
128,364
128,364
Cost Highway permits (non recoverable)
2,834
2,834
2,834
2,834
2,834
2,834
2,834
2,834
2,834
2,834
2,834
2,834
2,834
Income derived from Max Permit Fee
-
103,873
103,873
103,873
103,873
103,873
103,873
103,873
103,873
103,873
103,873
103,873
103,873
Permit Scheme - Operational Costs
- -133,440 -133,440
-133,440 -133,440
-133,440
-133,440
-133,440
-133,440
-133,440
-133,440
-133,44
0
-133,4
40
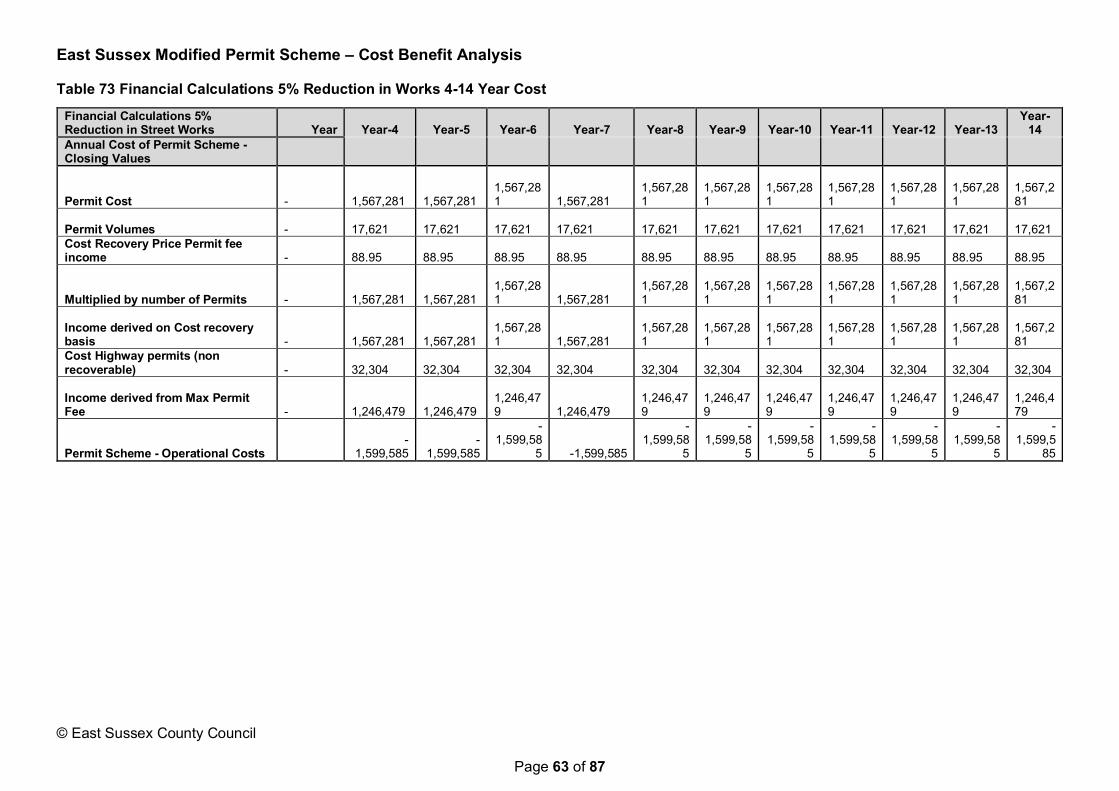
East Sussex Modified Permit Scheme – Cost Benefit Analysis
© East Sussex County Council
Page 63 of 87
Table 73 Financial Calculations 5% Reduction in Works 4-14 Year Cost
Financial Calculations 5% Reduction in Street Works Year Year-4 Year-5 Year-6 Year-7 Year-8 Year-9 Year-10 Year-11 Year-12 Year-13
Year-14
Annual Cost of Permit Scheme - Closing Values
Permit Cost -
1,567,281
1,567,281
1,567,281
1,567,281
1,567,281
1,567,281
1,567,281
1,567,281
1,567,281
1,567,281
1,567,281
Permit Volumes -
17,621
17,621
17,621
17,621
17,621
17,621
17,621
17,621
17,621
17,621
17,621
Cost Recovery Price Permit fee income
-
88.95
88.95
88.95
88.95
88.95
88.95
88.95
88.95
88.95
88.95
88.95
Multiplied by number of Permits -
1,567,281
1,567,281
1,567,281
1,567,281
1,567,281
1,567,281
1,567,281
1,567,281
1,567,281
1,567,281
1,567,281
Income derived on Cost recovery basis
-
1,567,281
1,567,281
1,567,281
1,567,281
1,567,281
1,567,281
1,567,281
1,567,281
1,567,281
1,567,281
1,567,281
Cost Highway permits (non recoverable)
-
32,304
32,304
32,304
32,304
32,304
32,304
32,304
32,304
32,304
32,304
32,304
Income derived from Max Permit Fee
-
1,246,479
1,246,479
1,246,479
1,246,479
1,246,479
1,246,479
1,246,479
1,246,479
1,246,479
1,246,479
1,246,479
Permit Scheme - Operational Costs -
1,599,585 -
1,599,585
-1,599,58
5 -1,599,585
-1,599,58
5
-1,599,58
5
-1,599,58
5
-1,599,58
5
-1,599,58
5
-1,599,58
5
-1,599,5
85

East Sussex Modified Permit Scheme – Cost Benefit Analysis
© East Sussex County Council
Page 64 of 87
Table 74 Financial Calculations 5% Reduction in Works 15-25 Year Cost
Financial Calculations 5% Reduction in Street Works
Year
Year-15 Year-16 Year-17 Year-18 Year-19 Year-20 Year-21 Year-22 Year-23 Year-24 Year-25
Annual Cost of Permit Scheme - Closing Values
Permit Cost - 1,567,281
1,567,281
1,567,281
1,567,281
1,567,281
1,567,281
1,567,281
1,567,281
1,567,281
1,567,281
1,567,281
Permit Volumes
17,621 17,621 17,621 17,621 17,621 17,621 17,621 17,621 17,621 17,621 17,621
Cost Recovery Price Permit fee income
88.95 88.95 88.95 88.95 88.95 88.95 88.95 88.95 88.95 88.95 88.95 Multiplied by number of Permits
1,567,28
1 1,567,28
1 1,567,28
1 1,567,28
1 1,567,28
1 1,567,28
1 1,567,28
1 1,567,28
1 1,567,28
1 1,567,28
1 1,567,28
1 Income derived on Cost recovery basis
1,567,28
1 1,567,28
1 1,567,28
1 1,567,28
1 1,567,28
1 1,567,28
1 1,567,28
1 1,567,28
1 1,567,28
1 1,567,28
1 1,567,28
1 Cost Highway permits (non recoverable)
32,304 32,304 32,304 32,304 32,304 32,304 32,304 32,304 32,304 32,304 32,304
Income derived from Max Permit Fee
1,246,479
1,246,479
1,246,479
1,246,479
1,246,479
1,246,479
1,246,479
1,246,479
1,246,479
1,246,479
1,246,479
Permit Scheme - Operational Costs
-1,599,58
5
-1,599,58
5
-1,599,58
5
-1,599,58
5
-1,599,58
5
-1,599,58
5
-1,599,58
5
-1,599,58
5
-1,599,58
5
-1,599,58
5
-1,599,58
5

East Sussex Modified Permit Scheme – Cost Benefit Analysis
© East Sussex County Council
Page 65 of 87
Table 75 Financial Calculations 10% Reduction in Works Annual Cost
East Sussex Financial Calculations 10% Reduction in Street Works Opening Closing Values
Annual Cost of Permit Scheme - Closing Values
Year-0 Year-1 Year-2 Year-3 Year-4 Year-5 Year-6 Year-7 Year-8 Year-9 Year-10
Reduction Factor less Permit flex
5.0% 5.0% 5.0% 5.0% 5.0% 5.0% 5.0% 5.0% 5.0% 5.0% Permit Costs 1,607,467 1,527,094 1,527,094 1,527,09
4 1,527,094 1,527,09
4 1,527,09
4 1,527,09
4 1,527,09
4 1,527,09
4 1,527,09
4 Annual Cost For Recovery - 1,572,478 1,527,094 1,527,09
4 1,527,094 1,527,09
4 1,527,09
4 1,527,09
4 1,527,09
4 1,527,09
4 1,527,09
4 Cost Recovery Price Permit fee income - 1,491,004 1,546,029 1,527,09
4 1,527,094 1,527,09
4 1,527,09
4 1,527,09
4 1,527,09
4 1,527,09
4 1,527,09
4 Cost Recovery Price Permit fee income
(prior year data) - 88 97 90 91 91 91 91 91 91 91
(Over) / under-recovery £ - 81,475 - 18,935
- - - - - - - -
(Over) / under-recovery £ (prior year) - 81,475 - 18,935
- - - - - - - -
Annual Cost Highway permits (non recoverable)
34,005 34,005 30,604 30,604 30,604 30,604 30,604 30,604 30,604 30,604 30,604
Annual Income Max Permit Fee 1,278,440 1,219,845 1,214,518 1,214,518
1,214,518 1,214,518
1,214,518
1,214,518
1,214,518
1,214,518
1,214,518
Overall Scheme Cost 1,641,472 1,642,573 1,508,159 1,527,094
1,527,094 1,527,094
1,527,094
1,527,094
1,527,094
1,527,094
1,527,094
Profit/Loss - 363,032
- 422,729
- 293,641
- 312,576
- 312,576
- 312,576
- 312,576
- 312,576
- 312,576
- 312,576
- 312,576

East Sussex Modified Permit Scheme – Cost Benefit Analysis
© East Sussex County Council
Page 66 of 87
Table 76 Financial Calculations 10% Reduction in Works First Year Cost
Financial Calculations 10% Reduction in Street Works
Year Year-1
Annual Cost of Permit Scheme - Closing Values
Month
Month-1 Month-2 Month-3
Month-4 Month-5
Month-6
Month-7
Month-8
Month-9
Month-10
Month-11
Month-12
Permit Cost 133,956
133,397 132,886 132,417 131,987 131,593 131,232 130,900 130,597 130,319 130,064 129,830
127,258
Permit Volumes - 1,546 1,391 1,391 1,391 1,391 1,391 1,391 1,391 1,391 1,391 1,391 1,391 Cost Recovery Price Permit fee
income - 88.50 88.50 88.50 88.50 88.50 88.50 88.50 88.50 88.50 88.50 88.50 88.50
Multiplied by number of Permits - 136,789 123,110 123,110 123,110 123,110 123,110 123,110 123,110 123,110 123,110 123,110
123,110
Income derived on Cost recovery basis
- 136,789 123,110 123,110 123,110 123,110 123,110 123,110 123,110 123,110 123,110 123,110
123,110
Cost Highway permits (non recoverable)
2,834
2,834 2,834 2,834 2,834 2,834 2,834 2,834 2,834 2,834 2,834 2,834 2,834
Income derived from Max Permit Fee
106,537
106,537 101,210 101,210 101,210 101,210 101,210 101,210 101,210 101,210 101,210 101,210
101,210
Permit Scheme - Operational Costs - - 133,397
- 132,886
- 132,417
- 131,987
- 131,593
- 131,232
- 130,900
- 130,597
- 130,319
- 130,064
- 129,83
0
- 127,2
58

East Sussex Modified Permit Scheme – Cost Benefit Analysis
© East Sussex County Council
Page 67 of 87
Table 77 Financial Calculations 10% Reduction in Works Second Year Cost
Financial Calculations 10% Reduction in Street Works
Year
Year-2
Annual Cost of Permit Scheme - Closing Values
Month
Month-1 Month-2 Month-3
Month-4 Month-5
Month-6
Month-7
Month-8
Month-9
Month-10
Month-11
Month-12
Permit Cost - 127,258 127,258 127,258 127,258 127,258 127,258 127,258 127,258 127,258 127,258 127,258
127,258
Permit Volumes - 1,391 1,391 1,391 1,391 1,391 1,391 1,391 1,391 1,391 1,391 1,391 1,391 Cost Recovery Price Permit fee
income - 97.50 97.50 97.50 97.50 97.50 97.50 97.50 97.50 97.50 97.50 97.50 97.50
Multiplied by number of Permits - 135,625 135,625 135,625 135,625 135,625 135,625 135,625 135,625 135,625 135,625 135,625
135,625
Income derived on Cost recovery basis
- 135,625 135,625 135,625 135,625 135,625 135,625 135,625 135,625 135,625 135,625 135,625
135,625
Cost Highway permits (non recoverable)
2,834
2,834 2,834 2,834 2,834 2,834 2,834 2,834 2,834 2,834 2,834 2,834 2,834
Income derived from Max Permit Fee
- 101,210 101,210 101,210 101,210 101,210 101,210 101,210 101,210 101,210 101,210 101,210
101,210
Permit Scheme - Operational Costs - - 127,258
- 127,258
- 127,258
- 127,258
- 127,258
- 127,258
- 127,258
- 127,258
- 127,258
- 127,258
- 127,25
8
- 127,2
58

East Sussex Modified Permit Scheme – Cost Benefit Analysis
© East Sussex County Council
Page 68 of 87
Table 78 Financial Calculations 10% Reduction in Works Third Year Cost
Financial Calculations 10% Reduction in Street Works Year Year-3 Annual Cost of Permit Scheme - Closing Values Month Month-1 Month-2
Month-3 Month-4
Month-5
Month-6
Month-7
Month-8
Month-9
Month-10
Month-11
Month-12
Permit Cost -
127,258
127,258
127,258
127,258
127,258
127,258
127,258
127,258
127,258
127,258
127,258
127,258
Permit Volumes -
1,391
1,391
1,391
1,391
1,391
1,391
1,391
1,391
1,391
1,391
1,391
1,391
Cost Recovery Price Permit fee income
-
90.35
90.35
90.35
90.35
90.35
90.35
90.35
90.35
90.35
90.35
90.35
90.35
Multiplied by number of Permits -
125,680
125,680
125,680
125,680
125,680
125,680
125,680
125,680
125,680
125,680
125,680
125,680
Income derived on Cost recovery basis
-
125,680
125,680
125,680
125,680
125,680
125,680
125,680
125,680
125,680
125,680
125,680
125,680
Cost Highway permits (non recoverable)
2,834
2,834
2,834
2,834
2,834
2,834
2,834
2,834
2,834
2,834
2,834
2,834
2,834
Income derived from Max Permit Fee
-
101,210
101,210
101,210
101,210
101,210
101,210
101,210
101,210
101,210
101,210
101,210
101,210
Permit Scheme - Operational Costs
-
- 127,258
- 127,258
- 127,258
- 127,258
- 127,258
- 127,258
- 127,258
- 127,258
- 127,258
- 127,258
- 127,258
- 127,258

East Sussex Modified Permit Scheme – Cost Benefit Analysis
© East Sussex County Council
Page 69 of 87
Table 79 Financial Calculations 10% Reduction in Works 4-14 Year Cost
Financial Calculations 10% Reduction in Street Works
Year
Year-4 Year-5 Year-6 Year-7 Year-8 Year-9 Year-10 Year-11 Year-12 Year-13 Year-14
Annual Cost of Permit Scheme - Closing Values
Permit Cost - 1,527,094 1,527,094 1,527,094
1,527,094 1,527,094
1,527,094
1,527,094
1,527,094
1,527,094
1,527,094
1,527,094
Permit Volumes - 16,693 16,693 16,693 16,693 16,693 16,693 16,693 16,693 16,693 16,693 16,693 Cost Recovery Price Permit fee income - 91.48 91.48 91.48 91.48 91.48 91.48 91.48 91.48 91.48 91.48 91.48
Multiplied by number of Permits - 1,527,094 1,527,094 1,527,094
1,527,094 1,527,094
1,527,094
1,527,094
1,527,094
1,527,094
1,527,094
1,527,094
Income derived on Cost recovery basis - 1,527,094 1,527,094 1,527,094
1,527,094 1,527,094
1,527,094
1,527,094
1,527,094
1,527,094
1,527,094
1,527,094
Cost Highway permits (non recoverable)
- 30,604 30,604 30,604 30,604 30,604 30,604 30,604 30,604 30,604 30,604 30,604
Income derived from Max Permit Fee - 1,214,518 1,214,518 1,214,518
1,214,518 1,214,518
1,214,518
1,214,518
1,214,518
1,214,518
1,214,518
1,214,518
Permit Scheme - Operational Costs - - 1,527,094
- 1,527,094
- 1,527,09
4
- 1,527,094
- 1,527,09
4
- 1,527,09
4
- 1,527,09
4
- 1,527,09
4
- 1,527,09
4
- 1,527,09
4
-1,527,0
94

East Sussex Modified Permit Scheme – Cost Benefit Analysis
© East Sussex County Council
Page 70 of 87
Table 80 Financial Calculations 10% Reduction in Works 5-25 Year Cost
Financial Calculations 10% Reduction in Street Works
Year
Year-15 Year-16 Year-17 Year-18 Year-19 Year-20 Year-21 Year-22 Year-23 Year-24 Year-25
Annual Cost of Permit Scheme - Closing Values
Permit Cost - 1,527,094 1,527,094 1,527,094
1,527,094 1,527,094
1,527,094
1,527,094
1,527,094
1,527,094
1,527,094
1,527,094
Permit Volumes - 16,693 16,693 16,693 16,693 16,693 16,693 16,693 16,693 16,693 16,693 16,693 Cost Recovery Price Permit fee income - 91 91 91 91 91 91 91 91 91 91 91
Multiplied by number of Permits - 1,527,094 1,527,094 1,527,094
1,527,094 1,527,094
1,527,094
1,527,094
1,527,094
1,527,094
1,527,094
1,527,094
Income derived on Cost recovery basis - 1,527,094 1,527,094 1,527,094
1,527,094 1,527,094
1,527,094
1,527,094
1,527,094
1,527,094
1,527,094
1,527,094
Cost Highway permits (non recoverable)
- 30,604 30,604 30,604 30,604 30,604 30,604 30,604 30,604 30,604 30,604 30,604
Income derived from Max Permit Fee - 1,214,518 1,214,518 1,214,518
1,214,518 1,214,518
1,214,518
1,214,518
1,214,518
1,214,518
1,214,518
1,214,518
Permit Scheme - Operational Costs - - 1,527,094
- 1,527,094
- 1,527,09
4
- 1,527,094
- 1,527,09
4
- 1,527,09
4
- 1,527,09
4
- 1,527,09
4
- 1,527,09
4
- 1,527,09
4
-1,527,0
94

East Sussex Modified Permit Scheme – Cost Benefit Analysis
© East Sussex County Council
Page 71 of 87
7.2.3 Developer and other contributions There are no developer or other contributions in the Local Government Public accounts reporting.
7.2.4 Grant / subsidy payments There are no grant or subsidy payments in the Local Government Public accounts reporting.
7.3 PUBLIC ACCOUNTS - CENTRAL GOVERNMENT FUNDING The Central Government public account reporting has the following categories:
• Revenue • Operating costs • Investment costs • Developer and other contributions • Grant / subsidy payments • Indirect tax revenues
7.3.1 Revenue There is no revenue in the Central Government Public accounts reporting.
7.3.2 Operating costs There are no operating costs in the Central Government Public accounts reporting.
7.3.3 Investment costs There are no investment costs in the Central Government Public accounts reporting.
7.3.4 Developer and other contributions There are no developer or other contributions in the Central Government Public accounts reporting.
7.3.5 Grant / subsidy payments There are no developer or other contributions in the Central Government Public accounts reporting.
7.3.6 Indirect tax revenues The indirect tax revenue calculation is based upon the loss of fuel taxation revenues to Central Government from the more efficient functioning of the highway network from the reduction in road works.
7.4 TRANSPORT ECONOMIC EFFICIENCY The Transport Economic Efficiency (TEE) table reports on user benefits by consumer and business sections for time, fuel and non-fuel vehicle operating impacts.
7.4.1 Consumer User Benefits The consumer user benefit consists of private car and bus travel time, and vehicle operating costs.
7.4.2 Business User Benefits The business user benefits are for commercial car travel and private sector providers for Travel time and vehicle operating costs.

East Sussex Modified Permit Scheme – Cost Benefit Analysis
© East Sussex County Council
Page 72 of 87
8 STATUTORY OUTPUTS
8.1 INTRODUCTION This section presents the statutory outputs required for the modified ESPS Cost Benefit analysis.
The results are presented in the opening year and over the 25-year horizon in 2010 prices as advised in WebTAG.
The discounted totals are presented at the bottom of each table. The calculation basis of each category has been presented in Sections 5, 6 and 7.
The statutory outputs consist of three categories:
8.2 TRANSPORT ECONOMIC EFFICIENCY (TEE) The TEE table presents the net user benefits of travel time, fuel and non-fuel vehicle operating costs disaggregated by trip purpose between non-business consumers and business users, including transport operators and are below on Tables 70 to 73.
8.3 PUBLIC ACCOUNTS The Public Accounts tables show the net impact to Local and Central Government and are below on Tables 74 to 77.
8.4 COST BENEFIT ANALYSIS The items for inclusion in the central case Cost Benefit Analysis BCR and NPV are based upon the guidance specified in Annex C of TMA 2004 Decision-making and development (2nd edition) which specifies:
• Permit Fees are excluded from the Public Accounts table; • Indirect Taxation is excluded from the Public Accounts table; and • Permit Fees are not treated as a dis-benefit to business.
Revenue received from Permit Fees has been assumed to be reinvested in the authority and therefore offset in the economic appraisal as a capital cost.
Tables 78 to 81 are below.
8.5 STATUTORY COST BENEFIT ANALYSIS The study has addressed all aspects of the implementation of the modified ESPS through both the direct financial and socio-economic criteria to quantify the overall economic merit of the Scheme.
The Scheme has a Benefit Cost Ratio of and Net Present Value of in current prices (2010 prices). The appraisal results demonstrate that the introduction of the Permit Scheme will have a net positive economic benefit.

East Sussex Modified Permit Scheme – Cost Benefit Analysis
© East Sussex County Council
Page 73 of 87
Table 81 TEE Table 5% Work Saving Year 1
Transport Economic Efficiency (TEE) Table (5% Work Saving) Year 1
Consumers ALL MODES ROAD Bus & Coach RAIL Other
User benefits TOTAL Private Cars and LGVs Passengers Passengers Travel time 31,516,497 28,924,461 2,592,036 - - Vehicle operating costs 1,894,626 1,894,626 - User charges - - - - - During Construction & Maintenance - - - - - NET CONSUMER BENEFITS 33,411,124 -1 30,819,088 2,592,036 - - Business
User benefits Goods Vehicles
Business Cars & LGVs
Passengers Freight Passengers
Travel time 24,900,521 9,800,342 13,551,065 1,549,114 - - - Vehicle operating costs 797,936 560,743 237,193 - User charges - - - - - - - During Construction & Maintenance - - - - - - - Subtotal 25,698,458 -2 10,361,085 13,788,259 1,549,114 - - - Private sector provider impacts Freight Passengers Revenue - - - - -
Operating costs 214,930
214,930 - - -
Investment costs - - - - - Grant/subsidy - - - - - Subtotal 214,930 -3 214,930 - - Other business impacts Developer contributions - -4 - - - - -
NET BUSINESS IMPACT 25,913,387 (5) = (2) + (3) + (4)
TOTAL Present Value of Transport Economic Efficiency Benefits 59,324,511 (6) = (1)
+ (5)
Notes: Benefits appear as positive numbers, while costs appear as negative numbers. All entries are discounted present values, in 2010 prices and values. All values £s.

East Sussex Modified Permit Scheme – Cost Benefit Analysis
© East Sussex County Council
Page 74 of 87
Table 82 TEE Table 10% Work Saving Year 1
Transport Economic Efficiency (TEE) Table (10% Work Saving) Year 1 Consumers ALL MODES ROAD Bus & Coach RAIL Other User benefits TOTAL Private Cars and LGVs Passengers Passengers Travel time 63,032,994 57,848,923 5,184,072 - - Vehicle operating costs 1,121,486 1,121,486 - User charges - - - - - During Construction & Maintenance - - - - - NET CONSUMER BENEFITS 64,154,480 -1 58,970,409 5,184,072 - - Business
User benefits Goods Vehicles
Business Cars & LGVs Passengers Freight Passengers
Travel time 49,801,043 19,600,684 27,102,130 3,098,229 - - - Vehicle operating costs 1,595,873 1,121,486 474,387 - User charges - - - - - - - During Construction & Maintenance - - - - - - - Subtotal 51,396,916 -2 20,722,170 27,576,517 3,098,229 - - - Private sector provider impacts Freight Passengers Revenue - - - - - Operating costs 429,859 429,859 - - - Investment costs - - - - - Grant/subsidy - - - - - Subtotal 429,859 -3 429,859 - - - Other business impacts Developer contributions - -4 - - - - -
NET BUSINESS IMPACT 51,826,775
(5) = (2) + (3) + (4)
TOTAL
Present Value of Transport Economic Efficiency Benefits 115,981,255
(6) = (1) + (5)
Notes: Benefits appear as positive numbers, while costs appear as negative numbers. All entries are discounted present values, in 2010 prices and values. All values in £s.

East Sussex Modified Permit Scheme – Cost Benefit Analysis
© East Sussex County Council
Page 75 of 87
Table 83 TEE Table 5% Work Saving 25 Years
Transport Economic Efficiency (TEE) Table (5% Work Saving) 25 Years Consumers ALL MODES ROAD Bus &
Coach RAIL Other User benefits TOTAL Private Cars and LGVs Passengers Passengers Travel time 787,912,430 723,111,533 64,800,897 - - Vehicle operating costs 47,365,662 47,365,662 - User charges - - - - - During Construction & Maintenance - - - - - NET CONSUMER BENEFITS 835,278,092 -1 770,477,195 64,800,897 - - Business
User benefits Goods Vehicles
Business Cars & LGVs
Passengers Freight Passengers
Travel time 622,513,037 245,008,550 338,776,628 38,727,859 - - - Vehicle operating costs 19,948,411 14,018,575 5,929,836 - User charges - - - - - - - During Construction & Maintenance - - - - - - - Subtotal 642,461,448 -2 259,027,125 344,706,464 38,727,859 - - - Freight Passengers Revenue - - - - - Operating costs 5,373,238 5,373,238 - - - Investment costs - - - - Grant/subsidy - - - - Subtotal 5,373,238 -3 5,373,238 - - - Developer contributions - -4 - - - - -
NET BUSINESS IMPACT 647,834,686 (5) = (2) + (3) + (4)
TOTAL Present Value of Transport Economic Efficiency Benefits 1,483,112,778 (6) = (1)
+ (5) Notes: Benefits appear as positive numbers, while costs appear as negative numbers. All entries are discounted present values, in 2010 prices and values. All values in £s.

East Sussex Modified Permit Scheme – Cost Benefit Analysis
© East Sussex County Council
Page 76 of 87
Table 84 TEE Table 10% Work Saving 25 Years
Transport Economic Efficiency (TEE) Table (10% Work Saving) 25 Years Consumers ALL MODES ROAD Bus & Coach RAIL Other User benefits TOTAL Private Cars and LGVs Passengers Passengers Travel time 1,575,824,859 1,446,223,066 129,601,793 - - Vehicle operating costs 28,037,151 28,037,151 - User charges - - - - - During Construction & Maintenance - - - - - NET CONSUMER BENEFITS 1,603,862,010 -1 1,474,260,217 129,601,793 - - Business
User benefits Goods Vehicles
Business Cars & LGVs Passengers Freight Passengers
Travel time 1,245,026,074 490,017,099 677,553,256 77,455,719 - - - Vehicle operating costs 39,896,822 28,037,151 11,859,671 - User charges - - - - - - - During Construction & Maintenance - - - - - - - Subtotal 1,284,922,896 -2 518,054,250 689,412,927 77,455,719 - - - Private sector provider impacts Freight Passengers Revenue - - - - - Operating costs 10,746,477 10,746,476.59 - - - Investment costs - - - - - Grant/subsidy - - - - - Subtotal 10,746,477 -3 10,746,476.59 - - - Other business impacts Developer contributions - -4 - - - - -
NET BUSINESS IMPACT 1,295,669,373
(5) = (2) + (3) + (4)
TOTAL
Present Value of Transport Economic Efficiency Benefits 2,899,531,382
(6) = (1) + (5)
Notes: Benefits appear as positive numbers, while costs appear as negative numbers. All entries are discounted present values, in 2010 prices and values. All values in £s.

East Sussex Modified Permit Scheme – Cost Benefit Analysis
© East Sussex County Council
Page 77 of 87
Table 85 PA Table 5% Work Saving Year 1
Public Accounts (PA) Table (5% Work Saving) Year 1 ALL
MODES
ROAD BUS and COACH RAIL OTHER
Local Government
Funding
TOTAL
INFRASTRUCTURE
Revenue -1,061,605
-
-1,061,605
Operating Costs
1,380,165
-
1,380,165
Investment Costs
1,061,605
-
1,061,605
Developer and Other
Contributions
-
- - - -
Grant/Subsidy Payments
-
- - - -
NET IMPACT
1,380,165 -7 - - - 1,380,165
Central Government Funding: Transport
Revenue -
-
-
Operating costs
-
-
-
Investment Costs
-
-
-
Developer and Other
Contributions
-
- - - -
Grant/Subsidy Payments
-
- - - -
NET IMPACT - -8 - - - -
Central Government
Funding: Non-Transport
Indirect Tax Revenues
0 -9 0 - - -
TOTALS
Broad Transport
Budget
1,380,165 (10) = (7) + (8)
Wider Public Finances
0 (11) = (9)
Notes: Costs appear as positive numbers, while revenues and ‘Developer and Other Contributions' appear as negative numbers.
All entries are discounted present values in 2010 prices and values. All values in £s.
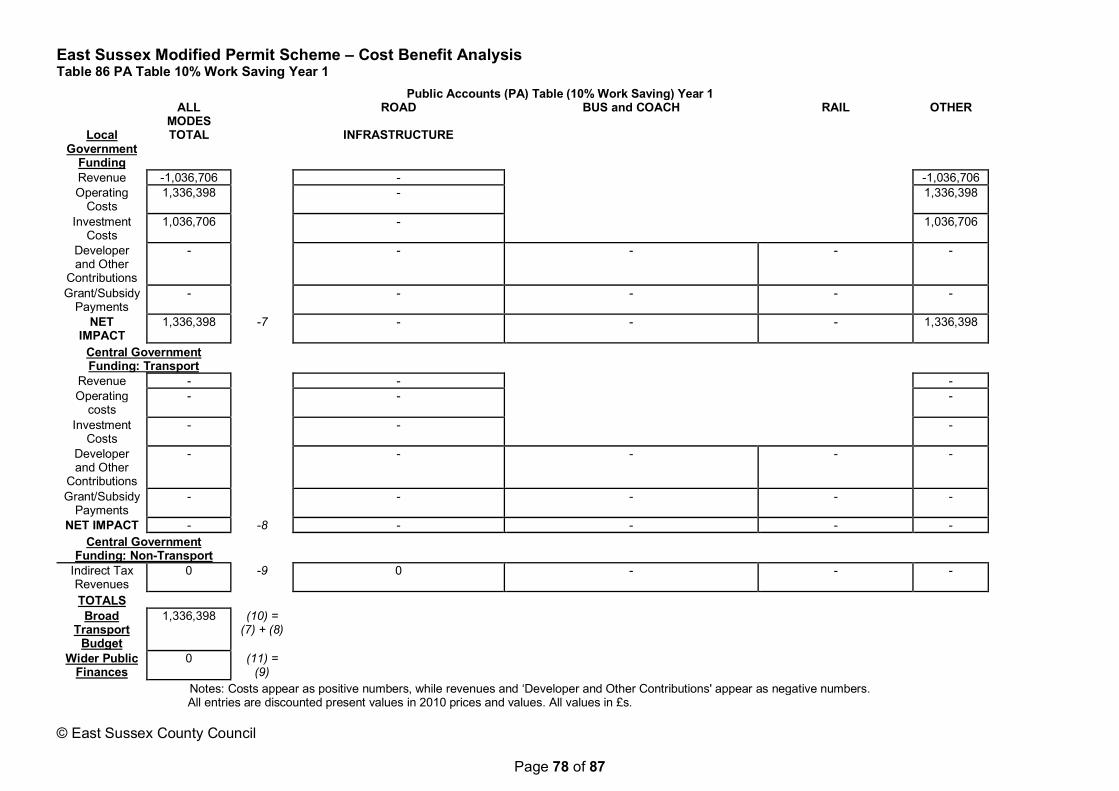
East Sussex Modified Permit Scheme – Cost Benefit Analysis
© East Sussex County Council
Page 78 of 87
Table 86 PA Table 10% Work Saving Year 1
Public Accounts (PA) Table (10% Work Saving) Year 1 ALL
MODES
ROAD BUS and COACH RAIL OTHER
Local Government
Funding
TOTAL
INFRASTRUCTURE
Revenue -1,036,706
-
-1,036,706
Operating Costs
1,336,398
-
1,336,398
Investment Costs
1,036,706
-
1,036,706
Developer and Other
Contributions
-
- - - -
Grant/Subsidy Payments
-
- - - -
NET IMPACT
1,336,398 -7 - - - 1,336,398
Central Government Funding: Transport
Revenue -
-
-
Operating costs
-
-
-
Investment Costs
-
-
-
Developer and Other
Contributions
-
- - - -
Grant/Subsidy Payments
-
- - - -
NET IMPACT - -8 - - - -
Central Government
Funding: Non-Transport
Indirect Tax Revenues
0 -9 0 - - -
TOTALS
Broad Transport
Budget
1,336,398 (10) = (7) + (8)
Wider Public Finances
0 (11) = (9)
Notes: Costs appear as positive numbers, while revenues and ‘Developer and Other Contributions' appear as negative numbers.
All entries are discounted present values in 2010 prices and values. All values in £s.

East Sussex Modified Permit Scheme – Cost Benefit Analysis
© East Sussex County Council
Page 79 of 87
Table 87 PA Table 5% Work Saving 25 Years
Public Accounts (PA) Table (5% Work Saving) 25 Year ALL MODES
ROAD BUS and COACH RAIL OTHER
Local Government
Funding
TOTAL
INFRASTRUCTURE
Revenue -26,485,797
-
-26,485,797
Operating Costs
34,009,483
-
34,009,483
Investment Costs
26,485,797
-
26,485,797
Developer and Other
Contributions
-
- - - -
Grant/Subsidy Payments
-
- - - -
NET IMPACT
34,009,483 -7 - - - 34,009,483
Central Government Funding: Transport
Revenue -
-
-
Operating costs
-
-
-
Investment Costs
-
-
-
Developer and Other
Contributions
-
- - - -
Grant/Subsidy Payments
-
- - - -
NET IMPACT - -8 - - - -
Central Government
Funding: Non-Transport
Indirect Tax Revenues
0 -9 0 - - -
TOTALS
Broad Transport
Budget
34,009,483 (10) = (7) + (8)
Wider Public Finances
0 (11) = (9)
Notes: Costs appear as positive numbers, while revenues and ‘Developer and Other Contributions' appear as negative numbers.
All entries are discounted present values in 2010 prices and values. All values in £s.

East Sussex Modified Permit Scheme – Cost Benefit Analysis
© East Sussex County Council
Page 80 of 87
Table 88 PA Table 10% Work Saving 25 Years
Public Accounts (PA) Table (10% Work Saving) 25 Year ALL
MODES
ROAD BUS and COACH RAIL OTHER
Local Government
Funding
TOTAL
INFRASTRUCTURE
Revenue -25,808,995
-
-25,808,995
Operating Costs
32,484,239
-
32,484,239
Investment Costs
25,808,995
-
25,808,995
Developer and Other
Contributions
-
- - - -
Grant/Subsidy Payments
-
- - - -
NET IMPACT 32,484,239 -7 - - - 32,484,239
Central Government Funding: Transport
Revenue -
-
-
Operating costs -
-
-
Investment Costs
-
-
-
Developer and Other
Contributions
-
- - - -
Grant/Subsidy Payments
-
- - - -
NET IMPACT - -8 - - - -
Central Government
Funding: Non-Transport
Indirect Tax Revenues
0 -9 0 - - -
TOTALS
Broad Transport
Budget
32,484,239 (10) = (7) + (8)
Wider Public Finances
0 (11) = (9)
Notes: Costs appear as positive numbers, while revenues and ‘Developer and Other Contributions' appear as negative numbers.
All entries are discounted present values in 2010 prices and values. All values in £s.

East Sussex Modified Permit Scheme – Cost Benefit Analysis
© East Sussex County Council
Page 81 of 87
Table 89 AMCB 5% Work Saving Year 1
Analysis of Monetised Costs and Benefits (5% Work Saving) Year 1
Noise - -12 Local Air Quality - -13 Greenhouse Gases 341,184 -14 Journey Quality - -15 Physical Activity - -16 Accidents 368,673 -17 Economic Efficiency: Consumer Users (Commuting) 33,411,124 (1a)
Economic Efficiency: Consumer Users (Other) - (1b)
Economic Efficiency: Business Users and Providers 25,913,387 -5
Wider Public Finances (Indirect Taxation Revenues) 261,276 - (11) - sign changed from PA table, as PA table represents
costs, not benefits Present Value of Benefits (see notes) (PVB) 59,773,092 (PVB) = (12) + (13) + (14) + (15) + (16) + (17) + (1a) + (1b) +
(5) - (11) Broad Transport Budget 1,380,165 Present Value of Costs (see notes) (PVC) 1,380,165
OVERALL IMPACTS Net Present Value (NPV) 58,392,927 Benefit to Cost Ratio (BCR) 43.31
Note : This table includes costs and benefits which are regularly or occasionally presented in monetised form in transport appraisals, together with some where monetisation is in prospect. There may also be other significant costs and benefits, some of which cannot be presented in monetised form. Where this is the case, the analysis presented above does NOT provide a good measure of value for money and should not be used as the sole basis for decisions. All values in £s.

East Sussex Modified Permit Scheme – Cost Benefit Analysis
© East Sussex County Council
Page 82 of 87
Table 90 AMCB 10% Work Saving Year 1
Analysis of Monetised Costs and Benefits (10% Work Saving) Year 1
Noise - -12 Local Air Quality - -13 Greenhouse Gases 682,368 -14 Journey Quality - -15 Physical Activity - -16 Accidents 737,345 -17 Economic Efficiency: Consumer Users (Commuting) 64,154,480 (1a)
Economic Efficiency: Consumer Users (Other) - (1b)
Economic Efficiency: Business Users and Providers 51,826,775 -5
Wider Public Finances (Indirect Taxation Revenues) 522,552 - (11) - sign changed from PA table, as PA table
represents costs, not benefits Present Value of Benefits (see notes) (PVB) 117,923,521 (PVB) = (12) + (13) + (14) + (15) + (16) + (17) + (1a) +
(1b) + (5) - (11) Broad Transport Budget 1,336,398 -10 Present Value of Costs (see notes) (PVC) 1,336,398 (PVC) = (10)
OVERALL IMPACTS Net Present Value (NPV) 116,587,123 NPV=PVB-PVC
Benefit to Cost Ratio (BCR) 88.24 BCR=PVB/PVC
Note : This table includes costs and benefits which are regularly or occasionally presented in monetised form in transport appraisals, together with some where monetisation is in prospect. There may also be other significant costs and benefits, some of which cannot be presented in monetised form. Where this is the case, the analysis presented above does NOT provide a good measure of value for money and should not be used as the sole basis for decisions. All values in £s.

East Sussex Modified Permit Scheme – Cost Benefit Analysis
© East Sussex County Council
Page 83 of 87
Table 91 AMCB 5% Work Saving 25 Years
Analysis of Monetised Costs and Benefits (5% Work Saving) 25 Years
Noise - -12 Local Air Quality - -13 Greenhouse Gases 8,529,599 -14 Journey Quality - -15 Physical Activity - -16 Accidents 9,216,819 -17 Economic Efficiency: Consumer Users (Commuting) 835,278,092 (1a)
Economic Efficiency: Consumer Users (Other) - (1b)
Economic Efficiency: Business Users and Providers 647,834,686 -5
Wider Public Finances (Indirect Taxation Revenues) 6,531,900 - (11) - sign changed from PA table, as PA table
represents costs, not benefits Present Value of Benefits (see notes) (PVB) 1,494,327,296 (PVB) = (12) + (13) + (14) + (15) + (16) + (17) + (1a) +
(1b) + (5) - (11) Broad Transport Budget 34,009,483 -10 Present Value of Costs (see notes) (PVC) 34,009,483 (PVC) = (10)
OVERALL IMPACTS Net Present Value (NPV) 1,460,317,812 NPV=PVB-PVC Benefit to Cost Ratio (BCR) 43.94 BCR=PVB/PVC
Note : This table includes costs and benefits which are regularly or occasionally presented in monetised form in transport appraisals, together with some where monetisation is in prospect. There may also be other significant costs and benefits, some of which cannot be presented in monetised form. Where this is the case, the analysis presented above does NOT provide a good measure of value for money and should not be used as the sole basis for decisions. All values in £s.

East Sussex Modified Permit Scheme – Cost Benefit Analysis
© East Sussex County Council
Page 84 of 87
Table 92 AMCB 10% Work Saving 25 Years
Analysis of Monetised Costs and Benefits (10% Work Saving) 25 Years
Noise - -12 Local Air Quality - -13 Greenhouse Gases 17,059,199 -14 Journey Quality - -15 Physical Activity - -16 Accidents 18,433,637 -17 Economic Efficiency: Consumer Users (Commuting) 1,603,862,010 (1a)
Economic Efficiency: Consumer Users (Other) - (1b)
Economic Efficiency: Business Users and Providers 1,295,669,373 -5
Wider Public Finances (Indirect Taxation Revenues) 13,063,801 - (11) - sign changed from PA table, as PA table
represents costs, not benefits Present Value of Benefits (see notes) (PVB) 2,921,960,417 (PVB) = (12) + (13) + (14) + (15) + (16) + (17) +
(1a) + (1b) + (5) - (11) Broad Transport Budget 32,484,239 -10 Present Value of Costs (see notes) (PVC) 32,484,239 (PVC) = (10)
OVERALL IMPACTS Net Present Value (NPV) 2,889,476,179 NPV=PVB-PVC
Benefit to Cost Ratio (BCR) 89.95 BCR=PVB/PVC
Note : This table includes costs and benefits which are regularly or occasionally presented in monetised form in transport appraisals, together with some where monetisation is in prospect. There may also be other significant costs and benefits, some of which cannot be presented in monetised form. Where this is the case, the analysis presented above does NOT provide a good measure of value for money and should not be used as the sole basis for decisions. All values in £s.

East Sussex Modified Permit Scheme – Cost Benefit Analysis
© East Sussex County Council
Page 85 of 87
9 MODIFIED ESPS CBA RESULTS
9.1 INTRODUCTION This section will summarises the findings of the modified ESPS Cost Benefit Analysis and consider the impact on the Highway Authority.
9.2 EAST SUSSEX HIGHWAY AUTHORITY COST BENEFIT ANALYSIS In addition to the statutory results presentation, an additional BCR and NPV is presented from the perspective of the Highways Authority (Table 93), which includes the cost recovery from Permit Fee income and includes the effect of indirect taxation. The summary of benefits is presented in Table 94.
Table 93 Highway Authority ESPS Cost Benefit results
Highway Authority Assessment Opening Year 25 Year 5% reduction in works impact Net Present Value of Benefits £59,773,092 £1,494,327,296
Net Present Value of Costs £1,380,165 £34,009,483
Net Present Value of Permit Scheme £58,392,927 £1,460,317,812
Benefit to Cost Ratio 43.31 43.94
Highway Authority Assessment Opening Year 25 Year 10% reduction in works impact Net Present Value of Benefits £117,923,521 £2,921,960,417
Net Present Value of Costs £1,336,398 £32,484,239
Net Present Value of Permit Scheme £116,587,123 £2,889,476,179
Benefit to Cost Ratio 88.24 89.95
Table 94 Benefits Summary Values and Percentage 5% reduction in works impact 25 Years
Benefits Value Percentage of Total Benefit Consumer Travel Time £787,912,430 53% Consumer Vehicle Operating Costs £47,365,662 3% Business Travel Time £622,513,037 42% Business Vehicle Operating Costs £19,948,411 1% Private Sector Provider Operating Costs £5,373,238 0% Reduction in Fuel Revenue £6,531,900 0% Greenhouse Gases £8,529,599 1% Accidents £9,216,819 1% Net Present Value of Benefits £1,494,327,296
The Scheme has a Benefit Cost Ratio of 43.85 and Net Present Value of £1.5b 2010 prices and 5% reduction in works which suggest the ESPS would be both viable and beneficial for the Highway Authority and the population of East Sussex.

East Sussex Modified Permit Scheme – Cost Benefit Analysis
© East Sussex County Council
Page 86 of 87
The projected discounted benefits in the opening year of £59.6m includes a reliability adjustment of 20% and has been assessed at a local level. This is a high decrease in the estimated suggested benefit in the DfT report in Section 3.7. Table 16 and 33 shows a higher level in traffic flows than average and more congestion.
9.3 SENSITIVITY ANALYSIS A series of sensitivity tests have been performed on the 25-year appraisal to further understand the economic performance of the Scheme and its effects at different policy levels. The Highway Authority central case assumption of a 5% reduction in works activity produced a BCR of 43.94.
The results in Table 84 below shows the standard sensitivity test of the level of works reduction required to produce a BCR of 2.0 and a BCR of 1.0.
Table 95 Standard Sensitivity
Standard Sensitivity BCR 1% 2%
Works Reduction 0.12% 0.23%
Table 96 below presents the BCR achieved based upon the level of works reduction achieved.

East Sussex Modified Permit Scheme – Cost Benefit Analysis
© East Sussex County Council
Page 87 of 87
Table 96 Works Reduction Sensitivity
Works Reduction Sensitivity Works Reduction BCR
1% Saving 8.67 2% Saving 17.42
3% Saving 26.27
4% Saving 35.2 5% Saving 44.23
6% Saving 53.35 7% Saving 62.56
8% Saving 71.86
9% Saving 81.27
10% Saving 90.77
Table 97 shows the level of roadwork reduction achieved at different BCR levels.
Table 97 BCR Sensitivity
BCR Sensitivity BCR Works Reduction
1 0.12% 2 0.23%
3 0.35%
4 0.46% 5 0.58%
6 0.69% 7 0.81%
8 0.92% 9 1.04%
10 1.15%
10 APPENDIX A QUADRO Data See attached
11 APPENDIX B Sample Sites QUADRO Results Summary
See attached
12 APPENDIX C Permit Fees Matrix
See attached