Embed Size (px)
Citation preview

LaVonne Griffi n-ValadeCity Auditor
Drummond KahnDirector of Audit Services
Jennifer ScottSenior Management Auditor
Offi ce of the City Auditor Portland, Oregon
EAST PORTLAND:
History of City services examined
April 2014

Production / Design
Robert CowanPublic Information Coordinator
LaVonne Griffi n-ValadeCity Auditor
Drummond KahnDirector of Audit Services
Jennifer ScottSenior Management Auditor
Offi ce of the City Auditor Portland, Oregon
EAST PORTLAND:
History of City services examined
April 2014

April 23, 2014
TO: Mayor Charlie Hales Commissioner Nick Fish Commissioner Amanda Fritz Commissioner Steve Novick Commissioner Dan Saltzman SUBJECT: Audit Report – East Portland: History of City services examined
The attached report contains the results of our audit on City services in East Portland.
East Portland is a large and geographically diverse area, with unique demographics. As the newest addition to the city, East Portland developed under Multnomah County’s development and infrastructure standards, contributing to diff erences between it and other areas of Portland that were annexed earlier. Zoning changes made after annexation encouraged rapid growth in housing development in East Portland, without the corresponding improvements in infrastructure and services.
We chose East Portland as the subject of our fi rst audit in a series examining City services across Portland’s neighborhood district areas. Our report documents characteristics that diff erentiate East Portland and looks at the provision of City services there. We assess City eff orts aimed at measuring and addressing the particular needs of East Portland residents, including the East Portland Action Plan (EPAP) and the City Budget Offi ce’s budget mapping process.
This report also captures a snapshot of City service levels in East Portland and residents’ historical opinions regarding services for the bureaus of Police, Fire, Water, Environmental Services, Parks, Transportation, Portland Development Commission, Housing, Development Services, Planning and Sustainability, and the Offi ce of Neighborhood Involvement.
My offi ce has surveyed Portlanders about their satisfaction with and perception of City services for more than 20 years. Residents in East Portland regularly rate many services lower than residents in other parts of Portland. Policymakers acknowledge that work remains in East Portland and have increasingly focused attention on and dedicated funding to the area.
This report does not provide defi nitive answers about what work may still need to be done in East Portland; rather, it is intended to be used in future conversations about the City’s eff orts to address infrastructure issues and other concerns in this unique and important neighborhood district of Portland.
CITY OF PORTLANDOffi ce of City Auditor LaVonne Griffi n-Valade
Audit Services DivisionDrummond Kahn, Director
1221 S.W. 4th Avenue, Room 310, Portland, Oregon 97204phone: (503) 823-4005
web: www.portlandoregon.gov/auditor/auditservices

We wish to thank the many City employees from those bureaus participating in the service level assessment, as well as staff from the City Budget Offi ce and the East Portland Action Plan, for their invaluable assistance. In addition, we want to acknowledge the active and engaged East Portland community members, many of whom spoke with us and shared their experiences and insights at various times during the audit.
LaVonne Griffi n-Valade Audit Team: Drummond Kahn City Auditor Jennifer Scott Patrick Malloy
Attachment

v
Table of Contents
Summary . . . . . . . . . . . . . . . . . . . . . . . . . . . . . . . . . . . . . . . . . . . . . . . . . . . . . . . . . . . . . . . . 1
Chapter 1East Portland developed diff erently from older areas . . . . . . . . 5
Chapter 2What makes East Portland unique? . . . . . . . . . . . . . . . . . . . . . . . . . . . . . .11
Chapter 3New City eff ort maps spending and service levels,
another works to address issues in East Portland . . . . . . . . . . . . . 17
Chapter 4City bureaus provide an array of services in East
Portland, but service levels vary . . . . . . . . . . . . . . . . . . . . . . . . . . . . . . . . . . 25
Chapter 5Conclusions . . . . . . . . . . . . . . . . . . . . . . . . . . . . . . . . . . . . . . . . . . . . . . . . . . . . . . . . . . . 75
Chapter 6Objectives, scope and methodology . . . . . . . . . . . . . . . . . . . . . . . . . . . . . 77
Appendix A . . . . . . . . . . . . . . . . . . . . . . . . . . . . . . . . . . . . . . . . . . . . . . . . . . . . . . . . . . . 81
Appendix B . . . . . . . . . . . . . . . . . . . . . . . . . . . . . . . . . . . . . . . . . . . . . . . . . . . . . . . . . . . . 85


1
Summary
East Portland diff ers in many ways from other parts of Portland. The area has been transitioning from a rural to an urban development pattern since the early 1900s. East Portland is the newest and largest of the City’s seven neighborhood areas, and is regularly cited in the media, by residents, and by policy makers as lacking the same level of amenities as the rest of the City.
Portland’s neighborhood district areas
Source: Audit Services Division
North
Inner Northeast
Central Northeast
Northwest/ Downtown
Southwest
Southeast
East

2
East Portland
The City Auditor has surveyed Portland residents about their feelings on City services for more than 20 years. Residents in East Portland regularly rate many services lower than residents in other parts of Portland. City policy makers have increasingly focused attention on East Portland and have committed to dedicating more funding to the area. In 2009, City Council adopted the East Portland Action Plan (EPAP), a community development plan containing more than 250 actions intended to improve East Portland’s livability. East Portland is the only designated neighborhood district with such a plan.
We chose East Portland as the subject of our fi rst audit in a series examining City services across Portland’s seven designated neighbor-hood districts. The objectives of our audit were to:
Document characteristics that diff erentiate East Portland and the provision of City services there from other parts of Portland – including demographics, annexation, development and planning history
Assess City eff orts aimed at measuring and addressing diff erences in East Portland, including how selected City bureaus used the East Portland Action Plan (EPAP) in their work
Capture a snapshot of City service levels in East Portland and the city as a whole
In Chapters 1 and 2, we report that East Portland is a large and geographically diverse area, with unique demographics and other characteristics when compared to the rest of the city. As the city’s most recent addition, East Portland developed under diff erent de-velopment and infrastructure standards than older parts of Portland, which helps explain some diff erences including roads, sidewalks, and parks. Unlike older areas of the city that developed around the early streetcar routes, East Portland developed around the automo-bile, which infl uenced the location of services and the walkability of neighborhoods. Zoning changes made in East Portland after annexation encouraged rapid growth in housing development, but the corresponding improvements in infrastructure and services have taken longer to materialize.

3
In Chapter 3, we found the City acknowledges that diff erences exist in East Portland and has committed to making improvements there. The City Budget Offi ce recently began mapping bureau spending and some service levels across Portland. The budget mapping eff ort is the only eff ort of its kind, but limitations mean that the data provide only a partial picture of bureau spending and services.
The East Portland Action Plan (EPAP) helped to focus policy makers’ attention on East Portland, and has been an eff ective organizing tool that has encouraged collaboration. However, we found there are too many identifi ed actions to be achieved within the plan’s ambitious timelines. EPAP is nearing its fi ve-year anniversary and the 2013-14 adopted budget suggests that 2014 is the last year EPAP will receive City funding. A budget note instructs the Offi ce of Neighborhood In-volvement (ONI) to work with involved parties to complete remaining EPAP work. At the time we wrote this report, a completion plan had not been created. ONI’s 2014-15 requested budget includes $300,000 in one-time funding for EPAP, and they have started a project to as-sess the future of EPAP.
In Chapter 4, we add to the growing eff ort to measure services with a snapshot of the City’s work in East Portland. For the bureaus of Police, Fire, Water, Environmental Services, Transportation, Parks, Neighborhood Involvement, Planning and Sustainability, the Portland Development Commission, Housing, and Development Services, we report on the following:
Snapshot of bureaus’ work in East Portland
Community Survey trends on bureau services
Bureau spending fi gures from Budget Maps
Bureau Service Level Measures
In Chapter 5, we describe how we conducted our audit in the Objec-tives, Scope and Methodology section.

4
East Portland

5
Chapter 1 East Portland developed
diff erently from older areas
East Portland comprises 29 square miles, contains 13 neighborhoods, and constitutes about 20 percent of Portland’s land area. East Port-land is generally located east of 82nd Avenue and Interstate 205, and is bordered by Gresham on the east, the Columbia River on the north, and Happy Valley and on the south. The City’s Offi ce of Neighborhood Involvement (ONI) coordinates Portland’s “neighbor-hood network,” a system of 95 neighborhood associations. The East Portland Neighborhood Offi ce (EPNO) is one of Portland’s seven geographically based neighborhood district areas. We use the EPNO boundaries to describe East Portland in this report.
East Portland neighborhoods
Source: Audit Services Division
Columbia River
Columbia River
PowellButte
Pleasant Valley
Lents
Powellhurst-
Gilbert
Hazelwood
Centennial
MillPark
Glenfair
ParkroseHeights Russell
Parkrose
Argay Wilkes
Lents - Powellhurst-Gilbert
Pleasant Valley - Powellhurst-Gilbert
Hazelwood-Mill Park
Woodland Park
Centennial- Pleasant Valley

6
East Portland
Before annexation by the City of Portland, the area known as East Portland was part of unincorporated Multnomah County, and was de-veloped under the County’s standards for infrastructure. The majority of East Portland was annexed by the City during the 1980s and 1990s. However, the City actually began annexing small portions of East Portland from unincorporated Multnomah County in the early 1900s.
The town of Lents was the fi rst part of East Portland to be annexed in 1912. The City annexed most of the Pleasant Valley neighborhood in the 1960s and 1970s. Parts of the Powellhurst-Gilbert neighbor-hood were annexed in the 1960s and 1970s, followed by extensive annexation of East Portland in the 1980s and 1990s. The area now designated as EPNO was truly annexed by 1994. Compared to the rest of Portland, East Portland developed with far more suburban characteristics, with fewer parks and sidewalks, more large arterial roads, and greater distances between housing, shopping, and other services.
The accelerated rate of East Portland annexation in the 1980s and 1990s was facilitated by City and County resolutions regarding the distribution of services between the two municipalities. In February 1983, City Council passed the Urban Services Policy – a resolution expressing the City’s intention of establishing an urban services boundary through annexation – in which the City would provide ur-ban services. The resolution does not specify what services are urban services, though it states generally that the City has the capacity to provide water and sewer services to a wider area.
The City’s resolution stated that residents in unincorporated areas near Portland would need urban services, and that it was in the best interest of current City residents to provide a full range of urban services to “developable industrial sites” that are were outside City boundaries at the time. The resolution also acknowledged a need to spread the cost of regional service provision more equitably among all those receiving services.
Area largely annexed in
1980s and 1990s
City and County
policies facilitated
annexation

7
In March 1983, Multnomah County passed Resolution A to estab-lish a policy to stop providing “municipal services” to rural areas of Multnomah County. The resolution listed police services, neigh-borhood parks, and land-use planning as examples of “municipal services” that should be provided by a city. The resolution stated that the County’s priorities were things “such as” assessment and taxation, elections, corrections, libraries, and health services.
In 1984, the City of Portland and Multnomah County signed an In-tergovernmental Agreement (IGA) that approved implementing the Urban Services Policy and Resolution A. The IGA stated that urban/municipal services are better provided by the City, and that the County should concentrate resources on human services, justice ser-vice, libraries, and other “county-wide” needs. The IGA stated that the transition of services to unincorporated areas of Multnomah County from the County to the City could be accomplished by July 1986. The City of Portland annexed 11 square miles and 37,000 residents into the City of Portland by 1986, and East Portland was completely annexed into the City by 1994. In total, the City annexed 27 square miles and 113,000 residents to the City as a result of Resolution A and the Urban Services Policy. For more information about Resolution A and the Urban Services Policy, see our March 2013 audit report:
Urban Services Policy and Resolution A: Core City services not articulated; 30-year commitments obsolete (3/26/2013)http://www.portlandonline.com/auditor/index.cfm?c=60923&a=441094
The acquisition of land, population growth, and service provision changes outlined in Resolution A required changes to City opera-tions. The newly annexed area had not belonged to a city before annexation, and the County was providing many of the same services that a city normally would. Historically, the County had maintained parks and streets and provided police services, while also handing functions like elections and providing State-mandated social services. After annexation, the City absorbed a fi re and a water district and inherited 25 neighborhood parks from the County. Many County Sheriff ’s deputies were transferred to the city police departments
Impact of annexation

8
East Portland
of Portland and Gresham, at which point, the County Sheriff ’s Offi ce began to shift operations away from policing, towards corrections and jails. The County transferred nearly 400 miles of roads and main-tenance responsibilities to the City, while Portland transferred youth and senior services programs to the County.
The changes in service provision to East Portland were accompanied by an increase in property taxes for East Portland residents, which, according to City and County staff was necessary to make service payment equitable. A series of reports issued by the County and Portland State University in the late 1970s found that residents living inside the City of Portland subsidized the services provided to unin-corporated areas of the County (through higher property taxes) and had not received a proportional level of services, while unincorpo-rated residents had paid less than the cost of services they received. The conclusions of the report were echoed by our 1986 audit on the impact of annexation, which found that “the increase in property taxes for newly annexed residents reduces the existing tax subsidy provided by City residents and funds a higher level of municipal ser-vices than was received before annexations.”
Before the implementation of Resolution A, Multnomah County, the City of Portland, and the City of Gresham had been considering how to address the 22,300 acres without sewer service located between the cities of Portland and Gresham. The area had developed without sanitary sewers. Instead, the area had cesspools – pits into which wastewater fl owed and percolated through perforated walls into the soil.
According to the engineering fi rm CH2M Hill, in 1985, there were nearly 65,000 households in the unsewered area that disposed of about 14 million gallons of sewage a day into cesspools. Ground-water tests performed by the Oregon Department of Environmental Quality (DEQ) beginning in the early 1970s showed that sewage from cesspools was seeping into underground water. In 1984, the Multnomah County Health offi cer warned that pollution from cess-pools was making the area’s groundwater an unreliable source of
Mid-County Sewer
Project was aided
by annexation, but
was inevitable due to
imminent State mandate

9
drinking water because of risks to human health from pollution, a se-rious concern since nine public water systems and an undetermined number of private wells drew drinking water from the area’s ground-water. Additionally, the area’s groundwater served as the primary source of supplemental and emergency drinking water for most of the metropolitan region. A report by the East County Sanitary Sewer Consortium found that the lack of sanitary sewers was deterring busi-nesses from locating in east county and was negatively impacting job creation there.
DEQ warned the County for years before annexation that if a local government did not build a sewer system, then DEQ would order it done. The City’s Urban Services Policy helped provide guidance on how to proceed with sewering the area since Portland was now the municipality responsible for sewer service in East Portland. Though the project was aided by annexation, these costs would have been borne by the residents of the unsewered area regardless since the State would have eventually mandated that the sewers be built to address health concerns.
By 1998, sewers had been installed in East Portland through the Mid-County Sewer Project. Our 1986 audit forecasted that constructing sewers in the area would take approximately $362 million in capital over 30 years from state, federal, and private funding, but that con-struction costs would be borne largely by the residents of the newly annexed area. According to Bureau of Environmental Services (BES) management, the City bureau responsible for the project, the City was able to build the sewers for $255 million, substantially less than initial estimates, and years ahead of schedule. They added that the construction costs were partially subsidized by city residents living outside of East Portland (through sewer rates).

10
East Portland
East Portland’s landmarks
Columbia RiverColumbia River
Johnson Creek
PowellButte
Inte
rsta
te 2
05
Interstate 84
HW 26 Powell Blvd
Burnside St
Division St
82nd
Ave
Halsey St
Sandy Blvd
Foster Blvd
KellyButte
Foster Floodplain Natural Area
Columbia Slough Natural Area
Source: Audit Services Division

11
Chapter 2 What makes East Portland
unique?
East Portland is a large
and geographically
diverse place
East Portland makes up one-fi fth of the City of Portland’s land mass. The area is bordered on the north by the Columbia River, the City of Happy Valley and unincorporated Clackamas County on the south, the City of Gresham and unincorporated Multnomah County on the east, and Interstate 205 and 82nd Avenue on the west. Highway 26 and Interstate 84 pass through East Portland in addition to many fi ve-lane arterial roads. On the eastern side are two major geographic features – Powell Butte, an extinct cinder cone volcano that is now a 600 acre City park, and Kelly Butte, part of the extinct Boring Lava Field that is now a 23 acre park. Also in the area is Johnson Creek, an urban waterway with remnant populations of native salmon and steelhead. North of the area is the Columbia Slough watershed. Unlike many inner Port-land neighborhoods, East Portland has a signifi cant mature stand of Douglas fi r trees that provides year-round green.
Johnson Creek
Source: Audit Services Division

12
East Portland
Growth trends between 2000 and 2010 in East Portland are distinct from those in Portland as a whole. Between 2000 and 2010, East Portland’s population increased 18 percent while Portland’s general popula-tion grew 10.3 percent. As a result, East Portland went from having 23.9 percent of the city’s population in 2000 to 25.6 percent in 2010. East Portland saw its average household size increase by 3.5 percent, while Portland’s overall household size dropped slightly. The number of children living in East Portland increased by 14.4 percent between 2000 and 2010, and in 2010, the proportion of people older than 65 was higher than the proportion in the city as a whole.
East Portland is more racially and ethnically diverse than Portland as a whole. In the 2010 Census, 66.9 percent of the East Portland popula-tion identifi ed as white, compared to 76.1 percent in Portland overall. Moreover, racial minorities formed a greater percentage of East Port-land’s population in every Census racial category.
East Portland’s income distribution is lower relative to the citywide distri-bution. In 2010, 58 percent of East Portland households earned less than $50,000 per year, while 51 percent of households citywide did. At the same time, 11 percent of East Portland households earned $100,000 or more, compared to 19 percent of households citywide.
Educational attainment is lower in East Portland than citywide. In 2010, 80.3 percent of East Portland residents age 25 and older had com-pleted high school, compared to 89.6 percent citywide, while 17.2 percent of East Portland residents had earned a bachelor’s degree or higher, compared to 41.2 percent citywide.
East Portland workers more likely to drive alone and carpool to work. In 2010, workers in East Portland were also less likely than residents citywide to take public transportation, walk, or use other means to get to work.
East Portland’s rental and homeownership rates closely match those of Portland as a whole. As of 2010, 51.6 percent of East Portland hous-ing units were owner-occupied, compared to 50.3 percent in all of Portland. In 2010, the percent of both renter-occupied (42.6 percent) and vacant properties (5.9 percent) in East Portland was within one percentage point of the fi gures for all of Portland (43.3 percent and 6.4 percent, respectively).
Census data paints
picture of
East Portland

13
East Portland had a more rapid decline in the proportion of own-er-occupied units. Between 2000 and 2010, the proportion of owner-occupied units dropped 5.9 percentage points in East Port-land, compared to a 2.3 percentage point drop the city throughout.
East Portland has a distinct development history compared to the rest of Portland. According to numerous histories published about Portland and East Portland, many of the inner areas of Portland urbanized during the nineteenth and early twentieth centuries and were centered around early streetcar networks, while much of East Portland sustained rural development patterns comprised of small farms.
Widespread urbanization did not occur in East Portland until after World War II, when residential development was generally planned to accommodate cars. The street, block and lot patterns of the post-war era are diff erent from areas of Portland that developed earlier.
East Portland developed with subdivisions with curved streets, large blocks, cul-de-sacs, and irregular and larger lot dimensions. The subdivisions of East Portland were not designed to be pedestrian-friendly, as they are not internally connected via small less traffi cked roads. Since the area was designed with cars in mind, services and institutions no longer needed to be neighborhood based, so lo-cal services were replaced over time by larger (and fewer) facilities located along main driving routes.
Much of East Portland’s zoning changed shortly after annexation in 1996 when the Outer Southeast Community Plan (OSCP), part of the City’s Comprehensive Plan, was adopted. The OSCP implemented a land use plan map and regulations designed to guide growth through 2015 in accordance with the Metro 2040 growth concept where high-density development was encouraged. Zoning changes and the existence of large lots with low density development al-lowed for more infi ll development and a broader application of multi-dwelling zones in East Portland, which has led to a high rate
Post WWII East
Portland developed
around the car
City policy changes
facilitated rapid
housing development

14
East Portland
of development. During the same time, housing in East Portland became more aff ordable relative to other parts of Portland.
Portland zoning code allows for a variety of lot sizes. New develop-ment on existing narrow lots, or on lots created from the subdivision of a large lot tends to be tall and narrow. Much of East Portland’s post WWII homes tend to be one to one and a half stories, much smaller and wider than the new tall and narrow neighboring homes. While infi ll development has provided needed housing and has made housing more aff ordable, it often changes the development pattern and character of the street on which infi ll housing is built.
Flag Lot Diagram
Source: Audit Services Division
Street
Driv
eway
Driv
eway

15
Some of the subdividing in East Portland has come in the form of fl ag lots. Flag lots consist of a narrow driveway (or “pole”) section that extends from the street to a larger “fl ag” section typically behind the original developed lot and home. Flag lots were created in some parts of East Portland prior to annexation, but changes in allowed density and rising demand for housing have spurred more fl ag lots. Flag lots can create privacy impacts for the original home, and ac-cording to the Portland Fire Bureau, they can create fi re hazards since it is diffi cult for fi re and rescue vehicles to travel down the narrow driveway to reach a house built on a fl ag lot.
As noted earlier, the City of Portland did not annex most of East Portland from unincorporated Multnomah County until after it was urbanized, meaning that East Portland did not develop with the same standards for parks, roads, sidewalks, and sewers as other areas of Portland. For example, prior to East Portland’s annexation to the City, Multnomah County did not require developers to pave roads or build sidewalks within or alongside new development, as the City required. As a result, most areas that developed before the mid-1990s have streets with gravel shoulders instead of curbs and sidewalks. On major arterials, the County usually installed curbs and storm water facilities but not sidewalks. In Chapter 4 of this report, we discuss these and other infrastructure diff erences in more depth.
The Audit Services Division has been surveying Portland residents for 23 years on their opinions of City services. Each year, we analyze survey responses for the City as a whole and for each of Portland’s seven neighborhood areas. East Portland residents rated overall city livability lower than all other neighborhood areas in the 16 years we have asked the question, and East Portland residents ranked the overall job of City government lower than Portlanders as a whole and most other neighborhood district areas for 20 years. East Portland residents have historically reported the lowest satisfaction with the overall quality of City parks and with parks & recreation activities, while they report the highest satisfaction with public safety services. Additional survey results are included in Chapter 4 of this report.
Infrastructure
diff erences
Residents in East
Portland generally
feel worse about City
services than residents
in other parts of
Portland

16
East Portland
Unimproved street in East Portland
Source: Audit Services Division
17
Recent City eff ort maps
spending and service levels,
another works to address
issues in East Portland
Chapter 3
City leaders acknowledge that service level diff erences exist, and have pledged to improve services in East Portland. We discuss bu-reau work and some specifi c eff orts to improve service levels in East Portland in Chapter 4. In this chapter, we document our examination of two broader eff orts to measure spending and services – the City Budget Offi ce’s budget mapping project that maps spending and service levels in the City’s neighborhood district areas, and the East Portland Action Plan (EPAP), a development plan aimed at addressing issues in East Portland.
Beginning in 2010, the City began an exercise known as budget map-ping. This exercise maps the adopted operating budgets of eight City bureaus and the capital budgets of two bureaus based on the geog-raphy in which the bureau planned to spend the money. Portland was split into eight geographies – the seven neighborhood districts shown on page 1, and the Central City, which includes the inner industrial area of Southeast, the Lloyd District in Northeast, and the downtown areas of Northwest and Southwest. Budget mapping was envisioned as a way for policy-makers and community members to better understand the distribution of funding and delivery of services throughout Portland, and the eff ort was celebrated by East Portland advocates.
The City’s budget maps are created through an iterative process between the Budget Offi ce and individual bureaus. In 2010, staff from the City Budget Offi ce (then part of the Offi ce of Management and Finance), engaged with staff in every bureau to discuss how the bureau would allocate their adopted operating budgets. Because
Budget maps are the
City’s fi rst eff ort to
show geographically
based spending and
service levels

18
East Portland
the City’s budgeting software does not force the identifi cation of the geographic locations where spending is planned, and because bureaus had not allocated their budgets geographically before 2010, the exercise was diffi cult for most bureaus. On the other hand, the exercise was easier for bureaus that are organized by geographically based precincts and stations, like Police and Fire.
City Budget Offi ce staff gave instructions for bureaus to allocate as much of their approved operating budget expenses as possible to one of the eight geographic areas where they planned to spend the money. These geographically allocated amounts represent the local share contained on the maps for each of the eight geographies. Each area also has an allocated citywide share, which are the approved budget expenses the bureau could not geographically allocate. The citywide share is based on total users (number of residents and day-time employees). Bureaus calculate their allocated and unallocated expenses, and Budget Offi ce staff normalize these fi gures by each geography’s total user count.
According to Budget Offi ce staff , there was initially a lot of back and forth with the bureaus about the data and what can be geo-graphically allocated. Once Budget Offi ce staff are satisfi ed that the information is accurate and reasonable, the Bureau of Technology Services creates the maps. In 2011, Budget Offi ce staff began to create capital maps for some bureaus using the online tool “Portland-maps” and data from BRASS.
While budget mapping can be useful and is the only project of its kind in the City, there are important aspects that pose limitations. Not all City bureaus have had budget maps published. For example, the Water Bureau and the Bureau of Environmental Services are large bureaus that have not been included. According to Budget Offi ce staff , due to the interrelated nature of Water and Environmental Services’ assets and investments, an extremely low percent of their budgets could be geographically allocated. The maps are created using the City’s adopted budget numbers, and they represent where City Council plans to spend money. Actual spending by the end
Budget maps provide
partial picture of City
spending and service
levels

19
of the year may be diff erent, due to approved budget adjustments throughout the year.
Diff erences in bureau budgeting practices mean that bureau maps vary in the level of geographic specifi city. For example, the Portland Bureau of Transportation (PBOT) does not plan where they are going to spend large portions of their budget during the budgeting pro-cess. Rather, they wait until after the fi scal year has begun. Portland Parks and Recreation (PP&R) does not geographically allocate any of its maintenance budget during the budgeting process. As a result, large portions of the PBOT and PP&R operating budgets are included in the maps’ citywide share and divided proportionally to the number of residents and daytime employees in each geography, not based on where the money may be spent.
Additionally, PP&R asserts that their most popular parks (including Waterfront, Forest and Washington) are regional assets, so the spend-ing associated with these major parks is included in the citywide share for each of the eight geographies, as opposed to being included in the local share of the geography where the park is located. Accord-ing to Budget Offi ce staff , this is the primary way that all bureaus can impact the story their maps tell. Further, budget maps show just one year of planned spending. For capital projects, which are usually multi-year projects with the bulk of the funding budgeted in the fi rst year, the maps from year to year will show vastly diff erent spending amounts for the same project.
Beginning in 2010, PBOT and Parks were asked to select one or two service level measures and create their own maps. Additional bu-reaus began mapping service level measures in subsequent years. PBOT has mapped a diff erent service level measure each year, which limits the maps’ utility as a tool to track changes over time.
Though budget maps off er a partial picture of City spending in Portland’s neighborhood district areas, the maps are the only tool currently available. In Chapter 4, we report bureau budget mapping data for East Portland and the City as a whole. In combination with the service level measures we report, the fi gures provide additional and important information about the City’s allocation of resources.

20
East Portland
Multiple entities helped develop the East Portland Action Plan, a
complex document with signifi cant public involvement
The East Portland Action Plan (EPAP) is a group and a community development action plan designed to identify and address gaps in policies and services related to East Portland. The process to create EPAP was initiated in December 2007 by the leaders from the City of Portland, Multnomah County and a former Speaker of the Oregon House of Representatives.
The fi nal EPAP document is a result of eight months of work by the East Portland Action Plan Committee, a group of East Portland com-munity members, business people, leaders and representatives from the City of Portland, Multnomah County, the State of Oregon, Metro, TriMet, school districts, and nonprofi t organizations. The Commit-tee was established to provide “leadership and guidance to public agencies and other entities on how to strategically address commu-nity-identifi ed issues and allocate resources to improve livability for neighborhoods in the East Portland Neighborhood Offi ce (EPNO) coalition area.”
The creation of the EPAP document also involved technical and agency advisors from the area’s school districts, the City of Portland, Multnomah County, the City of Gresham, TriMet, Metro, and the Housing Authority of Portland. The EPAP Committee was staff ed by the City’s Bureau of Planning (now Bureau of Planning and Sustain-ability), and a consultant team. City Council formally adopted the EPAP in February 2009; it is the City’s only modern development ac-tion plan focused on a designated neighborhood district area.
EPAP has received funding from the City of Portland since 2009 for a full-time Advocate who helps to coordinate EPAP meetings and advocate for improvements in East Portland. Funds remaining after the EPAP Advocate position and operational costs go toward a grants program administered by EPAP and a municpal partnership program.
EPAP is designed to address a number of needs identifi ed by the community during prior City assessments of East Portland and through the EPAP creation process. EPAP includes four principles that, according to the Plan, provide context for future policy making and measuring progress toward achieving greater livability in East
East Portland Action
Plan helped encourage
collaboration, but
has varied impact on
actions in our sample;
future funding for EPAP
is uncertain
21
Portland: 1) mitigate negative trends, 2) attain and sustain equity, 3) build on community assets and connections, and 4) capitalize on East Portland’s place in the region.
The Plan contains 269 actions that fall within 63 strategies covering categories borrowed from the VisionPDX project – Built, Environ-mental, Economic, Learning, and Social. According to the Plan, “the Strategies and Actions are in support of the ultimate goal of the Action Plan, which is to improve the quality of life, help foster strong community connections, increase the area’s regional signifi cance and improve equity for East Portland residents”. See appendix A for a table listing the EPAP strategies.
Each action has a “possible lead role,” a public agency or community organization best suited for scoping and organizing the action’s ef-forts, and most actions have “possible partners”. Each action has an implementation time frame ranging from “underway” to “5+ years,” which is the “desired time period to pursue the action.” Most of the actions in the EPAP are categorized with implementation time frame of “underway” or “0-2 years.”
The EPAP is not only a plan, but also an organization. EPAP mem-bership is open to EPNO residents, and businesspeople, nonprofi t organizations, special districts and service providers that operate within EPNO boundaries. All EPAP decisions are made using a con-sensus model.
EPAP general meetings are held one evening a month in East Port-land where members coordinate activities, monitor Plan progress, organize future advocacy opportunities, and consider new issues. At each meeting, dinner is served and childcare and language transla-tion are off ered to make it easier for a diverse group of East Portland residents to attend. There are topic-based subcommittees – covering issues from bikes and brownfi elds to education and housing – that give reports on their work at the general assembly meeting. In addi-tion to the general assembly and subcommittees, there is a Technical Advisory Committee of City public agency representatives that meets quarterly to discuss their work in East Portland and progress imple-menting actions from the EPAP.

22
East Portland
East Portland Action Plan’s impact on sample actions varied
In order to learn about how City bureaus use EPAP in their work, we judgmentally selected a sample of 13 EPAP actions and one EPAP grant-funded project where City bureaus were assigned the lead role. We interviewed bureau managers and staff about the involvement of their bureau in EPAP development. We also asked how bureaus use EPAP and requested information about the implementation status of sample actions.
Based on our sample, we found that EPAP’s impact on action imple-mentation was mixed. Many of the actions in our sample had been implemented, due directly or in part to EPAP, while other actions were in progress before being included in the plan, or would have been done regardless of EPAP. See appendix B for a summary of our work. Of the ten bureaus included in our sample, we found that two – PBOT and Parks – have formal bureau plans targeted towards East Portland specifi cally.
We also found that the EPAP creation process and organization have brought strategic focus to issues in East Portland, helped secure funding for projects, and has encouraged collaboration among public agencies. Staff and managers told us that EPAP has helped their bu-reaus because it has fostered understanding between the community and the City, and helped publicize their bureau’s work in East Port-land. While many actions were already in progress before they were included in EPAP, according to some staff members, EPAP can be used in the future to hold policy makers accountable for commitments made to East Portland. EPAP members and City staff working on EPAP told us that the funded EPAP Advocate position and community involvement are important factors that contribute to EPAP’s success.
EPAP nearing end of designated time frame; City Council urging
the group to prioritize remaining actions; future funding uncertain
The East Portland Action Plan was adopted in February 2009 and will be fi ve years old in early 2014. Most of EPAP’s 269 actions have imple-mentation timeframes of less than 5 years. According to staff who helped create EPAP, the timeframes assigned to many of the actions

23
were too ambitious, and too many actions were included in the fi nal EPAP document. Acknowledging that there are more actions than can be completed in the Action Plan’s time horizon and with limited community capacity, EPAP staff told us that the group is narrowing their focus in 2014 to 29 priority projects that relate to EPAP actions and strategies. EPAP staff told us that if EPAP receives funding past 2014, they will update the Plan, likely reducing the number of actions it contains.
Narrowing their focus is positive, especially considering a note in the 2014 Adopted Budget that reads, “the FY 2013-14 budget includes one-time funding for the East Portland Action Plan. The Offi ce of Neighborhood Involvement is directed to work with the relevant par-ties to develop a plan to complete work associated with the plan and wrap up uncompleted tasks.” We spoke with ONI management about the budget note and learned that an EPAP completion plan has not been developed. ONI management told us they hope that funding for EPAP will continue after 2014; their 2014-15 requested budget in-cludes $300,000 in one-time funding for EPAP. After we wrote a draft of this report, ONI began a project to assess the future of EPAP.
In order to provide additional information about City service levels in East Portland, we developed measures for the City Bureaus of Fire, Police, Water, Environmental Services, Parks, Development Services, Neighborhood Involvement, Housing, Planning and Sustainability, Transportation, and the Portland Development Commission. We refi ned the list of service level measures with bureau managers who provided the data for 2012. This information, along with informa-tion about the bureau’s work in East Portland, trends in community opinions on bureau services, and bureau spending data from budget maps is documented in Chapter 4.
Our reporting of
service level measures

24
East Portland
Furey Community Garden
Source: Audit Services Division

25
Chapter 4 City bureaus provide an array
of services in East Portland,
but service levels vary
The City of Portland provides many services that impact livability in East Portland, but it is important to note that many important ser-vices are not the responsibility of the City. For example, public transit is the responsibility of TriMet, and some of the major roads in East Portland are the responsibility of the State. Schools in East Portland are the responsibility of the fi ve diff erent School Districts. Human services like those provided for families in poverty, homeless youth and families, seniors, adults with disabilities, veterans, and people recovering from mental illness and addiction is the responsibility of Multnomah County. Regional land use and transportation planning are the responsibilities of Metro.
As part of our work, we examined City service provision in East Portland for the individual bureaus that provide services there. For the bureaus of Police, Fire, Water, Environmental Services, Develop-ment Services, Neighborhood Involvement, Housing, Planning and Sustainability, Transportation, Parks, and the Portland Development Commission, we performed the following set of analysis:
Documented a snapshot of bureaus’ work in East Portland and work related to East Portland
Analyzed bureau-related trends in satisfaction rates from the Auditor’s Community Survey, and calculated 10 and 20-year changes
Compiled City spending data from budget maps for East Portland and Portland as a whole from budget maps
Developed service level measures and obtained data from bureaus for East Portland and Portland as a whole

26
Portland Police Bureau
Bureau’s work in East
Portland
There are three police precincts in Portland and one is located in East Portland. The East Precinct generally serves the 225,000 resi-dents within the City limits east of César E. Chávez Blvd. and south of Interstate 84. The precinct includes most of the EPNO area, with the exception of two patrol districts north of Interstate 84. The East precinct contains nine patrol districts west of the EPNO boundary and east of César E. Chávez Blvd.
North Precinct
Portland Police Precincts
Central PrecinctEast Precinct
East PortlandI-205
39th
I-84
I-84
PortlandInternationalAirport
I-5
I-5
Foster
According to the former East Precinct Commander, the East Precinct has the most staff because they respond to more calls for service than the other precincts. Additionally, the former Commander indi-cated that there is more violent crime (Part I crimes) in East Precinct than in the other two precincts. However, when analyzed per capita in the service level table on page 30, calls for service in East Precinct are lower than the overall citywide rate, and there are fewer offi cers and sergeants assigned there per capita compared to the number as-signed in other precincts.

27
Police offi cers from the East Precinct engage with a number of community organizations, many of which serve minority and ethnic groups and new immigrants. According to the former Commander, offi cers perform community outreach because it is important for offi -cers to understand the impact of culture on perceptions of police and to break down barriers.
Community Survey
Trends
Police services overall (percent “good” or “very good”)
0%
25%
50%
75%
100%
1991 1998 2005 2012
EastCity
East
City
2013
In 2013, 68 percent of residents in East Portland felt very good or good about overall Police services, while 61 percent of residents citywide felt posi-tively about Police services. East Portland residents in 2013 rated Police services about the same as they did in 2004 and 1994. Citywide in 2013, residents rated Police services similarly to 2004, but ratings fell 9 percentage points since 1994.
Source: Audit Services Division
East Precinct

28
Portland Police Bureau
For the majority of the years we surveyed residents about their satisfaction with City services, residents in East Portland rated police services higher than most other neighborhood district areas.
In 2013, 77 percent of residents in East Portland reported feeling very safe or safe in their neigh-borhood during the day, which is about the same as in 2004 and 1994. In 2013, 92 percent of residents citywide reported feeling very safe or safe in their neighborhood during the day, about the same as in 2004, but safer than in 1994 (10 percentage point improvement).
In 2013, 35 percent of residents in East Portland reported feeling very safe or safe in their neighborhoods at night, while 62 percent of residents citywide reported feeling that way. East Portland residents’ feelings of neighbor-hood nighttime safety have remained relatively steady from ten and twenty years ago, while citywide, residents feel safer in 2013 than they did in 2004 and in 1994, 9 and 25 percentage points, respectively.
Neighborhood safety during day (percent “good” or “very good”)
0%
25%
50%
75%
100%
1991 1998 2005 2012
EastCity
East
City
2013
Neighborhood safety during night (percent “good” or “very good”)
0%
25%
50%
75%
100%
1991 1998 2005 2012
EastCity
East
City
2013

29
Bureau fi gures from
Budget Maps
Portland Police Bureau Adopted Budget Expenses
Source: Data from FY ‘11-FY ‘13 City Budget Offi ce Budget Maps. Local share represents approved budget expenses that bureaus plan to spend in a specifi c geography. Citywide share represents the remaining approved budget expenses based on a geographic area’s users (residents and daytime employees). Due to rounding, some totals may not sum.
East Portland
Local share
Citywide share
Total
Local share per user
Citywide share per user
Total per user
Portland (entire city)
Allocated (local) bureau expenses
Unallocated (citywide) bureau expenses
Fund & other expenses
Total bureau expenses
2012-2013
$37.0 M
$0.0 M
$37.0 M
$191
$0
$191
2012-2013
$166.0 M
$0.0 M
$1.1 M
$167.1 M
2011-2012
$36.6 M
$0.0 M
$ 36.6 M
$191
$0
$191
2011-2012
$ 168.6 M
$0.0 M
$ 0.1 M
$ 168.8 M
2010-2011
$34.0 M
$0.1 M
$34.1 M
$184
$1
$184
2010-2011
$154.7 M
$0.5 M
$3.0 M
$158.2 M
The table below contains three years of Police Bureau adopted bud-get expenses for East Portland and the city as a whole from the City Budget Offi ce’s budget maps. Budget maps off er a partial picture of City spending in Portland’s neighborhood district areas. For more information about the City’s budget mapping process, see page 17 of this report.

30
Portland Police Bureau
Bureau Service Level
Measures
Portland Police Bureau
Service level measure
Number of incidents dispatched per 1,000 residents
Self-initiated (offi cer initiated) calls for service per 1,000 residents
Part I Crimes per 1,000 residents *
Number of Part I arrests per 1,000 residents
Number of Part II arrests per 1,000 residents
Number of crashes per 1,000 residents
Number of DUII incidents per 1,000 residents
Response time for high priority calls for service *(Goal is 5:00 or less)
Offi cers & sergeants assigned to precinct per 1,000 as of July 1, 2012
Offi cers & sergeants assigned to precinct per 1,000 as of May 1, 2013
Citywide
343.5
279.6
59
9.5
29.7
4.8
3.2
4.99
0.91 (Central)
0.88 (North)
0.97 (Central)0.91 (North)
East Portland
Precinct area
242.8
164.2
59
9.3
14.5
3.2
1.9
4.57
0.76
0.76
FY 2012
Source: Data provided by Portland Police Bureau. Per capita calculations performed by Audit Services Division
Note: East Portland fi gures are for East Portland Precinct area with the exception of fi gures with *, which are EPNO area.
The table below contains Police bureau service level measures for East Portland and for the city for FY 2012, with data provided by the Police Bureau. For more information about the creation of the service level measures, see page 78 of this report.

31

32
Portland Fire and Rescue
There are eight fi re and rescue stations whose service areas are entirely or partially located in East Portland: Station 02 (Parkrose Station), Station 07 (Mill Park), Station 11 (Lents), Station 12 (Sandy Blvd.), Station 19 (Mt. Tabor), Station 29 (Powellhurst), Station 30 (Gateway), and Station 31 (Rockwood). Over the last 15 years, the number of responses made by Portland Fire and Rescue (PF&R) appa-ratus units has increased more in East Portland than in Portland as a whole. According to PF&R, run volume has risen 18 percent citywide and 54 percent in East Portland over 15 years. PF&R has responded to the increase by locating more response units in East Portland. Today, three of the bureau’s four rapid response vehicles are housed in stations that serve East Portland, and the bureau located the City’s second urban search and rescue vehicle at Station 12.
Bureau’s work in East
Portland
PF&R Fire Stations in EPNO
!(!(
!(
!(!(
!(
!(
!(
2
7
11
30
19
12
29
28
31
25
11
Glisan St.
I-84
Portland International
Airport
I-205
I-205
112t
h S
t.2
7
11
12
19
29
30
3131
30
29
19
12
11
7
2
Fire
Management Areas
Fire
Stations
EPNO boundary
Parkrose
Mill Park
Lents
Sandy Blvd.
Mt. Tabor
Powellhurst
Gateway
Rockwood

33
In addition to run volume, some of the aspects that make East Portland diff erent from the rest of the City impact the Bureau’s work, including development, demographic and geographic diff erences. For example, according to PF&R, the fl ag lots discussed on page 14 of this report pose problems for the bureau because of limited access with narrow driveways to reach homes. Currently, PF&R has staff who review plans at the Bureau of Development Services to ensure fi re access and fi re hydrant requirements are being met in any new devel-opment. There are also many multifamily buildings in East Portland that were built when the fi re alarm requirements were less restric-tive than current standards. Additionally, the increase in residential density in the area has increased the need for emergency services in East Portland.
The geographical diff erences in East Portland also infl uence the PF&R’s work. The roads to access the Powell and Kelly Buttes are very steep and curved, making it diffi cult for fi re apparatus to reach the top. When there are calls for service on the buttes, PF&R often responds with a brush unit.
Firefi ghters work with more non-English speakers in East Portland. Four PF&R vehicles in East Portland are equipped with iPads that can be used for translation services. PF&R is working to build trust in the community and increase public understanding of fi re safety through community outreach and by encouraging more diverse populations to visit fi re and rescue stations.
Fire fi ghters from stations in East Portland respond to swimming and boating accidents on the Columbia River, to incidents at the Portland International Airport, and to vehicle, bicycle, and pedestrian acci-dents in East Portland. One of the fi re stations in East Portland is also responsible for parts of the City of Gresham, a station that is jointly staff ed with Portland and Gresham fi refi ghters.

34
There is one question in the Auditor’s Community Survey related to the Portland Fire Bureau. In 2013, 87 and 86 percent of residents in East Port-land and in the city as a whole rated Fire services as very good or good, respectively. Ratings have remained relatively steady since 2004 and 1994 in East Portland and at the citywide level.
For the majority of the years we have conducted our survey, East Portland residents have rated Fire services higher than most other neighborhood district areas.
The table below contains three years of Fire Bureau adopted budget expenses for East Portland and the city from budget maps produced by the City Budget Offi ce. Budget maps off er a partial picture of City spending in Portland’s neighborhood district areas. For more infor-mation about the City’s budget mapping process, see page 17 of this report.
Portland Fire and Rescue
Community Survey
Trends
Overall Fire(percent “good” or “very good”)
0%
25%
50%
75%
100%
1991 1998 2005 2012
EastCity
East
2013
City
Bureau fi gures from
Budget Maps
Portland Fire & Rescue Adopted Budget Expenses
Source: Data from FY ‘11-FY ‘13 City Budget Offi ce Budget Maps. Local share represents approved budget expenses that bureaus plan to spend in a specifi c geography. Citywide share represents the remaining approved budget expenses based on a geographic area’s users (residents and daytime employees). Due to rounding, some totals may not sum.
East Portland
Local share
Citywide share
Total
Local share per user
Citywide share per user
Total per user
Portland (entire city)
Allocated (local) bureau expenses
Unallocated (citywide) bureau expenses
Fund level expenses
Capital Improvement
Total bureau expenses
2012-2013
$22.1 M
$1.4 M
$23.5 M
$114
$7
$122
2012-2013
$89.8 M
$6.7 M
$0.0 M
$5.8 M
$102.3 M
2011-2012
$22.8 M
$1 M
$23.7 M
$119
$5
$124
2011-2012
$ 90.6 M
$ 4.8 M
$ 4.4 M
$ 2.7 M
$ 102.5 M
2010-2011
$20.7 M
$1.2 M
$21.9 M
$112
$6
$119
2010-2011
$87.0 M
$6.1 M
$0 M
not tracked
$93.1 M
35
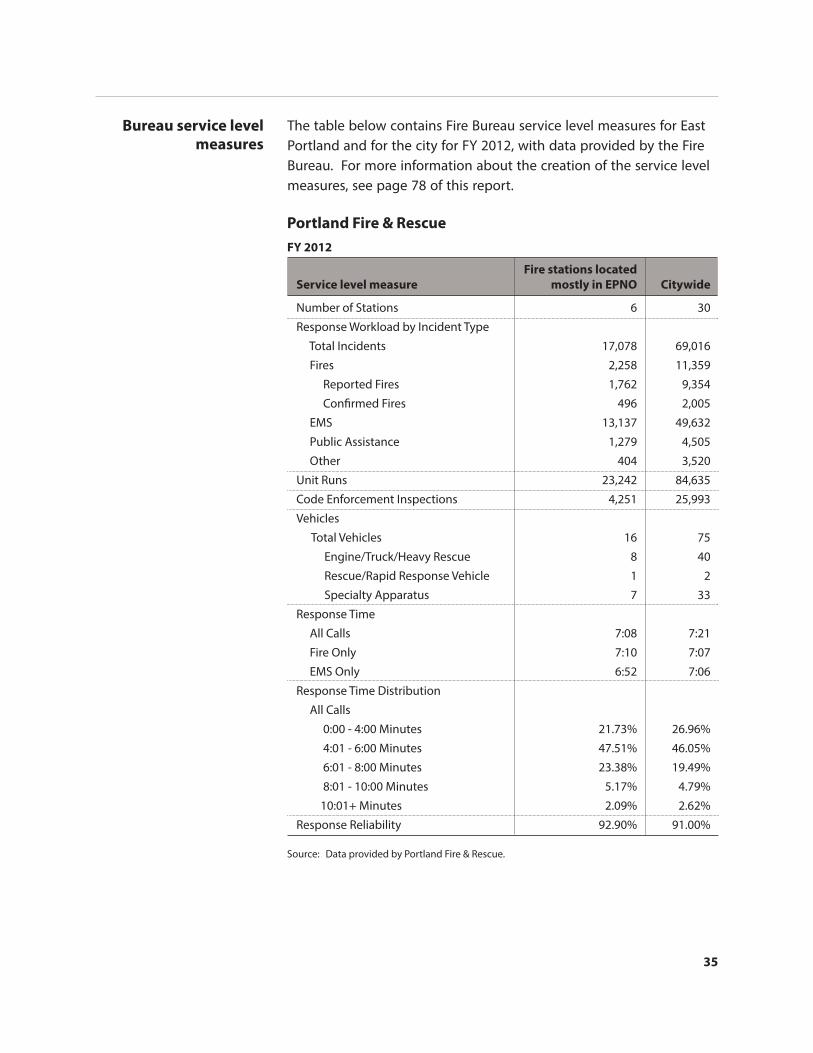
The table below contains Fire Bureau service level measures for East Portland and for the city for FY 2012, with data provided by the Fire Bureau. For more information about the creation of the service level measures, see page 78 of this report.
Portland Fire & Rescue
Source: Data provided by Portland Fire & Rescue.
Service level measure
Number of Stations
Response Workload by Incident Type
Total Incidents
Fires
Reported Fires
Confi rmed Fires
EMS
Public Assistance
Other
Unit Runs
Code Enforcement Inspections
Vehicles
Total Vehicles
Engine/Truck/Heavy Rescue
Rescue/Rapid Response Vehicle
Specialty Apparatus
Response Time
All Calls
Fire Only
EMS Only
Response Time Distribution
All Calls
0:00 - 4:00 Minutes
4:01 - 6:00 Minutes
6:01 - 8:00 Minutes
8:01 - 10:00 Minutes
10:01+ Minutes
Response Reliability
Citywide
30
69,016
11,359
9,354
2,005
49,632
4,505
3,520
84,635
25,993
75
40
2
33
7:21
7:07
7:06
26.96%
46.05%
19.49%
4.79%
2.62%
91.00%
Fire stations located
mostly in EPNO
6
17,078
2,258
1,762
496
13,137
1,279
404
23,242
4,251
16
8
1
7
7:08
7:10
6:52
21.73%
47.51%
23.38%
5.17%
2.09%
92.90%
FY 2012
Bureau service level
measures

36
Portland Water Bureau
The Columbia South Shore Well Field and the Powell Butte Reservoir, two important parts of the Portland Water Bureau’s infrastructure system are located partially and fully, respectively, in East Portland. The Columbia South Shore Well Field (CSSWF) is the second largest water source in the State of Oregon, with about half of the daily capacity of Portland’s Bull Run water source. Groundwater from the CSSWF is used as emergency backup for customers served by Bull Run and also provides supplemental supply during the summer. The Powell Butte Reservoir is a 50 million gallon underground water reservoir located at 158th Ave and SE Powell Blvd.
Most of the East Portland area receives water through gravity-fed systems with water from the Bull Run Watershed via Powell Butte or Kelly Butte. According to bureau Water Quality staff , water from Powell Butte is generally fresher and cooler than water from other sources, since it has traveled the shortest distance from the source and hasn’t gone through an open reservoir. Because East Portland is rela-tively fl at, there are fewer water service issues than in hillier areas like Southwest Portland. East Portland has a higher percentage of areas not served by the Portland Water Bureau than the City’s average –12 percent versus three percent. According to the Water Bureau, these households are served by other utilities, including the Lorna Water Company, Sunrise Water District, Clackamas River Water District Au-thority, the City of Gresham, and the Rockwood Public Utilities District.
Since we began surveying resi-dents about City services, East Portland residents have generally had views about overall Water Bureau service quality that are similar to the views of Portland as a whole. In 2013, 63 percent of residents in East Portland and 70 percent of residents citywide rated Water Bureau service as very good or good. Resident ratings of overall Water service in East Portland and citywide have remained about the same since 1994. Since 2004, ratings in East Portland have remained about the same while they improved citywide nine percentage points compared to 2013.
Bureau’s work in East
Portland
Community Survey
TrendsQuality rating - water service(percent “good” or “very good”)
0%
25%
50%
75%
100%
1991 1998 2005 2012
EastCity
2013
East
City

37
For the majority of the years we have conducted our Community Sur-vey, residents in East Portland have rated overall Water service quality lower than most other neighborhood district areas.
When rating the quality of tap water, a question that we have asked in our community survey since 2003, East Portland residents’ opinions are generally lower than Portland as a whole. In 2013, 79 percent of East Portland residents rated the quality of tap water as very good or good, while 87 percent of residents citywide rated tap water positively. East Portland resident ratings are about the same as they were in 2004, while citywide, resi-dents’ opinions on tap water have improved 16 percentage points over ten years.
The Water Bureau was not included in the City Budget Offi ce’s bud-get mapping exercise, so the bureau’s adopted budget information specifi c to East Portland is not available to report.
Bureau fi gures from
Budget Maps
Rating rating of tap water (percent “good” or “very good”)
0%
25%
50%
75%
100%
1991 1998 2005 2012
EastCity
2013
East
City

38
The table below contains Water Bureau service level measures for East Portland and citywide for FY 2012, with data provided by the Water Bureau. For more information about the creation of the service level measures, see page 78 of this report.
Portland Water Bureau
Portland Water Bureau
Source: Data provided by Portland Water Bureau. Per capita calculations performed by Audit Services Division.
Service level measure
Number of new water services installed
Feet of new water mains installed
Gallons of water delivered by bureau per 1,000 residents
Number of low income bill discounts granted per 1,000 residents
Value of total low income bill discounts granted per 1,000 residents
Number of leaks or breaks on service lines, valves or hydrants
Number of leaks or breaks on distribution mains
Number of shut off s due to non payment
Incidents of low pressure
Number of dead end mains*
Number of water quality line complaints per 1,000 residents
Percent of area not served by PWB.
Percent of all Water Bureau’s service connections
Citywide
425
31,572
74, 899
29.55
$8,063
227
190
5,589
27
4278
1.17
3.2%
100%
East
Portland
57
5,323
32,578
38.82
$10,982
32
41
1,768
8
909
0.62
12.4%
18.4%
FY 2012
(includes wholesale)
* A dead end main is supplied from a single direction because the other end is not looped back into the system, or the valve at the end is normally closed. This can cause water to sit longer, which can aff ect water taste.
Bureau service level
measures

39

40
Bureau of Environmental Services
Bureau’s work in East
Portland
In addition to the normal wastewater, sewer and storm water services they provide to residents in East Portland, the Bureau of Environmen-tal Services (BES) has focused signifi cant additional attention and funding in East Portland since the area is home to the Johnson Creek and part of the Columbia Slough watersheds. Some of BES’s projects in East Portland include the Mid-County Sewer Project described on page 8, the construction of the Brookside Wetland in 1997, the acquisition of 115 acres in the Big Four Corners area in 2005, and the Mason Flats Wetland enhancement in 2013.
In one major project, BES relocated 60 homes through the willing seller program and restored Johnson Creek back to its normal cur-vature. This reduced the fl ooding and damage that the fl ooding of Johnson Creek historically has caused. According to the manager of the project, the Johnson Creek restoration program is BES’s largest capital project, and BES has spent the most money in East Portland to address notorious fl ooding issues in the area.
BES sign near Johnson Creek
Source: Audit Services Division
41
Community Survey
Trends
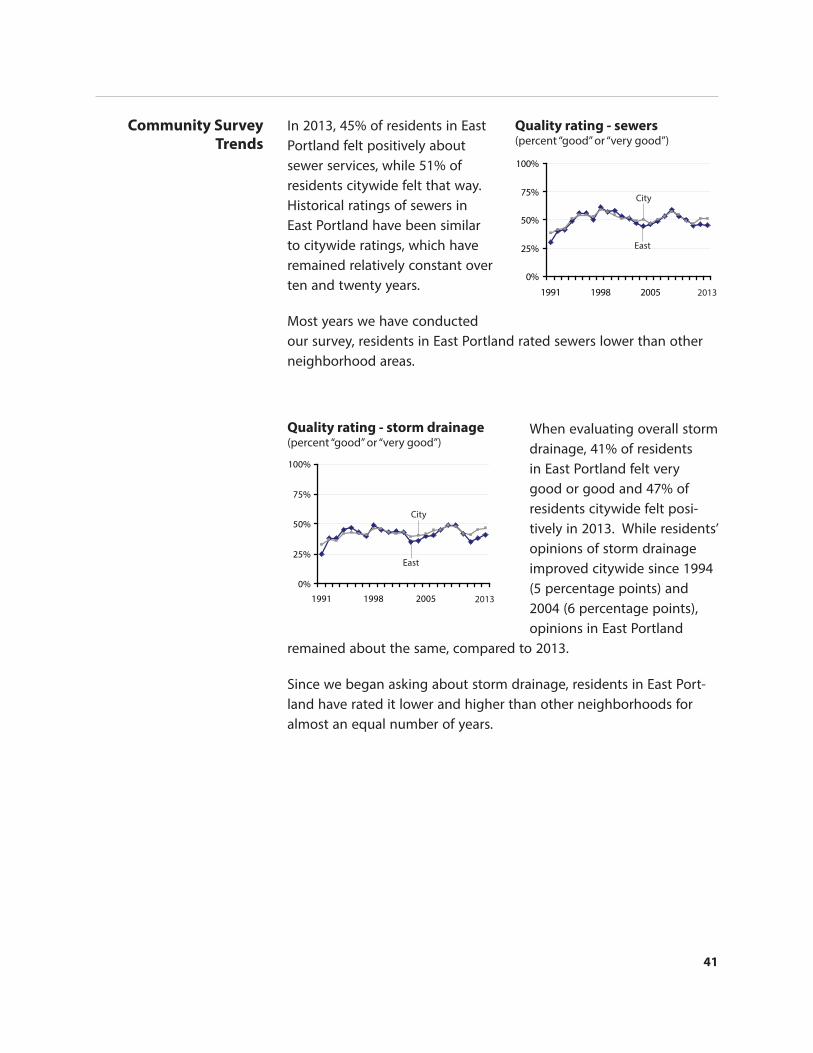
In 2013, 45% of residents in East Portland felt positively about sewer services, while 51% of residents citywide felt that way. Historical ratings of sewers in East Portland have been similar to citywide ratings, which have remained relatively constant over ten and twenty years.
Most years we have conducted our survey, residents in East Portland rated sewers lower than other neighborhood areas.
When evaluating overall storm drainage, 41% of residents in East Portland felt very good or good and 47% of residents citywide felt posi-tively in 2013. While residents’ opinions of storm drainage improved citywide since 1994 (5 percentage points) and 2004 (6 percentage points), opinions in East Portland
remained about the same, compared to 2013.
Since we began asking about storm drainage, residents in East Port-land have rated it lower and higher than other neighborhoods for almost an equal number of years.
Quality rating - sewers (percent “good” or “very good”)
0%
25%
50%
75%
100%
1991 1998 2005 2012
EastCity
2013
East
City
Quality rating - storm drainage (percent “good” or “very good”)
0%
25%
50%
75%
100%
1991 1998 2005 2012
EastCity
2013
East
City

42
Bureau of Environmental Services
BES was not included in the City Budget Offi ce’s budget mapping exercise, so the bureau’s adopted budget information specifi c to East Portland is not available to report.
The table below contains BES service level measures for East Portland and citywide for FY 2012, with data provided by the BES. For more information about the creation of the service level measures, see page 78 of this report.
Bureau fi gures from
Budget Maps
Bureau of Environmental Services
Source: Data provided by Bureau of Environmental Services. Per capita calculations performed by Audit Services Division.
Service level measure
Percent of total acreage served by BES
Number of public sustainable stormwater facilities constructed in the right-of-way
Number of natural area, yard and street trees planted
Acres of natural area and fl ood plain purchased for restoration and protection
Acres of watershed re-vegetated
Linear feet of stream connectivity improved and/or other in-stream improvements
Number of non-conforming sewers connected
Number of sanitary sewer overfl ows impacting buildings (including basements)
Number of sanitary sewer overfl ows impacting streets, ground or water body
Number of complaints of sewage odor from pump stations or treatment facilities
Value of property damage from fl ooding events per 1,000 residents
Funding provided to support community-initiated watershed and stormwater projects per 1,000 residents
Citywide
100%
152
45,438
205
284
3,620
425
149
29.5
90
$241
$1,038
East
Portland
100%
10
18,341
28.4
124
3,100
15
13
3
2
$230
$902
FY 2012
Bureau service level
measures

43

44
Portland Bureau of Transportation
Bureau’s work in East
Portland
Portland Bureau of Transportation (PBOT) is responsible for planning, building, maintaining and managing Portland’s transportation system. PBOT is not responsible for maintaining unpaved streets since streets must meet a certain standard to be considered part of the City’s transportation infrastructure. As noted on page 15 of this report, East Portland was fully annexed into the City of Portland in the 1990s and the area developed with diff erent standards for infrastructure than older areas of the City.
Unimproved street in East Portland
Source: Audit Services Division

45
Early roads and sidewalks in Portland were usually funded by the developer building homes along a street, or by the adjacent prop-erty owners. This was not the standard in the unincorporated parts of Multnomah County and parts of East Portland developed without paved streets and sidewalks. As shown in the service level measure table on page 49, 12 percent of East Portland’s streets were not main-tained by the City in FY 2013, the same percent as the City overall. The percent of busy streets with sidewalks (on both sides) is less equal – in East Portland, 57 percent of busy streets have sidewalks on both sides, while citywide, 76 percent of busy streets have sidewalks on both sides.
As we discussed on page 13 of this report, East Portland developed around the car and there are many multi lane arterials that run through East Portland. As shown in the service level measure table, of the 10 streets in PBOT’s High Crash Corridor program, fi ve of them are located in East Portland. In FY 2012, a quarter of the city’s pe-destrian deaths happened in East Portland, and during 2013, 7 of the City’s 10 pedestrian deaths took place east of 82nd avenue. East Portland’s lack of sidewalks along busy multi-lane roads are regularly cited in the media, by residents, and by policy makers as priority health and safety issues that must be addressed. The City and State have committed funding to build sidewalks in East Portland.
In addition to the commitment to sidewalk funding from elected offi cials, PBOT has committed signifi cant time and resources to improving transportation safety in East Portland. In April 2012, City Council adopted PBOT’s East Portland in Motion (EPIM) plan, which is a 5-year implementation plan for active transportation projects east of 82nd avenue. The plan defi nes active transportation as daily travel powered by human energy including walking, biking, and taking public transportation. EPIM contains prioritized projects that encourage active travel by creating networks of accessible sidewalks, crossings, bikeways and trails. EPIM is the bureau’s implementation plan for the active transportation actions from the East Portland Action Plan (EPAP). When PBOT receives funding for East Portland, they’re able to start a project faster since they avoid much of the planning, prioritizing and approval process because EPIM contains specifi c prioritized projects. According to PBOT staff , as of November 2013, approximately $17.5 million has been spent by the City on EPIM

46
projects and programs. Street paving is not a part of EPIM, since according to PBOT staff , paved streets are not tools of active transpor-tation.
While PBOT is responsible for maintaining transportation infrastruc-ture, PBOT is not responsible for maintaining Portland’s unpaved streets. As noted earlier, improving an unpaved street is the respon-sibility of the adjacent homeowners and until recently, City fi nancing through Limited Improvement Districts (LIDs) was only available for full street improvements which includes curbs, sidewalks on both sides of the streets, and storm water systems. The estimated costs for a full street improvement is $300 a month for 20 years. In 2012, City Council adopted “Out of The Mud,” a plan which allows homeown-ers to improve dirt and gravel streets without building sidewalks and storm water improvements, reducing the monthly cost over 20 years to about $65. Another option for unpaved streets may be available in 2014 when PBOT plans to select four streets where they will test a project allowing residents to make use of the unpaved streets by adding benches, garden plots and rest stops.
In 2013, 49 percent of residents in East Portland felt very good or good about neighborhood street smoothness, while 47 percent of residents citywide felt that way. Residents in East Port-land and Portland as a whole feel worse about street smooth-ness in 2013 than they did in both 2004 and 1994. Since 1994, ratings in both East Port-land and citywide dropped 13 percentage points. Since 2004, ratings in East Portland dropped 12 percentage points and ratings citywide dropped 6 percentage points.
Portland Bureau of Transportation
Community Survey
Trends
Street smoothness (percent “good” or “very good”)
0%
25%
50%
75%
100%
1991 1998 2005 2012
EastCity
City
East
2013

47
In 2013, 33 percent of resi-dents in East Portland rated overall street maintenance as very good or good, while 32 percent of residents citywide rated it that way. Ratings of overall street maintenance have dropped since 1994 in both East Portland (19 per-centage point decline) and at the citywide level (18 per-centage point decline). 2004
ratings in East Portland were about the same as ratings in 2013, while they dropped 8 percentage points at the citywide level.
In the majority of our community surveys, East Portland residents have rated street maintenance lower than residents in most other neighborhood district areas.
In 2013, 57 percent of residents in East Portland and 56 percent citywide rated street lighting positively, about the same as they did in 2004. Positive ratings of street lighting dropped in East Port-land (13 percentage points) and at the citywide level (6 percentage points) since 1994.
Residents in East Portland have rated street lighting high-er than residents in most other neighborhood district areas in the majority of our community surveys.
Overall street maintenance (percent “good” or “very good”)
0%
25%
50%
75%
100%
1991 1998 2005 2012
EastCity
East
City
2013
Overall street lights (percent “good” or “very good”)
0%
25%
50%
75%
100%
1991 1998 2005 2012
EastCity
2013
City
East

48
The table below contains two years of PBOT’s adopted budget ex-penses for East Portland and the city as a whole from budget maps produced by the City Budget Offi ce. Budget maps off er a partial pic-ture of City spending in Portland’s neighborhood district areas. For more information about the City’s budget mapping process, see page 17 of this report.
The table on the next page contains PBOT’s service level measures for East Portland and citywide for FY 2012, with data provided by the PBOT. For more information about the creation of the service level measures, see page 78 of this report.
Portland Bureau of Transportation
Bureau fi gures from
Budget Maps
Bureau service level
measures
Portland Bureau of Transportation Adopted Budget
Source: Data from FY ‘11-FY ‘13 City Budget Offi ce Budget Maps. Local share represents approved budget expenses that bureaus plan to spend in a specifi c geography. Citywide share represents the remaining approved budget expenses based on a geographic area’s users (residents and daytime employees). Due to rounding, some totals may not sum.
East Portland
Local operating share
Citywide operating share
Total operating
Local operating share per user
Citywide operating share per user
Total operating per user
Local capital share
Citywide capital share
Total capital
Local capital share per user
Citywide capital share per user
Total capital per user
East Portland major maintenance
Portland (entire city)
Allocated (local) operating expenses
Unallocated (citywide) operating expenses
Fund level expenses
Capital expenses
Total bureau expenses
All Portland major maintenance
2012-2013
$0.6 M
$17.6 M
$18.2 M
$3
$91
$94
$16.3 M
$1.7 M
$17.9 M
$84
$9
$93
$0.8 M
2012-2013
$29.3 M
$86.8 M
$50.2 M
$173.5 M
$339.8 M
$7.54 M
2011-2012
$0.2 M
$19.3 M
$19.5 M
$1
$101
$102
$10.3 M
$3.0 M
$13.3 M
$54
$16
$69
$0.8 M
2011-2012
$21.5 M
$94.9 M
$39.7 M
$102.8 M
$258.9 M
$7.54 M
2010-2011*
not comparable
not comparable
not comparable
not comparable
not comparable
not comparable
not comparable
not comparable
not comparable
not comparable
not comparable
not comparable
not comparable
2010-2011*
not comparable
not comparable
not comparable
not comparable
not comparable
not comparable
* Note, due to methodology change after FY ‘11, FY ‘11 numbers for capital bureaus are not comparable.

49
Portland Bureau of Transportation
Source: Data provided by Portland Bureau of Transportation.
Service level measure
Percent of busy streets (arterials & collectors) with sidewalks (both sides)*
Miles of bikeways
Percent of existing miles of bikeways compared to recommended miles in the Portland Bicycle Master Plan for 2030
Number of high crash corridors
Percent of walking and biking trips to school (K-5)
Percent of residents using bikes (all trips)
Percent of residents walking (all trips)
Percent of residents taking transit (all trips)
Percent of residents driving (all trips)
Number of Injury crashes (all non-fatal injuries: pain, non-incapacitating, incapacitating)
Number of fatal crashes
Number of bike crashes
Number of fatal bike crashes
Number of pedestrian crashes
Number of fatal pedestrian crashes
Percent of households within 1/2 mile of a Neighborhood Greenway, or low stress bike facility (trail, cycle track)
Percent of students reached with Safe Routes to School programming annually by district (K-5 only)
Percent of corners with ADA ramps*
Percent of corners with detectable warning strip*
Percentage of arterial and collector streets in fair or better condition
Center line miles of unpaved streets
Number of traffi c signals
Number of street lights
Number of traffi c signal failures that occur annually
Percent of non-City maintained streets*
Citywide
76%
349
40%
10
43%
6%
15%
7%
72%
5,500
34
297
2
227
8
60%
~95%+
47%
16%
64%
95.5
911
55,568
159
12%
East
Portland
57%
68
46%
5 (includes 82nd Ave.)
45%
2%
10%
7%
81%
1,312
14
46
2
52
2
28%
~95%+
41%
14%
69%
12.5
101
10,743
24
12%
FY 2012, with the exception of measures with *, which are FY ‘13

50
Portland Parks and Recreation
East Portland Community Center
Source: Audit Services Division
Bureau’s work in East
Portland
The mission of Portland Parks & Recreation (PP&R) is to help Port-landers play by providing safe places, facilities, and programs that promote physical, mental, and social activity. Many parts of East Portland are park defi cient, which is in part related to the fact that most of East Portland did not become part of the City of Portland un-til the1980s and 1990s, well after the City planned much of its parks system.
When the City acquired East Portland, there were about 25 largely undeveloped and semi-developed neighborhood parks that were transferred to the City. Multnomah County had stopped maintain-ing all neighborhood parks in 1981, years before they were acquired by the City of Portland. After annexation, PP&R was responsible for improving the newly acquired parks and for developing new parks in the area. Some improvements and developments have been made. For example, the East Portland Community Center was constructed in 1998 and an aquatic center was added to the Center in 2008.

51
Today, there are 30 developed parks in East Portland, but only 63 percent of residents live within half a mile of a park compared to 80 percent citywide. PP&R has spent about $32 million to acquire land in East Portland where they plan to develop parks; however, these de-velopments will not be possible without new funding sources. PP&R is considering going out for a bond measure that would in part help fund parks development in East Portland.
In order to make parks improvements in East Portland before going out for a bond measure, PP&R launched the E205 project in 2012. The E205 project cost about $800,000, most of which came from the City, and the rest through donations, grants, and system develop-ment charges. Through the E205 program, 12 underdeveloped parks in East Portland received small scale improvements like new and refurbished playground equipment, park benches, soft-surface trails, fenced dog off -leash areas, and water fountains. In addition, PP&R and its partners also invested in special projects such as a bicycle pump track at Ventura Park and a community garden at Ed Benedict Park.
East Portland Aquatic Center
Source: Audit Services Division

52
Portland Parks and Recreation
Community Survey
Trends
A project designed to meet the summer recreation needs of children in spite of there being fewer parks in East Portland is the mobile play ground program. In this program, two PP&R temporary staff take a van fi lled with recreational equipment to predetermined location such as parks, churches or apartment complexes once a week for the entire summer where they lead and supervise children in recreational activities. Between 2009 and 2011, one van served 10 mobile play-ground sites around the city, 3 of which were in East Portland. As noted on page 84 of this report, in 2012, the East Portland Action plan funded an additional van to serve 10 additional East Portland sites through one of their community grants.
In January 2014, PP&R announced they would spend an estimated $12.4 million building Beech Park and Gateway Park and Plaza in East Portland. PP&R estimates that construction will be complete in 2017.
In 2013, 67 percent of resi-dents in East Portland rated park closeness in their neigh-borhood as very good or good, while 85 percent of residents citywide felt posi-tively about park closeness. Since we began asking resi-dents about park closeness in 1998, resident ratings in East Portland have been about the same, but citywide, ratings rose 6 percentage points from 79 percent. Residents in East Portland and citywide felt about the same about closeness of parks in 2013 as they did in 2004.
Neighborhood park closeness (percent “good” or “very good”)
0%
25%
50%
75%
100%
1991 1998 2005 2012
EastCity
City
East
2013

53
Overall quality of parks (percent “good” or “very good”)
0%
25%
50%
75%
100%
1991 1998 2005 2012
EastCity
City
East
2013
Overall quality of recreation (percent “good” or “very good”)
0%
25%
50%
75%
100%
1991 1998 2005 2012
EastCity
City
East
2013
In 2013, 70 percent of residents in East Portland rated the overall quality of parks as very good or good, while 86 percent of residents
citywide rated overall parks quality positively. Residents in East Portland feel about the same as they did in 2004 and 1994 about parks quality, while citywide, residents rated parks quality 9 percentage points higher in 2013 than they did in 2004 and 1994.
For 22 years, residents in East Portland have rated overall Parks quality lower than all other neigh-borhood district areas. One year, East and North Portland were tied for the lowest rating.
In 2013, 62 percent of resi-dents in East Portland rated the overall quality of recre-ational centers and activities as very good or good, while 76 percent of residents city-wide rated them positively. East Portland residents’ ratings showed little change from 2004 and 1994, but ratings at the citywide level improved 5 percentage points from 2004, and 8 percentage points from 1994 compared to 2013.
For 21 of 23 years of Community Surveys, East Portland residents have rated the overall quality of recreational centers and activities lower than residents in all other neighborhood district areas.
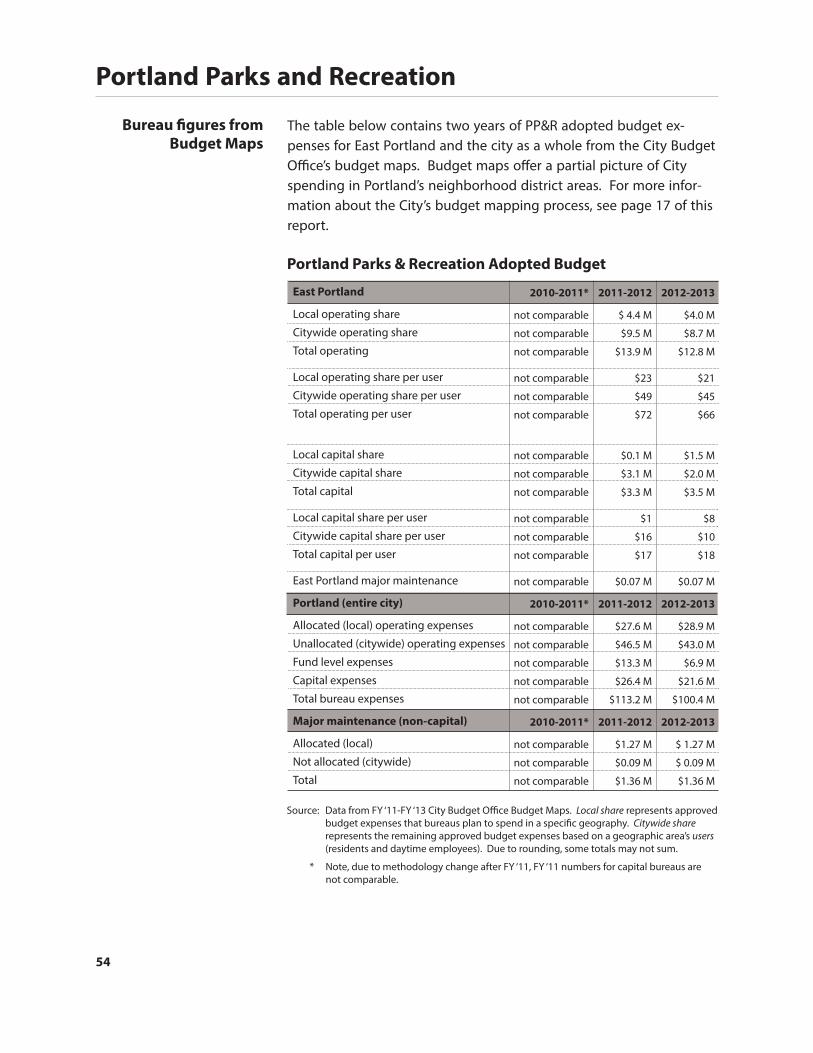
54
Portland Parks and Recreation
Bureau fi gures from
Budget Maps
The table below contains two years of PP&R adopted budget ex-penses for East Portland and the city as a whole from the City Budget Offi ce’s budget maps. Budget maps off er a partial picture of City spending in Portland’s neighborhood district areas. For more infor-mation about the City’s budget mapping process, see page 17 of this report.
Portland Parks & Recreation Adopted Budget
Source: Data from FY ‘11-FY ‘13 City Budget Offi ce Budget Maps. Local share represents approved budget expenses that bureaus plan to spend in a specifi c geography. Citywide share represents the remaining approved budget expenses based on a geographic area’s users (residents and daytime employees). Due to rounding, some totals may not sum.
East Portland
Local operating share
Citywide operating share
Total operating
Local operating share per user
Citywide operating share per user
Total operating per user
Local capital share
Citywide capital share
Total capital
Local capital share per user
Citywide capital share per user
Total capital per user
East Portland major maintenance
Portland (entire city)
Allocated (local) operating expenses
Unallocated (citywide) operating expenses
Fund level expenses
Capital expenses
Total bureau expenses
Major maintenance (non-capital)
Allocated (local)
Not allocated (citywide)
Total
2012-2013
$4.0 M
$8.7 M
$12.8 M
$21
$45
$66
$1.5 M
$2.0 M
$3.5 M
$8
$10
$18
$0.07 M
2012-2013
$28.9 M
$43.0 M
$6.9 M
$21.6 M
$100.4 M
2012-2013
$ 1.27 M
$ 0.09 M
$1.36 M
2011-2012
$ 4.4 M
$9.5 M
$13.9 M
$23
$49
$72
$0.1 M
$3.1 M
$3.3 M
$1
$16
$17
$0.07 M
2011-2012
$27.6 M
$46.5 M
$13.3 M
$26.4 M
$113.2 M
2011-2012
$1.27 M
$0.09 M
$1.36 M
2010-2011*
not comparable
not comparable
not comparable
not comparable
not comparable
not comparable
not comparable
not comparable
not comparable
not comparable
not comparable
not comparable
not comparable
2010-2011*
not comparable
not comparable
not comparable
not comparable
not comparable
2010-2011*
not comparable
not comparable
not comparable
* Note, due to methodology change after FY ‘11, FY ‘11 numbers for capital bureaus are not comparable.

55
Bureau service level
measures
The table below contains PP&R service level measures for East Port-land and citywide for FY 2012, with data provided by PP&R. For more information about the creation of the service level measures, see page 78 of this report.
Portland Parks & Recreation
Source: Data provided by Portland Parks & Recreation
Service level measure
Households within .5 miles of parks
Acres owned & managed by PP&R
Acres of developed parks
Households within 3 miles of community center
Number of summer play ground programs
Number of parks (developed)
Playgrounds
Restrooms (permanent buildings)
Miles of regional trails
Baseball diamonds/softball fi elds - City owned only
Basketball hoops
Sports fi elds (soccer/football) - City owned only
Outdoor swimming pools
Indoor swimming pools
Acres of natural area
Number of community gardens
Citywide
79%
11,415
3,433
69%
47
203
125
97
152
123
229
109
7
6
7,762
48
East
Portland
62%
1,517
212
69%
18
29
25
9
20.5
17
28
18
0
1
1,195
8
FY 2012

56
Portland Development Commission
Bureau’s work in East
Portland
The Portland Development Commission (PDC) is the City’s urban renewal and economic development agency. Urban renewal is a state-authorized, redevelopment and fi nance program designed to help improve and redevelop Urban Renewal Areas (URAs) that are physically deteriorated, suff ering economic stagnation, unsafe or poorly planned. The boundaries of URAs are established by City Council and PDC focuses on implementing plans for the area that include commercial, retail, residential/mixed use, transportation and parks development. There are three URAs in East Portland—the Lents URA, Gateway URA and the Airport Way URA.
In addition to the three traditional URAs in East Portland, four of PDC’s six Neighborhood Prosperity Initiative (NPI) areas are located fully or partially in East Portland—Division-Midway, 82nd and Di-vision, Rosewood, and Parkrose. NPIs are small URAs focused on neighborhood commercial areas and are managed by local com-munities. NPIs generate property tax revenue that fund capital improvement projects such as interior and storefront improvements, street furniture, trash cans, lighting, district signage, gateway markers, and other small-scale, permanent capital improvements.
90 percent of PDC’s funding for projects and programs comes from Tax Increment Financing debt proceeds, which are generated through urban renewal, so most of PDC’s work is restricted to URAs and NPIs. As noted in the service level table on page 59, 44% of the City’s total URA (traditional and NPI) acres are located fully or partially in East Portland.

57
Community Survey
Trends
In 2013, 70% of residents in East Portland rated neighbor-hood livability as very good or good, while 88% of residents citywide felt positively about neighborhood livability. East Portland resident ratings in 2013 are about the same as they were in 2004 and 1994. Citywide, 2013 ratings are fi ve percentage points higher than they were in 2004, and 10 percentage points higher than they were in 1994.
Since 2002, residents in East Portland have rated neighborhood liv-ability lower than residents in all other neighborhood district areas.
When rating overall city livability in 2013, 63 percent of residents in East Portland rated it as very good or good, while 80 percent of residents citywide rated it positively. Ratings in East Portland have
been lower than the citywide average every year that we have asked about city livability in our annual community sur-vey. Residents in East Portland and the city as a whole rated city livability about the same as they did in 2004 and 1998 when we began asking the question.
Each year we have asked residents their opinions on City livability (15 years), residents in East Portland have rated it the lowest of all neigh-borhood district areas.
Overall city and neighborhood livability is not the job of PDC alone, but we report on these questions in relation to PDC, since they state that they play a major role in making Portland one of America’s most livable cities.
Overall city livability(percent “good” or “very good”)
0%
25%
50%
75%
100%
1991 1998 2005 2012
East
City
2013
Neighborhood livability(percent “good” or “very good”)
0%
25%
50%
75%
100%
1991 1998 2005 20122013
East
City

58
Portland Development Commission
The table below contains two years of PDC’s adopted budget ex-penses for East Portland and the city as a whole from the City Budget Offi ce’s budget maps. Budget maps off er a partial picture of City spending in Portland’s neighborhood district areas. For more infor-mation about the City’s budget mapping process, see page 17 of this report.
Bureau fi gures from
Budget Maps
Portland Development Commission
Resources Budget
East Portland
Local share
Citywide share
Total
Local share per user
Citywide share per user
Total per user
Portland (entire city)
Allocated (local) bureau expenses
Unallocated (citywide) bureau expenses
Transfers
Contingency
Total bureau expenses
2012-2013
$21.2 M
$3.0 M
$24.3 M
$110
$16
$126
2012-2013
$153.5 M
$14.9 M
$14.9 M
$34.1 M
$217.4 M
2011-2012
$24.7 M
$3.08 M*
$27.8 M*
$129
$16*
$145*
2011-2012
$179.8 M
$15.1 M*
not tracked
not tracked
$194.9 M*
2010-2011
not tracked
not tracked
not tracked
not tracked
not tracked
not tracked
2010-2011
not tracked
not tracked
not tracked
not tracked
not tracked
Source: Data from FY ‘11-FY ‘13 City Budget Offi ce Budget Maps. Local share represents approved budget expenses that bureaus plan to spend in a specifi c geography. Citywide share represents the remaining approved budget expenses based on a geographic area’s users (residents and daytime employees). Due to rounding, some totals may not sum.
* Note, according to PDC, there was an error in their published FY ‘12 budget map. These are revised fi gures provided by PDC and diff er from fi gures in the published PDC FY ‘12 budget map.

59
The table below contains PDC’s service level measures for East Port-land and citywide for FY 2012, with data provided by PDC. For more information about the creation of the service level measures, see page 78 of this report.
Bureau service level
measures
Portland Development Commission
Service level measure
Commercial Property Redevelopment Loans awarded
Business Finance Loans awarded
Grants awarded
Main Streets and NPI District Grants awarded
Community Livability Grants awarded
Total value of loans and grants awarded
Commercial Property Redevelopment Loans budgeted
Business Finance Loans budgeted
Grants budgeted
Main Streets and NPI District Grants budgeted
Community Livability Grants budgeted
Total value of loan and grant funds budgeted
Clients served through small business technical assistance*
Clients served through Economic Opportunity Initiative Workforce (youth and adult)*
Acreage that is part of a URA
Employment change (from 2010 to 2011)*
Citywide
$400,000
$442,991
$2,900,312
$234,000
$430,679
$4,407,982
$6,360,071
$10,936,420
$6,746,430
$446,528
$602,217
$25,091,666
437
1,895
13,226 acres (14.2% of total
city acreage)
2.3% increase
East
Portland
$0
$60,000
$971,156
$40,000
$80,310
$1,151,466
$550,000
$2,180,000
$1,733,680
$0**
$108,000
$4,571,680
96
402
5,850 acres (6.3% of total city
acreage, 44.2% of URA acreage)
0.3% increase
FY 2012
Source: Data provided by Portland Development Commission
Note: Data is for URAs and NPIs located fully or partially in East Portland, with the exception of * indicators, which are for the EPNO area
** NPIs did not start generating TIF revenue until FY ‘14

60
Portland Housing Bureau
Bureau’s work in East
Portland
The Portland Housing Bureau’s (PHB) mission is to solve the unmet housing need of the people of Portland. PHB staff provide few direct services, rather, they set housing policy, provide funding and man-age contracts with third parties like developers and not-for-profi t agencies that provide housing related services. Since rents are lower in East Portland than the City as a whole, according to PHB management, the market is providing suffi cient aff ordable housing opportunities in East Portland. In general, PHB focuses on housing rehabilitation and homeownership programs in East Portland more so than in building new aff ordable housing there.
Two Urban Renewal Areas (URA) in East Portland receive PHB fund-ing—the Lents URA and the Gateway URA. PHB administers funding intended to preserve or create aff ordable housing within URAs (how-ever, they do not administer housing development funding to the Airport Way URA). PHB administers federal, general fund and urban renewal funds throughout the city to support aff ordable housing including short-term rent assistance, home repair projects, down pay-ment assistance, housing acquisition and rehabilitation. According to the former Assistant Director of PHB, there is a lot of housing related money invested in East Portland due to the two URAs there, with Lents receiving more than Gateway.
PHB recently completed a housing opportunity analysis that sum-marizes the result of their work to map amenities including access to education, healthy food, employment, family wage jobs and trans-portation (PHB calls these amenities “opportunities”). PHB wants to develop housing in areas with high levels of opportunities, since these areas usually have little market driven aff ordable housing, and so that vulnerable populations can take advantage of the area’s ame-nities. PHB plans to use the housing opportunity analysis to direct their investments around the City.

61
Community Survey
Trends
In 2013, 58 percent of resi-dents in East Portland rated housing aff ordability as very good or good, while city-wide, 45 percent of residents felt positively about hous-ing aff ordability. Since we began asking residents about housing aff ordability in our annual community survey in 1997, residents in East Portland have had more positive feelings than residents citywide. In 2013, residents’ ratings in East Portland were about the same as they were in 2004 and in 1997. Citywide, residents feel better about housing aff ordability than they did in 2004 (4 percentage points) and in 1997 (4 percentage points).
Physical condition of housing(percent “good” or “very good”)
0%
25%
50%
75%
100%
1991 1998 2005 2012
East
City
2013
Neighborhood housing aff ordability(percent “good” or “very good”)
0%
25%
50%
75%
100%
1991 1998 2005 2012
East
City
2013
In 2013, 52 percent of residents in East Portland rated the physi-cal condition of housing as very good or good, while 69 percent of
residents citywide rated it positively. Residents in East Portland feel less positive about the physical condi-tion of housing in 2013 than they did in 1997 (15 percent-age point decline) when we began asking this questions, while residents citywide feel about the same. Residents in East Portland and the city as
a whole rated the physical condition of housing about the same in 2013 as they did in 2004.

62
Portland Housing Bureau
Bureau fi gures from
Budget Maps
The table below contains two years of PHB’s adopted budget ex-penses for East Portland and the city as a whole from the City Budget Offi ce’s budget maps. Budget maps off er a partial picture of City spending in Portland’s neighborhood district areas. For more infor-mation about the City’s budget mapping process, see page 17 of this report.
Portland Housing Bureau Adopted Operating Budget
Source: Data from FY ‘11-FY ‘13 City Budget Offi ce Budget Maps. Local share represents approved budget expenses that bureaus plan to spend in a specifi c geography. Citywide share represents the remaining approved budget expenses based on a geographic area’s users (residents and daytime employees). Due to rounding, some totals may not sum.
East Portland
Local share
Citywide share
Total
Local share per user
Citywide share per user
Total per user
Portland (entire city)
Allocated (local) bureau expenses
Unallocated (citywide) bureau expenses
Fund level expenses
Capital expenses
Total bureau expenses
2012-2013
$10.9 M
$7.3 M
$18.2 M
$56
$38
$94
2012-2013
$62.2 M
$36.1 M
$4.4 M
$0.0 M
$102.7 M
2011-2012
$6.9 M
$8.1 M
$15.0 M
$36
$42
$78
2011-2012
$59.4 M
$39.9 M
$2.1 M
$0.0 M
$101.4 M
2010-2011
not tracked
not tracked
not tracked
not tracked
not tracked
not tracked
2010-2011
not tracked
not tracked
not tracked
not tracked
not tracked

63
Bureau service level
measures
The table below contains PHB’s service level measures for East Port-land and citywide for FY 2012, with data provided by PHB. For more information about the creation of the service level measures, see page 78 of this report.
Portland Housing Bureau
Source: Data provided by Portland Housing Bureau
Program/measure
Short term rent assistance (STRA)
Rental investments (units)
HUD grants for lead abatement
Home repair funds (major)
Home repair program (minor)
Down payment assistance
Limited tax exemptions
System development credits
Mortgage tax certifi cates
Average rent
Homelessness count
Dollars Spent
$237,331
$730,872
$37,755
$49,452
$275,000
$428,600
$82,863
$736,556
$117,659
$752
NA
FY 2012
Number
177
24
6
4
207
12
56
48
17
4,666
103
Dollars Spent
$840,425
$14,002,539
$668,154
$498,257
$1,120,000
$951,202
$155,603
$1,428,254
$738,506
$898
NA
Number
524
368
57
37
1,269
26
106
102
99
16,436
1,328
East Portland Citywide

64
Bureau of Development Services
The Bureau of Development Services (BDS) applies and enforces the City’s building, development, land use, and some local livability codes. As opposed to providing a blanket service across Portland, the work of BDS is demand driven and fee based. BDS reviews build-ing plans, issues permits, and performs building related inspections when requested. They also perform livability related inspections after receiving a complaint. As such, BDS managers point out that today, much of their work is focused on the central city since that is where a lot of development is taking place.
One BDS program that is unique to part of East Portland is the Enhanced Complaint Inspection Program, which is operational only south of Burnside and east of 82nd avenue. When there is a com-plaint regarding a condition in a rental unit in Portland, BDS’ standard inspection model allows inspectors to inspect only the residence or unit the complaint was made against.
The Enhanced Complaint Inspection Program is also complaint driven initially, but if an inspector fi nds a certain threshold of violations in a unit and/or building exterior, they can inspect other units in the building owner’s portfolio. The additional inspections can be denied by the building’s landlord, but according to the Program’s manager, two-thirds of landlords agree to the additional inspections. The Program manager told us that the Program is good for East Port-land because there is a lot of muti-family rental housing units built in the 1960’s and 1970’s that is of poor quality, and many units have metal windows and baseboard heat that contribute to mold. The manager added that there are more vulnerable populations living in East Portland and they may not be aware of BDS or feel comfortable complaining to a public agency about their housing condition due to fear of landlord retaliation.
Bureau’s work in East
Portland

65
Between 1994 and 2009, we asked residents in our annual survey about their opinions on housing and nuisance inspections in a combined question. Most years, resi-dents in East Portland rated housing and nuisance inspec-tions lower than residents citywide. In 2010, we began asking residents their opin-ions on housing inspections separately from their opin-ions on nuisance inspections. Since then, residents in East Portland and citywide have rated housing inspections more positively than nui-sance inspections most years.
BDS was not included in the City Budget Offi ce’s budget mapping exercise, so the bureau’s adopted budget information specifi c to East Portland is not available to report.
Community Survey
Trends
Housing Inspections(percent “good” or “very good”)
0%
25%
50%
75%
100%
1991 1998 2005 2012
Housing & NuisanceCombined
Housingonly
East
City City
East
2013
Nuisance Inspections(percent “good” or “very good”)
0%
25%
50%
75%
100%
1991 1998 2005 2012
Housing & NuisanceCombined
Nuisanceonly
City
East
City
East
2013
Bureau fi gures from
Budget Maps

66
Bureau of Development Services
The table below contains BDS’s service level measures for East Port-land and citywide for FY 2012, with data provided by BDS. For more information about the creation of the service level measures, see page 78 of this report.
Bureau service level
measures
Bureau of Development Services
Source: Data provided by Bureau of Development Services.
Service level measure
Number of residential building permits issued
Number of commercial building permits issued
Number of residential construction inspections
Number of commercial construction inspections
Number of enhanced housing inspections
Number of housing units inspected (enhanced inspections)
Number of nuisance inspections
Number of community outreach events
Number of landlord trainings
Citywide
3,891
2,554
50,989
11,967
878
1,416
6,318
10
7
East
Portland
464
273
6,246
1,315
878
1,416
1,267
1
1
FY 2012

67

68
Bureau of Planning and Sustainability
The Bureau of Planning and Sustainability (BPS) is responsible for a variety things including land use planning, research, urban design, and environmental/sustainability related policy making regarding energy use, green building, and household waste.
BPS has a district liaison program that began in 2003. BPS splits Portland into six sections – East, Southeast, Northeast, North, West and Central City – each areas has a BPS staff person assigned who is responsible for serving as a liaison between the City and the com-munity. The district liaisons are also supposed to serve as technical advisors for neighbors, organizations, businesses and institutions. BPS coordinates with various other City bureaus on their work, and the bureaus are supposed to involve the BPS district liaison in work taking place in that part of the City.
BPS creates plans to guide the City like the Comprehensive Plan, the Portland Plan and the Climate Action Plan, in addition to area specifi c plans including some focused on East Portland. Over the years, BPS and the former Bureau of Planning have issued a number of plan-ning documents and reports related to East Portland. BPS staff were responsible for coordinating with the outside consultant to organize the East Portland Action Plan (EPAP) meetings and to produce the fi nal EPAP document. Today, the East Portland liaison works closely with EPAP in a staff person capacity. Other projects BPS has carried out in East Portland include the 122nd Ave Rezoning Project, and the Healthy Homes Project, both in 2012.
BPS is currently updating the City’s Comprehensive Plan. There are eight Policy Expert Groups (PEGs) that help develop, review and pro-vide comments to City staff on proposed policy recommendations. According to BPS management, many of the PEGs spent considerable time focusing on equity issues in East Portland. During community planning meetings, infrastructure equity was something that the community said was important. As such, the Infrastructure PEG was formed and charged with evaluating the Comprehensive Plan Up-date’s goals and policies with an eye towards infrastructure equity in order to help avoid unintended consequences of planning decisions. In addition to numerous community members, representatives from
Bureau’s work in East
Portland

69
TriMet, Multnomah County, and Portland Public Schools, the Infra-structure Equity PEG has members from a number of City bureaus – Offi ce of Neighborhood Involvement, Bureau of Environmental Ser-vices, Offi ce of Management and Finance, Offi ce of Equity and Human Rights, Bureau of Planning and Sustainability, Water Bureau, Bureau of Transportation, and Parks & Recreation. Staff from infrastructure bureaus created service level maps that were discussed at PEG meet-ings. Some bureau maps like Parks and Transportation highlighted infrastructure diff erences in East Portland. The Infrastructure Equity PEG provided their feedback on the Comprehensive Plan Update document, which was being edited at the time we wrote this report.
In 2013, 22 percent of East Portland residents and 40 percent of residents citywide rated the City’s job of planning for future land use as very good or good. Resi-dents in East Portland have historically rated land use planning lower than the city as a whole, but ratings at both the citywide level and in East Portland are about the same as they were in 2004 and 1998 when we began asking this question.
Residents in East Portland have rated the City’s job in planning for future land use lower than all other neighborhood district areas 15 of the 16 years since 1998.
Community Survey
Trends
Planning for future land use(percent “good” or “very good”)
0%
25%
50%
75%
100%
1991 1998 2005 2012
EastCity
East
City
2013

70
Bureau of Planning and Sustainability
The table below contains two years of the Bureau of Planning and Sustainability’s adopted budget expenses for East Portland and the city as a whole from the City Budget Offi ce’s budget maps. Budget maps off er a partial picture of City spending in Portland’s neighbor-hood district areas. For more information about the City’s budget mapping process, see page 17 of this report.
Bureau fi gures from
Budget Maps
Bureau of Planning and Sustainability
Adopted Operating Budget
Source: Data from FY ‘11-FY ‘13 City Budget Offi ce Budget Maps. Local share represents approved budget expenses that bureaus plan to spend in a specifi c geography. Citywide share represents the remaining approved budget expenses based on a geographic area’s users (residents and daytime employees). Due to rounding, some totals may not sum.
East Portland
Local share
Citywide share
Total
Local share per user
Citywide share per user
Total per user
Portland (entire city)
Allocated (local) bureau expenses
Unallocated (citywide) bureau expenses
Fund & other expenses
Total bureau expenses
2012-2013
$0.1 M
$3.9 M
$4.0 M
$0
$20
$21
2012-2013
$1.6 M
$19.4 M
$1.6 M
$22.6 M
2011-2012
$0.1 M
$5.6 M
$5.7 M
$1
$29
$30
2011-2012
$1.7 M
$27.4 M
$1.8 M
$30.8 M
2010-2011
not tracked
not tracked
not tracked
not tracked
not tracked
not tracked
2010-2011
not tracked
not tracked
not tracked
not tracked

71
The table below contains BPS’s service level measures for East Port-land and citywide for FY 2012, with data provided by BPS. For more information about the creation of the service level measures, see page 78 of this report.
Bureau service level
measures
Bureau of Planning and Sustainability
Service level measure
District focused planning projects
District focused implementation projects
Number of public contacts
Businesses assisted through Sustainability at Work Program
Curbside recovery rate (residential)*
Number of district liaisons
Citywide
6
4
36,756
933
70.1%
7
East
Portland
0
2
5,550
74
70.1%
1
FY 2012
Source: Bureau of Planning and Sustainability
* Based on tonnage reported by Portland’s residential waste collectors for calendar year 2012. Percentages do not include commercial, multifamily and dropped off material.

72
Offi ce of Neighborhood Involvement (ONI)
The Offi ce of Neighborhood Involvement (ONI) serves as a communi-cation link between community members, neighborhoods, and City bureaus. The bureau partners with organizations including Neighbor-hood Associations, Neighborhood District Coalitions, Business District Associations, City bureaus, and a wide range of community organiza-tions to involve and inform the public in City government. ONI also provides neighborhood livability direct services as well as information and referral.
ONI coordinates Portland’s “neighborhood network”, a system of 95 neighborhood associations and seven geographically-based neigh-borhood district offi ces or coalitions. Funding for neighborhood district offi ces/coalitions comes from ONI. The East Portland Neigh-borhood Offi ce (EPNO) is one of Portland’s seven neighborhood districts. The manager of EPNO explained that the work of the offi ce is to support Neighborhood Associations and volunteers doing work in the community. EPNO supports neighborhood events like clean-ups, they advocate for East Portland with public agencies, and is focused on ongoing community involvement designed to build social infrastructure.
ONI is reevaluating how money is distributed to neighborhood areas with an eye towards giving more funding to offi ces/coalitions that serve larger and less affl uent populations. If the changes are imple-mented, EPNO will likely receive more money once the new fi nding structure is in place.
The East Portland Action Plan became part of the Offi ce of Neighbor-hood Involvement’s budget in 2011. ONI’s 2013-14 adopted budget included a note that read, “The FY 2013-14 budget includes one-time funding for the East Portland Action Plan. The Offi ce of Neighbor-hood Involvement is directed to work with the relevant parties to develop a plan to complete work associated with the plan and wrap up uncompleted tasks.” ONI management told us that EPNO and EPAP are not duplicative eff orts and they hope the Mayor will contin-ue to fund EPAP after this fi scal year. ONI’s 2014-15 requested budget includes $300,000 in one-time funding for EPAP. After we wrote a draft of this report, ONI began a project to assess the future of EPAP.
Bureau’s work in East
Portland
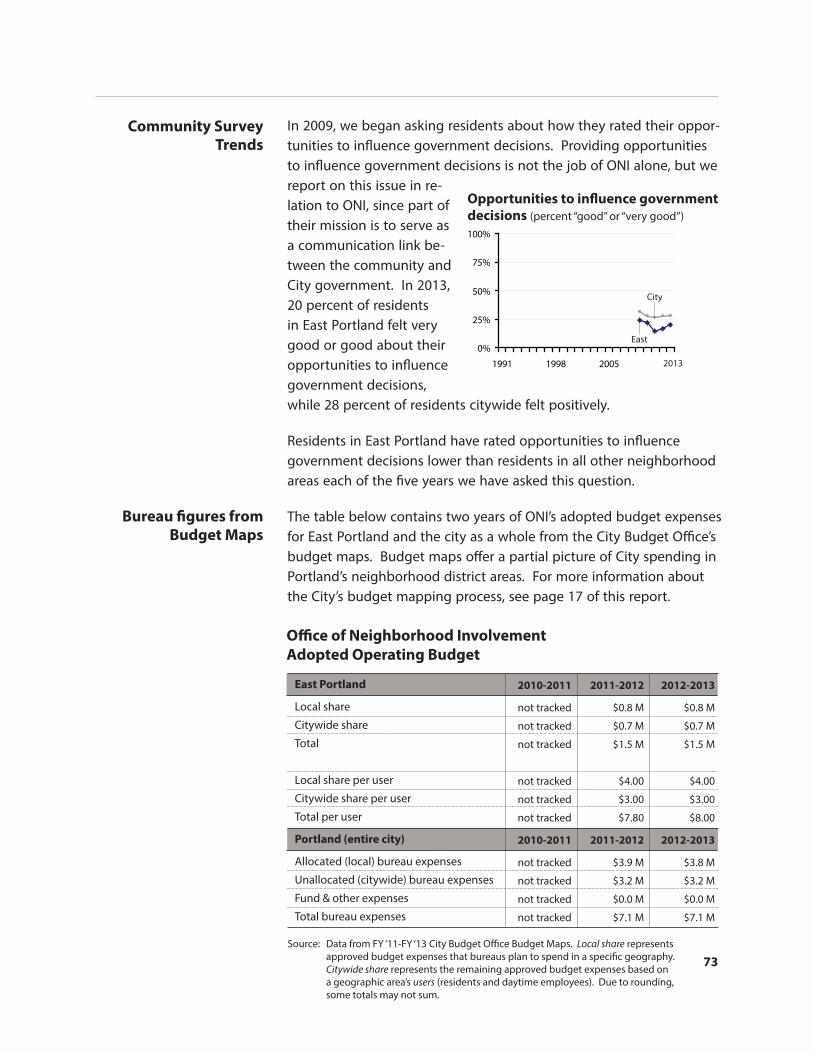
73
In 2009, we began asking residents about how they rated their oppor-tunities to infl uence government decisions. Providing opportunities to infl uence government decisions is not the job of ONI alone, but we report on this issue in re-lation to ONI, since part of their mission is to serve as a communication link be-tween the community and City government. In 2013, 20 percent of residents in East Portland felt very good or good about their opportunities to infl uence government decisions, while 28 percent of residents citywide felt positively.
Residents in East Portland have rated opportunities to infl uence government decisions lower than residents in all other neighborhood areas each of the fi ve years we have asked this question.
The table below contains two years of ONI’s adopted budget expenses for East Portland and the city as a whole from the City Budget Offi ce’s budget maps. Budget maps off er a partial picture of City spending in Portland’s neighborhood district areas. For more information about the City’s budget mapping process, see page 17 of this report.
Community Survey
Trends
Opportunities to infl uence government
decisions (percent “good” or “very good”)
0%
25%
50%
75%
100%
1991 1998 2005 2012
EastCity
East
City
2013
Bureau fi gures from
Budget Maps
Source: Data from FY ‘11-FY ‘13 City Budget Offi ce Budget Maps. Local share represents approved budget expenses that bureaus plan to spend in a specifi c geography. Citywide share represents the remaining approved budget expenses based on a geographic area’s users (residents and daytime employees). Due to rounding, some totals may not sum.
East Portland
Local share
Citywide share
Total
Local share per user
Citywide share per user
Total per user
Portland (entire city)
Allocated (local) bureau expenses
Unallocated (citywide) bureau expenses
Fund & other expenses
Total bureau expenses
2012-2013
$0.8 M
$0.7 M
$1.5 M
$4.00
$3.00
$8.00
2012-2013
$3.8 M
$3.2 M
$0.0 M
$7.1 M
2011-2012
$0.8 M
$0.7 M
$1.5 M
$4.00
$3.00
$7.80
2011-2012
$3.9 M
$3.2 M
$0.0 M
$7.1 M
2010-2011
not tracked
not tracked
not tracked
not tracked
not tracked
not tracked
2010-2011
not tracked
not tracked
not tracked
not tracked
Offi ce of Neighborhood Involvement
Adopted Operating Budget

74
The table below contains ONI’s service level measures for East Port-land and citywide for FY 2012, with data provided by ONI. For more information about the creation of the service level measures, see page 78 of this report.
Offi ce of Neighborhood Involvement (ONI)
Bureau service level
measures
Offi ce of Neighborhood Involvement
Source: Data provided by Offi ce of Neighborhood Involvement.
Service level measure
Number of neighborhood offi ces
Neighborhoods within area
Number of crime prevention trainings
Number of National Night Out parties
Number of basic problem location cases (e.g, neighbor dispute)
Number of complex problem location cases (e.g., drug house)
Number of volunteer graffi ti clean ups
Number of liquor license applications
Number of liquor licenses at year end
Number of Time Place Manner warnings/enforcements (nuisance and livability issues at alcohol serving establishments)
Number of meetings and events
Number of community trainings/workshops
Number of communications sent out
Number of small grants awarded
Value of small grants awarded
Citywide
7
95
491
163
3,046
201
249
1,943
2,802
64
3,333
127
2,168,216
92
$196,200
East
Portland
1
13
103
31
786
38
36
67
344
5
365
21
107,387
16
$36,946
FY 2012

75
Chapter 5 Conclusions
In 2013, 39 percent of residents in East Portland rated the overall job of City government as very good or good, compared to 50 percent of residents citywide. Residents in East Portland have rated the job of City govern-ment lower than the city as a whole and all other neighborhood district areas in each of the twenty years that we have asked the question.
East Portland has been transitioning from a rural to an urban devel-opment pattern since the early 1900s. East Portland is the newest and largest of the City’s seven neighborhood district areas and expe-rienced rapid population growth without the corresponding growth in amenities and infrastructure. When the City and County adopted policies that facilitated East Portland’s annexation from Multnomah County, residents were told that urban services would improve. In general, services in East Portland are better compared to their pre-annexation levels, but some service levels are diff erent than in other parts of the City, giving the impression to some that the area is not important to policy makers.
City policy makers acknowledge that work remains in East Portland and have increasingly focused attention and dedicated funding to the area. Although some City bureaus like Parks and PBOT have commit-
Overall job of City government(percent “good” or “very good”)
0%
25%
50%
75%
100%
1991 1998 2005 2012
EastCity
East
City
2013

76
East Portland
ted to improving services in East Portland, signifi cant improvements to parks, roads and other infrastructure require funding, some of which has been allocated, and some of which requires new revenue sources.
The City recently began mapping spending and service levels across Portland, an incomplete but historic and important contribution to discussions about equity in bureaus’ work around the city.
In 2009, City Council adopted the East Portland Action Plan (EPAP), a community development plan containing more than 250 actions intended to improve East Portland’s livability. EPAP is nearing its fi ve-year anniversary. A budget note suggests that 2014 is the last year EPAP will receive funding and instructs EPAP and the Offi ce of Neigh-borhood Involvement (ONI) to develop a completion plan. However, when we wrote this report, a completion plan had not been started, and ONI management told us they hoped that funding for EPAP would continue. ONI’s 2014-15 requested budget includes $300,000 in one-time funding for EPAP, and they recently started a project to assess the future of EPAP.
This report documents East Portland’s development and annexation history, some of the things that make East Portland diff erent from the rest of the city, and two unique City eff orts to measure services across the City and to improve them in East Portland – budget map-ping and the East Portland Action Plan. We also report on a snapshot of City bureaus’ work, spending and service levels in East Portland, in addition to resident’s perceptions of that work. This report does not provide defi nitive answers about what work needs to be done in East Portland, rather, it is intended to be used in future conversations about City services in East Portland.

77
Objectives, scope and
methodology
Chapter 6
We chose East Portland as the subject of the fi rst audit in a series examining City services across neighborhood areas in Portland. The objectives of our audit were to:
Document characteristics that diff erentiate East Portland and the provision of City services there from other areas of the city – including demographics, annexation, development and planning history
Assess City eff orts aimed at measuring and addressing diff erences in East Portland, including how selected City bureaus use the East Portland Action Plan (EPAP) in their work
Capture a snapshot of City service levels in East Portland and the City as a whole
To identify characteristics that diff erentiate East Portland and the provision of City services in East Portland from other areas of the city, we analyzed general demographics, housing, income, and commut-ing trends in East Portland and the City as a whole using 2000 and 2010 Census data. Using City budget maps, historical reports and studies, and planning documents, we summarized a development and annexation history of East Portland. We toured East Portland to observe high crash corridors, Urban Renewal Areas, unimproved streets, fi nished projects from neighborhood investment and fl ood plain restoration projects, a street improved through an LID, and im-provements made to an existing City park.
We focused our review of City services in East Portland on bureaus that provide direct services across the City – Fire, Police, Develop-ment Services, Neighborhood Involvement, Housing, Planning and

78
East Portland
Sustainability, Portland Development Commission, Transportation, Environmental Services, Water, and Parks. We did not include bu-reaus that provide internal services to the City, like the Offi ce of Management and Finance or the City Attorney’s Offi ce. In addition, we did not include the Bureau of Emergency Communications or the Portland Bureau of Emergency Management. We reviewed plans from City bureaus focused on East Portland to learn about their work. We interviewed staff and managers in the Portland Develop-ment Commission and the bureaus and offi ces of Fire and Rescue, Police, Development Services, Neighborhood Involvement, Housing, Planning and Sustainability, Transportation, Environmental Services, Water, and Parks about their work in East Portland. We chose certain aspects of bureau work in East Portland to describe in Chapter 4; the description is not meant to be an exhaustive history of each bureau’s work in East Portland.
In order to assess East Portland residents’ perceptions of City ser-vices over time, we compiled data from the Auditor’s Community Survey for comparable questions from each of Portland’s seven neighborhood areas and the city as a whole from 1991-2013. We calculated changes in residents’ responses on City service areas and report on those where the change was statistically signifi cant. We also compared East Portland residents’ ratings to ratings from other neighborhood areas. The East Portland boundaries used in the 2013 community survey have been used since 2001. We compare the data in this audit since we did not see a large impact of the boundary dif-ferences on survey responses from East Portland overtime.
We interviewed Budget Offi ce staff about the City’s budget mapping process and used the approved budget data from their 2010-2012 budget maps in this audit. After we completed our audit fi eldwork, the Budget Offi ce released their 2013 budget maps, which are avail-able on their website – www.portlandoregon.gov/cbo/.
To develop service level measures for City bureaus, we used Service Eff orts and Accomplishments reports, bureau budgets, and infor-mation obtained in audit interviews to develop a preliminary list of measures for each of the bureaus included in our assessment.

79
We met with bureau staff and mangers to refi ne the list. The City’s accounting system does not require that bureaus track spending geo-graphically, so some measures could not be geographically allocated since the data was not available. We sent the refi ned list of service level measures to bureau managers, who compiled the data for East Portland and the city as a whole. We reviewed the data from bureaus for reasonableness based on our knowledge and understanding of each bureau and the source of the data. We discussed questions with bureaus during our review. We requested service levels for East Portland as defi ned by the East Portland Neighborhood Offi ce (EPNO) boundaries and the city as a whole for fi scal year 2011-2012.
We chose FY 2012 since it was the most recent complete fi scal year at the time we began collecting data. In some instances, data for FY 2012 or for the boundary defi ned as EPNO was not available, and bureaus provided something similar. In all instances where the data deviates from EPNO boundaries or FY 2012, we indicated the devia-tion in the service level measure table. In some cases, we normalized the data using population fi gures from the 2010 Census and calculat-ed measures per 1,000 residents. The service level tables are meant to provide a snapshot of bureau work in East Portland.
We do not reach conclusions about the adequacy of bureau service levels in East Portland based on the data bureaus provided. The service level data we report are from snapshots taken during specifi c points in time, and they do not always provide a comprehensive picture of a bureau’s services in a given area. Staff in bureaus and the budget offi ce told us about various factors that infl uence service level variances and spending diff erences across the city, and we include some of this information in narrative sections along with the data. Although we discussed diff erences in some service levels with bu-reaus, we did not discuss the reasons behind all diff erences in service levels. Policy makers should conduct research into the causes and impacts of diff erences in the future.
To learn about the East Portland Action Plan (EPAP) we interviewed City staff and a volunteer who work with EPAP, we also attended an EPAP general meeting. At the EPAP general meeting, we asked at-

80
East Portland
tendees to complete an online survey about EPAP and the City’s work in East Portland, and obtained 40 responses. We asked bureaus to report their progress on implementing EPAP actions with a 2-5 year implementation time frame where their bureau was assigned the lead role. Using the bureau reported information and information from the survey of EPAP members; we judgmentally selected a sample of 13 EPAP actions assigned to City bureaus in order to assess bureaus’ use of EPAP and the impact of a sample of actions. We interviewed bureau staff working on the selected EPAP actions about EPAP, the impact of the actions, and about their bureau’s work in East Portland.
We did not seek management’s written response to this report, be-cause we do not make recommendations in this audit. However, we obtained the views of responsible offi cials from bureaus and EPAP management on the sections of the report that pertain to them, and we incorporated their comments into the report.
We conducted this performance audit in accordance with generally accepted auditing standards. Those standards require that we plan and perform the audit to obtain suffi cient, appropriate evidence to provide a reasonable basis for our fi ndings and conclusions based on our audit objectives. We believe that the evidence obtained provides a reasonable basis for our fi ndings and conclusions based on our audit objectives.

APP
END
IX A

82
East Portland
Appendix A EPAP sample actions and summary of results
Action
Expand community policing outreach to engage non-English/ethnic/minority and faith communities.
Refi ne police recruitment criteria to ensure police force in East Portland refl ects community diversity.
Expand storefront improvement grant program throughout East Portland commercial areas.
Undertake a comprehensive assessment of East Portland’s strengths, weaknesses, opportunities and threats for economic development including work skills profi les.
Initiate a pilot project in East Portland to test new land use concepts: consider land development, transportation and connectivity, services.
Lead Role
PPB
PPB
PDC
PDC, EPN
BPS
Possible
Partners
Non-profi ts, faith groups, ONI BPS, APNBA, PHB
BPS, PCC, OECDD
BUREAUS
Action
Status
Complete
Complete
Complete
Complete
Complete
Impact of EPAP
on action status
EPAP did not directly cause the action
EPAP did not directly cause the action
EPAP did not directly cause the action , but it added urgency
EPAP did not directly cause the action , but it added urgency
EPAP strongly infl uenced the action
Number
PS 1.3
PS 2.5
CM 2.1
EC 1.1
HD 6.3
More information
Offi cers from East engage with many organizations that serve minority and ethnic groups. Outreach would happen regardless of EPAP since offi cers need to understand the impact of culture on perceptions of police and break down barriers.
Police Bureau is not currently refl ective of the community. Goal is for all hiring pools to be 30% non-white and/or female. Bureau is recruiting out-of-state to overload application test pool with non-whites and females.
District Improvement Grants, which are similar but more fl exible than storefront improvement grants are part of Neighborhood prosperity initiative (NPI).
Funded by EPAP Project Fund, EPAP’s Economic Development Subcommittee and PDC managed a contract with a consultant for a study called “East Portland Action Plan: Economic Development Assessment” that included assessment of area’s competitive advantages and priority action items for the subcommittee.
The “SE 122nd Avenue Study: A Pilot Project of the Portland Plan fi nal report and recommendations” was released in February 2011. Study was partially funded through EPAP.
Per EPAP Per lead role bureau staff we interviewed
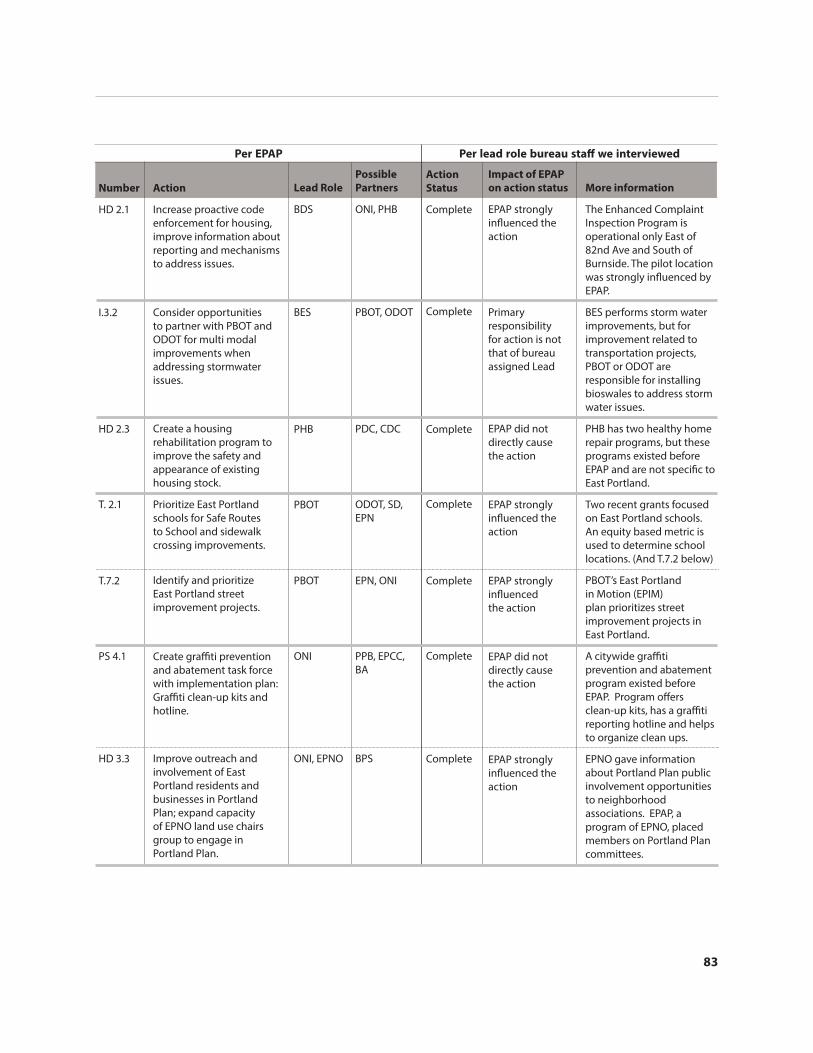
83
Action
Increase proactive code enforcement for housing, improve information about reporting and mechanisms to address issues.
Consider opportunities to partner with PBOT and ODOT for multi modal improvements when addressing stormwater issues.
Create a housing rehabilitation program to improve the safety and appearance of existing housing stock.
Prioritize East Portland schools for Safe Routes to School and sidewalk crossing improvements.
Identify and prioritize East Portland street improvement projects.
Create graffi ti prevention and abatement task force with implementation plan: Graffi ti clean-up kits and hotline.
Improve outreach and involvement of East Portland residents and businesses in Portland Plan; expand capacity of EPNO land use chairs group to engage in Portland Plan.
Lead Role
BDS
BES
PHB
PBOT
PBOT
ONI
ONI, EPNO
Possible
Partners
ONI, PHB
PBOT, ODOT
PDC, CDC
ODOT, SD, EPN
EPN, ONI
PPB, EPCC, BA
BPS
Action
Status
Complete
Complete
Complete
Complete
Complete
Complete
Complete
Impact of EPAP
on action status
EPAP strongly infl uenced the action
Primary responsibility for action is not that of bureau assigned Lead
EPAP did not directly cause the action
EPAP strongly infl uenced the action
EPAP strongly infl uenced the action
EPAP did not directly cause the action
EPAP strongly infl uenced the action
Number
HD 2.1
I.3.2
HD 2.3
T. 2.1
T.7.2
PS 4.1
HD 3.3
More information
The Enhanced Complaint Inspection Program is operational only East of 82nd Ave and South of Burnside. The pilot location was strongly infl uenced by EPAP.
BES performs storm water improvements, but for improvement related to transportation projects, PBOT or ODOT are responsible for installing bioswales to address storm water issues.
PHB has two healthy home repair programs, but these programs existed before EPAP and are not specifi c to East Portland.
Two recent grants focused on East Portland schools. An equity based metric is used to determine school locations. (And T.7.2 below)
PBOT’s East Portland in Motion (EPIM) plan prioritizes street improvement projects in East Portland.
A citywide graffi ti prevention and abatement program existed before EPAP. Program off ers clean-up kits, has a graffi ti reporting hotline and helps to organize clean ups.
EPNO gave information about Portland Plan public involvement opportunities to neighborhood associations. EPAP, a program of EPNO, placed members on Portland Plan committees.
Per EPAP Per lead role bureau staff we interviewed

84
East Portland
Action
Prioritize acquiring and developing access to/frontage for existing parks: Bundy Park, Raymond Park, West Powellhurst Park.
Add additional wells to Columbia Groundwater well fi elds to increase supply and capacity.
Improve and expand mobile playground program in East Portland.
Lead Role
EPAP funded Parks project
Water
Parks
Possible
Partners
PBOT, EPN, BDS, METRO
Action
Status
Partially complete
Partially complete
Complete
Source: Audit Services Division, based on EPAP document and audit interviews
Impact of EPAP
on action status
EPAP did not directly cause the action , but it added urgency
EPAP did not directly cause the action
EPAP directly caused the action
Number
P.4.8
I.1.4
Muni-cipal partner project
More information
Parks acquired and developed access to Raymond Park. Additional funding source needed to develop better access to the other parks.
One well drilled and additional well will be drilled in the future. Bureau recently completed negotiations and platting for well site easement near Cascade Station.
EPAP funded an additional mobile playground van that only serves locations in East Portland (these 10 locations are in addition to the 3 East Portland locations served by the Parks’ funded van).
Per EPAP Per lead role bureau staff we interviewed
Abbreviations/Acronyms
Alliance of Portland Neighborhood Business Associations (APNBA)Bureau of Development Services (BDS)Bureau of Environmental Services (BES)Bureau of Planning and Sustainability (BPS)Business Associations (BA)Community Development Corporations (CDC)East Portland Chamber of Commerce (EPCC) East Portland Neighborhood Offi ce (EPNO)East Portland Neighbors (EPN)East Portland School Districts (SD)Offi ce of Neighborhood Involvement (ONI)Oregon Department of Transportation (ODOT)Oregon Economic & Community Development (OECDD)Portland Bureau of Transportation (PBOT)Portland Community College (PCC)Portland Development Commission (PDC)Portland Housing Bureau (PHB)Portland Police Bureau (PPB)
Appendix A EPAP sample actions and summary of results

APP
END
IX B

86
East Portland
Appendix B EPAP Strategies
HD.1 Improve the design and quality of new housing structures
HD.2 Improve the appearance, quality and safety of existing housing stock
HD.3 Improve public notifi cation for new development and enhance community knowledge, capacity and infl uence in land use
HD.4 Review and assess public policies and incentives for housing development
HD.5 Improve regulations and implementation of City code to increase benefi t and reduce impacts of new housing
HD.6 Review and assess Comprehensive Plan Map and implementation in East Portland
CM.1 Provide commercial and mixed use development opportunities throughout East Portland
CM.2 Promote vital and healthy multi-use commercial areas
T.1 Improve transit service throughout East Portland
T.2 Increase safety and convenience of walking throughout East Portland
T.3 Increase safety and accessibility of bicycling in East Portland
T.4 Improve safety and multi-modal function of arterial and collector streets throughout East Portland
T.5 Improve the unimproved local streets throughout East Portland
T.6 Improve connectivity throughout East Portland
T.7 Foster equity in transportation decisions and services
I. 1 Assure continued water quality and water service to East Portland
I. 2 Upgrade and maintain public utilities and infrastructure systems throughout East Portland
I. 3 Explore green infrastructure partnerships to maximize benefi ts
P.1 Increase schools/parks joint use facilities in East Portland
P.2 Improve existing parks in East Portland
P.3 Improve existing trails in East Portland
P.4 Develop new parks and community centers in facility-defi cient areas throughout East Portland
P.5 Develop new multi-use trails and green corridors
P.6 Create access to and develop facilities for water bodies
NA.1 Improve environmental function of urbanized areas and mitigate impacts
NA.2 Improve natural areas throughout East Portland
NA.3 Increase public access to natural areas
NA.4 Attain environmental equity in East Portland
Housing and Development Policy
Built Strategies Summary
Commercial and Mixed Use
Transportation
Public Infrastructure and Utilities
Natural Areas and Environment
Parks and Open Space
Environmental Strategies Summary

87
Social Strategies Summary
Public Safety
Economic Strategies Summary
Economic Development and Workforce Training
EC.1 Develop and implement a comprehensive economic development plan and policy agenda
EC.2 Promote key opportunity sites for economic development
EC.3 Promote and support small and independent Portland-based and -owned businesses
EC.4 Increase and promote workforce training and employment opportunities for East Portland residents
L.1 Improve early childhood education
L.2 Increase availability of youth-focused programs
L.3 Strengthen stability and quality of East Portland K-12 schools
L.4 Increase the academic success of East Portland K-12 students
L.5 Increase community college and K-12 school districts coordination
L.6 Increase partnerships among and with East Portland K-12 school districts
L.7 Increase parental involvement in and access to public K-12 schools
L.8 Increase community library services and facilities
PS.1 Develop a public safety “messaging” program to increase community policing eff orts
PS.2 Broaden East Portland Precinct’s outreach and community involvement
PS.3 Expand availability of gang prevention programs and equitable allocation of resources toward such programs
PS.4 Increase comprehensive, sustained graffi ti prevention and clean-up programs
PS.5 Improve public safety on TriMet facilities in East Portland
PS.6 Increase public safety through design and physical improvements
PS.7 Increase enforcement of code violations and develop tools for improved neighbor relations
SN.1 Assist in stabilizing low income residents/families
SN.2 Support diversity in neighborhoods
SN.3 Increase support for independent elderly and disabled people
SN.4 Establish ‘resident activities coordinators’ at multi-family dwellings
SN.5 Provide life skills training and education opportunities for East Portland residents
SN.6 Promote healthy communities in East Portland
Education Infrastructure and Programs
Learning Strategies Summary
Housing Assistance and Safety Net Services
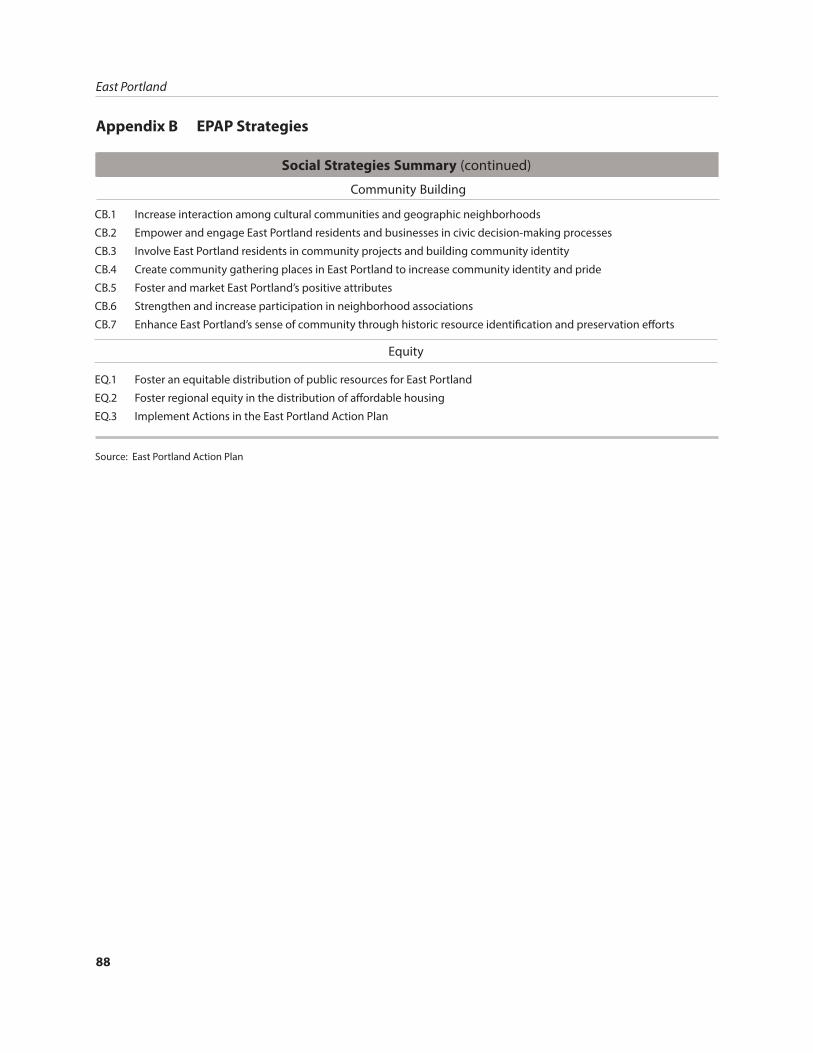
88
East Portland
Social Strategies Summary (continued)
Community Building
CB.1 Increase interaction among cultural communities and geographic neighborhoods
CB.2 Empower and engage East Portland residents and businesses in civic decision-making processes
CB.3 Involve East Portland residents in community projects and building community identity
CB.4 Create community gathering places in East Portland to increase community identity and pride
CB.5 Foster and market East Portland’s positive attributes
CB.6 Strengthen and increase participation in neighborhood associations
CB.7 Enhance East Portland’s sense of community through historic resource identifi cation and preservation eff orts
EQ.1 Foster an equitable distribution of public resources for East Portland
EQ.2 Foster regional equity in the distribution of aff ordable housing
EQ.3 Implement Actions in the East Portland Action Plan
Equity
Source: East Portland Action Plan
Appendix B EPAP Strategies


This report is intended to promote the best possible management of public resources. This and other audit reports produced by the Audit Services Division are available for view-ing on the web at: www.portlandoregon.gov/auditor/auditservices. Printed copies can be obtained by contacting the Audit Services Division.
Audit Services Division
Offi ce of the City Auditor
1221 SW 4th Avenue, Room 310
Portland, Oregon 97204
503-823-4005
www.portlandoregon.gov/auditor/auditservices
East Portland: History of City services examined Report #435, April, 2014
Audit Team Members: Jennifer Scott, Patrick Malloy
LaVonne Griffi n-Valade, City AuditorDrummond Kahn, Director of Audit Services
Other recent audit reports:
Portland Streetcar: City bears fi nancial burden and operational risk while relying on outside partners (#451A, April 2014)
Organic Waste: Residential collection increased, but challenges remain in larger commercial sector (#447, April 2014)
Housing Loan Program: Funding supports goals, but low repayment may jeopardize long-term success (#449, March 2014)


![The Sunday Oregonian.. (Portland, Or) 1900-10-07 [p 20].€¦ · 2tf THE SJJN3PIAY OBEGONIANi PORTLAND, OCOBEE! 7,,. 1900. NEW TODATT.,JfrtlF SIOCK. 100x100. ua corner East Seventh](https://img.dokumen.tips/doc/110x75/5f585a9de24a3f3b6d100678/the-sunday-oregonian-portland-or-1900-10-07-p-20-2tf-the-sjjn3piay-obegoniani.jpg)


![Comments2_ East Central Portland coral survey 2009[1]](https://img.dokumen.tips/doc/110x75/5885c3501a28ab6f168b7303/comments2-east-central-portland-coral-survey-20091.jpg)