Embed Size (px)
Citation preview

Focus Areas 241240 City of Boston: Climate Ready Boston
East Boston
East Boston, located to the northeast, across from Charlestown and Downtown Boston, is bounded by tidal portions of Chelsea Creek, the Mystic River, and Boston Harbor. East Boston is composed of fi ve separate islands connected by fi ll. The fi rst two islands, Noddle’s and Hog’s Islands, were joined during the eighteenth century, and the others, Governor’s, Bird, and Apple, were connected during the 1940s to support the growth of Logan Airport. In 1833, William Sumner established the East Boston Company to develop East Boston as a planned community. East Boston was annexed by Boston
in 1836. From 1840 onward, it experienced rapid growth, fueled by marine industrial activity along the waterfront, particularly the construction of clipper ships. Logan Airport was built in the early 1920s and has experienced signifi cant expansion over time, especially during the 1960s and 1970s.
Today, East Boston is home to a mix of residential neighborhoods, commercial areas, and major regional transportation assets, including Logan Airport. East Boston is bisected by Route 1A/McClellan Highway and Interstate 90 and has four major tunnels. The Sumner and Callahan Tunnels carry Route 1A under Boston Harbor, connecting Downtown and East Boston, with the Callahan carrying northbound traffi c and the Sumner carrying southbound traffi c. The Ted Williams Tunnel carries I-90 under Boston Harbor,
Image courtesy of Sasaki
connecting South Boston to Logan Airport and providing a route for the Silver Line. The East Boston Tunnel carries the Blue Line from the Aquarium MBTA Station in Downtown to the Maverick Station in East Boston.
East Boston includes four major commercial areas, including Maverick Square to the south, Central Square at the edge of the Inner Harbor, Day Square near the Chelsea Street Bridge, and Orient Heights to the north. In addition, East Boston includes some industrial areas along the waterfront, particularly Chelsea Creek. The community also includes important recreational and natural areas, including the East Boston Greenway, Constitution Beach, and Belle Isle Marsh, the largest remaining salt marsh in Boston.
East Boston is currently a neighborhood in transition, as demonstrated by strong recent income growth and development activity. It has experienced an infl ux of young professionals, especially in Maverick Square, along Jeff ries Point, and along the Eagle Hill waterfront. The waterfront has been evolving into a mixed-use environment, with new residential and open-space development. Since 2000, almost 300 new residential units have been built, with over 2,000 more either under construction or in the pipeline. The greatest concentration of new development has been along the waterfront, south of Central Square. Logan Airport also has experienced a signifi cant expansion of international fl ights.

Focus Areas 243242 City of Boston: Climate Ready Boston
FLOOD PROGRESSION
East Boston is exposed to climate change impacts including heat, increased precipitation and stormwater fl ooding, and sea level rise and coastal and riverine fl ooding. Exposure to heat and stormwater fl ooding are addressed in the Citywide Vulnerability Assessment (see p.12), while exposure to and consequences of coastal and riverine fl ood risk are further discussed in this section.
East Boston has the most land area of all Boston neighborhoods exposed to coastal storms in the coming decades, with exposure concentrated near the East Boston Greenway, Maverick Square, and the Sumner and Callahan Tunnels. Nearly 50 percent of East Boston’s land area will be exposed to coastal fl ooding at the 1 percent annual chance event as soon as the 2070s.
DEFINITIONS
Near term: Beginning 2030s, assumes 9 inches of sea level rise
Midterm: Beginning 2050s, assumes 21 inches of sea level rise
Long term: Beginning 2070s or later, assumes 36 inches of sea level rise Exposure: Can refer to people, buildings, infrastructure, and other resources within areas likely to experience hazard impacts. Does not consider conditions that may prevent or limit impacts.
Vulnerability: Refers to how and why people or assets can be affected by a hazard. Requires site-specific information.
Consequence: Illustrates to what extent people or assets can be expected to be affected by a hazard, as a result of vulnerability and exposure. Consequences can often be communicated in terms of economic losses.
Annualized losses: The sum of the probability-weighted losses for all four flood frequencies analyzed for each sea level rise scenario. Probability-weighted losses are the losses for a single event times the probability of that event occurring in a given year.
*For a full list of definitions, refer to the Glossary in the Appendix.
LEGEND
9 INCHES SEA LEVEL RISE
21 INCHES SEA LEVEL RISE
36 INCHES SEA LEVEL RISE

Focus Areas 245244 City of Boston: Climate Ready Boston
By the end of the century, land area exposed to fl ooding from coastal storms will more than triple as additional entry points for fl ooding become present. Along the East Boston Greenway, frequent fl ooding from high tides will be likely.
Climate resilience planning must consider East Boston’s multiple low-lying waterfront edges to address neighborhood exposure as a whole. Nevertheless, the waterfronts near the East Boston Greenway and the Sumner and Callahan Tunnels are exposed in the near term and should be addressed earliest.
Throughout the century, the majority of the East Boston waterfront, parts of Logan Airport, and some inland residential areas are expected to be exposed to sea level rise and coastal storms. In total, 16 percent of the land area in East Boston may be exposed to low-probability fl ooding in the near term, increasing to almost 50 percent of the neighborhood exposed to low-probability events later in the century.
There are two critical low-lying entry pointsalong the coast that allow for inland fl ooding in the near term. High-tide fl ooding expected later in the century may use these same pathways. First, the southern end of East Boston is exposed via the East Boston Greenway (see 1 on map to left). Second, the area south of Bennington Street is exposed by a low point to the west of the Sumner and Callahan tunnel entrances (2). The two pathways expose the strip adjacent to the East Boston Greenway to inland fl ooding throughout the century, from the neighborhood’s southern waterfront to the Wood Island MBTA Station in the north (3). Later in the century, fl ood exposure expands from this area west toward Bennington Street and east toward Logan Airport. In addition, waterfront areas near Harborwalk Park (4) and between Logan Airport and Constitution Beach Park (5) are also projected to be exposed to fl ooding by many coastal storm events late in the century.
Further north in East Boston, between Orient Heights and Wordsworth Street, both sides of the neighborhood are expected to be exposed to fl ooding from high-probability storms in the second half of the century (6). Constitution Beach Park (7) and the Chelsea River waterfront (8) will both be exposed during the same time period.
O’Donnell Elementary, East Boston High School, Bradley School not exposed.
Orient Heights BHA Housing not exposed.

Focus Areas 247246 City of Boston: Climate Ready Boston
As soon as the 2070s, almost 50 percent of current East Boston residents and parts of Logan Airport will be directly exposed to high-probability coastal fl ood events (10 percent annual chance).
POPULATION AND SOCIAL VULNERABILITIES
East Boston is currently home to over 40,500 people. East Boston has high concentrations of diff erent types of socially vulnerable populations, some of the densest within Boston. The neighborhood is racially diverse, with people of color comprising 63 percent of residents, compared to the citywide average of 53 percent, and over 50 percent of residents are Latino. In particular, 44 percent of residents have limited English profi ciency, higher than Boston as a whole.
EXPOSUREPOPULATION & INFRASTRUCTURE
Close to 300 residents in East Boston could be exposed or displaced by frequent fl ooding (high tides) in the near term, a number that is expected to skyrocket to over 6,200 people exposed to high tides by the end of the century. This is compared to over 19,000 people exposed to low-probability storms later in the century, almost half of East Boston’s population.
Only 14 percent of East Boston’s low-income residents own cars, indicating that these populations depend disproportionately on public transportation. The limited availability of vehicular transportation options to East Boston residents indicates a strong need to harden local emergency services and shelter operations against fl ood impacts. When only fl ood depths, resident income, and age are considered, East Boston can expect over 1,800 residents to require shelter during and after low-probability storms later in the century. This is second only to South End, whose entire neighborhood will be exposed to coastal storms during the same period. Around 1,300 people are expected to require shelter for low-probability events (1 percent annual chance) expected as soon as the 2050s. East Boston’s emergency shelter capacity, 517 people and 96 animals, may not be adequate for the scale of fl ooding expected in the second half of the century. Furthermore, all of the neighborhood’s existing emergency shelters will be exposed to high-probability fl ood impacts later in the century (10 percent annual chance).
As soon as the 2070s, Boston Housing Authority’s Heritage Development along Sumner Street will be exposed to high-probability (10 percent annual chance) fl ood events.
EAST BOSTON POPULATION EXPOSURE
Image courtesy of Sasaki

Focus Areas 249248 City of Boston: Climate Ready Boston
INFRASTRUCTURE
East Boston includes many signifi cant transportation assets, including Logan Airport, Interstate 90, Route 1A, and the MBTA Blue and Silver Lines. Critical evacuation routes are exposed to a major storm in all sea level rise scenarios.Since East Boston is separated from other neighborhoods by Boston Harbor, Boston needs transportation connectivity to enable access to Logan Airport from other neighborhoods and to enable access to healthcare from East Boston. Eight I-90 and Route 1A tunnels’ exits and entrances are located within the fl ood extent for low-probability events in the near term. Flooding of I-90 and Route 1A would present complications to safe evacuation, and avoidance of fl ooded areas can lead to overstressed and crowded side streets when drivers seek alternate routes.
Four MBTA Blue Line stations and a Silver Line station are also located within future fl ood extents. If exposed Blue Line stations were rendered inoperable, nearly 14,000 individuals that enter the stations to use the line on an average weekday would be in need of alternative transportation options.1 The Blue Line’s Airport and Wood Island Stations both lie along the low-lying East Boston Greenway and will be exposed to high-probability (10 percent annual chance) fl oods as soon as the 2050s. Although the Maverick Station is not exposed to coastal and riverine fl ooding during this century, the Aquarium MBTA Station Downtown is also exposed to high-probability events in the near-term. If the Aquarium Station
is rendered inoperable, Blue Line service could be interrupted from Downtown through Revere. Flooded MBTA stations or inundated roads that limit bus mobility represent a concern for East Boston’s physical disconnection from the rest of the City, especially for the low-income population without vehicle access.
East Boston’s police and fi re services will be exposed to severe, lower-probability coastal storms and sea level rise in the late century. East Boston has four fi re stations; half will be exposed to low-probability fl ood events expected as soon as the 2050s, and three will be exposed to low-probability fl ood events expected as soon as the 2070s, including the Fire Headquarters. Two exposed law enforcement stations make up the entire law enforcement capacity in East Boston, including the Massachusett s state police station at Logan Airport. The state police station will not be exposed until later in the century under low-probability fl ooding conditions, though the District A-7 station is exposed to lower-probability events in the near term. A proposed multiuse municipal facility—shared by Emergency Medical Services and the Boston Police, Public Works, and Parks and Recreation Departments—will be located just east of the American Legion Playground. While the exact location of the various buildings within the site is still being studied, the adjacent intersection of E. Eagle Street and Eagle Square will be exposed to very low-probability fl ood events in the late century (0.1 percent annual chance). As East Boston is relatively isolated from the rest of Boston, fi re and police assets are essential to maintain
1 Based on 2014 MBTA ridership and service statistics. Number only captures station entries and does not include all passengers traveling on the line as it passes through the station.
emergency response capacity, and site-specifi c evaluations must be conducted to assess potential vulnerabilities and impacts.
While the pump station serving East Boston’s sanitary sewage needs is itself protected against storm surge, inundation of access roads may result in repair delays and periods of interrupted sanitary sewer service.The Caruso pump station, located to the southwest of the Chelsea Street Bridge along the Chelsea River, serves all of East Boston’s sanitary sewage needs. The facility itself is protected against storm surge, but local access roads to the facility are expected to experience fl ooding during low-probability mid-century events (1 percent annual chance). If the pump station were rendered inoperable, inundated or damaged roads may delay response time of repair crews and result in longer periods of interrupted sanitary sewer service in East Boston.
Exposure to petroleum storage facilities in East Boston may impact Logan Airport operations and other fuel users. East Boston shares the Chelsea River Bulk Petroleum Storage Facilities site with Chelsea, across the river. Portions of the Sunoco East Boston facility on this site appear to be exposed to high-probability (10 percent annual chance) fl ooding in the near term and may be exposed to monthly tides later in the century. The Sunoco facility provides jet fuel to Logan Airport for daily operations and home heating fuel for other areas throughout the city. Nevertheless, Massport has identifi ed backup fuel sources for use in emergency situations.
Logan Airport is operated by Massport. Massport has a detailed operational resilience plan for all its assets to ensure safety and continuity of critical operations in the event of a flood. Should a service interruption occur, Massport’s level of service planning goal is to restore operations during and after disruptive events as soon as possible in a safe and economically viable time frame, based on asset criticality. The rental car center, portions of Airport Way, and Terminal A are exposed to the high-probability flooding expected as soon as the 2070s, while Terminal E, airport service roads, and portions of runways fall within the flood extents for a low-probability event (1 percent annual chance) in the same time period. Specific assets critical for recovery operations have been protected against flood impacts; protections include redundant generators, emergency pumps, and backup fuel sources. As a key player of East Boston’s economy, the resilience of Logan Airport will heavily influence East Boston’s recovery after a flood event. Massport’s robust planning efforts at Logan Airport in an attempt to address such dependence can serve as an example for other organizations.

Focus Areas 251250 City of Boston: Climate Ready Boston
EXPOSURE AND CONSEQUENCESBUILDINGS AND ECONOMY
RISK TO BUILDINGS
Throughout the century, about two-thirds of structures and half of the building footprint that are expected to be impacted by coastal fl ooding are residential or mixed-use in nature.Like Charlestown, the majority of structures in East Boston are one or multifamily residential buildings averaging around three stories tall. Exposure to buildings in East Boston increases rapidly with sea level rise and event severity. For example, in the near term, East Boston represents just 16 percent of all buildings expected to be exposed to high-probability fl ood events throughout Boston (10 percent annual chance) but increases to 50 percent of all of Boston’s buildings exposed to low-probability events. Even with East Boston’s high volume of exposed buildings, the neighborhood’s real estate market value exposed to low-probability
events in the near term is a relatively low share of Boston’s exposed real estate for the same time frame (9 percent).
The number of buildings expected to fl ood at the 1 percent annual chance event triples between the near term and the end of the century. Moreover, East Boston is consistently one of the top neighborhoods with regard to expected physical damage and other fl ood losses to structures. Expected annualized losses to structures jump from about $11 million to over $80 million between the near term and the second half of the century and could double again in the late century. The extensive amount of inland fl ooding within East Boston, which enters through specifi c pathways at the coast, implies that mitigation planning and fl ood solutions may need to be concentrated at fl ood entry points on the coast.
EAST BOSTON BUILDING EXPOSURE
EAST BOSTON MARKET VALUE EXPOSURE
More than half of East Boston’s building stock will be exposed to fl ooding from low-probability events as soon as the 2070s. With 3,000 buildings exposed, East Boston is second only to South End for this period.

Focus Areas 253252 City of Boston: Climate Ready Boston
ECONOMIC RISK ASSUMPTIONS
Job and output loss includes direct, indirect, and induced consequences of flood impacts. Direct results are impacts felt within a neighborhood, while indirect and induced results are those expected to be felt throughout Suffolk County as a result of changes in spending patterns. Results for both job and output losses are the sum of annualized values for the four flood frequencies analyzed for each sea level rise scenario. This represents a lower-bound estimate for several reasons. First, not all probabilistic events are considered. Second, the analysis assumes that all impacted businesses eventually reopen, though FEMA estimates that almost 40 percent of small businesses—and up to 25 percent of all businesses—never reopen after experiencing flood impacts. Third, only building areas directly impacted by floodwater are assumed to experience business interruption. This does not consider interruptions of businesses due to loss of power or utility functions. Finally, the analysis only considers existing populations, businesses, and buildings and does not include projections for future growth. Refer to the Appendix for a more detailed explanation of the exposure and consequence analysis.
INDUSTRY ANNUALIZED LOSS OF ECONOMIC OUTPUT
Restaurants $10,800,000
Insurance activities $7,400,000
Transportation $3,800,000
Remaining industries $21,300,000
Total $43,400,000
RISK TO THE ECONOMY
As of 2014, East Boston’s local economy produces over $6 billion annually in sales and revenues (output) and sustains over 28,000 jobs. The neighborhood’s economy is heavily dependent on Logan Airport and the air transportation industry, which generate almost $2.5 billion in output within East Boston. Logan Airport is New England’s largest transportation center and is a major employment hub for Boston, employing approximately 12,000 people. Industries related to air travel, including service-based industries, car rental operations, and hotels, also have a strong presence within East Boston and are responsible for 9 percent of the area’s total output.
Direct annualized impacts to output in East Boston expected for later in the century are $30.7 million and 270 jobs (see Appendix for detail on methodology). These impacts refl ect business operations interrupted after fl ooding while structures are repaired or businesses relocate. With indirect and induced annual economic impacts included, covering interrupted operations to businesses tied to East Boston’s economy, losses could increase by another $12.6 million and 63 jobs. Totaling direct, indirect, and induced impacts, the total annualized eff ect associated with fl ooding expected later in the century is $43.3 million and 330 jobs, 19 percent of total losses for the neighborhood. Key industries aff ected by these losses include the food services sector, the transportation sector, and the accommodations sector, which provide 47 percent of East Boston’s jobs and employ predominantly middle- and low-income workers.
EAST BOSTON ECONOMIC LOSSES
EAST BOSTON ANNUALIZED LOSSES
Tremendous recent and planned residential development activity has contributed to population growth in the neighborhood, especially along the vulnerable waterfront.
Two of the top ten structures with the most annual damages expected for later in the century include recent or planned developments for high-occupancy mixed-use buildings.
41 percent of East Boston’s building stock is projected to have a 10 percent annual chance of being impacted. Of those buildings, almost 2,300 are residential or mixed-use and house approximately 18,500 people.
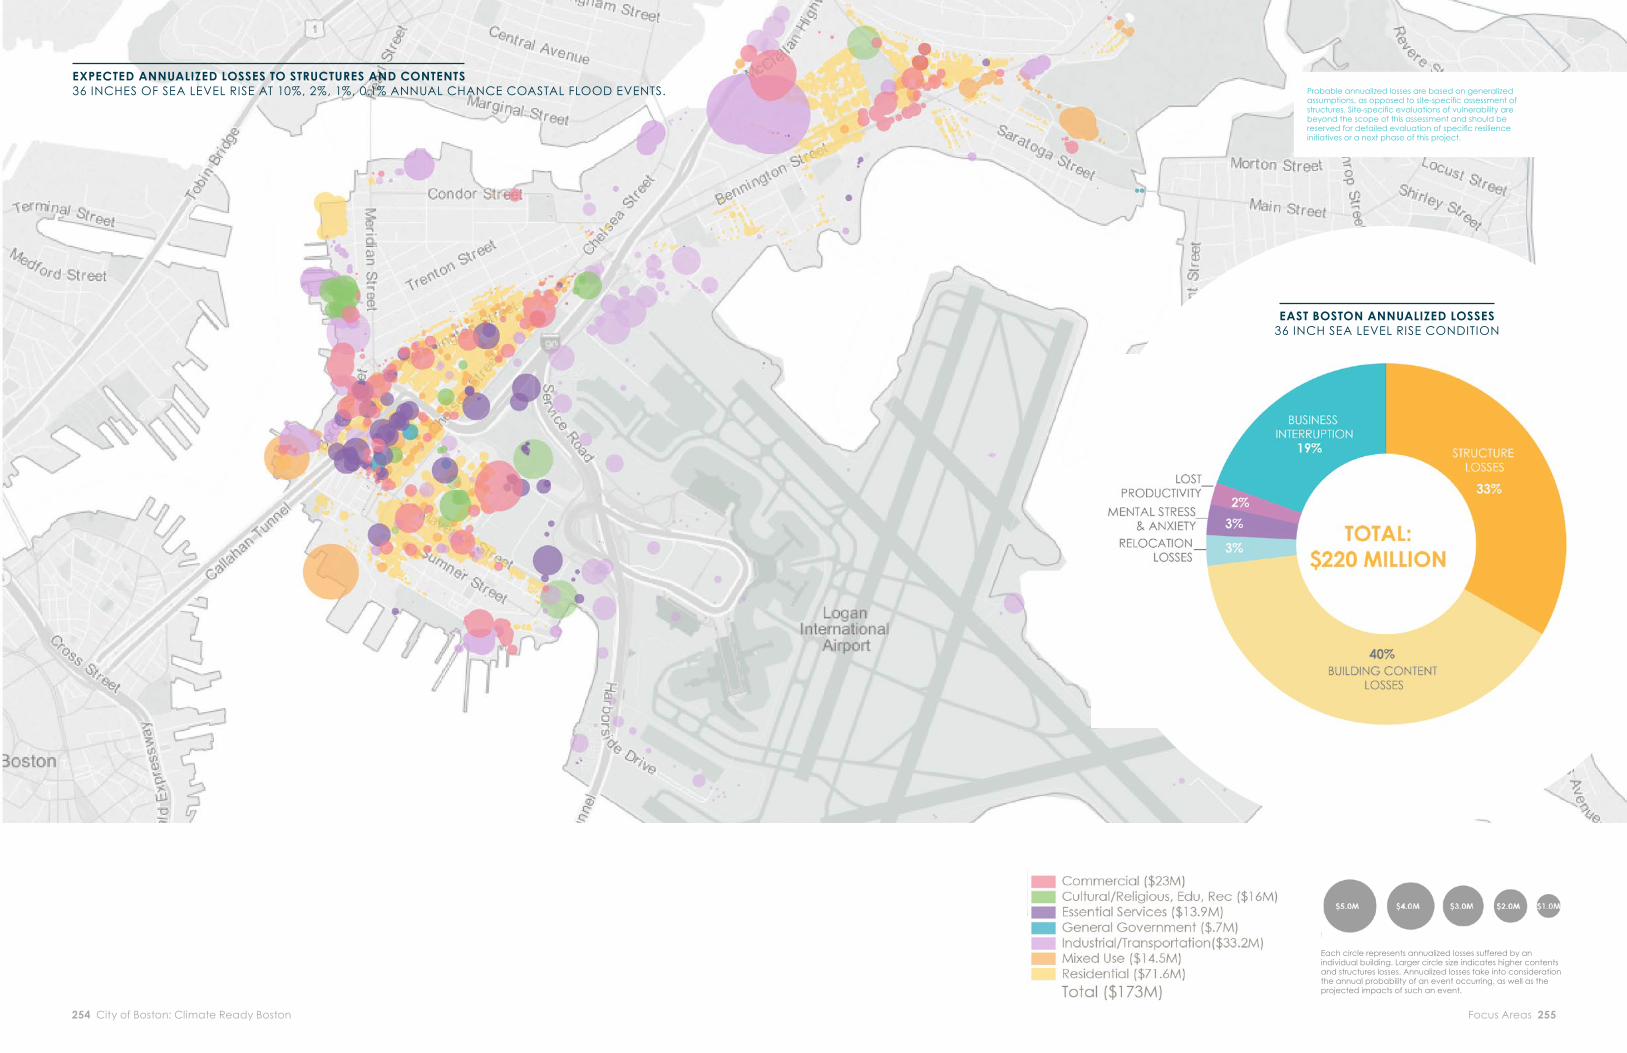
Focus Areas 255254 City of Boston: Climate Ready Boston
EXPECTED ANNUALIZED LOSSES TO STRUCTURES AND CONTENTS36 INCHES OF SEA LEVEL RISE AT 10%, 2%, 1%, 0.1% ANNUAL CHANCE COASTAL FLOOD EVENTS.
EAST BOSTON ANNUALIZED LOSSES36 INCH SEA LEVEL RISE CONDITION
Each circle represents annualized losses suffered by an individual building. Larger circle size indicates higher contents and structures losses. Annualized losses take into consideration the annual probability of an event occurring, as well as the projected impacts of such an event.
Probable annualized losses are based on generalized assumptions, as opposed to site-specifi c assessment of structures. Site-specifi c evaluations of vulnerability are beyond the scope of this assessment and should be reserved for detailed evaluation of specifi c resilience initiatives or a next phase of this project.

Focus Areas 257256 City of Boston: Climate Ready Boston
The City should develop a local climate resilience plan for East Boston to support district-scale climate adaptation. The plan should include the following:
◦ Community engagement through a local climate resilience committ ee, leveraging existing community-led organizations and eff orts in East Boston, including the ClimateCARE eff ort being led by Neighborhood of Aff ordable Housing (NOAH).
◦ Land-use planning for future fl ood protection systems, including Flood Protection Overlay Districts in strategically important “fl ood breach points” identifi ed below (see Potential Flood Protection Locations).
◦ Flood protection feasibility studies, evaluating district-scale fl ood protection, including at locations identifi ed below (see Potential Flood Protection Locations).
◦ Infrastructure adaptation planning through the Infrastructure Coordination Committ ee. For East Boston, the Massachusett s Port Authority (Massport) is a key partner, and it has already undertaken signifi cant adaptation planning for its buildings, infrastructure, and operations related to Logan.
◦ Coordination with other plans, including Imagine Boston 2030, GoBoston 2030, Special Planning Areas, and any updates to the East Boston Municipal Harbor Plan.
◦ Development of fi nancing strategies and governance structures to support district-scale adaptation.
EAST BOSTONAPPLICATION OF RESILIENCE INITIATIVES
PROTECTED SHORES
DEVELOP LOCAL CLIMATE RESILIENCE PLANS TO SUPPORT DISTRICT-SCALE CLIMATE ADAPTATION
ESTABLISH FLOOD PROTECTION OVERLAY DISTRICTS AND REQUIRE POTENTIAL INTEGRATION WITH FLOOD PROTECTION
PRIORITIZE AND STUDY THE FEASIBILITY OF DISTRICT-SCALE FLOOD PROTECTION
The Boston Planning and Development Agency (BPDA) should petition the Boston Zoning Commission to create new Flood Protection Overlay Districts in areas that are strategically important for potential future fl ood protection infrastructure (see Potential Flood Protection Locations below). Within a Flood Protection Overlay District, a developer would be required to submit a study of how a proposed project could be integrated into a future fl ood protection system; options may include raising and reinforcing the development site or providing room for a future easement across the site.
To reduce the risk of coastal fl ooding at major inundation points, the City should study the feasibility of constructing district-scale fl ood protection at the primary fl ood entry points in East Boston (see Potential Flood Protection Locations below for a preliminary identifi cation of locations and potential benefi ts).
These feasibility studies should take place in the context of local climate resilience plans, featuring engagement with local community stakeholders, coordination with infrastructure adaptation, and considerations of how fl ood protection would impact or be impacted by neighborhood character and growth. Examples of prioritization criteria include the timing of fl ood risk, consequences for people and economy, social equity, fi nancial feasibility, and potential for additional benefi ts beyond fl ood risk reduction.

Focus Areas 259258 City of Boston: Climate Ready Boston
SLR SCENARIO DISTRICT SCALE FLOOD PROTECTIONFOR 1% ANNUAL CHANCE FLOOD3
9” SLR (2030s–2050s)
Jeffries Point to Central Square
21” SLR (2050s–2100s)
Jeffries Point to Central Square and Porzio Park combined and Orient Heights
36” SLR(2070s or later)
All locations combined
POTENTIAL DISTRICT-SCALE FLOOD PROTECTION LOCATIONS2
See the District-Scale Flood Protection Systems Overview section (p.330) for a citywide perspective on district-scale fl ood protection. District-scale fl ood protection is only one piece of a multilayered solution that includes prepared and connected communities, resilient infrastructure, and adapted buildings.
In the near term, fl ood protection between Jeffries Point and Central Square is critical to address fl ood entry points along the western and southern edges of the East Boston waterfront.
As sea level rise (SLR) progresses, additional locations, which would provide modest fl ood protection in the near term, will become critical:
◦ By Porzio Park, addressing fl ood entry points near where Jeffries Point meets Logan Airport
◦ By Wood Island, addressing fl ood entry points along the northern edge of Logan Airport, just east of the Wood Island T Station
◦ By Orient Heights, addressing fl ood entry points near Constitution Beach and along Chelsea Creek
LOCATIONS ◦ The Jeff ries Point to Central Square location
focuses on fl ood entry points along the western and southern edges of the waterfront. Potential fl ood protection solutions could consist of a north/south alignment connecting high points near Central Square and LoPresti Park and an east/west alignment connecting high points at Maverick Square and Jeff ries Point. The north/south segment could potentially tie into existing green space at LoPresti Park and could help create new waterfront access points along East Boston’s western edge. The east/west segment could potentially tie into existing and planned open spaces along the southern waterfront, such as Piers Park, Brophy Park, and Porzio Park.
◦ The Porzio Park location focuses on a fl ood entry point near where Jeff ries Point meets Logan Airport. Potential fl ood protection solutions could connect high points at Sumner Street and Harborside Drive, near the entrance to the Ted Williams Tunnel, with the potential to tie in to existing green space along Massport’s Harborwalk Park.
◦ The Wood Island location focuses on fl ood entry points along the northern edge of Logan Airport, just east of the Wood Island T Station. Potential fl ood protection solutions could connect high points along Belle Isle Inlet to the northern part of Logan Airport, with the potential to tie into existing green spaces at Constitution Beach or Wood Island Bay Edge Park.
2These preliminary coastal fl ood protection concepts are based on a high-level analysis of existing topography, rights-of-way, and urban and environmental conditions. Important additional factors, including existing drainage systems, underground transportation and utility structures, soil conditions, and zoning, as well as any potential external impacts as a result of the project have not been studied in detail. As described in Initiatives 5-2 and 5-3, detailed feasibility studies, including appropriate public and stakeholder engagement, are required in order to better understand the costs and benefi ts of fl ood protection in each location.
3Additional fl ood protection may be required for fl ood events more severe than the 1 percent annual chance fl ood. See Appendix for more detailed information on expected effectiveness of fl ood protection systems, including analysis of additional fl ood protection locations and fl ood frequencies.
◦ The Orient Heights location focuses on fl ood entry points near Constitution Beach and along Chelsea Creek. Potential fl ood protection solutions could consist of two segments: an eastern segment by Constitution Beach, connecting high points near Byron Street and Barnes Avenue, and a western segment by Chelsea Creek, connecting high points near Boardman Street and Eagle Street.
DETAILED CONSIDERATIONS ◦ Multiple alignments likely needed in the
second half of the century: With 9 inches of sea level rise (SLR), fl ood protection between Jeff ries Point and Central Square may provide substantial protection against severe, low-probability fl oods (1 percent annual chance). Adding protection by Porzio Park would be necessary to protect against low-probability (1 percent annual chance) events with 21 inches of SLR, meaning that they do not provide substantial protection from fl oodwaters on their own. Flood pathways from these locations become connected at the 1 percent annual chance event with 21 inches of SLR, necessitating review to determine whether both measures would be required to prevent extensive fl ooding. Very low-probability
(0.1 percent annual chance) storms expected mid-century may require interventions by Wood Island to prevent fl ood pathway connections from Logan Airport. Considering 36 inches of LR, fl ood protection from Jeff ries Point to Central Square, by Porzio Park, and by Wood Island will be necessary to protect large portions of East Boston from high-probability events (10 percent annual chance). Nevertheless, stronger events with lower probability of occurrence may fi nd a possible fl ood pathway from Constitution Beach. Interventions by Orient Heights may be necessary to prevent fl ooding in the southern portion of East Boston for the 2 percent annual chance event with 36 inches of SLR.
◦ Protection of Logan Airport: Portions of Logan Airport may also benefi t from combined fl ood protection at the four locations identifi ed above. Additional fl ood protection along the Boston Inner Harbor and Boston Main Channel would serve to protect the majority of fl ooding expected at Logan later in the century.
OrientHeights
Jeffries Point to Central
SquareWood Island
Porzio Park

Focus Areas 261260 City of Boston: Climate Ready Boston
The City should conduct outreach to managers of facilities in East Boston that serve signifi cant concentrations of vulnerable populations and are not required to have operational preparedness and evacuation plans under current regulations. Targeted facilities will include aff ordable housing complexes, substance abuse treatment centers, daycare facilities, food pantries, small nonprofi t offi ces, and others. Illustrative examples of the types of facilities to which the City might conduct outreach include the East Boston YMCA, East Boston Head Start/Elbow child care facility, and East Boston Neighborhood Health Center. These facilities are exposed to near-term damage from sea level rise and coastal fl ooding, in addition to access issues related to near-term stormwater fl ooding.4 The City may be able to partner with the Neighborhood of Aff ordable Housing (NOAH) on this outreach, given their extensive resilience education eff orts to date.
The City should reach out to small businesses in East Boston exposed to stormwater fl ooding in the near term or coastal fl ooding under a 1 percent annual chance event at 9 inches of SLR to help them develop business continuity plans, evaluate insurance coverage needs, and identify low-cost physical adaptations. All four of East Boston’s major commercial districts (Maverick Square, Central Square, Day Square, and Orient Heights) lie within the 9-inch fl oodplain. Under a 1 percent annual chance event with 9 inches of SLR, 83 commercial buildings and 133 mixed-use buildings that could host small businesses are exposed to fl ood risk.
PREPARED & CONNECTED COMMUNITIES
CONDUCT AN OUTREACH CAMPAIGN TO PRIVATE FACILITIES THAT SERVE VULNERABLE POPULATIONS TO ENSURE THAT THEY ENGAGE IN EMERGENCY PREPAREDNESS AND ADAPTATION PLANNING
EXPAND BOSTON’S SMALL BUSINESS PREPAREDNESS PROGRAM
4The City did not review the extent of existing preparedness planning as part of this study.
CONDUCT FEASIBILITY STUDIES FOR COMMUNITY ENERGY SOLUTIONS
The Infrastructure Coordination Committ ee (ICC) should support coordinated adaptation planning for East Boston’s key infrastructure systems, including transportation, water and sewer, energy, telecommunications, and environmental assets. In the near term, the City should support the MBTA in conducting its planned asset-level vulnerability assessment of the Blue Line, which is highly exposed to fl ooding. At 9 inches of SLR, the Wood Island, Orient Heights, and Suff olk Downs stops are exposed to fl ooding under the 1 percent annual chance event. At 21 inches of SLR, four of East Boston’s fi ve Blue Line stops are exposed to fl ooding at the 1 percent annual chance event. The City also should support MassDOT in pursuing adaptation plans for Central Artery and tunnel assets developed under the 2015 FHA/MassDOT vulnerability assessment.
The 2016 Boston Community Energy Study identifi ed Central Square as a potential location for an emergency microgrid, based on its concentration of critical facilities. The Environment Department should work with local stakeholders and utility providers to explore this location, recognizing that portions of the proposed site are exposed to high-probability coastal fl ooding in the near term, as well as stormwater fl ooding. The Environment Department also should work with the Massachusett s Port Authority to evaluate opportunities for an expansion of the existing solar power capacity at Logan Airport, given that the 2016 Boston Community Energy Study identifi ed it as having high solar generation potential.
RESILIENT INFRASTRUCTURE
ESTABLISH INFRASTRUCTURE COORDINATION COMMITTEE

Focus Areas 263262 City of Boston: Climate Ready Boston
Upon amending the zoning code to support climate readiness (see Initiative 9-2, p.135), the Boston Planning and Development Agency (BPDA) should immediately notify all developers with projects in the development pipeline in the future fl oodplain that they may alter their plans in a manner consistent with the zoning amendments (e.g., elevating their fi rst-fl oor ceilings without violating building height limits), without needing to restart the BPDA permitt ing process. Currently, 56 residential and 18 commercial buildings are under construction or permitt ed in East Boston, representing 2,111 additional housing units and 85,000 SF of new commercial space.
The Boston Planning and Development Agency should incorporate future climate considerations (long-term projections for extreme heat, stormwater fl ooding, and coastal and riverine fl ooding) into major planning eff orts in East Boston.
ADAPTEDBUILDINGS
PROMOTE CLIMATE READINESS FOR PROJECTS IN THE DEVELOPMENT PIPELINE
INCORPORATE FUTURE CLIMATE CONDITIONS INTO AREA PLANS AND ZONING AMENDMENTS
The City should develop and run a Climate Ready Buildings Education Program and a resilience audit program to inform property owners about their current and future climate risks and actions they can undertake to address these risks. To prepare for the most immediate risks, the City should prioritize audits for buildings with at least a 1 percent annual chance of exposure to coastal and riverine fl ooding in the near term, under 9 inches of sea level rise. In East Boston, this includes 1,069 structures, with 74 percent of these consisting of residential and mixed-use buildings that house residents. A resilience audit should help property owners identify cost-eff ective, building-specifi c improvements to reduce fl ood risk, such as backfl ow preventers, elevation of critical equipment, and deployable fl ood barriers; promote interventions that address stormwater runoff or the urban heat island eff ect, such as green roofs or “cool roofs” that refl ect heat; and encourage owners to develop operational preparedness plans and secure appropriate insurance coverage. The resilience audit program should include a combination of mandatory and voluntary, market-based and subsidized elements.
The Offi ce of Budget Management should work with City departments to prioritize upgrades to municipal facilities in East Boston that demonstrate high levels of vulnerability (in terms of the timing and extent of exposure), consequences of partial or full failure, and criticality (with highest priority for impacts on life and safety) from coastal fl ooding in the near term. In the near term, at 9 inches of SLR, Fire Department Engine 9 (Ladder 2), Boston Police Department District A-7, Mario Umana Academy, and BHA’s Heritage housing complex are exposed to fl ooding under the 1 percent annual fl ood event. To address extreme heat risks, the City should prioritize backup power installation at municipal facilities that demonstrate high levels of criticality, including specifi c Boston Centers for Youth and Family and Boston Public School facilities that serve as emergency shelters.
ESTABLISH A CLIMATE READY BUILDINGS EDUCATION PROGRAM FOR PROPERTY OWNERS, SUPPORTED BY A RESILIENCE AUDIT PROGRAM
PREPARE MUNICIPAL FACILITIES FOR CLIMATE CHANGE