Embed Size (px)
Citation preview

EastandSouthAsiainglobaltrade:RegionalintegrationandgeopoliticsShiroArmstrongCrawfordSchoolofEconomicsandGovernmentAustralianNationalUniversity
‐‐‐PreliminaryDraft:pleasedonotcite‐‐‐AbstractThispapermeasurestheintegrationoftheEastAsianandSouthAsianeconomiesintheglobaleconomyandtheirpotentialforregionalandglobaleconomicintegrationthroughmerchandisetrade.EastAsianeconomiesareshowntobeachievingmuchmoreoftheirpotentialtradethanSouthAsianeconomies,bothintermsofintra‐regionaltradebutalsointradewiththerestoftheworld.SouthAsiarealisesmoreofitspotentialtradewithtradepartnersoutsidetheregionthanwithinitsownregion.EastAsianeconomiesingeneralachievemoreoftheirtradepotentialamongEastAsianpartnersthanglobally.IndiaisshowntobeachievingmoreofitstradepotentialwithEastAsia,mostprominentlywithChina,thanwithinitsownregion.TheSino‐Japan,India‐Pakistanandcross‐straitsTaiwan‐mainlandChinabilateralrelationshipsareexaminedtoexplainthatintegrationintotheglobaleconomy,startingwithdeepregionaleconomicintegration,hasallowedeconomicrelationstodominateandconstraindifficultpoliticalrelationsinEastAsiawhileinSouthAsia,adversepoliticalrelationshavehampereddevelopmentoftheeconomicrelationships.ThereisalsoevidenceoftradeinthelessintegratedSouthAsiabeingaffectedmorebytheupsanddownsofpoliticalrelationsthaninEastAsia.

ContentsBackground............................................................................................................................................1
Tradeperformance.............................................................................................................................3
Measuringtradeperformance..................................................................................................3
Results.................................................................................................................................................6
Tradeandpolitics............................................................................................................................10
Politicsinexplainingtradeperformance..........................................................................10
Sino‐Japanrelations...................................................................................................................13
Cross‐Straitsrelations...............................................................................................................14
India‐Pakistanrelations...........................................................................................................15
Conclusions.........................................................................................................................................18
References...........................................................................................................................................19

1
BackgroundEconomicintegrationcanencompassmanydifferentdimensionsofopeningupandincreasingeconomicactivityandinterdependenceacrossborders.Itessentiallyinvolvestheremovalofbarriersatandbehindtheborderwiththeaimofincreasingwelfarefromincreasedtrade,investmentandeconomicactivitythatcomesfromtheabilitytospecialize,developtheeconomyandtakeadvantageofmutuallybeneficialexchangewithothercountries.Thispaperfocusesontrade,themostobviousmeasureandindicatorofeconomicintegration.IntegrationofEastAsianandSouthAsianeconomiesintotheglobaleconomyshowverystarkdifferencesinhowentireregionsapproachandachieveopenness.CountriesinEastAsia1havepursuedpolicystrategiesofopennesstotradeandinvestmentthathaveledtotheirhavinghightradeshareswithotherEastAsianeconomiesaswellasglobally.EastAsiaisoneofthemosteconomicallyintegratedregionsintheworldwithlowbarrierstotradeandinvestmentwithintheregionbutalsotowardstherestoftheworld(ArmstrongandDrysdale,2011).SouthAsia2,ontheotherhand,isoneoftheleasteconomicallyintegratedregionsintheworld(ADB,2008)and,ifmeasuredintermsofintraregionaltradeasashareoftotaltrade,istheregionwiththelowestintegrationglobally(Sally,2011).IntraregionaltradeinSouthAsianwas3.5percentoftotaltradein20093,upfromalowof2percentin1967butsignificantlylowerthanthe19percentin1948(KumarandSingh,2009).Highintraregionaltradeisnotanendgoalinitselfandtradingpartnershipsinopeneconomiesshouldbedeterminedbycomparativeadvantageandmarketforces,buttheadvantagesofproximityareimportant(Linnermann,1966;Frankel,SteinandWei,1997;DisdierandHead,2008).SouthAsianeconomieshadonaveragetradetoGDPratioof42.7percentin2008showingthattheyarestillrelativelylessopenthanEastAsiawhichhadanaveragetradetoGDPratioof63.2percentin20084.Includingservicestrade,theestimatesriseto51percentand67.3percentforSouthAsiaandEastAsia,respectively.SouthAsianeconomieshavelowtradebothwithintheregionandgloballydespitegrowthovertime.Therestofthepaperfocusesonmerchandisetradeandnotservices1EastAsiaisdefinedinthisstudyas‘integrating’EastAsiaastheADB(2008)studydefinedwhichismostoftheeconomiesencompassinggeographicEastAsiaexceptNorthKorea,Burma/MyanmarandthePacificIslandeconomies.2ForthepurposesofthisstudySouthAsiafollowstheWorldBank’sdefinitionandiscomprisedofSAARCmemberslessAfghanistan:Bangladesh,Bhutan,India,theMaldives,Nepal,PakistanandSriLanka.32009and2010dataarenotcompleteforSouthAsianintraregionalflowsintheUnitedNationsComtradedatabaseortheWorldBank'sWorldDevelopmentIndicators.4Source:WorldBank'sWorldDevelopmentIndicatorsonline.EastAsiais'EastAsiaandthePacific'asdefinedbytheWorldBank.

2
tradedespiteitsimportanceinSouthAsiantradeduetodataavailability5.Aregionthathasloweconomicintegrationcanfaceproblemsbeyondlosingoutonbenefitstotradefromeconomicproximity.Politicalinteractionstendtooccuratamuchhigherfrequencybetweenneighboursandhighereconomicinterdependencecanameliorateanddampenadverseeffectsofpoliticaltensions(MansfieldandPollins,2003).Politicaltensionscanactasalargebarriertoeconomicintegrationandlackofeconomicintegrationandinterdependencecanactasaconstraintontheimprovementofpoliticalrelations.SuchanequilibriummightbethoughttocharacterizetheIndia‐Pakistanrelationship,forexample.TheEastAsiancaseisverydifferentwithbilateralrelationshipsthathaveunresolvedhistoricalissuesandpoliticalmistrustenjoyinghighlevelsoftradeandeconomicintegrationbetweenthem.Someoftheserelationships,suchasthatbetweenJapanandChinaandacrosstheTaiwanStraitsbetweenChinaandTaiwan,showtrendsofimprovingpoliticalrelationsovertimeaseconomicrelationsdeepen.ButjusthowintegratedareindividualeconomiesinSouthAsiaandEastAsia,withintheirregionandwiththeglobaleconomy,andhowmuchtradecanweexpectwithinandbeyondtheseregions?ArethelowintraregionaltradesharesinSouthAsiaexpectedgiventheeconomicstructuresofSouthAsiaeconomiesandtheotherdeterminantsofthesecountries'tradepatterns?ArethehighintraregionaltradesharesinEastAsiaduetohowfarEastAsiahasalreadyproceededwithintegrationintotheglobaleconomyorforotherreasons?Thispaperestimatespotentialtradebetweencountriesandanswersthosequestionsthroughanalysisoftheachievementofthatpotential.Itisnotclearfromtradeshareswhetherthesmallintraregionaltradeandtradebetweencertainpartners,suchasIndia‐Chinatrade,isaboveorbelowwhatmightbeexpectedgiventheunderlyingdeterminantsandcharacteristicsofthesecountries'trade.Withoutbenchmarkingtradeperformance,itisnotclearwhetherIndia'stradewithChinaandEastAsia,seeminglyattheexpenseofitstradewithSouthAsianpartners,isduetopolicystrategyorbecausetheEastAsianeconomiesarelargerandmoredynamic.Thepaperisorganizedasfollows.Thenextsectionintroducesthemodeltomeasuretradeperformance.ThentheresultsofachievementoftradepotentialforEastAsia,SouthAsiaandotherregions,aswellasbilateralrelationswithineachregion,arepresented.Politicaldistanceandothermeasuresarethenusedtoexplainsomeofthedifferencesintradeperformance.Thefollowingsectionlooksatthetradeandpoliticalrelationshipsofsomeofthekeybilateralrelationshipsinbothregionsbeforedrawingsomeconclusionsonthe5Servicestradewillhavetobeincludedintheanalysisinadifferentmannerasdifferentmodesofservicesareaffectedbydistancetovaryingdegrees.

3
interactionbetweeneconomicandpoliticalrelations.
Tradeperformance
MeasuringtradeperformanceTradeperformanceisdefinedastheachievementofpotentialtradewithpotentialtradebeingestimatedasthemaximumamountoftradeachievablegiventhecharacteristicsofthetradingrelationshipwhicharebenchmarkedbythecharacteristicsofallothertraderelationships(Armstrong,2007).TradepotentialismeasuredusingstochasticfrontieranalysisappliedtoagravitymodeloftradeandwaspioneeredbyDrysdale,HuangandKalirajan(2000)6.Thefrontier,orpotentialtrade,isdefinedbythecharacteristicsofthemostliberaltradingrelationshipsglobally.Thetradefrontierisbasedonthedeterminantsoftradeandisdefinedbythebesttrade'technologies’worldwideThestandardgravitymodelestimatesthemeaneffectsofalldeterminantsoftradewithvariationsfromthatmeanallsummingtozero.Thestochasticfrontierapproachofthegravitymodelallowsacompositeresidualthatseparatesoutimpedimentstotrade(inefficienciesinthestochasticfrontieranalysisliteraturerelatedtoproduction)thatreducetradefromthefrontier,fromrandomshocksandmeasurementerror,andmostlyfromunobservablefactors.Theperformanceoftraderelationships,ortheirachievementofpotentialtrade,canalsobethoughtofasameasureofeconomicdistancewhere,sincegeographicdistanceisalreadycontrolledfor,highperformanceshowslowresistancetogoodsorcapitalflowsbetweencountries.ThemostliberalandfreeflowingtradeandinvestmentrelationshipsarecharacterisedbyloweconomicdistanceFigure1isastylizeddiagramofthedifferencebetweenagravitymodelwithandwithoutafrontier.Withagravitymodel,thecomparisonofwhereatradeflowperformsisrelativetothemean,orwhatthemodelwouldpredicttradeis,whereasitisanupperbound,orpotential,withthefrontierapproach.
6ForotherstudiesthatusethisapproachseeKalirajanandFindlay(2005),Kalirajan(2008),KangandFratianni(2006)andArmstrongandDrysdale(2011),

4
Figure1Frontierandconventionalgravitymodelcomparison
Source: Kumbhakar and Lovell (2000). Theverticalaxisshowstheamountoftradeandthehorizontalaxisisavectorofthedeterminants.Therearemanyvariantsofthegravitymodelinusewiththechoiceofvariablesandspecificationsvaryingconsiderably.Notallareconsistentwithderivationsfrommicro‐foundationsandnotallhavetheoreticunderpinnings.ThispaperusesavariationofthereducedformversionoftheAndersonandvanWincoop(2003)modelthatiswidelyusedbutaddsacomplementarityvariabletoreflectendowmentstructuresbetweeneconomies.Themodeltobeestimatedis
ln xijt ln0 1 ln yit 2 ln yjt 3 ln Distij 4Borderij 5COMPijt ijt vijt uijt
where
xijtisthetradefromitojattimetandisfromtheIMF’sDirectionofTradeStatisticsandtheUnitedNations'Comtradedatabase(variousyears).Tradeflowsarecalculatedfromimportsinsteadofexportsforaccuracy7.
7Importershavelessincentivetounder‐reportandimportsareamoreaccuratereflectionoftradeflowvaluesthanreportedexports.TheexceptionisEuropeantradewherethereisataxincentivetounder‐reportimportsduetothevalueaddedtaxstructurebutimportflowswereusedforconsistency.Thisiscommonpractice.
X
Trade determinants
Y
potential
actual
Conventional Gravity
Frontier Gravity
X

5
yitiscountryi’ssize(GDP)attimetisfromtheWorldDevelopmentIndicators(WDI)andatcurrentprices.
rDistijtherelativedistancefromitoj.The(greatcircle)distanceisbetweeencapitalcitiesandrelativetothesquarerootofthesumofalldistancesforiandjbetweentheirtradingpartners.ThedataarefromtheChemicalEcologyofInsectswebsite8andtheCEPIIgeodesicDistancesdatabase9.
Borderijisavariablethattakesonthevalueofoneifiandjshareacommonlandborder,zerootherwise.COMPijtisanindexofcomplementarityofi’stradewithjattimetandisfromDrysdale(1967)andDrysdaleandGarnaut(1982):
k j
kj
ki
kw
iw
i
ki
ij M
M
MM
MM
X
XC
whereXisexports,Misimports,subscriptsdenotecountry(i,jandworld)andsuperscriptkimpliescommodityk.TheindexiscalculatedatthethreedigitlevelfromtheAustralianNationalUniversity’sInternationalEconomicDatabank10forallcombinationsofcountriesandyears.Theindexcapturesthecomplementarityoftradestructuresbetweencountriesandthehighertheindexthehigherdegreeofcomplementarity.Multilateral(orthirdcountry)effectsarecontrolledforusingtime‐invariantcountrypairfixedeffects(µij)andtimevaryingcountrypairfixedeffects(µijt)asiscommonlydonetoavoidbiasthatAndersonandvanWincoop(2003)identify(seeBaldwinandTaglioni,2006).Thedisturbancetermvijtaccountsforrandomvariationintradesimilartothedisturbanceterminthestandardordinaryleastsquaresmodel.Thenon‐negative(orone‐sided)disturbanceterm,uijt,measuresthedifferencebetweenpotentialtradeandactualtrade.Moreprecisely,itistheamountoftradethatfallsshortofthefrontierfortradefromcountryitojattimet.Othervariablescommonlyincludedingravitymodels,suchastradebarriermeasures(tarifflevels),measuresofriskoreconomicfreedom,regionalgroupingsandlanguagesimilarity,arenotincludedherebutareinsteadincludedinexplainingthetradeperformanceinaseparatemodellaterinthepaper.ThecoredeterminantsasperAndersonandvanWincoop(2003)areusedtoestimatethepotentialandthenalltradeimpediments,policyvariablesandotherinstitutionalqualityindicatorsareusedfirsttoexplainthedistancefromthefrontier.
8http://www.chemical‐ecology.net/9http://www.cepii.fr/anglaisgraph/bdd/distances.htm10http://iedb.anu.edu.au/

6
Themodelisestimatedforadatasetthatisarepresentativesampleofworldtradecomprisedofbilateralflowsbetweenthetop65tradingnationsfortheperiod1990to2006.ThisperiodisusedbecauseitincludestheIndianreformsoftheearly1990s,theperiodwhenChineseimportswerealmostcompletelybannedbyTaiwan,China'saccessiontotheWTOandothersignificanteventsisbeforetheglobalfinancialcrisis.Also,theavailabilityofthepoliticaldistancedata,discussedlater,islimitedtotheperiod1990‐2004.ThemodelcanbeestimatedusingthestatisticalprogramsGAUSS,STATA,LIMDEP,andFRONTIER4.1.TheresultsoftheestimationusingFRONTIER4.1areshowninTable1.
ResultsTable1Maximumlikelihoodestimationfrontiergravityestimationresults
(1) (2) (3)Dependentvariableln(tradeijt)
OLS Frontiercountrypair
Frontierw
countrypair&timedummies
Constant ‐24.28*** ‐20.52*** ‐21.05*** (0.1207) (0.1214) (0.127)
lnGDPit 0.85*** 0.77*** 0.78*** (0.0033) (0.0034) (0.0033)
lnGDPjt 0.79*** 0.76*** 0.76*** (0.0031) (0.0031) (0.0031)
rDistij ‐2.42*** ‐2.27*** ‐2.24*** (0.0243) (0.0237) (0.0229)
Compijt 1.11*** 1.33*** 1.089***
(0.0329) (0.0307) (0.0302)
Borderij 1.73*** 1.97*** 1.98*** (0.0137) (0.0155) (0.0145)
sigma‐squared 1.77 52.04*** 7.908*** (0.1529) (0.173)
Gamma 0.89*** 0.88***
Mu ‐5.37 ‐5.29
loglikelihoodfunction ‐103285 ‐101457 ‐101324Numberofobservations 60565 60565 60565
Note: Standard errors in parentheses. * p < 0.05, ** p < 0.01, *** p < 0.001. Coefficient estimates for time dummies are not included to save space.

7
TheresultsareconsistentwiththefindingsofthevastliteratureongravitymodelsandshowtheexpectedsignandmagnitudeforthecoefficientestimatesofGDP,distanceandbordervariables.Ahigherdegreeofcomplementarityintradeexplainshighertrade.Loglikelihoodratiotestsdeterminethatthespecificationincolumn3ofcountrypairandtimedummyvariablesisthebestfitforthedata.Loglikelihoodratiotestsalsodeterminedthatatruncatednormaldistributionfortheone‐sidederrortermfitsthedatabetterthanahalfnormaldistribution.Tradeperformance,orrealisationofpotentialisgivenbyactualtradeasaratioofpotentialtrade.Table2showsthattheworldaveragetradeperformanceis50percentovertimeandisfairlysteady.AlthoughresultsforselectedyearsonlyareshowninTable2,theworldtradeperformanceiseither49percentor50percentineachyearforthewholeperiod.Table2Tradeperformanceresults,selectedregionsandyearsRegion 1990 1995 2000 2006 Average
Worldaverage 0.49 0.50 0.50 0.49 0.50
EastAsianExports 0.54 0.57 0.59 0.60 0.58
EastAsianImports 0.54 0.55 0.54 0.54 0.54
EastAsianIntraregional 0.63 0.64 0.66 0.67 0.65
SouthAsianExports 0.39 0.43 0.41 0.41 0.41
SouthAsianImports 0.45 0.45 0.41 0.44 0.43
SouthAsianIntraregional 0.31 0.35 0.24 0.25 0.27
Europeintraregional 0.53 0.54 0.57 0.54 0.54
NorthAmericaIntraregional 0.47 0.58 0.59 0.58 0.57
Source:Author'scalculationsNote:EuropeisEU‐15.
At60percentforexportsand54percentforimportsin2006,EastAsiantradeonaveragerealisesmoreofitstradepotentialthantheworldonaverage;EastAsiaaveragesclosetothosenumbersoverthewholesampleperiod.EastAsianintraregionaltradeisat67percentofpotentialin2006whichisthehighestintheworldwithNorthAmericaat58percentandEuropeat54percent.TherealisationofSouthAsianregionaltradepotentialisthelowestamongtheseregions,at25percentin2006.SouthAsiarealisesmoreofitspotentialtradewithtradepartnersoutsidetheregionthanwithinitsownregion.SouthAsiarealisesover40percentofbothexportandimportpotentialwithextra‐regionaltradingpartners,onaverage,comparedtoaround27percentofitsintraregional

8
tradepotential.SouthAsia'sintraregionaltradeperformancehasalsobeenfallingovertime.TheresultsareconsistentwiththoseobtainedinArmstrong,DrysdaleandKalirajan(2008)whichalsousedastochasticfrontierappliedtoagravitymodelbutwithdifferentspecifications.InthatstudyASEANhadthehighestintraregionaltradeperformance,followedbyEastAsiamorebroadly,thenNorthAmerica,EuropeandwithSouthAsiathelowest.Table3showsselectedbilateralandcountryaverageresultsforthesameyearsasTable2.Theresultsareselectedandaveragedfromthe60,565bilateralresults(thesameasthenumberofobservationsinmodel—seeTable1).Pakistanitradeisclosertopotential,onaverage,thanPakistanitradewithIndia.Indiaisachievinghighertradepotential,onaverage,thaninthebilateralrelationshipwithPakistanaswell.Averageexporttradeperformanceisaround40percentofitspotentialovertimewithaverageimporttradeperformancefallingovertimefrom46percentto41percentofpotentialin2006.Bycomparison,Pakistan'stradewithIndiaislower,achievinganaverageof21percentoftradefromPakistantoIndiaovertheperiod1990‐2006and32percentofpotentialtradeintheotherdirectionoverthesameperiod(Table3).India'stradewithEastAsiaisclosertopotentialthanitstradewiththerestofSouthAsia.BothIndia'sexportsto,andimportsfrom,EastAsiaarerisingovertimewithexportsat53percentofpotentialandimportsat59percentofpotentialin2006,bothhigherthantheworldaverage.India'stradeisshowingbias,orstrongerperformance,intradewithEastAsiathanwithIndiantradeoverall,asuccessfulresultofglobalopennessaswell,perhaps,ofthelookEastpolicystrategy.SomebilateralrelationshipsinEastAsiaareworthspecialnote.TradebetweenJapanandChinarealisedmoreofitspotentialthanJapan'stradeonaverageandChina'simports,whileonparwithChina'saverageexportperformance.Atanaverageof59percentovertheentireperiodforChineseexportstoJapan,and57percentforimportsfromJapan,therelationshipisrealisingmoreofitspotentialthantheaverageofitsglobaltradingrelationships,at50percentofpotential.Whiletheglobalaverageissteadyovertime,theJapan‐Chinarelationshipregistersimprovementinrealisedpotentialovertheentireperiod.

9
Table3Countryandbilateraltradeperformance,selectedyearsExporter Importer 1990 1995 2000 2006 Average
Worldaverage 0.49 0.50 0.50 0.49 0.50
EastAsiaChina World 0.50 0.54 0.58 0.65 0.57
World China 0.46 0.48 0.47 0.54 0.48
China EastAsia 0.58 0.62 0.64 0.68 0.63
EastAsia China 0.49 0.55 0.60 0.65 0.58
China Japan 0.55 0.57 0.60 0.64 0.59
Japan China 0.48 0.56 0.57 0.62 0.57
Japan World 0.53 0.50 0.52 0.54 0.52
World Japan 0.46 0.42 0.43 0.45 0.43
China Taiwan 0 0.18 0.45 0.67 0.36
Taiwan China 0.42 0.64 0.65 0.71 0.63
Taiwan EastAsia 0.68 0.63 0.64 0.67 0.64
EastAsia Taiwan 0.67 0.67 0.67 0.67 0.67
Taiwan World 0.61 0.60 0.61 0.62 0.60
World Taiwan 0.54 0.58 0.58 0.58 0.57
SouthAsiaIndia World 0.37 0.45 0.45 0.47 0.44
World India 0.39 0.38 0.41 0.50 0.42
India SouthAsia 0.31 0.23 0.18 0.29 0.26
SouthAsia India 0.26 0.37 0.38 0.42 0.35
India EastAsia 0.43 0.50 0.51 0.53 0.50
EastAsia India 0.44 0.47 0.50 0.59 0.50
India Pakistan 0.30 0.28 0.24 0.24 0.21
Pakistan India 0.32 0.27 0.27 0.30 0.32
Pakistan World 0.38 0.42 0.37 0.37 0.39
World Pakistan 0.46 0.46 0.36 0.41 0.41
SriLanka World 0.45 0.46 0.47 0.43 0.46
World SriLanka 0.53 0.53 0.47 0.45 0.50
Source:Author'scalculationsNotes:datafortheyear2000wasmissingforsomeintra‐SouthAsiantradesothedatadisplayedistheaverageofdatafrom1999and2001.Thedataarerelativelystableovertime.
Cross‐straitstradeperformancebetweenTaiwanandChinaisalsoveryhighin2006at71percentfromTaiwantoChinaand67percenttheotherway.Andthisachievementcanbemeasuredinthecontextoftheirhavingbeenvirtuallynodirecttradebetweenthetwoeconomiesintheearly1990swithTaiwanpursuingapolicyofunilateralbansonimportsfromChinathatwereonly

10
graduallyliftedovertheperiodunderstudy.ActualtopotentialTaiwanesetradeinEastAsiawasveryhigh(ataround65percent)throughouttheentireperiodunderstudydespiteitsseverelylimitingimportsfromChina.Taiwan'stradeinEastAsiarealisedmuchmoreofitspotentialthanTaiwan'stradewiththerestoftheworld.Ireturntodiscussionofthisrelationshipbelow.
TradeandpoliticsWhataretheimplicationsofSouthAsiaonlyrealizing27percentofitspotentialintraregionaltradecomparedto65percentinEastAsia,54percentinEuropeand57percentinNorthAmerica?WhatisinhibitingIndiaandPakistanfromrealisingmoreoftheirtradepotentialandhavingtheirpotentialeconomicinterdependenceimprovetheirpoliticalrelationship?Therestofthispaperattemptstoaddressthesequestions.
PoliticsinexplainingtradeperformanceThetradeperformancecanbeexplainedbyvariablesthatreflecttradepolicy,domesticandpartnereconomicandpoliticalconditions,aswellasinstitutionalfactors.Thissectionindentifiesanumberofvariablesthatproxythesedeterminantsoftradeperformanceandallowameasureofwhethercertainvariablessuchaspoliticaldistancebetweencountriesaffectthetradeperformanceasmeasuredindetailabove.Thereisavastliteratureontheinteractionbetweentradeandinterstateconflict(orcooperation)thatrevealsacomplicatedrelationshipwithcausalitybetweentradeandpoliticsdependingonthecountries,thesymmetryintherelationship,thetypeofgoodstradedandthetimeperiod(ReuvenyandKang,1996;MansfieldandPollins,2003).EachbilateralrelationshipfacesdifferentcircumstancesatdifferentpointsintimeandafewofthekeyrelationshipsinEastAsiaandSouthAsiathathaveresultedindifferentoutcomesintheinteractionbetweenpoliticsandeconomics,areworthreviewing.Politicaldistancebetweencountriescausesuncertaintytoincreaseandactsasanimpedimenttotradeorinvestment.Significantandprolongedlowintensityconflicts,aswellaspositivepoliticaldevelopmentsfosteringcooperationintherelationship,canaffectatradeoreconomicrelationship(Armstrong,2009).Thepoliticaldistancevariableusedinthisstudyisameasureof‘sentiment’towardsanothercountry,separatedintobothpositiveandnegativeelements,basedoneventcodingfromnewspaperarticles.ThedataarefromKing(2003)andareupdatedto2004datainthenewIDEAdataset.Eventsoractions

11
betweencountriesaregivenweightsonascaleofseveritythathas200categoriesand,toreducereportingbias,isallcodedfromReutersBusinessBriefs.Thereisanestablishedliteraturewhichemploys,testsanddevelopssucheventdata(MansfieldandPollins,2003).Thedataareeventsoractionsbetweencountriesandishighfrequency(monthly)whichareaggregatedtoanannualmeasureforthisstudyandthecooperationnetofconflictisusedhereasinArmstrong(2009)andArmstrongandDrysdale(2011).Inordertoestimatewhetherpoliticaldistancebetweencountrieshasaneffectontrade,orinthiscasewhetherithelpsexplaintherealisationorlackofrealisationoftradepotential,itisincludedasanexplanatoryvariablealongsideothervariableswiththeactualtopotentialtraderatioasthedependentvariable.Theothervariablesincludeindexesofeconomicfreedomforbothexporter(i)andimporter(j)whicharefromtheFraserInstitute(Gwartneyetal.,2008).Theaveragetariffrateforeachexporterandimporterisalsoextractedfromtheindexofeconomicfreedom.Thereisassumedtobeverylittlecorrelationbetweentheeconomicfreedomindexandthetariffrate,astheeconomicfreedomindexiscalculatedfrommanyvariablesofwhichthetariffrateisonlyone.AlanguageindexisalsoincludedanisbasedonBoissoandFerrantino(1997)whichisanindexthattakesavalueof0ifnoneofthepopulationofcountryispeaksthesamelanguageasincountryjandavalueof10,000ifallofthepopulationinbothcountriesspeakthesamelanguage.Duetothelackofdataavailability,thelanguagesimilarityindexdoesnotchangeoverthe27yearperiod.ItispreferabletootherlanguagesimilarityvariablessuchasintheCEPIIdatabasethatareoftenbinary,takingthevalueofoneiftwocountriessharethesamelanguageandzerootherwise.Finally,regionalgroupingvariablesareincludedtoseewhetherbeingamemberofaparticularregionalgroupinghelpsexplainsomeoftherealisationoftradepotential.TheresultsforthemodelarepresentedinTable4.

12
Table4Explainingtradeperformance (1) (2) (3)
Freedom index Exporter 0.0248*** 0.0238*** 0.0196*** (0.0008) (0.00084) (0.000835)
Freedom index Importer 0.0247*** 0.0229*** 0.0207*** (0.000673) (0.000698) (0.000691)
Exporter tariff 0.000795** 0.000280 0.000300 (0.000292) (0.000302) (0.000297)
Importer tariff -0.00232*** -0.00274*** -0.00256*** (0.000296) (0.000307) (0.000301)
Language similarity 0.0000104*** 0.0000103*** 0.00000929*** (0.000000418) (0.000000411) (0.000000414)
Political distance -0.0000129 (0.0000221)
EA* Political dist 0.000394*** (0.0000959)
SA* Political dist -0.00423*** (0.000742)
Lagged political dist -0.0000131 -0.00000945 (0.0000217) (0.0000212)
EA* Lagged political dist 0.000377*** -0.0000132 (0.0000935) (0.0000920)
SA* Lagged political dist -0.00542*** -0.00240** (0.000821) (0.000850)
APEC 0.104*** (0.00328)
ASEAN 0.0919*** (0.00921)
NAFTA 0.00267 (0.0259)
EU 0.0491*** (0.00386)
SAARC -0.177*** (0.0168)
ANDEAN 0.0637*** (0.0123)
MERCOSUR 0.103*** (0.0116)
constant 0.179*** 0.204*** 0.238*** (0.00661) (0.00705) (0.00708) N 40181 38984 38984 Note:Standarderrorsinparentheses.*p<0.05,**p<0.01,***p<0.001.
Threedifferentmodelsareestimatedwithdifferentspecificationsforpoliticaldistanceandwiththelastmodel(incolumn3)includingavariableforregionalgroupings.Higherscoresofeconomicfreedomforboththeexporterandimporterareassociatedwithhigherrealisationoftradepotential.Highertariffsbytheexportingcountryreducesthedistancetothefrontierbuthighertariffsbytheimporterisassociatedwithlowerrealisationoftradeperformance,aswouldbe
13
expected.Languagesimilarityisassociatedwithincreasedtradeperformance.BeingamemberofAPEC,ANDEAN,ASEAN,MERCOSERandtheEUareassociatedwithhigherrealisedtradepotentialwithinthatgroup.BeingamemberofSAARCisassociatedwithlowertradeperformanceamongSAARCmembers—aresultthatisthesameasthatdiscussedabove.TheresultssuggestNAFTAdoesnothaveastatisticallysignificanteffectontradeperformance.aresultwhichisunexpected.AllthreeNAFTAmembersarepartofAPECsotheNAFTAeffectmaybepickedupintheAPECvariable.Thepoliticaldistancevariablesthatareincludedareforthewholesample(Politicaldistance),aswellasthatvariableinteractedwithadummyvariableforEastAsiaandSouthAsia.Theyarealsoincludedwithaoneyearlagtoreflectthelaggedeffectwhichoftenvariesbutisgenerallyacceptedtoberoughlyoneyear.(ReuvenyandKang,1998).TheresultsshowthattradeperformanceinSouthAsiaismoreaffectedbypoliticaldistancethanitisinEastAsia.Thisisanimportantresult.ThereisnostrongevidencethatpoliticsaffectstradeperformanceatthegloballevelconsistentwiththeideathatmosttradeisconductedundertheWorldTradeOrganizationsystemandisarms‐lengthandsowouldnotbesosensitivetopolitics,unlikeinvestmentthatrequiresmorecommitmenttoeconomicengagementinanothercountry(ArmstrongandDrysdale,2011).Thelackofaglobalresultforpoliticsaffectingtradeisnotsurprisinggiventhatthedirectionofcausalitybetweenpoliticaldistanceandtradeisnotclear(Polachek,1980;ReuvenyandKang,1998;MansfieldandPollins,2003)andthatthedirectionofeffectisalsounclear.Whileimprovedpoliticalrelations(anarrowingofpoliticaldistance)isusuallyassociatedwithanincreaseintrade,tradehasbeenfoundtoincreaseaswellasdecreasepoliticalamityandenmitybetweencountries(BarbieriandSchneider,1999;MansfieldandPollins,2001).Giventhattheeffectofpoliticalrelationsontradedifferbycountrypairandovertime,thenextsectiontakesacloserlookatsomekeyrelationsinEastAsiaandSouthAsiathatcanfurthertheunderstandingofthefindingsthusfar.
Sino‐JapanrelationsTheeconomicrelationshipbetweenChinaandJapanisoneofthelargestintheworld.Intermsoftrade,itisbehindonlyChina‐USandUS‐Canadainaggregatesize.Giventhattheyarethesecondandthirdlargesteconomiesglobally,andtheyareincloseproximity,ahighleveloftradeisexpected.Buthightradesharesandeconomicinterdependencehaveoccurredwiththebackdropofunresolvedhistoricalissuesthatflareupfromtimetotimeandstrainthe
14
politicalrelationship.Theperiodcoveredinthispaper,1990to2006,includestheperiod2001to2006wherepoliticaltensionsrosetoalevelwhereleadershipvisitsweresuspendedbetweenthetwocountriesandtherewerelargeprotestsinChinaagainstJapanandboycottsaimedatJapanesegoods.Yetthesepoliticaltensionsdidnotderailtheeconomicrelations.Thetradeperformanceresultsshowthatinfact62percentoftradefromJapantoChinaand64percentoftradefromChinatoJapanisrealised,significantlyhigherthantheglobalaverage,theaverageofJapan'sexports,theaverageofJapan'simports,theaverageofChina'simportsandonparwiththeaverageofChina'sexportsin2006(seeTable2).Thisperformanceagainstpotentialwasnotaffectedsignificantlyatallbydisturbanceinthepoliticalrelationshipbetweenthesetwopartners.SotheJapan‐Chinatraderelationshiprealisedmoreofitspotentialtradethanothertraderelationships,onaverage.Thathappeneddespitethepoliticaltensionsandconflictsthatrosefairlyhighfromtimetotime.Theperiodofheightenedpoliticaltension,representedbytherisingnegativeactionsoreventsstartingin2001,coincidewithaperiodofpositivegloballydirectedactionsoreventstodowithChina'saccessiontotheWorldTradeOrganization(WTO)inDecember2001.ItwasnotsimplythepositivenewsfromChinajoiningtheWTOthatoffsettheconflictandtension.LowintensityconflictexistedpriortoWTOaccessionandindeedthecontemporaryJapan‐Chinarelationshipsinceengagementin1978featuredperiodsofhighintensityconflict.ButChina'scommitmenttotheglobaltradingsystemsince1986withrapidtradeliberalisationandeconomicreformiswhatgaveJapanesefirmsconfidenceindealingwithChinesecounterparts(Armstrong,2009).Chinasteadilyandincreasinglyconstraineditselftoglobaltradingrulesandnormsthroughits15yearaccessionmarchtowardsmembershipoftheGATTandlatertheWTO.
Cross‐StraitsrelationsPoliticalrelationsbetweenTaiwanandChinaareevenmoredifficultandcomplicatedthantherelationsbetweenChinaandJapan.Inadditionto,andbecauseof,thepoliticaldifficulties,TaiwanhadearlierbannedimportsfromChina.Thesebanswereonlygraduallyliftedduringthe1990sandthenmorerapidlyafterbothChinaandTaiwan’saccessiontotheWTO(DrysdaleandXu,2004;Armstrong,2010).

15
Asaresultofthegradualliftingofbans(aconsiderablenumberofwhichstillpersistin2011)realisationofpotentialtradefromChinatoTaiwanhasrisenrapidlyandin2006wasat67percent,significantlyhigherthantheworldaverageandTaiwan’saverageimportsglobally,andonparwithTaiwan’simportsfromotherEastAsiancountries.Politicalandeconomicrelationshaveimprovedfurthersince2006withasignificanteconomicframeworkagreementthataimstoreducethetradeandotherbarriersovertimesignedin2010.ThereareTaiwanesefirmsinChinathatwerenotabletoexportproductsbacktoTaiwanandmanystillcannoteasilyrepatriateprofits.MuchtradeandcapitalhadtopassthroughHongKongwhichwascostlygiventheextradistanceandtransactionscostsinahighlycompetitiveregionwithsmallprofitmarginsacrosstheproductionchain.TaiwanesetradewiththerestofEastAsiawasperformingatanaverageofcloseto60percentfor1990to2006.Taiwanwasdeeplyintegratedintotheregionaleconomyandpartofthecomplexproductionnetworksthatproducespartsandcomponentswheretheyarecheapesttoproduceandthentradedthemtobeassembled.GiventhatbothChinaandTaiwanaresointegratedintotheregionaleconomy,thelostpotentialintradewastoolargeandtheopportunitycostofTaiwan’sdiscriminatoryprotectionistpoliciesbecametooapparentandacute.ItwasthedeepintegrationintotheregionaleconomybybothChinaandTaiwanthathascarriedthebilateraleconomicrelationshipbeyondbeingsimplybilateralinitsnature.EconomicinterdependencebetweenChinaandTaiwangrewastheyincreasinglybecamemoreinterdependentonthesameregionaleconomy.
India‐PakistanrelationsWhiletherelationshipbetweenIndiaandPakistanisunique,andthepoliticaltensionsandhistoricalcircumstancesseriouslydifferfromtheJapan‐China,cross‐Straitsandotherrelationships,thereareusefulinferencesthatcanbedrawnfromthoserelationshipsthathighlightthereasonswhythenegativepoliticshashamperedthedevelopmentofanysignificanttradebetweenIndiaandPakistan.TradefromPakistantoIndiawasachieving30percentofpotentialin2006andtradefromIndiatoPakistanwasat24percentofpotential,significantlybelowaverageIndiantradeperformance,averagePakistantradeperformanceandtheglobalaverage.Thoseresultsareconsistentotherestimatesthatusedthegravitymodelwithoutafrontiersuggestingthatpotentialtradecouldbebetween5and

16
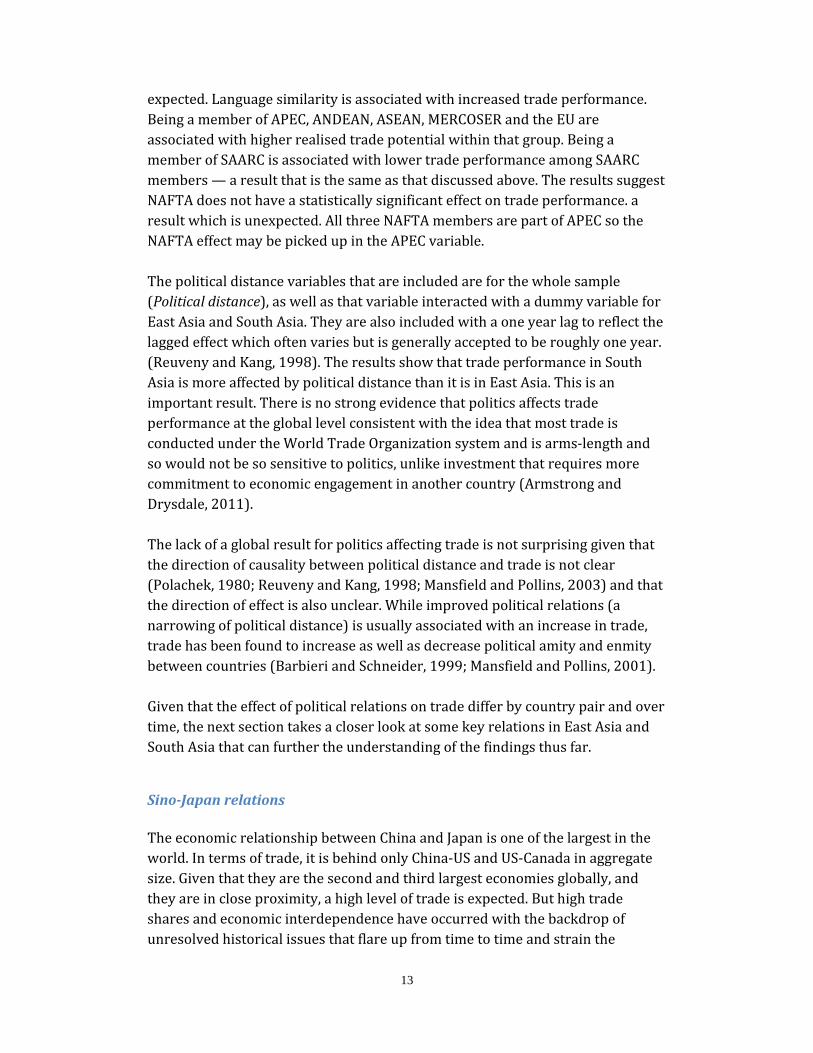
10timeshigherthanactualtrade(Taneja,2006;Batra,2004;Kemal,Abbas,andQadir,2002;Khan,2009).Positivenewsandeventshaveincreasedineitherfrequencyorintensitysincethebeginningofthelastdecade(seeFigure2)buttheyhavebeencompletelyswampedbyveryhighintensitynegativeconflicts.Figures2and3showtheKing(2003)datausedaboveforIndiaandPakistan.Thevariablereportedasaction,eventornewsfromIndiatowardsPakistanishighlycorrelatedwiththereportingintheotherdirectionsoFigure3showsthenetofpositiveandnegative,whichiswhatwasusedintheanalysisabove11.Figure2PositiveandnegativenewsandeventsasreportedfromIndiatowardsPakistan
Source:datafromKing(2003)
11Thenegativeeventsaresubtractedfromthepositiveeventstoobtainameasureofnetpoliticalcloseness.Asinutilitytheory,theassumptionhereisthatpositiveeventscanceloutnegativeeventstoacertainextent.Therefore,apositivevalueforthepoliticalvariableindicatespoliticalclosenessandanegativevalueindicateswideningpoliticaldistance.Amovementinapositivedirectionimpliesanarrowingpoliticaldistance.
0
20
40
60
80
100
120
1990 1991 1992 1993 1994 1995 1996 1997 1998 1999 2000 2001 2002 2003 2004
Positive Negative

17
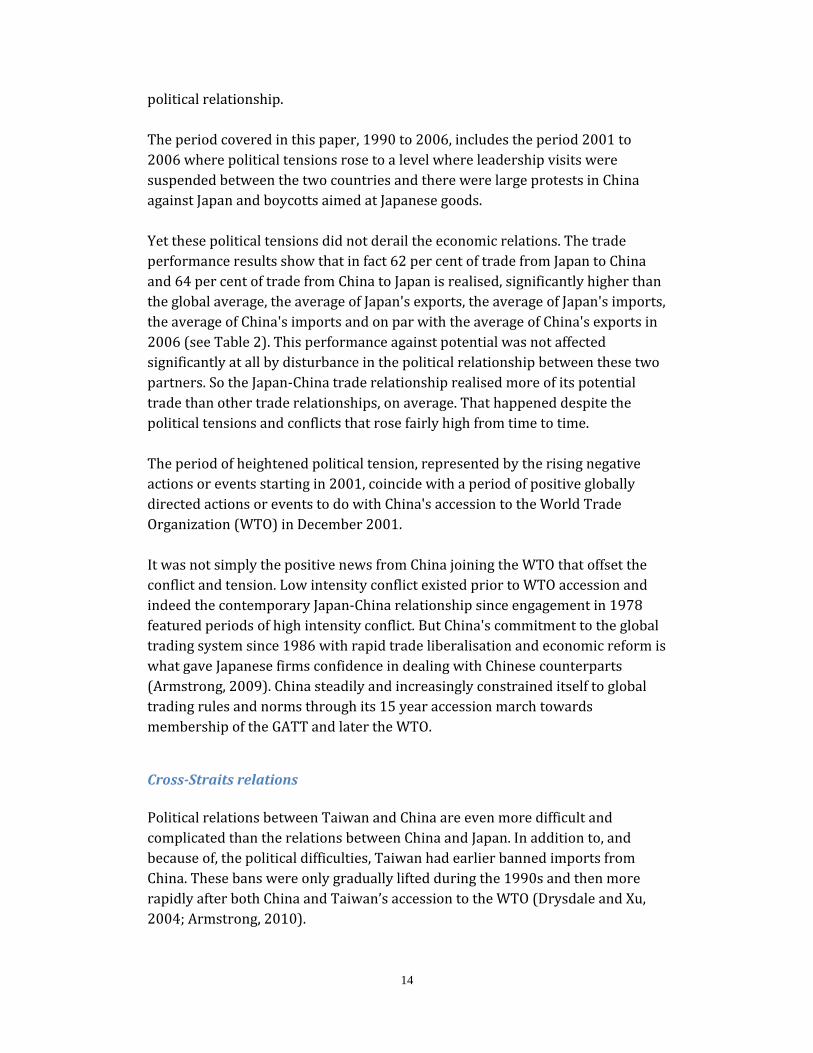
Figure3NetcooperationasreportedfromPakistantowardsIndia
Source:datafromKing(2003).Netcooperationispositivenewsandeventslessnegativenewsandevents.
BothFigure2andFigure3showthatthenegativesoutweighthepositivesintheIndia‐Pakistanrelationship.Whilethatcouldbetheresultoftheweightingsystemappliedtotheeventsdata,thenetcooperationvariableforJapan‐ChinaandTaiwan‐Chinaisconsistentlypositive.Pakistanhasnotyetreciprocatedmostfavorednation(MFN)statusforIndiaandmaintainsafairlynarrowpositivelist(786items)ongoodsthatIndiamayexporttoPakistan(Khan,2009).Atthesametime,India’stariffratesremainhigh,especiallyforgoodsofparticularinteresttoPakistan,suchastextiles,leather,andonyx,andnontariffbarriersaresubstantial(Khan,2009).Unlikethecross‐Straitscasewhereimpedimentstotradewerereducedovertimeastheregionaleconomybecamemoreintegratedaroundthem,thelackofSouthAsianeconomicintegrationandinterdependencemeansthereismuchlessincentivetoreducebarrierstotradeorimprovethepoorinfrastructure,liftbansoninvestmentandeasepeoplemovementacrosstheborder.SinceSouthAsianeconomicintegrationislagging,dealingsbetweenIndiaandPakistanareprimarilybilateralanddonothavethepositivesumeconomicelementthatispresentinEastAsia.Thatinevitablyleadstothepolitical‐securityissuesdominatingbilateraldealings(andlackofpositiveeconomicnewsandeventsbetweenthetwoinFigures2and3).Politicaltensionshavedominatedtheeconomicrelationsandeconomicrelationshavenotbeenabletoimproveandhaveapositiveeffectonthepoliticalrelationship.
‐160
‐120
‐80
‐40
0
40
80
1990 1991 1992 1993 1994 1995 1996 1997 1998 1999 2000 2001 2002 2003 2004

18
ConclusionsTherearethreesetsofconclusionsthatmightbehighlightedfromthisdiscussion.First,EastAsiaismoreintegratedthanSouthAsia,bothintermsofintraregionaltradeandwiththeglobaleconomy.EastAsiaisalsorealisingmoreofitsintraregionaltradepotentialthanNorthAmericaandEurope.Infact,EastAsianeconomiesingeneralachievemoreoftheirtradepotentialamongEastAsianpartnerscomparedtotheirtradeglobally.SouthAsia,ontheotherhand,realisesmoreofitspotentialtradewithtradepartnersoutsidetheregionthanwithinitsownregion.Keybilateralandcountrytraderesultsaddtotheunderstandingofthoseregionalleveltradepatterns.IndiaisrealisingmoreofitstradepotentialwithEastAsiathanwithitsownregionandtherestoftheworld.PakistanitradewithIndiaisrealisingmuchlessofitspotentialthanPakistanitradeoverall.TradebetweenJapanandChinaovertheperiod1990‐2006andbetweenChinaandTaiwanlaterinthatperiod,areperformingclosertopotentialthantheiroveralltradeandmuchmorethantheglobalaverage.Second,theeffectontradeofpoliticaldistancebetweencountriesismorepronouncedforSouthAsiathanitisinEastAsia.ThisresultismostlikelyduetothefactthatEastAsiaismuchmoreeconomicallyintegratedthanSouthAsia.ThestoryinmostofEastAsiahasbeenthatofeconomicrelationsdominatingthepoliticalrelationsandthepositivesofincreasedeconomicinterdependencedampeningtheeffectsofthenegativeaspectsofpoliticalrelations.InSouthAsiatheupsanddownsofpoliticalrelationshavealargernegativeeffectontrade.Finally,theexperienceoftheJapan‐Chinarelationshipshowstheimportanceofcountriesintegratingintotheglobaleconomyandbeingpartoftheglobaltradingsystemforbilateralrelationshipstoprosper.Theexperienceofthecross‐Straitsrelationshiphighlightstheimportanceofintraregionaleconomicintegrationforimprovingbilateraleconomicrelations.IndiaandPakistanareneighboursinaregionthathasmuchlowerachievementofpotentialtradethantheglobalaverageandistheleasteconomicallyintegratedregionglobally.Allbilateraleconomicdealingsareswampedbybilateralpoliticaldealingswhicharedominatedbynegative‐sumorzero‐sumsecurityissues.TheexperienceofEastAsiawhichshowsthatbilateraleconomicrelationsnestedinahighlyintegratedregionthatisoutwardlookingandgloballyorientedcanhelptodampenandevenreversetheeffectsofpolitical

19
conflictontrade.Thenon‐integratingEastAsianeconomiesofNorthKoreaandMyanmarareimportantexamplesofclosedeconomiesassociatedwithpoliticalconflict'sdominatingbilateralrelationswiththeirneighboursandbeyond.AstrategicinferencefromtheseconclusionsandtheargumenthereisthatpoliticalproblemsthatlimiteconomicintegrationinSouthAsiaarelikelytobecomemoretractableifthewholeregionistiedmorecloselyintopositivetradeandeconomicrelationstrans‐regionallyandgloballyandtofullobservanceoftheglobalrulesoftrade.
ReferencesADB(AsiaDevelopmentBank),2008.EmergingAsianRegionalism:APartnership
forSharedProsperity,Manila.Anderson,J.E.andvanWincoop,E.,2003.'Gravitywithgravitas:asolutiontothe
borderpuzzle',AmericanEconomicReview,93(1):170–92.Armstrong(2007).‘Measuringtradeandtradeperformance:asurvey’,Asia
PacificEconomicPapers,No.368.Armstrong(2009)2009.TheJapanChinaeconomicrelationship:distance,
institutionsandpolitics,Canberra,AustralianNationalUniversity,PhDthesis.
Armstrong,S.2010.'Taiwan'sAsiaPacificEconomicStrategiesPost‐EconomicFrameworkAgreement',EastAsiaBureauofEconomicResearchWorkingPaperNo.63.AvailableatSSRN:http://ssrn.com/abstract=1767688
Armstrong,S.andP.Drysdale,2011.‘TheInfluenceofEconomicsandPoliticsontheStructureofWorldTradeandInvestmentFlows’,inArmstrong,S.(ed)‘ThePoliticsandtheEconomicsofIntegrationinAsiaandthePacific’,Routledge,forthcoming.Alsoavailableasworkingpaperfromhttp://papers.ssrn.com/sol3/papers.cfm?abstract_id=1767687
Armstrong,ShiroPatrick,Drysdale,PeterandKalirajan,KaliappaP.,AsianTradeStructuresandTradePotential:AnInitialAnalysisofSouthandEastAsianTrade(2008).AvailableatSSRN:http://ssrn.com/abstract=1767686
Baldwin,R.E.andTaglioni,D.,2006.'Gravityfordummiesanddummiesforgravityequations',NBERWorkingPaperNo.W12516,NationalBureauofEconomicResearch.
Barbieri,K.andSchneider,G.,1999.‘Globalizationandpeace:assessingnewdirectionsinthestudyoftradeandconflict’,JournalofPeaceResearch,36:387‐404.
Bandara,J.S.andW.Yu.2003.HowDesirableistheSouthAsianFreeTradeArea?AQuantitativeAssessment.TheWorldEconomy.26(9).pp.1293‐1323.]
Batra,Amita(2004).‘India'sGlobalTradePotential:TheGravityModelApproach’,WorkingPaperNo.151.IndianCouncilforResearchonInternational
Disdier,A.andK.Head,2008.‘ThePuzzlingPersistenceoftheDistanceEffectonBilateralTrade’,TheReviewofEconomicsandStatistics,Vol.90,No.1,Pages37‐48.

20
Drysdale,P.D.,1967.Australian‐Japanesetrade,Canberra,AustralianNationalUniversity.PhD.thesis.
Drysdale, P.D. and Garnaut, R., 1982. ‘Trade intensities and the analysis of bilateral trade flows in a many-country world: a survey’, Hitotsubashi Journal of Economics, 22(2):62-84.
Drysdale,P.D.andXu,X.,2004.'Taiwan'sroleintheeconomicarchitectureofEastAsiaandthePacific',PacificEconomicPapersNo.343.
Drysdale, P.D., Huang, Y. and Kalirajan, K.P., 2000. 'China's trade efficiency: measurement and determinants', in P. Drysdale, Y. Zhang and L. Song (eds), APEC and liberalisation of the Chinese economy, Asia Pacific Press, Canberra.
Frankel,J.A.,Stein,E.andWei,S.,1997.RegionalTradingBlocsintheWorldEconomicSystem,InstituteforInternationalEconomics,Washington,D.C.
GaryKing;WillLowe,2003,"10MillionInternationalDyadicEvents",http://hdl.handle.net/1902.1/FYXLAWZRIAUNF:3:dSE0bsQK2o6xXlxeaDEhcg==IQSSDataverseNetwork[Distributor]V3[Version]
Kalirajan, K.P. and Findlay C.C., 2005. ̳Estimating potential trade using gravity models: a suggested methodology‘, Foundation for Advanced Studies on International Development, Tokyo.
Kang H. and Fratianni, M., 2006. ̳International trade efficiency, the gravity equation, and the stochastic frontier,‘ Working Papers 2006-08, Indiana University, Kelley School of Business, Department of Business Economics and Public Policy.
Kemal,A.R.,M.K.Abbas,andU.Qadir.2002.APlantoStrengthenRegionalTradeandCooperationinSouthAsia.InTrade,FinanceandInvestmentinSouthAsia,ed.T.N.Srinivasan.NewDelhi:Social
SciencePressKhan,M.2009."India‐PakistanTrade:ARoadmapforEnhancingEconomicRelations,"PolicyBriefsPB09‐15,PetersonInstituteforInternationalEconomics.
Kumar,RandSingh,M,(2009)India’sRoleinSouthAsiaTradeandInvestmentIntegration,ADBWorkingPaperSeriesonRegionalEconomicIntegration,No.32,July.
Mansfield,E.D.andPollins,B.M.,2003.EconomicInterdependenceandInternationalConflict:NewPerspectivesonanEnduringDebate(eds),UniversityofMichiganPress,Michigan.
Polachek,S.W.,1980.‘Conflictandtrade’,JournalofConflictResolution,24:55‐78.RaseenSally(2011,PAFTAD):Reuveny,R.andKang,H.,1996.‘Internationaltrade,political
conflict/cooperation,andGrangerCausality’,AmericanJournalofPoliticalScience,40:943‐970.
Reuveny,R.andKang,H.,1998.‘Bilateraltradeandpoliticalconflict/cooperation:dogoodsmatter?’,JournalofPeaceResearch,35:581‐602.
Taneja,N.2006.India‐PakistanTrade.WorkingPaper182.NewDelhi:IndianCouncilforResearchonInternationalEconomicRelations.