Embed Size (px)
Citation preview

San Jose State UniversitySJSU ScholarWorks
Master's Projects Master's Theses and Graduate Research
Fall 2012
Easier Debugging of Multithreaded SoftwareSampada KathareSan Jose State University
Follow this and additional works at: https://scholarworks.sjsu.edu/etd_projects
Part of the Computer Sciences Commons
This Master's Project is brought to you for free and open access by the Master's Theses and Graduate Research at SJSU ScholarWorks. It has beenaccepted for inclusion in Master's Projects by an authorized administrator of SJSU ScholarWorks. For more information, please [email protected].
Recommended CitationKathare, Sampada, "Easier Debugging of Multithreaded Software" (2012). Master's Projects. 276.DOI: https://doi.org/10.31979/etd.4mbj-9sfahttps://scholarworks.sjsu.edu/etd_projects/276
brought to you by COREView metadata, citation and similar papers at core.ac.uk
provided by SJSU ScholarWorks

Easier Debugging of Multithreaded Software
A Project Report
Presented to
The Faculty of the Department of Computer Science
San José State University
In Partial Fulfillment
of the Requirements for the Degree
Master of Science in Computer Science
by
Sampada Kathare

2
© 2012 Sampada Kathare ALL RIGHTS RESERVED

3
SAN JOSE STATE UNIVERSITY
The Undersigned Project Committee Approves the Project Titled
Easier Debugging of Multithreaded Software
by
Sampada Kathare
APPROVED FOR THE DEPARTMENT OF COMPUTER SCIENCE
SAN JOSÉ STATE UNIVERSITY
December 2012
------------------------------------------------------------------------------------------------------------
Prof. Soon Tee Teoh, Department of Computer Science
Date
------------------------------------------------------------------------------------------------------------
Prof. Robert Chun, Department of Computer Science
Date
------------------------------------------------------------------------------------------------------------
Prof. Sami Khuri, Department of Computer Science
Date
APPROVED FOR THE UNIVERSITY
------------------------------------------------------------------------------------------------------------
Associate Dean Office of Graduate Studies and Research

4
ACKNOWLEDGEMENTS I would like to thank all the people who have helped me with my project. I thank my advisor,
Prof. Soon Tee Teoh, who has been very supportive and helpful during the past few months.
I would like to thank Prof. Robert Chun and Prof. Sami Khuri for agreeing to be a part of my
committee. I am very grateful to my family and friends for their moral support and
encouragement. Also, thanks to all the people who have posted such informative blogs on the
internet that helped me through my research.
5
Table of Contents
Table of Contents ...................................................................................................................... 5
Table of Figures ........................................................................................................................ 6
ABSTRACT .............................................................................................................................. 7
1. Introduction ....................................................................................................................... 8
1.1 Problem statement & motivation .............................................................................. 9
2. Research topics ............................................................................................................... 10
2.1 Multithreading fundamentals .................................................................................. 10
2.2 Multi-threading and multi-core ............................................................................... 13
2.3 How scheduling works ............................................................................................ 14
2.4 Reverse engineering techniques .............................................................................. 15
2.4.1 Black box analysis .......................................................................................... 15
2.4.2 Code coverage tools ........................................................................................ 15
2.4.3 Decompiling and disassembling ..................................................................... 15
2.5 How debuggers work .............................................................................................. 16
2.5.1 Setting breakpoints.......................................................................................... 16
2.5.2 Single-stepping ............................................................................................... 16
2.5.3 Enumerating source code ................................................................................ 17
3 Design ............................................................................................................................. 17
3.1 Justification ............................................................................................................. 18
3.2 Platform................................................................................................................... 18
4 Implementation ............................................................................................................... 19
4.1 Attaching to the debuggee ...................................................................................... 19
4.2 Main Debugger loop ............................................................................................... 19
4.3 Handling Debugging events .................................................................................... 20
4.3.1 CreateThread event ......................................................................................... 20
......................................................................................................................................... 22
4.3.2 Exception event ............................................................................................... 22
4.3.2.1 Breakpoint exception ...................................................................................... 22
4.3.2.2 Single-step exception ...................................................................................... 24
4.3.2.3 Exit Process event ........................................................................................... 25
4.4 Handling multiple cores .......................................................................................... 26
4.5 Context switching between threads ........................................................................ 27
5 Testing............................................................................................................................. 28
6. Known issues .............................................................................................................. 34
5.5.1 No man’s land ................................................................................................. 35
5.5.2 Access violation error ..................................................................................... 35
6 Recommendations for future work ................................................................................. 38
7. Conclusion .................................................................................................................. 39
References ........................................................................................................................... 40

6
Table of Figures
Figure 1. Relationship between processors, processes and threads ........................................ 10
Figure 2. Concurrency versus parallelism .............................................................................. 11
Figure 3. Critical Section and synchronization primitives ...................................................... 12
Figure 6. Lifecycle of a thread ................................................................................................ 14
Figure 7. Handling Create Thread event ................................................................................. 22
Figure 8. Handling breakpoint exception event ...................................................................... 23
Figure 9. Handling single-step exception event ...................................................................... 25
Figure 10. Handling exit thread/process event ....................................................................... 25
Figure 11. Handling multiple cores ........................................................................................ 27
Figure 12. Context switching between threads ....................................................................... 28
Figure 13. Test case 1 – Simple multithreaded debuggee ...................................................... 29
Figure 14. Test case 3 – thread synchronization ..................................................................... 31
Figure 15. Test case 4 – race condition................................................................................... 32
Figure 16. Test case 5 - deadlock............................................................................................ 34
Figure 17. No man’s land error ............................................................................................... 35
Figure 18. Access violation error ............................................................................................ 36
Figure 19. Access violation exception .................................................................................... 37
7
ABSTRACT
Easier debugging of multithreaded software
By
Sampada Kathare
Software activation is a technique designed to avoid illegal use of a licensed
software. This is achieved by having a legitimate user enter a software activation
key to validate the purchase of the software. Generally, a software is a single-threaded program.
From an attacker’s perspective, who does not wish to pay for this software, it is not hard to
reverse engineer such a single threaded program and trace its path of execution. With tools such
as OllyDbg, the attacker can look into the disassembled code of this software and find out where
the verification logic is being performed and then patch it to skip the verification altogether.
In order to make the attacker’s task difficult, a multi-threaded approach towards software
development was proposed [1]. According to this approach, you should break the verification
logic into several pieces, each of which should run in a separate thread. Any debugger, such as
OllyDbg, is capable of single-stepping through only one thread at a time, although it is aware of
the existence of other threads. This makes it difficult for an attacker to trace the verification
logic. Not just for an attacker, it is also difficult for any ethical developer to debug a
multithreaded program.
The motivation behind this project is to develop the prototype of a debugger that will make it
easer to trace the execution path of a multi-threaded program. The intended debugger has to be
able to single-step through all of the threads in lockstep.
8
1. Introduction
A lot of commercial softwares in the market, today, usually come with a trial version that has
limited functionality. In order to take advantage of the full set of promised features, users are
required to buy the software. After making the purchase, typically, a software activation key is
provided to the user for activating his copy of the software, thereby enabling its full
functionality.
Reverse engineering is the art of backtracking a program with the intent of tracing its flow of
execution. It is also the skill of refuting the assumptions made by the developer of the program
with respect to its security and privacy. In this world of reverse engineering, it is a common area
of interest to be able to overcome the limitations of such a trial version without having to
actually buy the software. There are a number of debuggers/disassemblers available, viz:
OllyDbg, that provide a disassembled view of the software. With just the executable or the
binary image in hand and the help of such a tool, it then takes the knowledge and expertise of the
user to figure out the patch of code that needs to be changed to disable the check that performs
the validation of activation key entered by the user.
There are a number of techniques that can be employed by the software developer to make it
tougher to reverse engineer his software. Such techniques include detection of debugger,
injecting junk code just to confuse the attacker, putting in lot of jumps in the code to damage the
sense of locality etc. Multithreading or splitting the logic in different threads is one such
technique. In case of a single-threaded program, it is easy for the debugger tool to trace the
execution path of the single thread that also includes all the validation logic. However, if the
software is multithreaded, the task gets tougher, with the difficulty of debugging lying in the core
principle of multithreading itself. My project deals with reducing this level of difficulty and
9
making it one step easier to debug a multithreaded software. My intention here is not to
encourage hacking of softwares, but just to solve an intellectual challenge raised by
multithreaded programming.
1.1 Problem statement & motivation
The difficulty of debugging such a multi-threaded software lies in the basic principle that
multithreading was designed for – concurrent and, if possible, parallel execution of a program.
Concurrent programming is an illusion given to the user that multiple tasks are being executed
simultaneously. In reality, the threads of execution are being swapped in and out of the
processor, completely utilizing the processor time. The processor idle time is effectively reduced
and hence this is faster than a normal execution of tasks.
Parallel programming, on the other hand, is literal parallel execution of threads on multiple
cores. On a multi-core system, the resources available for executing threads are also multiple.
Hence, the threads can literally execute in parallel, one on each of the cores, at a particular
instance of time. In case of a single processor system, this is nothing but concurrent execution.
The task of scheduling threads to execute in the CPU entirely lies in the hands of the scheduler of
the operating system. Depending upon the scheduling algorithm applied (such as round robin,
first-in-first-out, shortest remaining time etc.), there can be a wide range of possible paths of
execution for the same application. Also, depending upon whether the application is running on a
single core or multiple cores, it may run concurrently or parallelly, as explained previously. A
lot of the debuggers available today, however, are not able to single-step through multiple
threads in lockstep i.e. while you are single-stepping through one thread, you might end up
executing multiple instructions in the other threads before returning to your thread. This led to
the idea of my project – to be able to visibly trace the execution path of a multithreaded program.
10
The prototype that has been designed as part of this project will serve as a basic debugger that
outputs the code of whichever thread is running in the CPU at that instance of time.
2. Research topics
2.1 Multithreading fundamentals
2.1.1 Parallel versus concurrent programming
A thread is the smallest unit of execution that can run within the execution engine of a
system. There can be multiple threads running within the context of a process, sharing
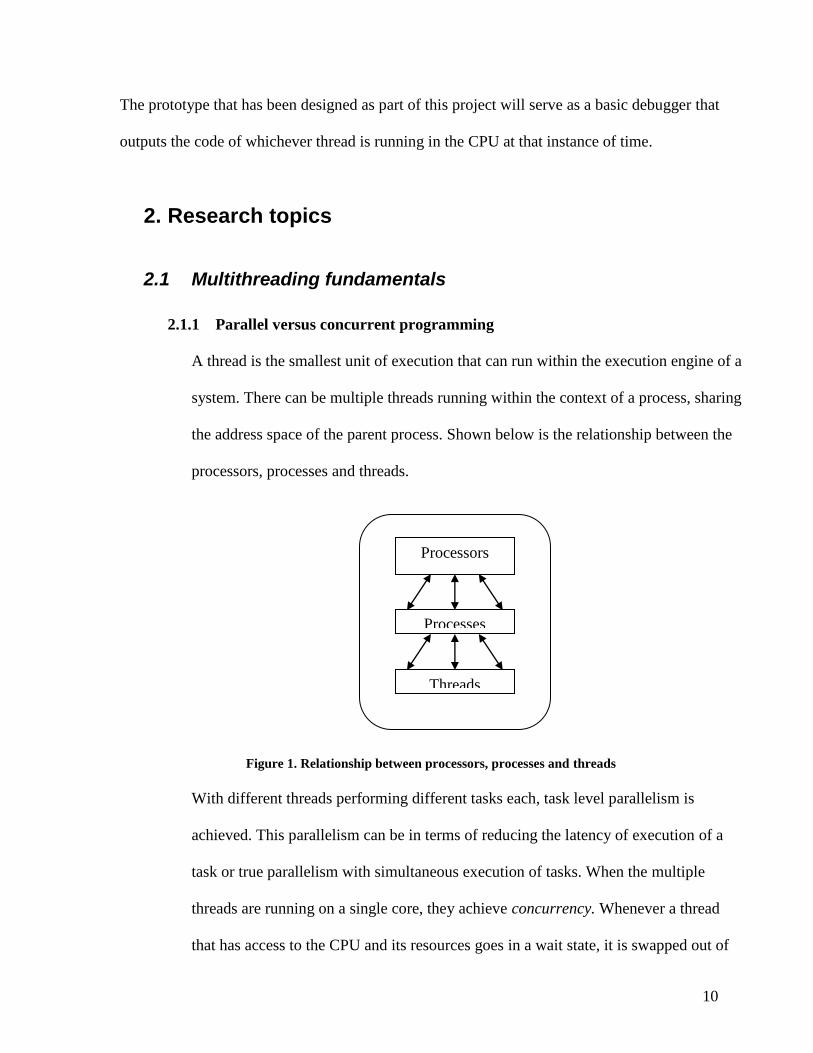
the address space of the parent process. Shown below is the relationship between the
processors, processes and threads.
Figure 1. Relationship between processors, processes and threads
With different threads performing different tasks each, task level parallelism is
achieved. This parallelism can be in terms of reducing the latency of execution of a
task or true parallelism with simultaneous execution of tasks. When the multiple
threads are running on a single core, they achieve concurrency. Whenever a thread
that has access to the CPU and its resources goes in a wait state, it is swapped out of
Processors
Processes
Threads

11
the execution and some other thread that is ready to actually utilize the resources is
put into the execution engine. Thus, the CPU cycles are avoided from getting wasted,
thereby reducing the latency of execution.
When these threads run on a multi-core system, however, they do run simultaneously,
owing to the multiple sets of resources available.
Figure 2. Concurrency versus parallelism
2.1.2 Thread synchronization primitives
Since all the threads run within the address space of a single process, there is bound to be
access to some shared memory. To impose an order of execution of threads and control
the order in which these threads access the shared memory, there is a need of
synchronization mechanisms. These mechanisms come in the form of mutex, semaphore,
monitors, condition variables & so on. The section of code that accesses shared memory
is termed as a critical section of the code. It is required to use one of these
synchronization mechanisms before and after accessing this critical section.
Operational Path Operational Path
Concurrency Parallelism

12
Figure 3. Critical Section and synchronization primitives
Multithreading leads to certain peculiar and intermittent bugs, that may or may not occur
during runtime. Mentioned ahead are the most notorious of such bugs – deadlocks and
race conditions.
2.1.3 Deadlocks
Deadlock occurs when a thread is blocked on a resource held by another thread. This is
usually not a consequence of a programming error. However, it can be avoided
programmatically by various techniques.
Source code
Critical Section
or the section
that contains
shared data
Synchronization
operation to
enter
Synchronization
operation to
leave

13
2.1.4 Race Conditions
If no synchronization mechanism is used in the code, there is a race amongst the threads
to gain access to the shared memory. Depending upon who gets the access first, the
sequence in which this shared memory is read and modified by the threads can lead to a
different output in every run. This is known as a race condition.
2.2 Multi-threading and multi-core
The notion of multiple threads running in a process has been around for decades. As a recap, a
thread is the smallest unit of execution, that runs within the address space of the process. All
threads of a process share its memory. Hence, context switching between threads is easier and
cheaper than context-switching between processes.
Two threads running on a single core is different from multiple threads running on multiple
cores. On a single core, with Hyper-threading technology, most of the processor resources are
duplicated and each thread gets its own set of resources. The actual execution engine, however,
is not duplicated. The instructions of both threads are interleaved in such a fashion that the
processor is kept busy all the time, without wasting any cycles. This achieves performance gains
through latency hiding.
With two threads running on two cores, however, each thread gets its own execution engine. This
means the threads can run in a truly parallel manner, as shown below.
This difference of single-core and multi-core had to be kept in mind while developing the
debugger and also while analyzing it’s output.

14
2.3 How scheduling works
The task of executing a thread of instructions is done in the CPU. The task of scheduling which
thread gets access to the CPU and its resources belongs to the scheduler. The scheduler is
concerned with keeping all the processors busy without wasting any CPU cycles. As mentioned
previously, the lifetime of a thread consists of various states as ready, running, wait etc.:
Figure 4. Lifecycle of a thread
When a thread is not running, or is “waiting” for I/O or waiting on an event, it is not utilizing the
CPU cycle. Instead of keeping it in the execution engine, the scheduler decides to swap it out and
put another thread that is in “ready” into the execution engine. This is what is called context
switching. In this fashion, each thread gets access to the execution resources during any
particular CPU cycle.
Event Completion
Exit
Interrupt
Scheduler Dispatch
Enter New Terminate
Ready Running
Waiting Event Wait

15
2.4 Reverse engineering techniques
Given only the binary of an application, there are few techniques that can be applied to figure out
what might be going on within the program. Mentioned below are some of these techniques.
2.4.1 Black box analysis
This is a standard reverse engineering methodology that does not require any access to the source
code of the binary. The analysis involves testing the running program for all sorts of inputs, and
analyzes the corresponding behavior of the program. With the knowledge of how the output
varies with input, a guess can be made about the internals of the system.
2.4.2 Code coverage tools
Code coverage is finding out what execution path has been taken by each run of the program. A
lot of code coverage tools available today do not require the source code of the program to be
available. It is human, while trying to reverse engineer, to skip certain portions of code, thinking
that it is not significant. Such tools can give a report of how much of such code is yet to be
analyzed.
2.4.3 Decompiling and disassembling
Decompiling is recovering the high-level source code from the binary executable of a program.
Disassembling is recovering the assembly language code of the binary. There are a few such
decompilers/disassemblers available in the market today, IdeaPro and OllyDbg to name a few.
These tools give the best possible estimate of the source code using which, the vulnerabilities of
the program can be explored.

16
2.5 How debuggers work
A debugger is nothing but a process that debugs another process. Typically, the debugger can
either create the process to be debugged or simply attach to a running process. Any basic
debugger needs to be able to do the following in order to debug a process :
Set breakpoints in the process
Single-step through the code
Display the lines of source code
2.5.1 Setting breakpoints
Placing breakpoint is equivalent to deliberately introducing a trap or a software-invoked interrupt
to occur. When such an interrupt occurs, irrespective of the source code, control is transferred to
corresponding interrupt service routine. This gives the debugger an opportunity to decide on the
further course of action to be followed. Usually, the int 3 instruction (0xcc) is used by a
debugger to set a breakpoint. The instruction where breakpoint is desired is replaced with the int
3 instruction, the instruction pointer is decremented and the program is resumed. This causes the
int 3 instruction to be executed, thereby generating a trap, and pausing the process.
2.5.2 Single-stepping
Single-stepping is a feature of the x86 chipset that is used to trace the execution of a program.
There is a special flag in the processor that, if set, will cause only a single

17
instruction to be executed followed by an interrupt [1]. For tracing the execution path, this flag
needs to be reset again and again, for every instruction.
2.5.3 Enumerating source code
Any executable is a binary image of the source code. However, to enumerate the lines of source
code from this binary, certain other information is required for the debugger. This information
comes in various formats, one of them being PDB file.
3 Design
The developed prototype has been developed with the following functionality:
The debugger is notified for various events that occur in the application being debugged.
These events primarily include
o Thread creation
o Process creation
o Thread completion (indicated by the exit status of the thread)
o Process completion
o Exceptions such as breakpoint, single-step, array out-of-bounds etc.
When an event is notified to the debugger, all the threads/processes in the debugged
application are paused, until some action is taken by the debugger.
Every new thread that is created in the application is put in a single-step mode.
For every thread that is scheduled by the scheduler, it is displayed in the output window
with a unique color.

18
Whenever the thread is swapped out and another thread is scheduled to run, the
corresponding color changes too. This makes it easier to track the thread execution.
The disassembled view of each thread is displayed as and when the thread is scheduled to
run.
3.1 Justification
My intention while starting this project was to develop some prototype tool that will assist a user
to debug a multithreaded program in some way. With the above stated design, the user gets to
look at whatever thread is running on the system. The prototype is able to single-step through all
the threads. With some expertise in assembly language, the output of the debugger can be used to
understand the code of a multithreaded exe. Whenever a context switch between threads occurs,
the user can clearly identify it on the output screen as each thread is represented with a different
color. If a user is only interested in a particular thread, he can choose to trace only that color of
code throughout the output.
The debugger is not affected by multithreading bugs like deadlocks and race conditions within
the program being debugged. If a thread is stuck on deadlock, the scheduler might swap it out of
execution engine during some CPU cycle. When that happens, the debugger will display
corresponding code on the output screen.
3.2 Platform
The debugger has been implemented using Microsoft’s Visual Studio – Express edition.
Primarily, windows APIs have been used and the development language has been C.
To disassemble the line of code being executed, beangine library has been used. Beaengine is a
multi-platform disassembler for Intel and AMD processors.

19
The system that this prototype has been tested upon is an x64-based PC with an Intel i5
processor that comes with 2 cores and 4 logical processors.
4 Implementation
4.1 Attaching to the debuggee
A debugger is just another process bound to run in the system and so is the debuggee. Hence, in
order to debug the application, it is created as a child process from the debugger process. We
also specify the creation flags that control the scheduling priorities of the process. By specifying
DEBUG_PROCESS as the process creation flag, we ask the Windows OS to communicate all the
events such as process/thread creation/termination, runtime exceptions etc. of this thread as well
all it’s child threads and processes.
/*Code Snippet*/
STARTUPINFO si;
PROCESS_INFORMATION pi;
ZeroMemory( &si, sizeof(si) );
si.cb = sizeof(si);
EXCEPTION_DEBUG_INFO exception;
ZeroMemory( &pi, sizeof(pi) );
CreateProcess(NULL, argv[1], NULL, NULL, FALSE,
DEBUG_PROCESS, NULL,NULL, &si, &pi )
4.2 Main Debugger loop
This is the main area of the debugger. It is a while loop that keeps waiting for debugging events
from the debuggee, processes each event, and then continues waiting again. This is achieved
through the windows APIs WaitForDebugEvent and ContinueDebugEvent. When an event is
notified to the debugger, all the processes and threads of the debuggee are paused. Only after
20
ContinueDebugEvent is executed with DBG_CONTINUE as the last parameter, the debuggee
process is resumed.
/*Code snippet*/
while(ContinueDebugging)
{
if (!WaitForDebugEvent(&debug_event, INFINITE))
return 0;
Sleep(500);
switch(debug_event.dwDebugEventCode)
{
//Handle the debug events
ContinueDebugging = true;
}
ContinueDebugEvent(debug_event.dwProcessId,
debug_event.dwThreadId,
DBG_CONTINUE);
}
4.3 Handling Debugging events
Certain steps of execution are treated as “events” in every running process. For every event
occurring in the debuggee, the debugger is notified. At the same time, all the threads and
processes running in the debuggee are paused. Listed below are some of the relevant events that
have been handled in order to implement the intended prototype.
4.3.1 CreateThread event
Every time a new thread is created in the debuggee, it is treated as a new event and the debugger
is notified about it. Upon receiving such an event, the debugger prints it out to the output screen
21
with a unique color that it assigns to this thread. Going further, every time this thread is running,
the corresponding prints will be in this particular color to identify the thread.
In order to debug the thread, a breakpoint needs to be added at the starting point of the thread.
Hence, the thread context is retrieved and the very first instruction is replaced with a breakpoint
instruction 0xcc. Note that this is not the only breakpoint instruction that can be used. The
instruction pointer will have already moved ahead by one instruction by this time. But since we
want the breakpoint instruction to be executed, we decrement the instruction pointer of this
thread and then continue. This leads to the very next event to be an exception event caused by
this thread, with the exception type being a breakpoint exception.
/*Code Snippet*/
// Read the first instruction
ReadProcessMemory(main_process,(void*)debug_event.u.CreateThread.lpStartAddress,
&(threads[i].OriginalInstruction), 1, &dwReadBytes);
// Replace it with Breakpoint
cInstruction = 0xCC;
WriteProcessMemory(main_process,(void*)debug_event.u.CreateThread.lpStartAddress,
&cInstruction, 1, &dwReadBytes);
FlushInstructionCache(main_process,(void*)debug_event.u.CreateThread.lpStartAddress,1);

22
Figure 5. Handling Create Thread event
4.3.2 Exception event
Exceptions are abnormal behaviors of a process, such divide-by-zero, stack overflow, access
violation etc. Listed below are couple of important exceptions that are intentionally planted into
the debuggee as part of the debugging process.
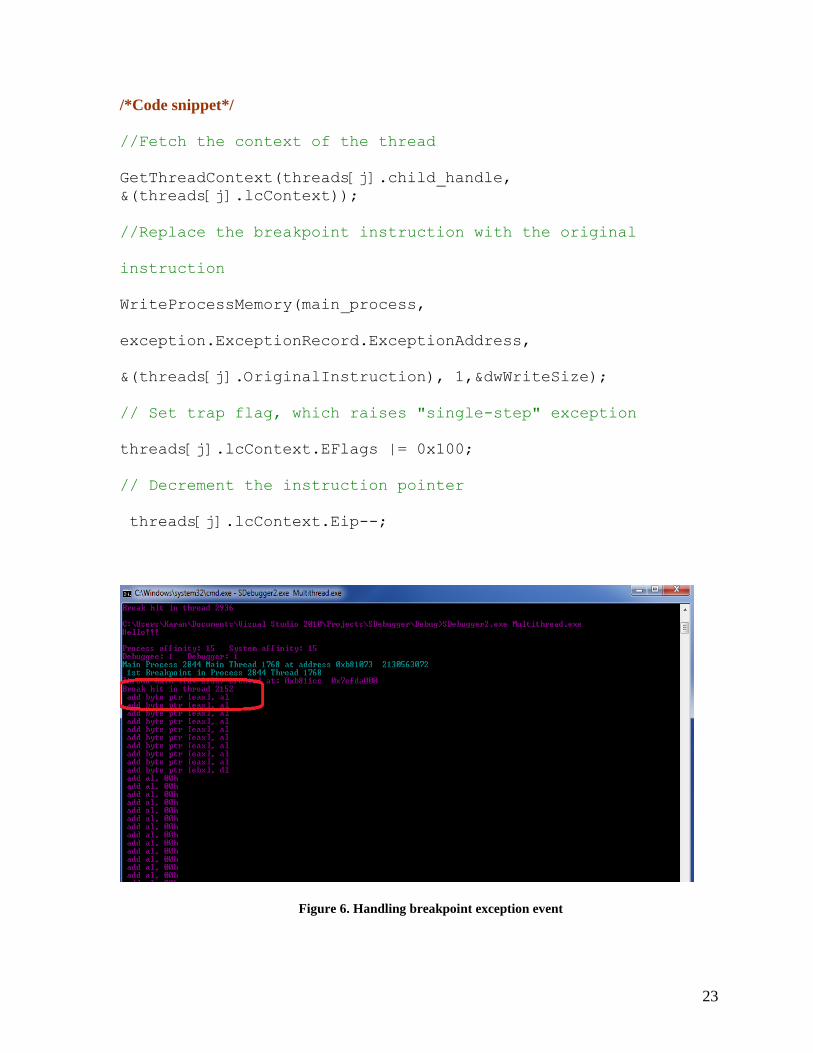
4.3.2.1 Breakpoint exception
Since this was the breakpoint that we implanted by replacing the first instruction, we need to
place the original instruction in it’s place. Before doing that, we set the single-step bit in the
thread context. This will cause the thread to go into a single-stepping mode and raise single-step
exception when it is about to execute the next instruction. After setting the bit, we replace the
breakpoint instruction with the original instruction, decrement the instruction pointer again, and
continue.
23
/*Code snippet*/
//Fetch the context of the thread
GetThreadContext(threads[j].child_handle,
&(threads[j].lcContext));
//Replace the breakpoint instruction with the original
instruction
WriteProcessMemory(main_process,
exception.ExceptionRecord.ExceptionAddress,
&(threads[j].OriginalInstruction), 1,&dwWriteSize);
// Set trap flag, which raises "single-step" exception
threads[j].lcContext.EFlags |= 0x100;
// Decrement the instruction pointer
threads[j].lcContext.Eip--;
Figure 6. Handling breakpoint exception event
24
4.3.2.2 Single-step exception
As a result of the processing done during breakpoint exception handling, the very next exception
raised by a thread, if it is scheduled to run, is the single-step exception. This exception is raised
for the next line of instruction that the thread is about to execute. It is at this point, that we take
the address of this next instruction, pointed by the instruction pointer, and give it to the
disassembler routine, thereby getting the corresponding assembly language instruction.
We also need to again set the bit for single-step , to keep stepping through the code of this
thread.
/*Code snippet*/
// Fetch the context of the thread
GetThreadContext(threads[j].child_handle,
&(threads[j].lcContext));
// Take the instruction address
threads[j].MyDisasm.EIP = threads[j].lcContext.Eip;
//Give it to the disassembler routine
len = Disasm(&threads[j].MyDisasm);
//Print the disassembled instruction
printf(" %s \n",&threads[j].MyDisasm.CompleteInstr);
//Set the single-step flag again
threads[j].lcContext.EFlags |= 0x100;

25
Figure 7. Handling single-step exception event
4.3.2.3 Exit Process event
Once the debuggee completes execution, its main process exits and raises this exception. The
debugging is then stopped.
Figure 8. Handling exit thread/process event

26
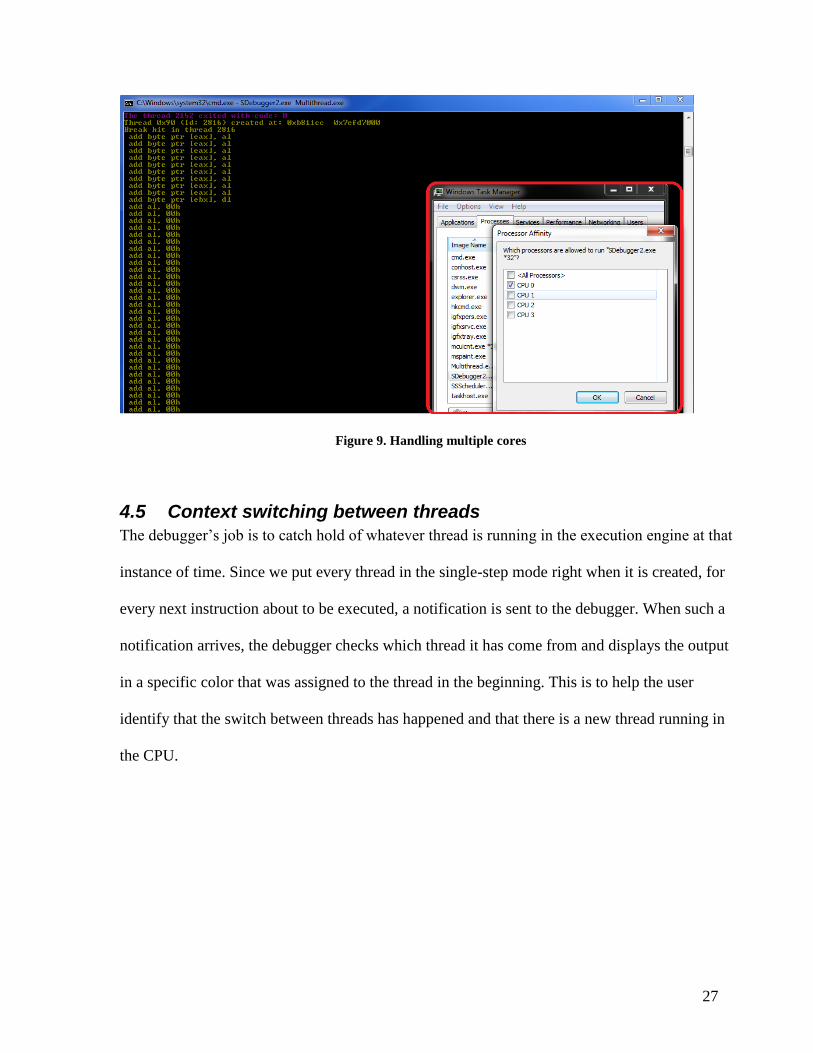
4.4 Handling multiple cores
During initial runs of the debugger, it was observed that few threads completed execution
without giving a chance to single-step. After further analysis, it became clear that it was because
of the type of system that I was running it upon. My system has 2 cores and thereby, 4 logical
processors. What this implies is that my operating system sees the system as having 4 processors.
Hence, it can schedule the threads on any of these processors in parallel. This was the reason that
my debugger was not able to single-step through some threads while being able to do so for
others.
To overcome this limitation, I had to mask the processor affinity of the thread. It is the processor
affinity of the thread that determines which processor it will run upon. By default, this is set to
all the logical processors i.e. it is eligible to run upon any of the processors. Since my
requirement is to be able to look into each thread, I decided to force it to run upon a single
logical processor. I also force my debugger process to run upon a single logical processor.
/*Code snippet*/
When the debuggee process is created by the debugger:
SetProcessAffinityMask(pi.hProcess, 1); //pi.hProcess is the
handle to the debuggee process
For every thread that is created, it is reported by CREATE_THREAD_EVENT :
CREATE_THREAD_DEBUG_EVENT:
SetThreadAffinityMask(OpenThread(THREAD_ALL_ACCESS,FALSE,de
bug_event.dwThreadId),1);
27
Figure 9. Handling multiple cores
4.5 Context switching between threads
The debugger’s job is to catch hold of whatever thread is running in the execution engine at that
instance of time. Since we put every thread in the single-step mode right when it is created, for
every next instruction about to be executed, a notification is sent to the debugger. When such a
notification arrives, the debugger checks which thread it has come from and displays the output
in a specific color that was assigned to the thread in the beginning. This is to help the user
identify that the switch between threads has happened and that there is a new thread running in
the CPU.

28
Figure 10. Context switching between threads
5 Testing
In order to test the debugger, I wrote different versions of multithreaded programs. Each version
is intended to test some peculiarity that arises with the multithreading methodology. The nature
of multithreading bugs is inherently intermittent. Hence, even though I designed the debuggee
with an intention to produce such bugs, they did not occur despite many runs. It was observed
that none of these peculiarities really affect the working of my prototype debugger, since it
works hand-in-hand with the scheduler of the system.
Following are the test cases:
5.1 Simple multithreaded debuggee 5 Child threads are created by the debuggee,
each executing its task independently. There is no communication between the

29
threads, and hence no need of synchronization. There is also no I/O or wait involved
in the thread procedure.
/*Code snippet*/
void ThreadPRoc(LPVOID param)
{
int x = 2;
x++;
ExitThread(0);
}
Figure 11. Test case 1 – Simple multithreaded debuggee
Observation The debugger steps through each thread as and when it is scheduled in the CPU.
5.2 Some sleep time in each thread The intention of the sleep state is to check if that
affects the way that the threads are swapped in and out of the execution engine. As
explained before, when a thread is in a wait or not-running state, not utilizing any of

30
the CPU resources, the scheduler swaps it out of the execution engine and schedules
any other thread that is ready to run. It was observed, however, that the sleep induced
in the code did not affect the scheduling in a major way. With a heavier thread
procedure and more number of threads, the thread swapping might become more
visible.
/*Code snippet*/
void ThreadPRoc(LPVOID param)
{
int x = 2;
x++;
Sleep(1000);
ExitThread(0);
}
5.3 Thread synchronization Here, I induced some basic synchronization between the
threads. There is one common variable, count, that is shared amongst the threads.
Each thread increments the count. Since this is a shared memory, I used a mutex to
control the way that the threads gain access to this variable. Each thread has to gain a
lock over the mutex before being able to modify the count variable.
/*Code snippet*/
//Wait to acquire the lock on mutex before modifying shared
memory
if(WaitForSingleObject(hMutex1, INFINITE) == WAIT_OBJECT_0)
{
printf("Thread %d in critical
section\n",GetCurrentThreadId());
while(count>0)
count--;
Sleep(10000);
}
else
{
printf("Thread %d : not allowed to enter critical
section\n", GetCurrentThreadId());

31
ExitThread(0);
}
Figure 12. Test case 3 – thread synchronization
Observation The thread synchronization does not affect working of the debugger in any
way. Threads continue to be scheduled in a regular fashion.
In the previous test cases, the multithreaded program was designed using appropriate parallel
programming constructs. But I also wanted to test the debugger functionality with programs
that might incur multithreading bugs such as deadlocks and race conditions. What follows are
the observations in those cases.
5.4 Race condition In this test case, I removed the use of mutex for synchronizing
shared variable access between the threads. With no mutex to monitor this access, a
race condition is bound to occur. Depending upon the order in which threads get to

32
access this variable, the result can be an incorrect calculation of the final value of
count.
Figure 13. Test case 4 – race condition
Observation Even in this case, there was no effect on the debugger functionality. Since race
condition is not a bug that only leads to incorrect output, and does not affect the normal
execution of the program as such, the debugger works as it is supposed to and outputs the code
of whatever thread is running.
5.5 Deadlock In this test case, I tried to cause a deadlock amongst the threads on
purpose by using 2 mutexes. Each thread tries to gain access to both the mutexes.
Depending upon how the scheduler swaps between these threads, a deadlock can
happen if each thread gains access to one mutex and waits for the other mutex.

33
Thread T1 Thread T2
waitforMutex(Mutex1) waitforMutex(Mutex2)
waitforMutex(Mutex2) waitforMutex(Mutex1)
//critical section //critical section
count++; count++;
ReleaseMutex(Mutex2) ReleaseMutex(Mutex1)
ReleaseMutex(Mutex1) ReleaseMutex(Mutex2)
/*Thread1 Code snippet*/
if(WaitForSingleObject(hMutex1, INFINITE)==WAIT_OBJECT_0)
{
if(WaitForSingleObject(hMutex2, INFINITE) == WAIT_OBJECT_0)
{
printf("Thread %d in critical
section\n",GetCurrentThreadId());
while(count>0)
count--;
Sleep(10000);
}
else
{
printf("Thread %d : not allowed to enter critical
section\n", GetCurrentThreadId());
ExitThread(0);
}
}
/*Thread2 code snippet*/
if(WaitForSingleObject(hMutex2, INFINITE)==WAIT_OBJECT_0)
{
if(WaitForSingleObject(hMutex1, INFINITE) == WAIT_OBJECT_0)
{
printf("Thread %d in critical
section\n",GetCurrentThreadId());
while(count>0)
count--;
Sleep(10000);
}
else

34
{
printf("Thread %d : not allowed to enter critical
section\n", GetCurrentThreadId());
ExitThread(0);
}
}
Figure 14. Test case 5 - deadlock
Observation Even in this case, the debugger does its job of tracing the execution path of the
program. If there is a deadlock and a thread is blocked, the scheduler will swap out that thread
and run some other thread in its place. Accordingly, the output on the screen will also differ with
corresponding assembly code of that thread.
6. Known issues
Multithreading comes with its own set of irreproducible bugs. These programs often fail in an
unexpected, non-deterministic fashion. While developing my debugger prototype, a two such
35
bugs were encountered. These bugs surface unexpectedly and I have not been able to find a
resolution to the same.
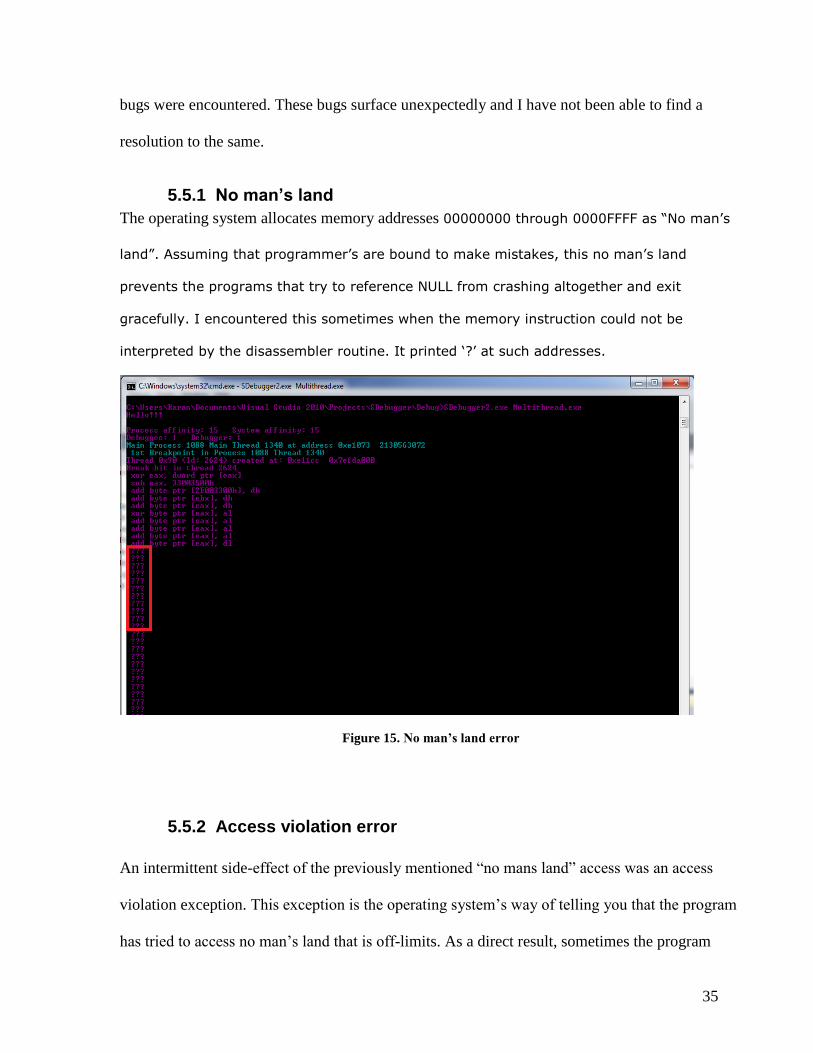
5.5.1 No man’s land
The operating system allocates memory addresses 00000000 through 0000FFFF as “No man‟s
land”. Assuming that programmer‟s are bound to make mistakes, this no man‟s land
prevents the programs that try to reference NULL from crashing altogether and exit
gracefully. I encountered this sometimes when the memory instruction could not be
interpreted by the disassembler routine. It printed „?‟ at such addresses.
Figure 15. No man’s land error
5.5.2 Access violation error
An intermittent side-effect of the previously mentioned “no mans land” access was an access
violation exception. This exception is the operating system’s way of telling you that the program
has tried to access no man’s land that is off-limits. As a direct result, sometimes the program

36
threw the exception EXCEPTION_ACCESS_VIOLATION. At other times, the program abruptly stopped
working and showed the same error when opened in a third-party debugger.
Figure 16. Access violation error

37
Figure 17. Access violation exception

38
6 Recommendations for future work
Since my debugger was developed by me alone, it only has the basic capabilities of debugging.
When compared with the commercially available debuggers that are developed by larger teams
over a period of time, following are the features that could be added to make it a complete
functional debugger:
User interaction
Ability to pause/resume the debugging
Display the register values
Display the call stack
Ability to patch the code
Secondly, my debugger has been developed using Windows APIs. The IDE used for writing both
the debugger and the debuggee was Microsoft Visual Studio Express Edition. As part of future
work, it can be tested upon programs that have been written in other IDEs. The debugger logic
can also be tried on a different platform like Linux, to test the validity of the framework.
The disassembler that I have used to develop the code-display feature of my debugger is not a
well-known software. To be able to literally break a software using my debugger, it will be
required to use a better and reliable disassembler. Also, the user will have to be skilled at
assembly language programming, to interpret the instructions being displayed on the output
screen and patch it accordingly.

39
7. Conclusion
Multithreaded programming is a non-avoidable phenomenon. Following Amdahl’s law, as the
number of cores increases, parallel programming is the way to be for future softwares. However,
the complexity of parallel programming should not obstruct the curiosity of finding ways to
debug such a software. With more number of tools to assist this, the challenge of developers to
develop a hack-proof software also increases. My project was an attempt in this direction. I have
tried to overturn the assumption that merely making the software multithreaded can be a strong
anti-reverse engineering technique.
40
References
[1] “Improved Software Activation using Multithreading”, By Jianrui Zhang, April 2010.
[2] “Reversing – Secrets of Reverse Engineering”, Eldad Eilam, Published by Wiley
Publishing, Inc., 2005
[3] “Modern Multithreading : Implementing, Testing, and Debugging Multithreaded Java and
C++/Pthreads Win32 Programs”, Carver, Richard H. and Tai, Kuo-Chung , Published by
Wiley-Interscience. 2006.
[4] “How debuggers work”, Eli Bendersky’s website, retrieved from
http://eli.thegreenplace.net
[5] “Debugging parallel programs”, Blaise Barney, Lawrence Livermore National
Laboratory, retrieved from
https://computing.llnl.gov/tutorials/totalview/part3.html#PthreadsDebug
[6] “Multi-core programming”, Shameem Akhter and Jason Roberts, Published by Intel
Press, April 2006
[7] OllyDbg, retrieved on 8/10/2012 from http://www.ollydbg.de
[8] Intel Inspector, retrieved on 9/01/2012 from http://software.intel.com/en-us/intel-
inspector-xe
[9] “Debugging”, retrieved on 9/10/2012, from http://msdn.microsoft.com/en-
us/library/windows/hardware/hh833791.aspx