Embed Size (px)
Citation preview

Easier Analysis and Better Reporting:Modelling Ordinal Data in Mathematics
Education Research
Brian Doig and Susie GrovesDeakin University
This paper presents an examination of the use of Rasch modelling in a majorresearch project, Improving Middle Years Mathematics and Science (IMYMS).The project has generated both qualitative and quantitative data, with muchof the qualitative data being ordinal in nature. Reporting the results of analyses for a range of audiences necessitates careful, well-designed reportformats. Some useful new report formats based on Rasch modelling—theModified Variable Map, the Ordinal Map, the Threshold Map, and theAnnotated Ordinal Map—are illustrated using data from the IMYMS project.The Rasch analysis and the derived reporting formats avoid the pitfalls thatexist when working with ordinal data and provide insights into the respondents’ views about their experiences in schools unavailable by otherapproaches.
A basic requirement for any research project is the presentation of comprehensible valid and reliable results. While traditional forms of analysiscan meet this requirement, other methods may be more efficacious. In thispaper we present a case for the use of Rasch analysis as an approach thatenables the construction of reports suitable for a range of stakeholders. We usedata collected in the Improving Middle Years Mathematics and Science: The role ofsubject cultures in school and teacher change (IMYMS) project to support our case.
The IMYMS project involves four clusters of schools from urban andrural regions of Victoria to investigate the role of mathematics and scienceknowledge and subject cultures in mediating change processes in the middleyears of schooling. In all there are five secondary and twenty-eight primaryschools involved.
As is the case in many other educational research projects, the IMYMSproject has provided a wealth of qualitative and quantitative data. In particular, the project researchers have used several survey instruments, andcollected several sets of ordinal data. While this type of data is common ineducational research, the reporting of these data often appears to ignore themathematical properties of ordinal data, calling into question the outcomes ofthe research itself. It is our intention in this paper to demonstrate that theanalysis of ordinal data collected using surveys and structured interviews isbest achieved, through the use of Rasch modelling, and that this also providesbetter reporting formats.
In the following examples from the IMYMS project, we report the raw ordinal data in appropriate forms, and also in transformed form as interval datausing Rasch (1960) methods and a derivative, the Masters Partial Credit Model(Masters, 1988). We also present four new Rasch-based reporting formats.
2006, Vol. 18, No. 2, 56-76Mathematics Education Research Journal

BackgroundThe IMYMS project has its roots in the Science in Schools (SiS) research
project, which developed a successful strategy for improving the teachingand learning of science based on two major aspects: the SiS Components, aframework for describing effective teaching and learning in science, and theSiS Strategy, a strategic process for planning and implementing change (see,Gough & Tytler, 2001). IMYMS is based on auditing the teaching of mathematics and science in each school to inform the development of schooland cluster action plans. The major foci of the audit are teacher practice andbeliefs, and student perceptions and learning preferences.
Based on reviews of the literature on effective teaching (Doig, 2001; 2003)and a series of interviews with fifteen effective teachers of middle years mathematics (Tytler, Waldrip, & Griffiths, 2004), the IMYMS project teamextended the SiS Components to produce the IMYMS Components of EffectiveTeaching and Learning (Figure 1) to describe effective teaching and learning inmathematics and science.
Figure 1. The IMYMS Components of Effective Teaching and Learning.
Doig & Groves 57
1. The learning environment promotes a culture of value and respect.1.1 The teacher builds positive relationships through knowing and valuing each student.1.2 The learning environment is characterised by a sense of common purpose and
collaborative inquiry.1.3 The learning environment provides a safe place for students to take risks with their
learning.1.4 Persistence and effort are valued and lead to a sense of accomplishment.2. Students are encouraged to be independent and self-motivated learners.2.1 Students are encouraged and supported to take responsibility for their learning.2.2 Students are encouraged to reflect on their learning.3. Students are challenged to extend their understandings.3.1 Subject matter is conceptually complex and intriguing, but accessible.3.2 Tasks challenge students to explore, question and reflect on key ideas.3.3 The teacher clearly signals high expectations for each student.4. Students are supported to develop meaningful understandings.4.1 Teaching strategies explore and build on students’ current understandings.4.2 Individual students’ learning needs are monitored and addressed.4.3 Students are supported to make connections between key ideas.4.4 Teaching sequences promote sustained learning that builds over time.4.5 Learning sequences involve an interweaving of the concrete and the abstract/conceptual.5. Students are encouraged to see themselves as mathematical and scientific thinkers.5.1 Students are explicitly supported to engage with the processes of investigation and
problem solving.5.2 Students engage in mathematical/scientific reasoning and argumentation.6. Mathematics and science content is linked with students’ lives and interests.7. Assessment is an integral part of teaching and learning.7.1 Learners receive feedback to support further learning.7.2 Assessment practices reflect all aspects of the learning program.7.3 Assessment criteria are made explicit.8. Learning connects strongly with communities and practice beyond the classroom.8.1 The learning program provides opportunities to connect with local and
broader communities.8.2 Learners engage with a rich, contemporary view of mathematics and science knowledge
and practice.9. Learning technologies are used to enhance student learning.

In particular, the extension of the SiS components to the IMYMSComponents of Effective Teaching and Learning involved a number of distincttypes of changes. Some of the SiS components were regarded as being equally applicable to mathematics, requiring only minor changes in wording(e.g., sub-component 2.1). Other changes, however, reflected the middle yearsfocus of the project (e.g., sub-component 1.1); the literature review on effective teaching (e.g., sub-component 3.3); the teacher interviews (e.g., sub-component 1.4); and our previous research (e.g., sub-component 3.1,Groves & Doig, 2002).
While understanding teachers’ practice is critical to understanding classroom “life”, student perceptions of what they are undergoing and theirattitudes to their teacher’s practices are also critical. While students do notknow, necessarily, why they are required to learn or practise particularaspects of mathematics and science, they nevertheless have perspectives andopinions that affect classroom “life”. In other words, their perceptions dohave an impact on the classroom environment and, importantly, on theirlearning. As van den Heuvel-Panhuizen (2005, p. 23) points out, “childrengive us new lenses for understanding mathematics classrooms and new ideasfor improving mathematics education”.
In order to provide a broader, more complete understanding of the learning environment, students in the project classrooms were surveyed withrespect to their perceptions of their learning environment, as well as theirviews about particular pedagogical practices. The complete student surveyconsisted of 36 statements focussing on students’ perceptions of classroompractice and their attitudes to mathematics and science, together with 24statements related to their learning preferences. While both aspects of the student survey are important, it is the first aspect that will be discussed here,referred to as “the IMYMS student perceptions survey”.
The IMYMS student perceptions survey comprised 36 statementsfocussed on features of the mathematics (or science) classroom environmentsin which the students found themselves and their attitudes to mathematics(or science). Of the 36 statements, 27 were designed to correspond to the nineIMYMS Components (three per component), with the remaining nine corresponding to three aspects of student attitudes—namely enjoyment of,aspirations for, and value to their future of, mathematics and science (againthree per aspect). The survey was in a Likert-type format (Likert, 1932), withstudents responding by selecting one of four response categories rangingfrom strongly disagree to strongly agree. The complete set of student perceptionsurvey statements for mathematics can be found in Figure 5, where the numbering of statements is in the original survey order, but with statementsdisplayed in their Component Mapping aspects of student attitudes groupings.
The IMYMS student survey was administered twice during the life of theproject. The data analysed in this paper are from the initial administrationonly, where over 1600 students in Year 5 through to Year 10 (Primary N = 731;Secondary N = 892) responded to the survey for mathematics.
58 Easier Analysis and Better Reporting

Analysing the IMYMS Student Perceptions DataThe IMYMS student perceptions survey is a rating scale, and therefore
the data produced are ordinal. If we take the usual course of action in educational research and compute, for example, the means for the raw ordinal data for the three statements focussed on Component 1 “The learningenvironment promotes a culture of value and respect”, we obtain the following:
• Q 1 “It is OK to say what I think in my maths class” (M = 3.1);• Q 13 “We are encouraged to respect each other’s ideas in my maths
class” (M = 3.2); and• Q 25 “My teacher values my work and ideas in maths” (M = 2.8).What are we to make of this? At first glance we can see that, apparently,
the average student response is in the agree category for Q 1 and Q 13, and in the disagree category for Q 25. How do we interpret these numbers, particularly the decimal portion? Is a mean of 3.1 for Q 1 better than a meanof 3.2 for Q 13? And what are we to make of the fact that using this approachresults in an overall mean of 2.8 for all students across the entire survey? Doesthis indicate that students have responded mainly in category 2?
Of course, this point is moot, for as Siegal (1956) has pointed out, the flawis in the treatment of the ordinal data at the outset. The manual for the well-known analytic tool, the Statistical Package for the Social Sciences (SPSS)(Norusis, 1990), puts it this way: “Ordering is the sole mathematical property applicable to ordinal measurements, and the use of numeric valuesdoes not imply that any other property of numbers is applicable” (p. 96).
Siegal (1956), however, is much more adamant in his presentation of theissue surrounding the analysis of rating scales and the ordinal data that they produce when he states:
The statistic most appropriate for describing the central tendency of scores inan ordinal scale is the median, since the median is not affected by changes ofany scores which are above or below it as long as the number of scores aboveand below remains the same. … At the risk of being excessively repetitious,the writer wishes to emphasise here that parametric statistical tests, whichuse means and standard deviations (i.e., which require the operations ofarithmetic on the original scores), ought not to be used with data in an ordi-nal scale. … means and standard deviations found on the scores themselvesare in error to the extent that the successive intervals (distances betweenclasses) on the scale are not equal. … When parametric techniques of statis-tical inference are used with such data, any decisions about hypotheses aredoubtful. Probability statements derived from the application of parametricstatistical tests to ordinal data are in error to the extent that the structure ofthe method of collecting the data is not isomorphic to arithmetic. Inasmuchas most of the measurements made by behavioural scientists culminate inordinal scales…this point deserves strong emphasis. (pp. 23-26)
Similar warnings can be found elsewhere in the social science researchliterature (e.g., Thorkildsen, 2005).
Doig & Groves 59

As Siegal states, the allowable operations on the ordinal data resultingfrom a survey such as the IMYMS student perceptions survey may be reported for every statement as:
• the median response to each category;• the proportion of responses in each category; or• transformed data on an interval scale.
The results of calculating and graphing the median response for each of thestatements of the IMYMS student perceptions survey are shown in Figure 2.
Clearly a report offering the medians provides a minimal amount of useful information. For example, in this case it would appear that studentresponses to Q 8 “In maths we do things that interest me” and Q 18 “Themaths we do is connected to things I am interested in outside school” are notas strongly endorsed as a statements such as Q 23 “I really want to do well inmaths”, which was the most strongly endorsed statement on the survey. Mostother statements appear to be equally well endorsed.
Figure 2. Median responses to the student perceptions survey statements.
60 Easier Analysis and Better Reporting
Figure 3. Proportions of responses in each of four response categories.

The major feature of the students’ responses missing from the medianapproach is any indication of the distribution of the responses. Further, thereis no way in which a particular student’s response pattern can be discernedfrom this form of summary information. In our view, this is not a useful strategy for reporting these data.
The second alternative for reporting these data, the proportion ofresponses in each category for every statement, appears in Figure 3, where theIMYMS student perceptions survey statements are presented in the sameorder as in the median report in Figure 2.
The display of proportion of responses in each category, from strongly disagree at the bottom to strongly agree at the top of each column, provides aclear picture of the pattern of endorsement of the survey statements. Forexample, it appears that the statement in Q 23 “I really want to do well in maths” is most strongly endorsed, with more than half the studentsresponding that they strongly agree. This statement is closely followed by Q 15“My teacher expects everyone to do their best in maths”, with about half thestudents responding strongly agree.
At the other end of the scale, the statement in Q 8 “In my maths class we work on projects outside school or have people come to talk to us” isstrongly rejected as occurring in their class by about thirty percent of respondents, and rejected by a further forty percent of students. Thus, fromthe graph of response proportions, we can see that about three-quarters ofstudents believe that they do not engage in projects or have guest speakers intheir mathematics classes.
Other inferences can be drawn from the graph of the proportions ofresponses since the survey statements have been grouped in such a way thatthose that address the same IMYMS Component are together. An example is Component 2, “Students are encouraged to be independent and self-motivated learners”, that is addressed by the IMYMS student perceptionssurvey statements:
• Q 2 “In my maths class I am expected to make decisions about howI do my work”;
• Q 14 “My teacher expects me to think about how well I understandthings”; and
• Q 26 “In my maths class we are encouraged to work things out forourselves”.
The bar graph in Figure 3 shows that responses to these three statementsare positive (either agree or strongly agree) for the majority of students. Thisindicates that these students perceive themselves as being encouraged by their teachers to become independent learners. However, while the proportions of particular responses are informative, and certainly providemuch more useful information than the record of the median response shownin Figure 2 above, they do not provide any information on individual students or even about sub-groups of students. Unfortunately, as describedabove, we have now exhausted the possibilities (medians and proportions)available directly from the raw data, although, of course, there are
Doig & Groves 61
non-parametric approaches that can be used to provide information on various aspects of these data.
As noted above, an alternative to using the raw ordinal data is to transform the data mathematically, using an order-preserving transformation:that is, a form of transformation that preserves the ranking of the raw data andproduces an interval scale, one that allows the operations of ordinary arithmetic such as addition. Thus the transformed data can be used to providestatistics such as means and standard deviations.
In our case, we transformed the raw ordinal data into logits (log oddsunits) using Masters’ Partial Credit Model (Wright & Masters, 1982) and thesoftware Quest (Adams & Khoo, 1996). This approach places student abilityand item difficulty on the same scale and allows one to estimate the likelihood of a student of a particular ability correctly answering an item of aparticular difficulty. In the present case, where a Partial Credit analysis hasbeen used on ordinal survey data, this means the interval scale representsboth the degree of endorsement needed to respond in a particular category(the category difficulty) and the degree to which a student agrees with thesurvey statements (the student perception). As a direct consequence, the distances on the resulting scale have substantive meaning—a feature that weexploit to develop better, more efficacious reporting alternatives.
New Reporting FormatsIn this section, four new reporting formats, derived from the transforma-
tion of ordinal data onto an interval scale using the Masters’ Partial CreditModel, are described.
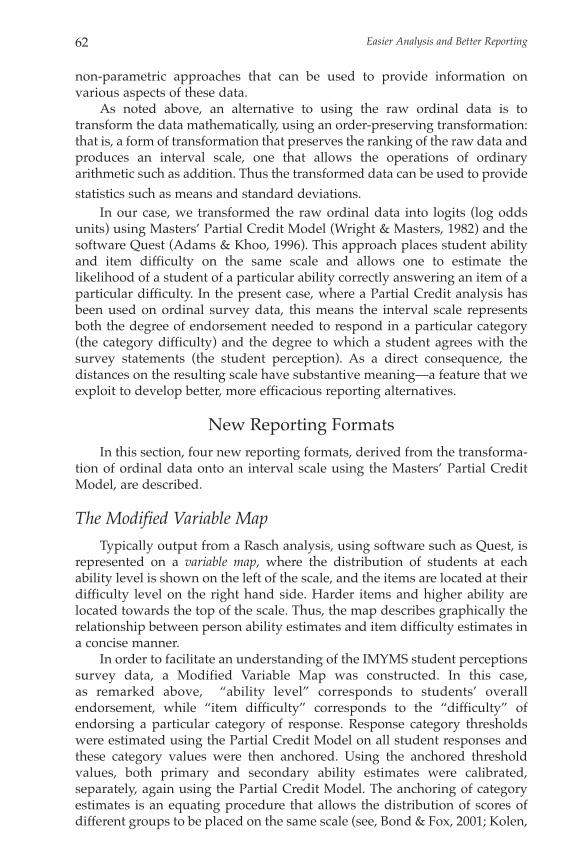
The Modified Variable Map
Typically output from a Rasch analysis, using software such as Quest, isrepresented on a variable map, where the distribution of students at each ability level is shown on the left of the scale, and the items are located at theirdifficulty level on the right hand side. Harder items and higher ability arelocated towards the top of the scale. Thus, the map describes graphically therelationship between person ability estimates and item difficulty estimates ina concise manner.
In order to facilitate an understanding of the IMYMS student perceptionssurvey data, a Modified Variable Map was constructed. In this case, as remarked above, “ability level” corresponds to students’ overall endorsement, while “item difficulty” corresponds to the “difficulty” ofendorsing a particular category of response. Response category thresholdswere estimated using the Partial Credit Model on all student responses andthese category values were then anchored. Using the anchored threshold values, both primary and secondary ability estimates were calibrated, separately, again using the Partial Credit Model. The anchoring of categoryestimates is an equating procedure that allows the distribution of scores ofdifferent groups to be placed on the same scale (see, Bond & Fox, 2001; Kolen,
62 Easier Analysis and Better Reporting

1999, for details of these procedures). Therefore, the two variable maps produced by these two calibrations can be arranged, manually, to produce aModified Variable Map showing distributions of both groups of students.
Figure 4 shows the Modified Variable Map for the IMYMS student perceptions survey data. In this Modified Variable Map, the distribution ofprimary students is on the left-hand side, and the secondary students’ distribution is on the right. Students with greater agreement with, or endorsement of, the survey statements are at the higher end of the scale, andthose showing lesser agreement are at the lower part of the scale. The scale isin logits, the units of the interval scale produced by the Partial Credit transformation, and has both positive and negative values.
In this Modified Variable Map, the IMYMS student perceptions surveystatements are labelled as x.y where x indicates the survey statement number,and y indicates the category threshold. Thus, 10.4 is the point on the scale (the
Doig & Groves 63
Figure 4. The IMYMS student perceptions Modified Variable Map.

threshold) at which the most likely response for a student at that pointchanges from category 3 (agree) to category 4 (strongly agree). The higher onthe logit scale a threshold appears, the more difficult it is for students toendorse that category. So, for example, the fact that 10.4 appears higher on thescale than 33.4 indicates that it is more difficult for a student to endorse category 4 (strongly agree) for statement 10 than for statement 33.
The likely student response to a survey statement can be found by aligning the student’s degree of endorsement, shown by the response distributions and scale values, with the category interval at that scale point.For example, a student with an endorsement “score” of +2.0 logits aligns withThreshold 4, strongly agree, for statement Q 1 (shown on the Modified VariableMap as 1.4). This indicates that this student is equally likely to respond agreeor strongly agree to this statement. However, for statement Q 8, this same student is most likely to respond agree (category 3) as the student’s positionon the scale is between the thresholds 8.3 and 8.4. All other combinations ofresponse and statement can be interpreted similarly.
It can be seen from Figure 4 that the two most difficult statements for students to respond to with strongly agree were:
• Q 8 “In my maths class we work on projects outside school or havepeople come to talk to us”; and
• Q 18 “The maths we do is often connected to things I am interestedin outside school”.
Both of these statements have Threshold 4 situated at 3.5 on the logit scale. Similarly, it can be seen that lowest logit score corresponding to
Threshold 4 is at about 0.4 on the logit scale, so the easiest statement for students to respond with strongly agree is:
• Q 23 “I really want to do well in maths”.By looking at the distribution of primary and secondary respondents on
the logit scale in Figure 4, it can also be seen that the primary students’ scoresare spread over a wider range than the secondary scores, suggesting morehomongenous responses from the secondary students than the primary ones.In addition, the primary students, as a group, appear higher on the logit scalethan the secondary students, indicating that, as a group, they gave a morepositive response to the statements than did the secondary students. Thesefindings will be explored further in later sections of this paper.
However, while the Modified Variable Map provides ready insight intomany aspects of the survey data, it does not provide easy access to much ofthe information it contains. For example, the actual survey statements need tobe referenced in order to understand to which statement students areresponding. Further, the distances between thresholds are visible in theModified Variable Map, but not in a way that is easy to make comparisonsbetween these distances; nor can one easily examine the relative positions,and therefore likely responses, of individuals or groups with respect to theirraw ordinal scores. This has lead to the development of the Ordinal Map discussed in the next section.
64 Easier Analysis and Better Reporting

The Ordinal Map
The student perceptions survey data can also be shown visually in theOrdinal Map (Figure 5), derived from a variable map that has been rotated 90degrees clockwise. Thus the Ordinal Map represents the ordinal data transformed onto an interval (logit) scale. It provides prima facie evidencethat the original Likert scale categories formed a merely ordinal level scale.Each student perceptions survey statement lies beside a “bar” that visuallyrepresents the entire interval scale, with the boundary between categories(the threshold) indicated by a vertical line in the bar.
The bar shows the four categories of response: the first, left-most, sectionrepresents the strongly disagree category, while the right-most section represents strongly agree. The length of the four sections of each bar indicatesthe distance on the interval scale between each “step”. Since all possible total
Doig & Groves 65
Figure 5a. The IMYMS student perceptions reported on an Ordinal Map (Part A)

raw scores have a scale value on the logit interval scale, it is possible to mapraw scores onto the logit scale and vice versa. For convenience, this raw scorescale has been used in Figure 5a and 5b. It should be noted that, as this is aninterval scale, equal differences in the ordinal raw scores do not appear asequal length intervals on this scale. This provides succinct evidence of the effect of the Rasch measurement transformation from ordinal data to aninterval scale.
When using this Ordinal Map, knowing a student’s total raw score is sufficient to know the likelihood of a response to any survey statement. Thiscan be accomplished easily by drawing a vertical line at the student’s rawscore position on the scale at the foot of the Ordinal Map through all the statement bars, as shown in Figure 5a and 5b.
66 Easier Analysis and Better Reporting
Figure 5b. The IMYMS student perceptions reported on an Ordinal Map (Part B).
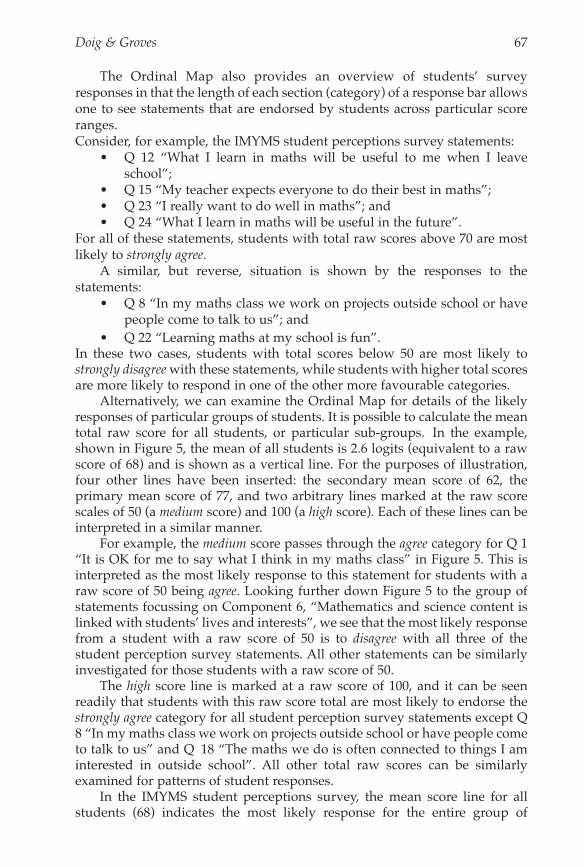
The Ordinal Map also provides an overview of students’ survey responses in that the length of each section (category) of a response bar allowsone to see statements that are endorsed by students across particular scoreranges. Consider, for example, the IMYMS student perceptions survey statements:
• Q 12 “What I learn in maths will be useful to me when I leaveschool”;
• Q 15 “My teacher expects everyone to do their best in maths”;• Q 23 “I really want to do well in maths”; and• Q 24 “What I learn in maths will be useful in the future”.
For all of these statements, students with total raw scores above 70 are mostlikely to strongly agree.
A similar, but reverse, situation is shown by the responses to the statements:
• Q 8 “In my maths class we work on projects outside school or havepeople come to talk to us”; and
• Q 22 “Learning maths at my school is fun”.In these two cases, students with total scores below 50 are most likely tostrongly disagree with these statements, while students with higher total scoresare more likely to respond in one of the other more favourable categories.
Alternatively, we can examine the Ordinal Map for details of the likelyresponses of particular groups of students. It is possible to calculate the meantotal raw score for all students, or particular sub-groups. In the example,shown in Figure 5, the mean of all students is 2.6 logits (equivalent to a rawscore of 68) and is shown as a vertical line. For the purposes of illustration,four other lines have been inserted: the secondary mean score of 62, the primary mean score of 77, and two arbitrary lines marked at the raw scorescales of 50 (a medium score) and 100 (a high score). Each of these lines can beinterpreted in a similar manner.
For example, the medium score passes through the agree category for Q 1“It is OK for me to say what I think in my maths class” in Figure 5. This isinterpreted as the most likely response to this statement for students with araw score of 50 being agree. Looking further down Figure 5 to the group ofstatements focussing on Component 6, “Mathematics and science content islinked with students’ lives and interests”, we see that the most likely responsefrom a student with a raw score of 50 is to disagree with all three of the student perception survey statements. All other statements can be similarlyinvestigated for those students with a raw score of 50.
The high score line is marked at a raw score of 100, and it can be seenreadily that students with this raw score total are most likely to endorse thestrongly agree category for all student perception survey statements except Q8 “In my maths class we work on projects outside school or have people cometo talk to us” and Q 18 “The maths we do is often connected to things I aminterested in outside school”. All other total raw scores can be similarly examined for patterns of student responses.
In the IMYMS student perceptions survey, the mean score line for all students (68) indicates the most likely response for the entire group of
Doig & Groves 67

students. It is clear from scanning Figure 5 that most students respond positively to the majority of student perceptions survey statements.Exceptions to this are statements Q 6 and Q 18 focused on Component 6,“Mathematics and science content is linked with students lives and interests”and statements Q 8 and Q 32 focused on Component 8, “Learning connectsstrongly with communities and practice beyond the classroom”.
The difference between the mean total raw scores of primary and secondary students is easily observed in an Ordinal Map, but more interestingly, similarities and differences in the patterns of likely responsesare also revealed. For example, the likely mean response of primary and secondary students is the same for many survey statements, such as all thestatements under Component 1, “The learning environment promotes a culture of value and respect,” which is an indication that this is a commonperception of both groups of students. Other examples of this similarity ofperception are found for Component 2, “Students are encouraged to be independent and self-motivated learners” and Component 3, “Students areencouraged to see themselves as mathematical and scientific thinkers”. Onthe other hand, for all of the statements associated with the Attitude,“Enjoyment of mathematics”, we find that the primary students are likely torespond agree, and the secondary students disagree, indicating a consistentdifference in their perceptions.
We argue that graphical displays like the Ordinal Map in Figure 5 givethe analyst and the reader immediate access to a wealth of information aboutboth the responses of the group and the individual, based simply on rawscores, and they afford interpretations of the data not possible with otherforms of analysis. Further, this format also shows clearly the “difference” inresponse between any two (or more) students or groups of students. The horizontal distance between any vertical lines drawn through the raw scorescale, for an individual or group, makes it very easy to see where individualsand groups agree and differ in their responses to survey statements, andwhether these differences can be interpreted as being substantive. Anotherexample of the use and advantages of the Ordinal Map can be found in Doigand Groves (2005).
The Threshold Map
A foundation principle of Rasch measurement is the invariance of itemdifficulties—that is, item difficulties are the same for all similar groups ofrespondents. In the example given here, of responses to the IMYMS studentperceptions survey, constructing the item thresholds (the boundary betweencategories of response) on one group of respondents determines these valuesfor other similar groups of respondents. According to Bond and Fox (2001),deviations from this theoretical principle may be deduced as evidence that:
our measurement expectations have not been sustained in practice: that parallel versions of a test are not parallel, that some test items are biased, thatsome test formats discriminate against some persons or group of persons,that some items are context dependent, and so on. (p. 59)
68 Easier Analysis and Better Reporting

Haertel (2004), describing the behaviour of linking items in test equating,points out that changes in common (linking) item values when tests areadministered in successive years may be the result of changes in teacher practice and that “it might be that those linking items that appear anomalousfrom one administration to the next are precisely the ones revealing realreform effects” (p. 3). In the example used here, the IMYMS student perceptions survey, both the primary and secondary students responded toprecisely the same questions. Moreover, although the number of items wasrelatively small (36), the number of respondents was reasonably large(approximately 1600). In this case, we would claim that deviations from itemdifficulty invariance are evidence of contextual factors affecting the respondents—in particular, the differences found in mathematics classroompractice in primary and secondary schools—rather than sampling variationin the response data (for examples on this issue, Baker, 2001).
In order to examine the information contained in any differences in thethresholds, for the same items and their categories, the item estimates werecalculated for primary and secondary students separately. As all items werecommon to both sets of respondents, they all act as link items, and the equating of the two “tests” (the set of items administered to primary students
Doig & Groves 69
Figure 6. The common scale Threshold Map.

and the set administered to secondary students) is achieved by the fact thatthe two scales constructed, under the principle of invariance, are precisely thesame, within error. Thus, this equating procedure produces a common, or reference scale (Beltyukova & Fox, 2004), that enables comparisons of similarities and differences in the data to be observed.
Figure 6, which we are calling a Threshold Map, is a form of the more common variable map produced by Rasch analysis software such as Quest.Here, however, the student response distributions have been removed andthe item thresholds, constructed from the responses of the two groups of students, have been placed in the centre of the page. The common logit scaleis at the left-hand side.
The two sub-sample groups of category thresholds have been separatedhorizontally to make it easier to identify the thresholds relevant to the twogroups of students who responded to the perceptions survey. This separationallows us to isolate similarities and differences caused by differences in theresponses of the two groups of students. As was noted earlier, it can be seen that for both primary and secondaryrespondents the most difficult statements to respond with strongly agreewere:
• Q 8 “In my maths class we work on projects outside school or havepeople come to talk to us”; and
• Q 18 “The maths we do is often connected to things I am interestedin outside school”.
However, in contrast to the primary students, the secondary respondentsfound the following two statements amongst the most difficult statementswith which to strongly agree:
• Q 6 “In maths we study things that interest me”; and• Q 22 “Learning maths at my school is fun”.
In both cases, the thresholds for strongly agree for the secondary students wereabout 0.8 logits higher than for the primary students.
Inspection of the Threshold Map shows that there are many other statements for which the secondary students have a considerably higherthreshold (say 0.5 logits or more) for strongly agree than the primary students,but only one where the reverse is true, namely,
• Q 19 “My teacher always tells us how our maths will be marked”.Interestingly, all three thresholds for this statement are between 1.0 and 1.3logits higher for primary students than secondary students.
However, as evident in an earlier version illustrating similarities and differences in primary and secondary mathematics teachers’ classroom practices (see, Doig, Groves, Tytler, & Gough, 2005 for this earlier version)there are difficulties associated with such an analysis. These difficulties,which are discussed below, lead to the construction of the Annotated Ordinal Map.
70 Easier Analysis and Better Reporting

The Annotated Ordinal Map
Although the Threshold Map shows differences in a diagrammatic manner, it is difficult to inspect all the thresholds for a particular statementsimultaneously. Moreover, in a survey such as the one reported here, there isthe additional problem of identifying statements referring to the sameComponent or Attitude. A more serious difficulty is that observable differences do not necessarily indicate substantive meaning, as the ThresholdMap does not include any detail of measurement errors that sensibly couldreduce an apparent “difference” to mere wishful thinking.
As a precaution against making such errors in inference, the differencebetween threshold ranges for primary and secondary respondents for eachthreshold was calculated for each statement using the difference between thethresholds when measurement errors were included. So, for example, Table 1shows the thresholds and error estimates for Q 15 “My teacher expects everyone to do their best in maths”.
Table 1Thresholds and Error Estimates for Primary and Secondary Responses to Q 15
Q15 T2–E2 T2 E2 T2+E2 T3–E3 T3 E3 T3+E3 T4–E4 T4 E4 T4+E4Prim -2.1 -1.8 0.3 -1.4 -1.6 -1.3 0.3 -1.0 0.3 0.5 0.2 0.7Sec -4.3 -3.8 0.5 -3.3 -2.5 -2.3 0.3 -2.0 0.8 0.9 0.1 1.1Note. Tn is the logit value for Threshold n. En is the error estimate, in logits, for Threshold n
As can be seen in Table 1, for primary students the “upper bound” produced for Threshold 4 when taking into account the error estimate is 0.7logits, while the corresponding “lower bound” for secondary students is 0.8,suggesting that the difference between the primary and secondary thresholdfor students stating that they strongly agree with this statement is at least 0.1logits. In other words, secondary students are finding it somewhat harder tostrongly agree with the statement. Similarly, there is a “gap” in the oppositedirection of 0.4 logits (the difference between the primary lower bound of –1.6and the secondary upper bound of –2.0) for Threshold 3, suggesting that thistime it is the primary students who are finding it harder to say that they agreewith this statement. For Threshold 2, it is again the primary students whofind it harder to disagree (as opposed to strongly disagree) to the statement,with the difference this time being even greater at 1.2 logits (= [–2.1] – [–3.3]).While there appears to be a difference between primary and secondaryrespondents on all of the thresholds for this statement, the difference rangesfrom being quite large at Threshold 2 to much smaller at Threshold 4. Similarcalculations using the error estimates were carried out for each statement.
Figure 7 shows the Ordinal Map from Figure 5 annotated by an indication of those thresholds where there was a difference between primaryand secondary respondents, after taking the error estimates into account. Inorder to provide a clear visual representation of these differences, they havebeen divided arbitrarily into three categories—those where the difference is
Doig & Groves 71
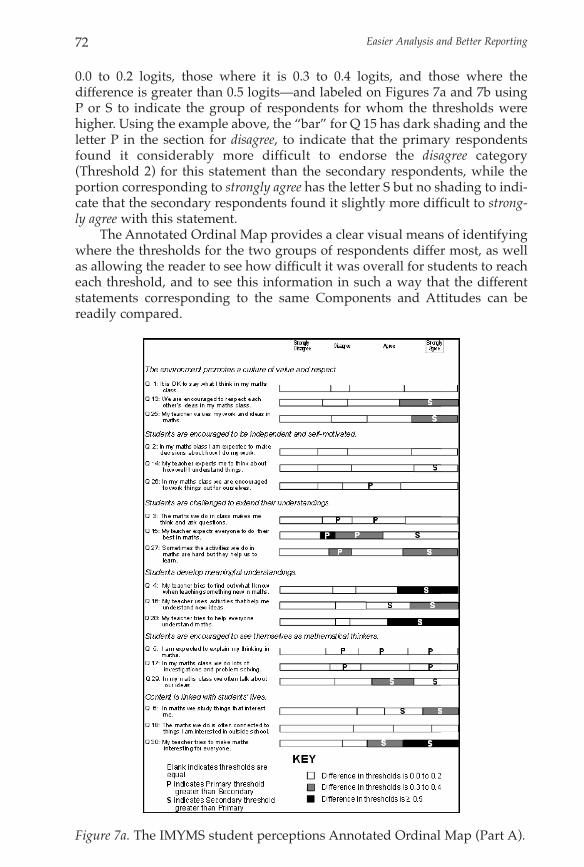
0.0 to 0.2 logits, those where it is 0.3 to 0.4 logits, and those where the difference is greater than 0.5 logits—and labeled on Figures 7a and 7b usingP or S to indicate the group of respondents for whom the thresholds werehigher. Using the example above, the “bar” for Q 15 has dark shading and theletter P in the section for disagree, to indicate that the primary respondentsfound it considerably more difficult to endorse the disagree category(Threshold 2) for this statement than the secondary respondents, while theportion corresponding to strongly agree has the letter S but no shading to indi-cate that the secondary respondents found it slightly more difficult to strong-ly agree with this statement.
The Annotated Ordinal Map provides a clear visual means of identifyingwhere the thresholds for the two groups of respondents differ most, as wellas allowing the reader to see how difficult it was overall for students to reacheach threshold, and to see this information in such a way that the differentstatements corresponding to the same Components and Attitudes can bereadily compared.
72 Easier Analysis and Better Reporting
Figure 7a. The IMYMS student perceptions Annotated Ordinal Map (Part A).

Figure 7b. The IMYMS student perceptions Annotated Ordinal Map (Part B).
For example, as has been observed earlier, primary students were generally more positive in their perceptions than the secondary students. Thisis easily visible in Figures 7a and 7b where there are only four occurrenceswhere the secondary students’ thresholds were more than 0.5 logits lowerthan the primary students’ thresholds—all three thresholds for Q 19 “Myteacher always tells us how our maths will be marked” and the lowest thresh-old for Q 15 “My teacher expects everyone to do their best in maths”. It isinteresting to note that Q 19 is one of the three statements associated withComponent 7, “Assessment is an integral part of teaching and learning”, andfor the other two statements the primary students do not have significantlyhigher thresholds.
Doig & Groves 73

In terms of consistency across statements associated with the sameComponent or Attitude, the most consistent differences occur for Component4, “Students are supported to develop meaningful understandings”, followedby the Attitude, “Enjoyment of mathematics”, and the Attitude, “Students seethe value of mathematics to their future”, with all three of these having consistently higher thresholds for secondary students for all three statements.This is also true to a lesser extent for Component 6, “Mathematics and sciencecontent is linked with students’ lives and interests”, and Component 1, “Thelearning environment promotes a culture of value and respect”, where ineach case, for two of the three statements, secondary students have higherthresholds for strongly agree than do primary students, as well as for agree forComponent 6. The only Components other than Component 7, mentionedabove, where there is a real mix in the direction of difference between secondary and primary thresholds are Component 3, “Students are challenged to extend their understandings”, Component 5, “Students areencouraged to see themselves and mathematical and scientific thinkers”, and,to a lesser extent, Component 8, “Learning connects strongly with communities and practice beyond the classroom.”
ConclusionsIt is unarguable that it is important to take students’ perceptions, or
views, into account when planning learning and teaching for them. Thereappears, however, to be little research evidence of this happening in MiddleYears learning and teaching. The Improving Middle Years Mathematics andScience student perceptions survey is an attempt to make visible these studentviewpoints, and report them in a way that is accessible to teachers andresearchers involved in the project.
In particular, we have shown that in the initial administration of the student survey, the two statements most difficult for both primary and secondary students to endorse were those related to mathematics being connected to students’ interests outside school and linking with practicebeyond the classroom through the use of projects outside school or peoplecoming in to talk to students. Primary, but not secondary students, also foundit very difficult to agree that their teachers tell them how their mathematicswill be marked, while almost all other differences between primary and secondary students were in the direction of secondary students being lesspositive than primary students. For example, secondary students found itmore difficult than primary students to agree with all three statements dealing with the support of students in their development of meaningfulunderstandings, and, to a lesser extent, those related to students’ enjoymentof mathematics and their seeing the value of mathematics to their future.
This type of analysis and reporting will allow a similar comparison ofdata from the science survey, as well as a comparison of data from the initialsurvey with that obtained recently in the second student survey.
As suggested earlier, the use of ordinal data is a common feature of socialscience, and thus, of educational research as well. However, we recognise theconstraints that the use of ordinal data imposes on researchers, and have
74 Easier Analysis and Better Reporting

exposed the limitations of the legitimate operations on these data—the median and simple proportions. Further, we have described aspects of possible legitimate strategies, with a focus on the Rasch model. The examplesof analyses of the Improving Middle Years Mathematics and Science student perceptions survey data have served to illustrate the usefulness of theseapproaches in any research endeavour that relies on questionnaires or surveys as its data collection strategy.
From this exploration of Rasch modelling of ordinal data, and the PartialCredit Model in particular, we have shown the usefulness of transformingordinal data onto an interval scale, and the advantages of such a transformation in terms of possibilities for improved reporting. Further, wehave shown how the nexus between students’ interval scaled scores and thedifficulty of endorsing different survey statements can be used to identifyresponse patterns of students in greater detail than by alternative means.
We have described four newly developed formats of report—theModified Variable Map, the Ordinal Map, the Threshold Map, and theAnnotated Ordinal Map—all of which are ways of reporting ordinal data inan effective and easily comprehended way. We maintain that researchersinterested in maximising the returns for their efforts in collecting ordinal datashould explore the possibilities afforded by the use of Rasch modelling andthese new report formats.
AcknowledgmentsImproving Middle Years Mathematics and Science: The role of subject cultures
in school and teacher change (IMYMS) is funded by an Australian ResearchCouncil Linkage Grant, with Industry Partner the Victorian Department ofEducation and Training. The Chief Investigators are Russell Tytler, SusieGroves and Annette Gough. School clusters are funded through the Victorianstate government’s Schools for Innovation and Excellence initiative.
ReferencesAdams, R. J., & Khoo, S.-T. (1996). Quest: The interactive test analysis system (Version
2) [Computer Software]. Melbourne: ACER.Baker, F. B. (2001). The basics of Item Response Theory (2nd ed.). College Park, MD: ERIC
Clearinghouse on Assessment and Evaluation.Beltyukova, S. A., & Fox, C. M. (2004). Equating student satisfaction measures. Journal
of Applied Measurement, 5(1), 62—69.Bond, T. G., & Fox, C. M. (2001). Applying the Rasch model: Fundamental measurement in
the human sciences. Mahwah, NJ: Lawrence Erlbaum.Doig, B. (2001). Summing up: Australian numeracy performances, practices, programs and
possibilities. Melbourne: ACER Press.Doig, B. (2003). Quality learning communities: Effective practices in the Middle Years of
schooling. (Report prepared for the Middle Years Pedagogy Research andDevelopment Project). Melbourne: Deakin University Consultancy andDevelopment Unit.
Doig & Groves 75

Doig, B., & Groves, S. (2005). Reason for hope: Primary students’ mathematics learning environment. In Novotná, J. (Ed.), Proceedings of the InternationalSymposium Elementary Maths Teaching (pp. 100–107). Prague, Czech Republic:Charles University.
Doig, B., Groves, S., Tytler, R., & Gough, A. (2005). Primary and secondary mathematics practice: How different is it? In P. Clarkson, A. Downton, D. Gronn,M. Horne, A. McDonough, R. Pierce & A. Roche (Eds.), Building connections:Theory, research and practice (Proceedings of the 28th annual conference of theMathematics Education Research Group of Australasia, Melbourne, Vol. 1, pp.305–312). Sydney: MERGA.
Gough, A., & Tytler, R. (2001). Researching effective teaching and learning in science:The Science in Schools research project. In Crossing borders: New frontiers in education research (Proceedings of the Australian Association for Research inEducation, AARE 2001 International Education Research Conference, pp. 1–4).Fremantle, WA: AARE.
Groves, S., & Doig, B. (2002). Developing conceptual understanding: the role of thetask in communities of mathematical inquiry. In A. D. Cockburn & E. Nardi(Eds.), Proceedings of the 26th conference of the International Group for the Psychologyof Mathematics Education (Vol. 3, pp. 25–32). Norwich, UK: PME.
Haertel, E. H. (2004). The behavior of linking items in test equating. Los Angeles:CRESST/Stanford University.
Kolen, M. J. (1999). Equating of tests. In G. N. Masters & J. P. Keeves (Eds.), Advancesin measurement in educational research and assessment (pp. 164-185). Amsterdam:Pergamon.
Likert, R. (1932). A technique for the measurement of attitudes. Archives of psychology(Number 140).
Masters, G. N. (1988). Partial Credit model. In J. P. Keeves (Ed.), Educational research,methodology, and measurement (pp. 292-297). Oxford, UK: Pergamon.
Norusis, M. J. (1990). SPSS base system user’s guide. Chicago: SPSS.Rasch, G. (1960). Probabilistic models for some intelligence and attainment tests (Expanded
Edition). Chicago: University of Chicago Press. Siegal, S. (1956). Non-parametric statistics for the behavioral sciences (International
Student Edition). New York: McGraw-Hill.Thorkildsen, T. A. (2005). Fundamentals of measurement in applied research. Boston, MA:
Pearson Education.Tytler, R., Waldrip, B., & Griffiths, M. (2004). Windows into practice: Constructing
effective science teaching and learning in a school change initiative. InternationalJournal of Science Education, 26(2), 171–194.
van den Heuvel-Panhuizen, M. (2005). Children’s perspectives of the mathematicsclassroom. In J. Novotná (Ed.), Proceedings of the International SymposiumElementary Maths Teaching (pp. 23 – 33). Prague, Czech Republic: CharlesUniversity.
Wright, B. D., & Masters, G. N. (1982). Rating scale analysis. Chicago: MESA Press.
AuthorsSusie Groves, Associate Professor, Faculty of Education, Deakin University, 221Burwood Highway, Burwood VIC 3125. Email: <[email protected]>
Brian Doig, Faculty of Education, Deakin University, 221 Burwood Highway,Burwood VIC 3125. Email: <[email protected]>
76 Easier Analysis and Better Reporting