Embed Size (px)
Citation preview


EASA EASA – the European Advertising Standards Alliance is the single authoritative voice on advertising self-regulation in Europe. EASA promotes high ethical standards in commercial communications by means of effective self-regulation, for the benefit of consumers and business in Europe and beyond. Effective advertising self-regulation helps ensure responsible advertising, meeting consumers’ demand for honesty and transparency, regulators’ demand for responsibility and engagement and businesses’ demand for freedom to operate responsibly. EASA and its members have developed a robust and coherent system of advertising self-regulation that can respond effectively to new challenges. EASA is not a Self-Regulatory Organisation (SRO) in itself, but acts as a co-ordination point for best practice in the implementation of self-regulation, as well as operational standards for its national SRO members. Part of EASA’s role involves coordinating the cross-border complaint mechanism, EASA also collects and analyses top line statistical data on received and resolved complaints, as well as on copy advice requests and pre-clearance from its SRO members each year. EASA was set up in 1992 to represent national self-regulatory organisations in Europe, in 2004 it developed into a partnership between national advertising SROs and organisations representing the advertising industry. Today, EASA is a network of 53 organisations committed to making sure advertising is legal, decent, honest and truthful. EASA’s membership is made up of 27 SROs from 25 European countries and 14 advertising industry associations, including advertisers, agencies and the media. EASA is also a member of ICAS (The International Council on Ad Self-Regulation) and through its membership additionally partners with 12 SROs worldwide. EASA is a not-for-profit organisation with a Brussels-based Secretariat. For further information please visit www.easa-alliance.org.
EASA Editorial Team
Justina Raižytė Development and Policy Adviser Lucas Boudet Director General
Copyright
The complete or partial reproduction of this publication is forbidden without the prior express written permission from EASA. Please contact Justina Raižytė for further information.
EASA Contact Information
Justina Raižytė
0032 (0)2 513 78 06 [email protected]

Table of contents
1 The Total Number of Cross-Border Complaints Received/Resolved ................................ 2
2 The Country of Origin ...................................................................................................... 4
3 The Origin of Complainant ............................................................................................... 7
4 Outcome of Resolved Complaints ................................................................................... 9
5 Issues Complained About ...............................................................................................12
6 Media .............................................................................................................................14
7 Complaints about Advertising for Products and Services ................................................16
8 Speed of the Resolution of Complaints ...........................................................................18
List of Figures
Figure 1: Cross-border complaints received/received and resolved between 2011 and 2015 ....................................... 3 Figure 2: Cross-border complaints per country of origin in 2015 .................................................................................... 5 Figure 4: Advertisements complained about per country of origin of complainant in 2015 ............................................. 7 Figure 6: Cross-border complaints per outcome in 2015 ............................................................................................... 9 Figure 7: Cross-border complaints per outcome between 2008 and 2015 ................................................................... 11 Figure 8: Cross-border complaints per issue in 2015 ................................................................................................... 12 Figure 9: Cross-border complaints per issue between 2011 and 2015 ........................................................................ 13 Figure 10: Cross-border complaints per medium in 2015 ............................................................................................ 14 Figure 11: Cross-border complaints per medium from 2011 to 2015 ........................................................................... 15 Figure 12: Cross-border complaints in terms of products and services in 2015 ........................................................... 16 Figure 13: Speed of cross-border complaint resolution in 2015 ................................................................................... 18
List of Tables
Table 1: Total number of cross-border complaints received between 2010 and 2015 ................................................... 2 Table 2: Cross-border complaints per country of origin between 2011 and 2015 .......................................................... 6 Table 3: Cross-border complaints per country of origin of complainant between 2011 and 2015 .................................. 8 Table 4: Cross-border complaints in terms of products and services between 2011 and 2015 ................................... 17

Annual Cross-Border Complaints Report 2016
© European Advertising Standards Alliance 1
Key Findings
This report clearly shows how the EASA’s SRO (Self-Regulatory Organisation) network ensures
that the Cross-Border Complaints (CBC) mechanism works. Cross-border complaints are
complaints about advertisements originating in media or from advertiser based in another country
to that of the complainant. The EASA Secretariat co-ordinates this type of complaints through the
system that has been in operation since 1992, when it was set up in response to the creation of
the Single Market and the resulting need to address problems whereby advertising circulated in
one EU Member State was carried in media originating in another.
➢ In 2016, EASA experienced an increase number of cross-border
complaints with 150 cross-border complaints being registered, 9 % more
than in 2015. In total 145 CBCs were resolved over the course of 2016.
➢ Advertisements from Ireland and the Netherlands generated the highest
number of cross-border complaints (22.8% and 17.2% of all complaints
respectively)
➢ The vast majority of cross-border complaints were lodged by UK
complainants (82.8% of all complaints)
➢ 15.2% of cross-border complaints were upheld and 16.6% as were not
upheld; 15.9% complaints were resolved informally)
➢ Misleading advertising was the main issue complained about (82.1%)
➢ Digital Marketing Communications was the most complained about
medium (75.9%)
➢ Leisure services (21.4%), transport services (19.3%) and electronics
(13.1%) were the three most complained about industry sectors
➢ The majority of cross-border complaints were resolved within three
months (69.7%)

Annual Cross-Border Complaints Report 2016
© European Advertising Standards Alliance 2
1 The Total Number of Cross-Border Complaints Received/Resolved
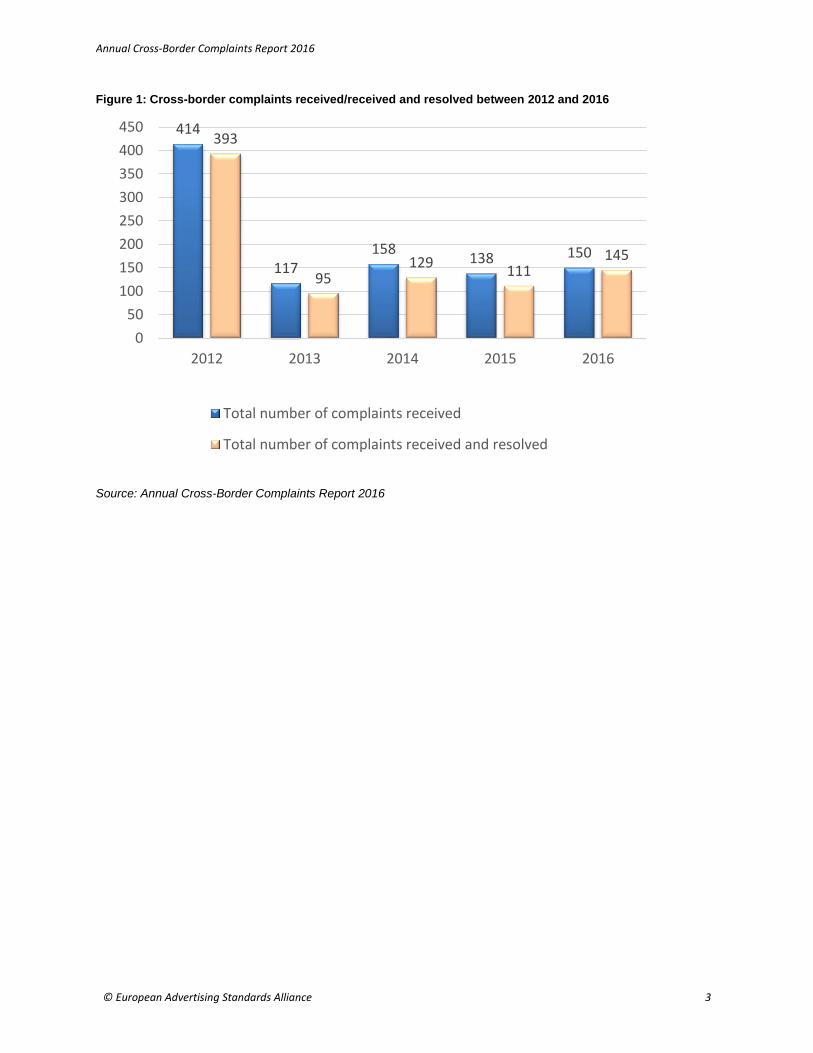
In the course of the year, EASA received a total of 150 cross-border complaints, which shows 9%
increase in received cross-border complaints in comparison to 2015. Out of all received
complaints 124 were resolved in the course of 2016, whereas 26 complaints were still under
investigation at the end of the year. Additionally, 21 complaints lodged in 2015 were also closed
in 2016. The analysis that follows in this report focuses exclusively on the 145 complaints that
were resolved during 2016.
Table 1: Total number of cross-border complaints received between 2011 and 2015
Year Total number of complaints received Total number of complaints received and resolved
2016 150 145
2015 138 111
2014 158 129
2013 117 95
2012 414 393
Source: Annual Cross-Border Complaints Report 2015
The analysis of the annual statistics (depicted in Figure 1 below) suggests that over the past three
years the number of cross-border complaints remained relatively stable at around 149 cross-
border complaints per year. This suggests that European consumers continue to shop and use
services cross-border.
Annual Cross-Border Complaints Report 2016
© European Advertising Standards Alliance 3
Figure 1: Cross-border complaints received/received and resolved between 2012 and 2016
Source: Annual Cross-Border Complaints Report 2016
414
117158
138 150
393
95129
111145
0
50
100
150
200
250
300
350
400
450
2012 2013 2014 2015 2016
Total number of complaints received
Total number of complaints received and resolved
Annual Cross-Border Complaints Report 2016
© European Advertising Standards Alliance 4
2 The Country of Origin
The EASA Cross-Border Complaints System requires that all advertisements comply with the
advertising laws and codes in the relevant country of origin, that is to say, the country in which
the medium carrying the advertisement is based; in the case of direct mail and Digital Marketing
Communications (DMC), the country in which the advertiser is based; and in the case of Online
Behavioural Advertising (OBA), the country in which the principal decision-making presence is1.
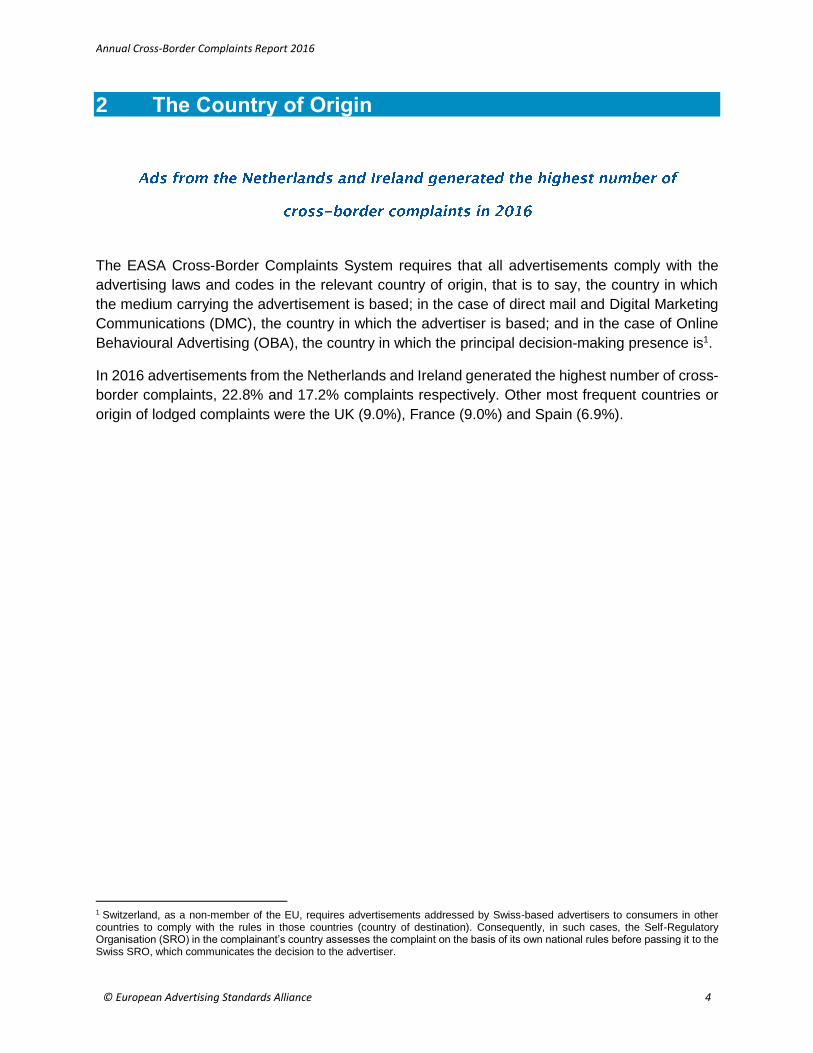
In 2016 advertisements from the Netherlands and Ireland generated the highest number of cross-
border complaints, 22.8% and 17.2% complaints respectively. Other most frequent countries or
origin of lodged complaints were the UK (9.0%), France (9.0%) and Spain (6.9%).
1 Switzerland, as a non-member of the EU, requires advertisements addressed by Swiss-based advertisers to consumers in other countries to comply with the rules in those countries (country of destination). Consequently, in such cases, the Self-Regulatory Organisation (SRO) in the complainant’s country assesses the complaint on the basis of its own national rules before passing it to the Swiss SRO, which communicates the decision to the advertiser.

Annual Cross-Border Complaints Report 2016
© European Advertising Standards Alliance 5
Figure 2: Cross-border complaints per country of origin in 2016
Source: Annual Cross-Border Complaints Report 2015
Regarding the advertisements originating in the Netherlands, UK complainants lodged 84.8% of
complaints about these ads. The majority of the complaints (90.9%) were provoked by misleading
advertising. The highest share of complained about ads (63.6%) originating in the Netherlands
concerned leisure services. More particularly one Dutch website for hotel reservations which all
of these mentioned complaints.
Regarding the advertisements originating in Ireland, all 25 cross-border complaints were lodged
by the British consumers. The vast majority (76.0%) of the complaints about ads originating in
Ireland, were provoked by misleading marketing communications as well. Regarding topics – the
highest share of complaints (36.0%) were received in relation to advertising of gambling and
betting services, particularly one Irish online betting platform, which was complained about the
most (5 out of 9 complaints).
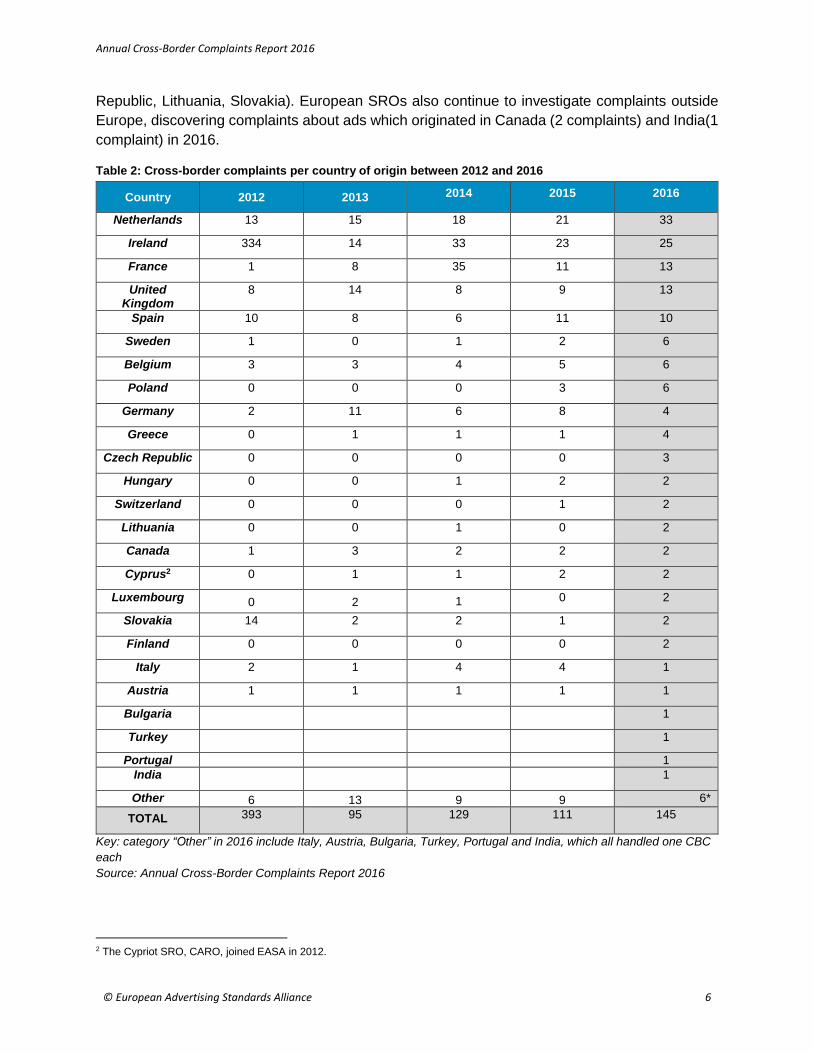
Overall, the annual statistics shows (see an overview, presented in Table 2) that despite some
annual volatilities, on average, the most complained about ads for the past five years were
produced in the Netherlands, Ireland, France, the UK and Spain. However, we also see Central
and Eastern European markets becoming more visible in CBC map each year (e.g. Poland, Czech
Netherlands; 33; 23%
Ireland; 25; 17%France; 13; 9%
United Kingdom; 13; 9%
Spain; 10; 7%
Sweden; 6; 4%
Belgium; 6; 4%
Poland; 6; 4%
Germany; 4; 3%
Greece; 4; 3%
Czech Republic; 3; 2%Other; 22; 15%
Annual Cross-Border Complaints Report 2016
© European Advertising Standards Alliance 6
Republic, Lithuania, Slovakia). European SROs also continue to investigate complaints outside
Europe, discovering complaints about ads which originated in Canada (2 complaints) and India(1
complaint) in 2016.
Table 2: Cross-border complaints per country of origin between 2012 and 2016
Country 2012 2013 2014 2015 2016
Netherlands 13 15 18 21 33
Ireland 334 14 33 23 25
France 1 8 35 11 13
United Kingdom
8 14 8 9 13
Spain 10 8 6 11 10
Sweden 1 0 1 2 6
Belgium 3 3 4 5 6
Poland 0 0 0 3 6
Germany 2 11 6 8 4
Greece 0 1 1 1 4
Czech Republic 0 0 0 0 3
Hungary 0 0 1 2 2
Switzerland 0 0 0 1 2
Lithuania 0 0 1 0 2
Canada 1 3 2 2 2
Cyprus2 0 1 1 2 2
Luxembourg 0 2 1 0 2
Slovakia 14 2 2 1 2
Finland 0 0 0 0 2
Italy 2 1 4 4 1
Austria 1 1 1 1 1
Bulgaria 1
Turkey 1
Portugal 1
India 1
Other 6 13 9 9 6*
TOTAL 393 95 129 111 145
Key: category “Other” in 2016 include Italy, Austria, Bulgaria, Turkey, Portugal and India, which all handled one CBC
each
Source: Annual Cross-Border Complaints Report 2016
2 The Cypriot SRO, CARO, joined EASA in 2012.

Annual Cross-Border Complaints Report 2016
© European Advertising Standards Alliance 7
3 The Origin of Complainant
In 2016, UK complainants remain the most active in terms of lodging the complaints (82.8% of all
complaints). Although, as reflected upon in the previous chapter, the advertisements from the
Netherlands (23.1%) and Ireland (20.6%) and amongst the most complained about by UK
complainants, it is also important to note that the complainants from the UK challenged
advertisements originating from 23 different countries (including ads from India and Canada).
Same as in previous year, the vast majority of these cross-border complaints (90.9%) were about
alleged misleading advertising. Furthermore, the highest share of complaints were related to
leisure services (23.1%) and transport (22.3%), followed by complaints about the electronic goods
(14.0%) and gambling/ betting services (10.7%).
The remainder of the cross-border complaints (17.2%) were lodged Irish, German, French,
Belgian, Spanish, Italian, Dutch and Swedish consumers, as showed in Figure 3, below.
Figure 3: Advertisements complained about per country of origin of complainant in 2016
Source: Annual Cross-Border Complaints Report 2016
United Kingdom; 121; 83%
Ireland; 10; 7%
Germany; 5; 3%
France; 4; 3%
Belgium; 1; 0%
Spain ; 1; 1%
Italy; 1; 1%Netherlands; 1; 1%
Sweden; 1; 1%

Annual Cross-Border Complaints Report 2016
© European Advertising Standards Alliance 8
The annual statistics shows (see an overview, presented in Table 2) that over the years UK
complainants have reported the greatest share of cross-border complains, three to five times
more complaints than the rest of the complainant combined.
Table 3: Cross-border complaints per country of origin of complainant between 2012 and 2016
Source: Annual Cross-Border Complaints Report 2016
Country 2012 2013 2014 2015 2016
UK 366 66 108 85 121
Ireland 5 11 5 12 10
Germnay 0 0 0 2 5
France 2 3 5 1 4
Netherlands 0 3 1 5 1
Belgium 4 6 3 1 1
Spain 1 0 2 1 1
Italy 0 0 0 1 1
Sweden 0 1 1 0 1
Other 15 5 4 3 0
TOTAL 393 95 129 111 139
Annual Cross-Border Complaints Report 2016
© European Advertising Standards Alliance 9
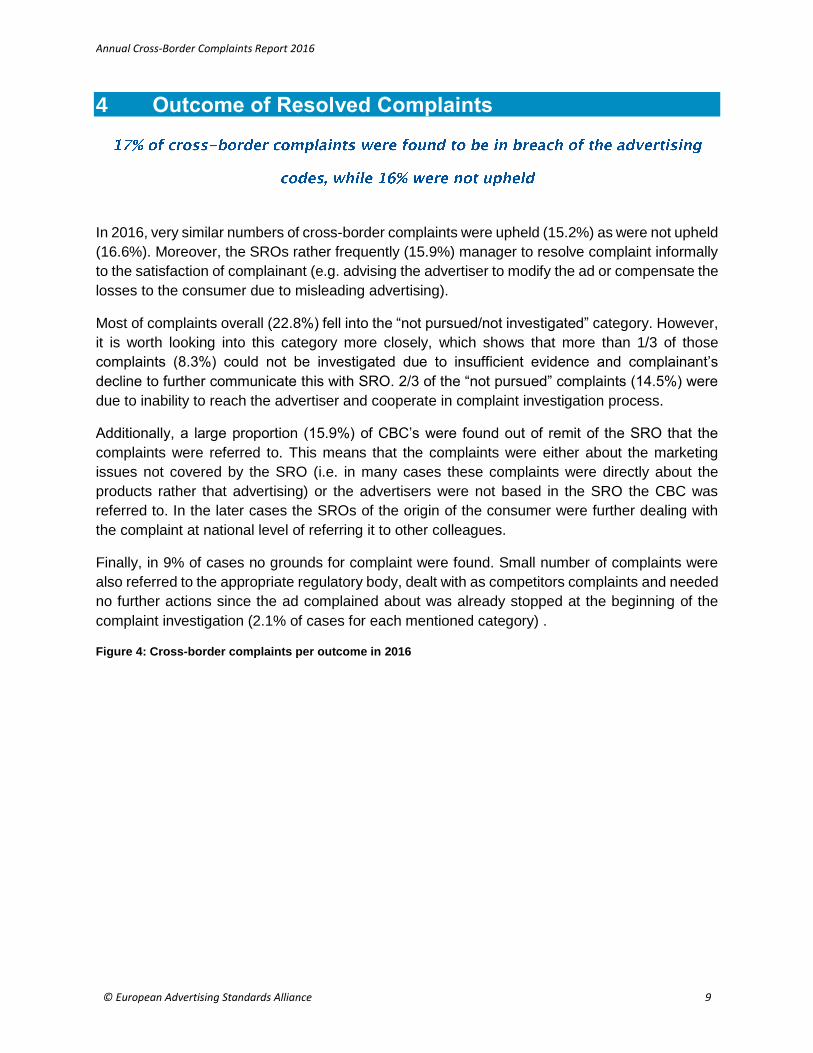
4 Outcome of Resolved Complaints
In 2016, very similar numbers of cross-border complaints were upheld (15.2%) as were not upheld
(16.6%). Moreover, the SROs rather frequently (15.9%) manager to resolve complaint informally
to the satisfaction of complainant (e.g. advising the advertiser to modify the ad or compensate the
losses to the consumer due to misleading advertising).
Most of complaints overall (22.8%) fell into the “not pursued/not investigated” category. However,
it is worth looking into this category more closely, which shows that more than 1/3 of those
complaints (8.3%) could not be investigated due to insufficient evidence and complainant’s
decline to further communicate this with SRO. 2/3 of the “not pursued” complaints (14.5%) were
due to inability to reach the advertiser and cooperate in complaint investigation process.
Additionally, a large proportion (15.9%) of CBC’s were found out of remit of the SRO that the
complaints were referred to. This means that the complaints were either about the marketing
issues not covered by the SRO (i.e. in many cases these complaints were directly about the
products rather that advertising) or the advertisers were not based in the SRO the CBC was
referred to. In the later cases the SROs of the origin of the consumer were further dealing with
the complaint at national level of referring it to other colleagues.
Finally, in 9% of cases no grounds for complaint were found. Small number of complaints were
also referred to the appropriate regulatory body, dealt with as competitors complaints and needed
no further actions since the ad complained about was already stopped at the beginning of the
complaint investigation (2.1% of cases for each mentioned category) .
Figure 4: Cross-border complaints per outcome in 2016

Annual Cross-Border Complaints Report 2016
© European Advertising Standards Alliance 10
Source: Annual Cross-Border Complaints Report 2016
Looking at the data on the outcome of cross-border complaints between 2012 and 2016 (see
Figure 5), it is noticeable that despite some annual fluctuations, the main categories and their
percentage values remained similar (particularly in the last three years) with some of kay
outcomes changing places in terms of being more or less common each year (e.g. not upheld
and upheld).
Moreover, it is important to investigate the category of “not pursued” complaints more closely as
it remains the most common one among the outcomes of all complaints in the past three years.
The breakdown of this type of complaint resolution shows very different subcategories resulting
in overall “not pursued” outcome. Only less than half of these cases could not be further
investigated due to SROs exhausted efforts to reach out to and get further information from the
advertiser. Meanwhile, in over half of such cases the claims were decided as lacking
substantiation or the complainants refused to provide necessary information to further investigate
Not Upheld; 24; 17%
Upheld; 22; 15%
Resolved Informally; 21; 15%
Trasferred to appropriate
authority; 3; 2%Out Of Remit;
23; 16%
Not Pursued: advertiser not
cooperating; 21; 14%
Not Pursued: complainant not …
Competitors complaint ; 3; 2%Ad no longer shown; 3; 2%
No grounds for complaint; 13; 9%

Annual Cross-Border Complaints Report 2016
© European Advertising Standards Alliance 11
the complaints (e.g. copy of the ad complained about). None of these decision were appealed by
the complainants.
Figure 5: Cross-border complaints per outcome between 2012 and 20163
Source: Annual Cross-Border Complaints Report 2016
3 The figure excludes the category “Out of remit” in order to avoid over-representing anomalies occurred in 2012 when unusually high
number of complaints against one particular advertisement originating in Ireland were out of remit. Outcome of ruling concerning these cases distorts the image of outcome for cross-border investigations over the course of years.
17% 10% 11%
Advertiser not cooperating
Complainant not providing sufficient support for claim
No grounds for complaint
7%
20%
34%
28%
38%
31%
31%
30%
17%
20%
34%
23%
20%
27%
18%
5%
16%
13%
15%
17%
23%
11%
2%
7%
2%
0%
0%
0%
3%
2%
0%
0%
0%
5%
2%
0% 10% 20% 30% 40% 50% 60% 70% 80% 90% 100%
2012
2013
2014
2015
2016
Not pursued
Not upheld
Upheld
Resolved informally
Transferred to appropriate authority
Competitors complaint redirected to the national complaint handling system
Other

Annual Cross-Border Complaints Report 2016
© European Advertising Standards Alliance 12
5 Issues Complained About
Following trends set in the previous year, in 2016, the largest share of cross-border complaints
(82.1%) concerned misleading advertisements (119 complaints), out of which 21 complaints
(17.6%) were found in breach of the advertising codes.
17 complaints (11.7%) related to taste and decency issues. This category included range of
issues, including protection of children against harmful imagery, distress causing visuals,
portrayal of gender and violence.
Social responsibility issues provoked 7 complaints (4.8%) and privacy and data protection – 2
complaints (1.4%) in 2016. Responsibility issues were raise in relation to impacts of shocking
visuals in advertising, unhealth body image and gender stereotyping.
Figure 6: Cross-border complaints per issue in 2016
Source: Annual Cross-Border Complaints Report 2016
Misleading; 119; 82% Social
Responsibility; 7; 5%
Taste & Decency; 17;
12%
Privacy & Data Protecrion; 2;
1%
Annual Cross-Border Complaints Report 2016
© European Advertising Standards Alliance 13
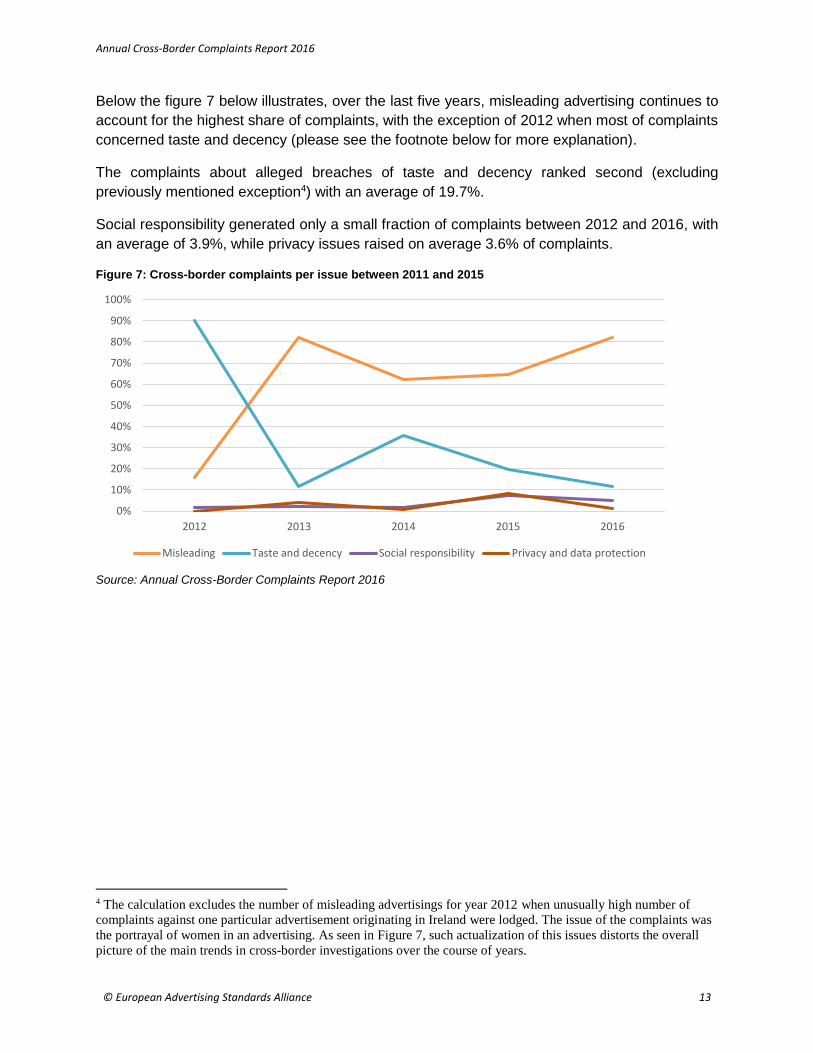
Below the figure 7 below illustrates, over the last five years, misleading advertising continues to
account for the highest share of complaints, with the exception of 2012 when most of complaints
concerned taste and decency (please see the footnote below for more explanation).
The complaints about alleged breaches of taste and decency ranked second (excluding
previously mentioned exception4) with an average of 19.7%.
Social responsibility generated only a small fraction of complaints between 2012 and 2016, with
an average of 3.9%, while privacy issues raised on average 3.6% of complaints.
Figure 7: Cross-border complaints per issue between 2011 and 2015
Source: Annual Cross-Border Complaints Report 2016
4 The calculation excludes the number of misleading advertisings for year 2012 when unusually high number of
complaints against one particular advertisement originating in Ireland were lodged. The issue of the complaints was
the portrayal of women in an advertising. As seen in Figure 7, such actualization of this issues distorts the overall
picture of the main trends in cross-border investigations over the course of years.
0%
10%
20%
30%
40%
50%
60%
70%
80%
90%
100%
2012 2013 2014 2015 2016
Misleading Taste and decency Social responsibility Privacy and data protection

Annual Cross-Border Complaints Report 2016
© European Advertising Standards Alliance 14
6 Media
Digital Marketing Communications (DMC) accounted for 110 (75.9%) cross-border complaints.
Advertisements received as direct marketing triggered 25 (17.2%) cross-border complaints.
Cross-border complaints against advertisements appearing on Audiovisual Media Services
(AVMS) prompted 8 (5.5%) cross-border complaints, while outdoor advertising provoked 2
complaints (1.4%).
Figure 8: Cross-border complaints per medium in 2016
Source: Annual Cross-Border Complaints Report 2016
Annual statistics shows, since 2012 the main media to generate complaints about advertisements
has been DMC. In the period 2012-2016, an average of 75.7% of complaints regarded DMC.
Advertisements received as direct marketing have ranked second since 2011 with an average of
17.4% of complaints between 2012 and 2016. Audiovisual media services has been in the third
place with 5.9% of complaints on average. Both press/magazines and outdoor advertising did not
provoke more than 1% of average number of complaints (0.8% and 0.5% on average,
respectively).
Digital Marketing Communications;
110; 76%
Direct Marketing; 25; 17%
Audiovisual Media Services; 8; 6%
Outdoor; 2; 1%

Annual Cross-Border Complaints Report 2016
© European Advertising Standards Alliance 15
Figure 9: Cross-border complaints per medium from 2012 to 2016
Source: Annual Cross-Border Complaints Report 2016
0%
10%
20%
30%
40%
50%
60%
70%
80%
90%
100%
2012 2013 2014 2015 2016
Digital Marketing Communications Audiovisual Media Services
Direct marketing Press/magazines
Outdoor

Annual Cross-Border Complaints Report 2016
© European Advertising Standards Alliance 16
7 Complaints about Advertising for Products and Services
In 2016, the most complained about sector was leisure and tourism services with 31 complaints
(21.4%). This category includes hotels and holiday accommodation, travel and renting services,
entertainment, sports and leisure activities and dating services. 28 of those complaints were
lodged by the British consumers, mostly about ads seen online (26 complaints)
Transport services (28 complaints, 19.3%) was the second most complained about sector, while
electronics came third (19 complaints, 13.1%). Consumers arounds Europe also rather frequently
complained abbot the alleged breaches of the SR codes regarding marketing communications of
eth gambling services (13 complaints, 9.0%), internet services and telecommunications (10
complaints, 6.9%), as well clothing (9 complaints, 6.2%), and health beauty products and services
(8 complaints, 5.5%).
Figure 10: Cross-border complaints in terms of products and services in 2016
Source: Annual Cross-Border Complaints Report 2016
2
4
4
4
8
9
10
13
13
19
28
31
0 5 10 15 20 25 30 35
Food/ Alcohol
Financial/ Business services
Household/ Energy supply
Motorised vehicles
Health/ Beauty
Clothing/ Accessories
Internet services/ Telecommunication
Gambling/ Lotteries
Other (products/services)
Electronic equipment
Transport
Leisure Service/ Tourism

Annual Cross-Border Complaints Report 2016
© European Advertising Standards Alliance 17
More detailed breakdown of complaints per products and services which allows for comparison
of complaints throughout the years can be found in Table 4.
The trend of rising numbers of complaints about advertising for leisure services was once again
reinforced in 2016, with number of complaints rising by almost 20%, between 2015 and 2016.
However, the consumer complaints about marketing communications for transport sector and
electronic goods grew even faster. The former provoked around 1.3 times more complaints while
the latter was reported by the consumers 3 times more often in 2016 than in 2015.
The number of complaints about gambling services (second most popular sector in 2015) was in
decline by almost 19%. Fewer consumers lodged their complaints about clothing advertising as
well (decline by almost 36%)
Table 4: Cross-border complaints in terms of products and services between 2012 and 2016
Products and services 2012 2013 2014 2015 2016
Leisure service/ Tourism 2 12 17 25 31
Transport 9 14 8 12 28
Electronic equipment 6 9 8 5 19
Gambling/ Lotteries 329 4 27 16 13
Internet services/ Telecommunication
7 7 7 12 10
Clothing/ Accessories 0 6 15 14 9
Health/ Beauty 6 4 9 11 8
Financial/ Business services 2 1 16 4 4
Household/ Energy supply 1 2 1 3 4
Motorised vehicles 1 1 4 2 4
Food/ Alcohol 2 0 4 1 2
Publications 15 7 1 1 0
Other (products/services) 13 28 12 5 135
Total 393 95 129 111 145
Source: Annual Cross-Border Complaints Report 2016
5 For 2016 the category includes sectors that received not more than two complaints per sector, which includes
among others complaints on toys, patent and employment services, products for adults, lifestyle service websites.

Annual Cross-Border Complaints Report 2016
© European Advertising Standards Alliance 18
8 Speed of the Resolution of Complaints
The speed of complaint resolution varies depending on the complexity of a case. Simple cases
can be resolved in as little as two days, whereas more complex cases may take longer. If scientific
substantiation of advertising claims is required, complaints may lead to a prolonged investigation.
As cross-border complaints are handled by two SROs and often a translation is necessary which
might considerably extend the complaint handling.
In 2016, SROs resolved 79 (54.4%) cross-border complaints received in less than two months
and additional 22 complaints (15.1%) within 2 and 3 months. Additionally, 26 (17.9%) more
complaints were resolved with half a year.
Overall. 18 complaints (12.4%) required longer than six months of investigation period longer.
These complaints This complaint was lodged by an Irish consumer regarding an online
advertisement for a Polish tech company offering smart home automation systems. The
complainant objected to the fact that all the products advertised wireless update of devices, along
with other features, which was not the case in reality.
Figure 11: Speed of cross-border complaint resolution in 2016
Source: Annual Cross-Border Complaints Report 2016
Less than 2 months; 79; 54,5%
2-3 months; 22; 15,2%
3-6 months; 26; 17,9%6-9 months; 10;
6,9%
More than 9 months; 8; 5,5%

Annual Cross-Border Complaints Report 2016
© European Advertising Standards Alliance 19
Annex A: How the Cross-Border Complaints (CBC) System Works
EASA's Cross-Border Complaints System
EASA's Cross-Border Complaints (CBC) system has been in operation since 1992. With the increase of media travelling across borders, the CBC system was established to provide people who wished to make complaints against advertising featured in media or by advertisers originating from outside their home territory with the same redress available to consumers within the country of origin of the media or advertiser. Since 1992, EASA has coordinated nearly 3.000 cross-border complaints.
The Basic Principles of the EASA Cross-Border Complaints System
The first principle is the ‘country of origin’, a concept enshrined in EU law to facilitate the growth of the Single Market. With regards to the CBC system, an advertisement must abide by the rules of the country where the media is based that features the advertisement. In the case of direct marketing or Digital Marketing Communications, however, the advertisement will generally be expected to follow the rules of the country where the advertiser is based, whereas in the case of Online Behavioural Advertising, the country of origin of the company will be based on the principal decision-making presence (office). The second principle is ‘mutual recognition’. By this principle, EASA members agree to accept advertisements which comply with the self-regulatory rules in the country of origin of the media or advertiser, even if those rules are not identical to their own.
The Competent Body
Once the advertisement’s 'country of origin' has been established, the complaint will be assigned to the local self-regulatory organisation (SRO). It is not possible to assign a complaint to more than one SRO.
Dealing with a Cross-Border Complaint
The complainant may not initially realise that his or her complaint lies outside the competence of his or her national SRO. Hence, the complainant’s first point of contact may be the local SRO. Once the SRO ascertains that a complaint is in fact a cross-border issue, it will first inform the complainant of the Cross-Border Complaints system and the measures that will be taken to handle the complaint. The complaint, along with any other relevant details, is then passed on to the relevant self-regulatory organisation (SRO) present in the country of origin of the media or the advertiser under investigation. The EASA Secretariat is included in all correspondence related to the case and will closely monitor its progress. Further, EASA may become involved in the process by, for instance, recommending the SRO to take certain actions, involving industry bodies where appropriate, and reporting on the outcome of cases once they have been closed.
Ad-Alerts
If an ad shows evidence of deliberate unethical, dishonest or criminal activity, the SRO will transfer the complaint to the relevant government authorities. In these circumstances, the EASA Secretariat may, after discussion with members involved, decide to issue an Ad-Alert, which notifies concerned parties of the advertisers' activities. Ad alerts are published on the EASA website: www.easa-alliance.org.
Publications
Closed cross-border complaints are reported quarterly and annually in CBC Reports, published on the EASA website: www.easa-alliance.org.

Annual Cross-Border Complaints Report 2016
© European Advertising Standards Alliance 20
Notes

Annual Cross-Border Complaints Report 2016
© European Advertising Standards Alliance 21
Notes

Annual Cross-Border Complaints Report 2016
© European Advertising Standards Alliance 22
Notes