Embed Size (px)
Citation preview

Earth’s Climate: Old Problems, New Thoughts
Elizabeth K. Thomas, Brown University
Sujit Datta, Harvard University
Atreyee Bhattacharya, Harvard University
Roadmap for the evening
1. Background & long-term perspective
2. Potential solution
3. Other factors

Higher Emissions Scenario, 2080-
2099
The bottom
line…
climatecommunication.org
Number of Days
<10 20 30 45 60 75 90 105 >120
Number of days over
100°F
Recent Past, 1961-
1979
Lower Emissions Scenario, 2080-
2099
Global Climate Change A geologist’s perspective
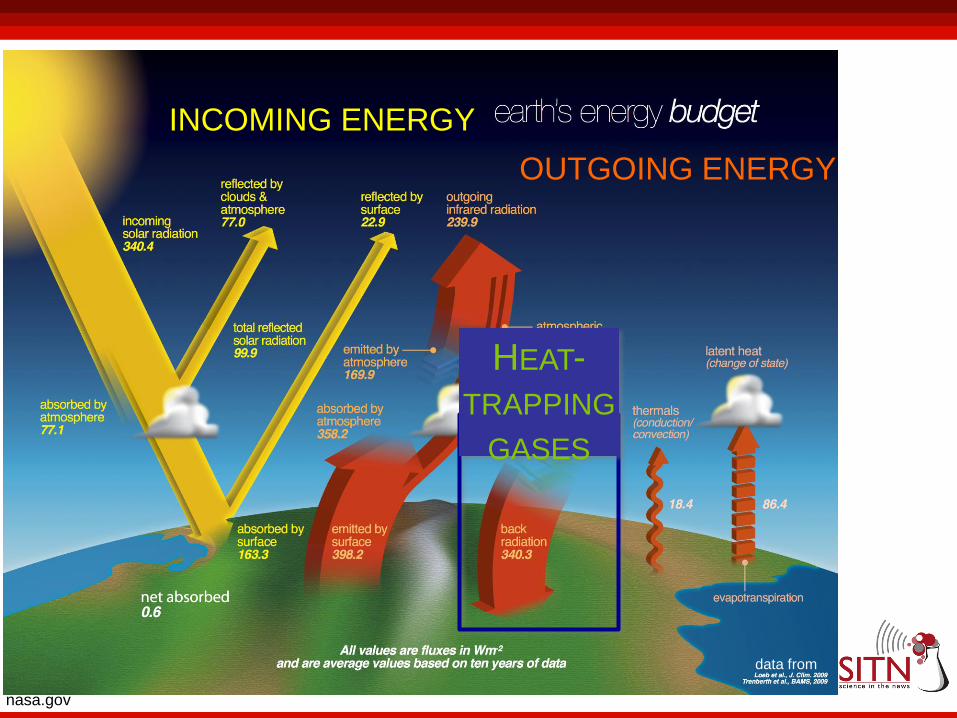
• Earth’s energy budget
• Greenhouse gases influence
Earth’s energy budget
• Paleoclimate
• Climate change today
Heat-trapping gases
Global Climate Change A geologist’s perspective
• Earth’s energy budget
• Heat-trapping gases influence
Earth’s energy budget
• Paleoclimate
• Climate change today
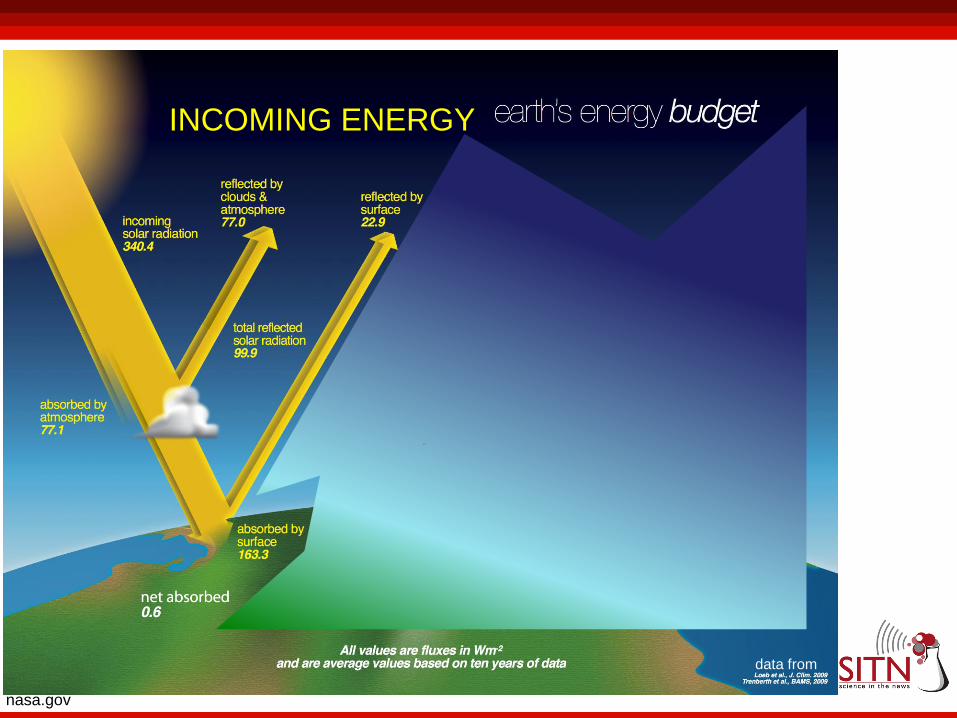
data from
INCOMING ENERGY
nasa.gov
nasa.gov
data from
OUTGOING ENERGY
INCOMING ENERGY
HEAT-
TRAPPING
GASES
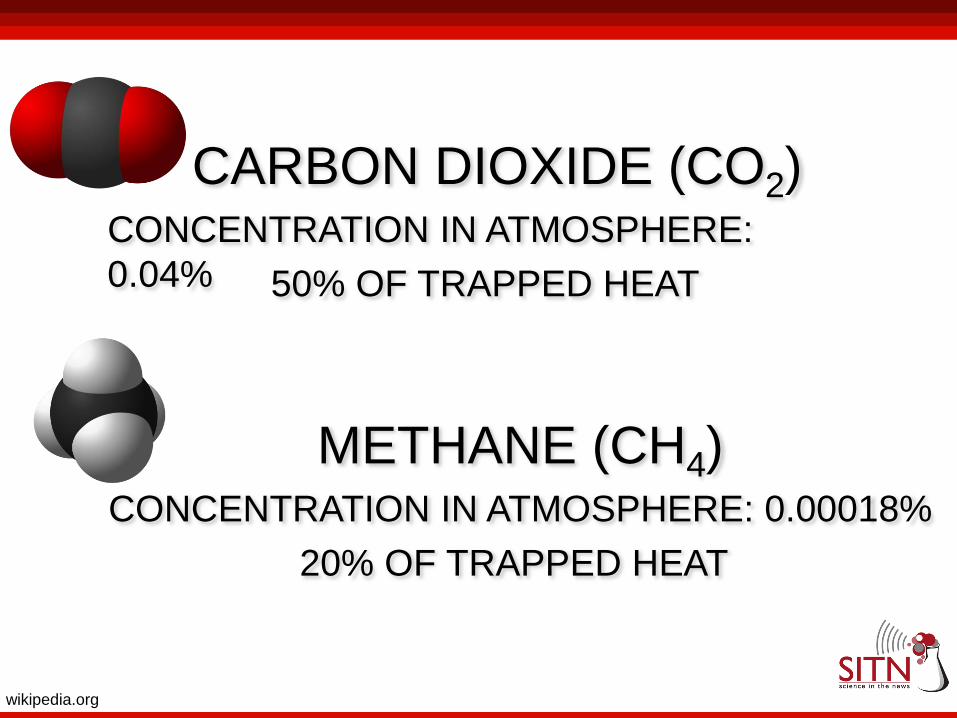
50% OF TRAPPED HEAT
CARBON DIOXIDE (CO2) CONCENTRATION IN ATMOSPHERE:
0.04%
20% OF TRAPPED HEAT
METHANE (CH4) CONCENTRATION IN ATMOSPHERE: 0.00018%
wikipedia.org

Questions about
Earth’s energy budget?

Global Climate Change A geologist’s perspective
• Earth’s energy budget
• Heat-trapping gases influence
Earth’s energy budget
• Paleoclimate
• Climate change today
Paleoclimatologists
Study Past Climate

200
220
240
280
260
ppm
v C
O2
400
500
600
700
ppbv C
H4
Age (thousands of years before present)
400 350 300 250 200 150 100 50 0
research.gov; Petit et al. 1999
ICE CORES: MEASUREMENTS OF FOSSIL AIR!

200
220
240
280
260
ppm
v C
O2
400
500
600
700
ppbv C
H4
Age (thousands of years before present)
400 350 300 250 200 150 100 50 0
-7.2
-3.6
0
7.2
3.6
-10.8
-14.4
Tem
pera
ture
rela
tive to
today (°
F)
research.gov; Petit et al. 1999
WHICH CAME FIRST,
INCREASES OF HEAT-
TRAPPING GASES OR
WARMING?
ICE CORES: MEASUREMENTS OF FOSSIL AIR!

Shakun et al. 2012, reprinted with permission from Nature Publishing Group
HEAT-TRAPPING
GASES!
Antarctic Temp.
Global Temp. -1.8
-3
.6
-5.4
-7
.2
0
Glo
bal te
mpera
ture
(°F
)
Age (thousands of years before present)
Anta
rctic
tem
pera
ture
(rela
tive c
hange)
Questions about
past climate?

Global Climate Change A geologist’s perspective
• Earth’s energy budget
• Heat-trapping gases influence
Earth’s energy budget
• Paleoclimate
• Climate change today

HEAT-TRAPPING GASES TODAY:
A GEOLOGIST’S PERSPECTIVE
Petit et al. 1999
200
220
240
280
260
ppm
v C
O2
Age (thousands of years before present)
400 350 300 250 200 150 100 50 0
-4
-2
0
4
2
Infe
rred te
mpera
ture
(°C
)
-6
-8
-7.2
-3.6
0
7.2
3.6
Tem
pera
ture
rela
tive to
today (°
F)
-10.8
-14.4
1.5x 2.5x
400
500
600
700
ppbv C
H4
Where do these heat-trapping
gases come from?

Jack Foley, epa.gov, wikipedia.org
Brayton Point coal-fired power plant, Fall River, MA

HEAT-TRAPPING GASES TODAY:
A GEOLOGIST’S PERSPECTIVE
Petit et al. 1999
200
220
240
280
260
ppm
v C
O2
Age (thousands of years before present)
400 350 300 250 200 150 100 50 0
-4
-2
0
4
2
Infe
rred te
mpera
ture
(°C
)
-6
-8
-7.2
-3.6
0
7.2
3.6
Tem
pera
ture
rela
tive to
today (°
F)
-10.8
-14.4
1.5x 2.5x
400
500
600
700
ppbv C
H4
When was the last time that
heat-trapping gas
concentrations were so high?
wikipedia.org
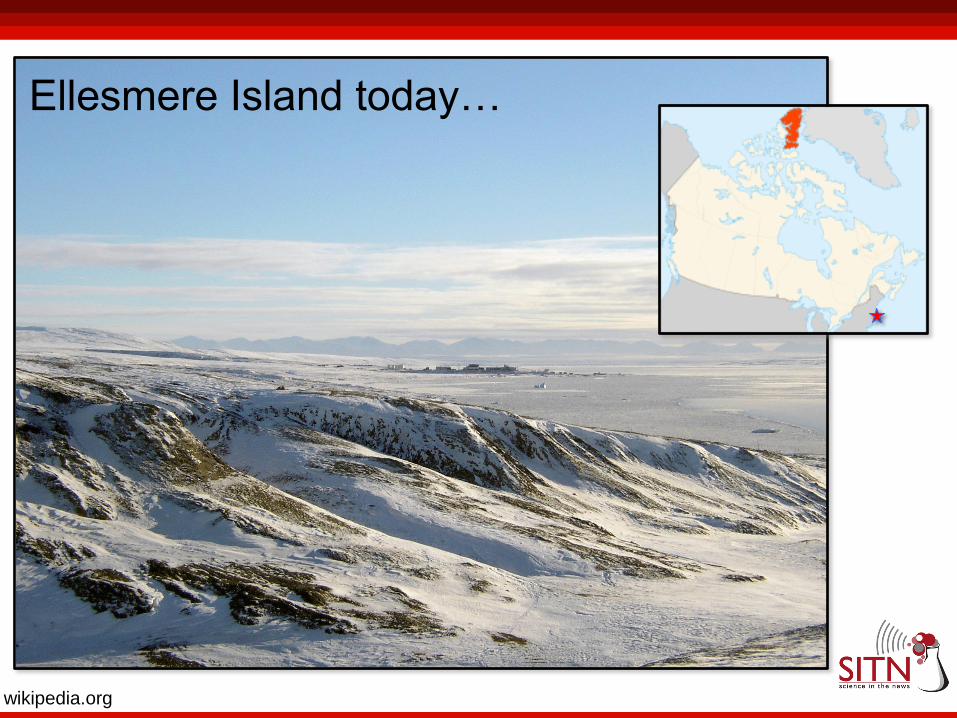
Ellesmere Island today…

reprinted with permission from the American Museum of Natural
History
Ellesmere Island during the Eocene
(50 million years ago)…

wikipedia.org; northeastclimateimpacts.org
HOW DOES THIS IMPACT CLIMATE HERE?
Massachusetts climate ‘migration’
Spring 2010 floods in Rhode Island
October 2011 snowstorm
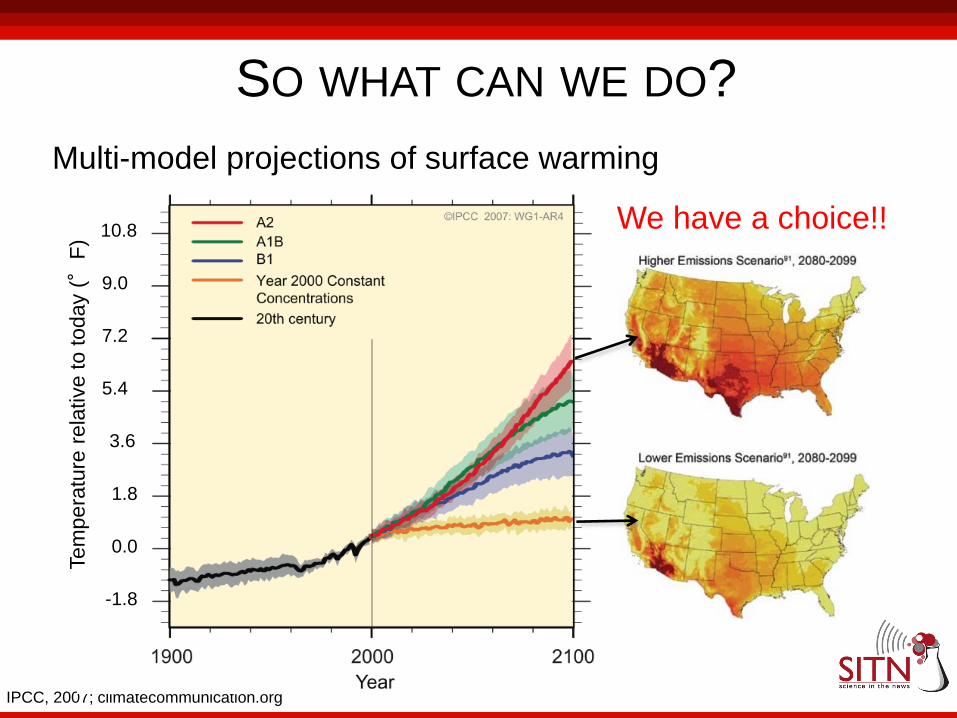
IPCC, 2007; climatecommunication.org
SO WHAT CAN WE DO?
We have a choice!!
Multi-model projections of surface warming
1.8
3.6
5.4
9.0
7.2
Tem
pera
ture
rela
tive to t
oday (°
F)
0.0
-1.8
10.8

References cited Christensen JH, et al. (2007) Regional Climate Projections. Climate Change
2007: The Physical Science Basis. Contribution of Working Group I to the
Fourth Assessment Report of the IPCC, Solomon S, et al., Eds.
Cambridge University Press, Cambridge UK.
IPCC (2007) Summary for Policymakers. In: Climate Change 2007: The
Physical Science Basis. Contribution of Working Group I to the Fourth
Assessment Report of the Intergovernmental Panel on Climate Change,
Solomon, S. et al., Eds. Cambridge University Press, Cambridge, UK.
Petit JR, et al. (1999) Climate and atmospheric history of the past 420,000
years from the Vostok ice core, Antarctica. Nature 399: 429-236.
Shakun JD, et al. (2012) Global warming preceded by increasing carbon
dioxide concentrations during the last deglaciation. Nature 484: 49-55.
Most data are publicly available at http://www.ncdc.noaa.gov/paleo
THANK YOU!
QUESTIONS?

Reducing CO2 Emissions
By Pumping Them Underground
Sujit S. Datta, Harvard University

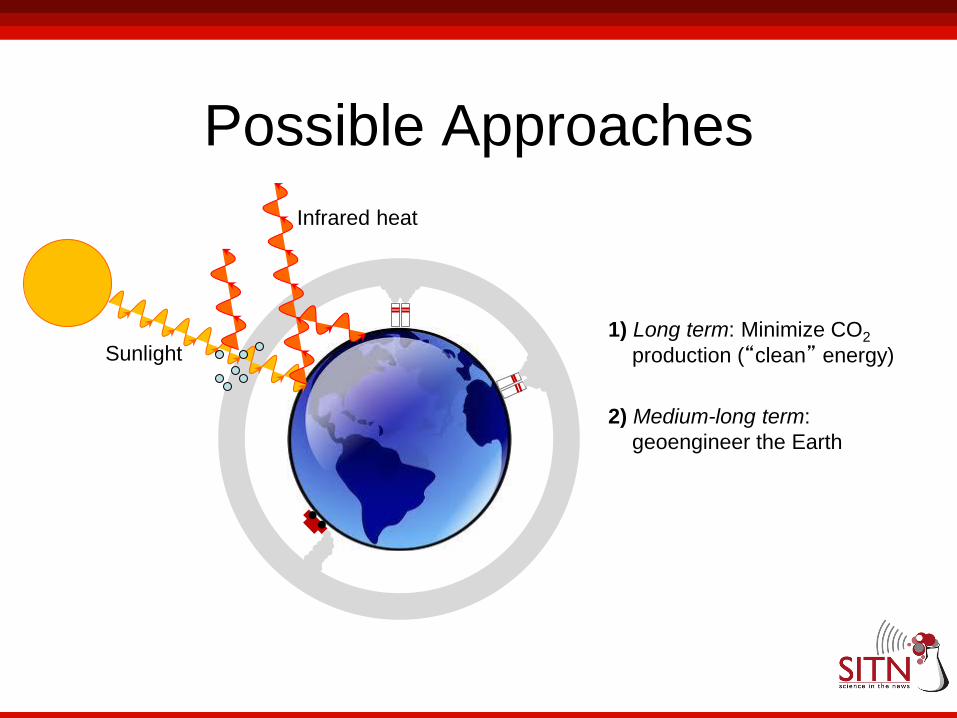
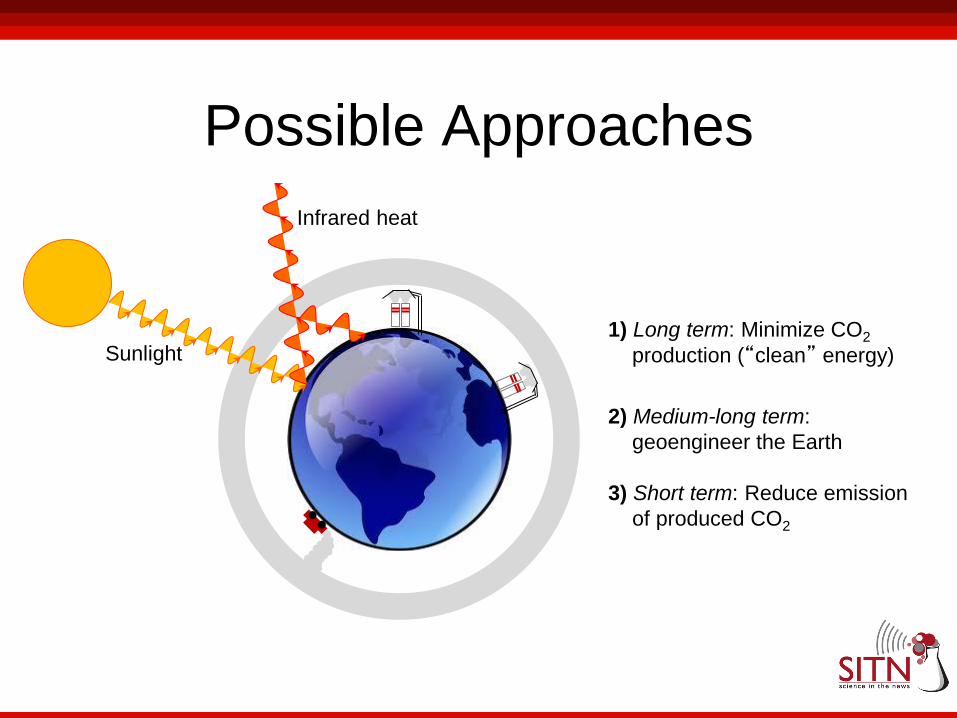
Possible Approaches
Sunlight
Infrared heat

Possible Approaches
1) Long term: Minimize CO2
production (“clean” energy)
Sunlight
Infrared heat
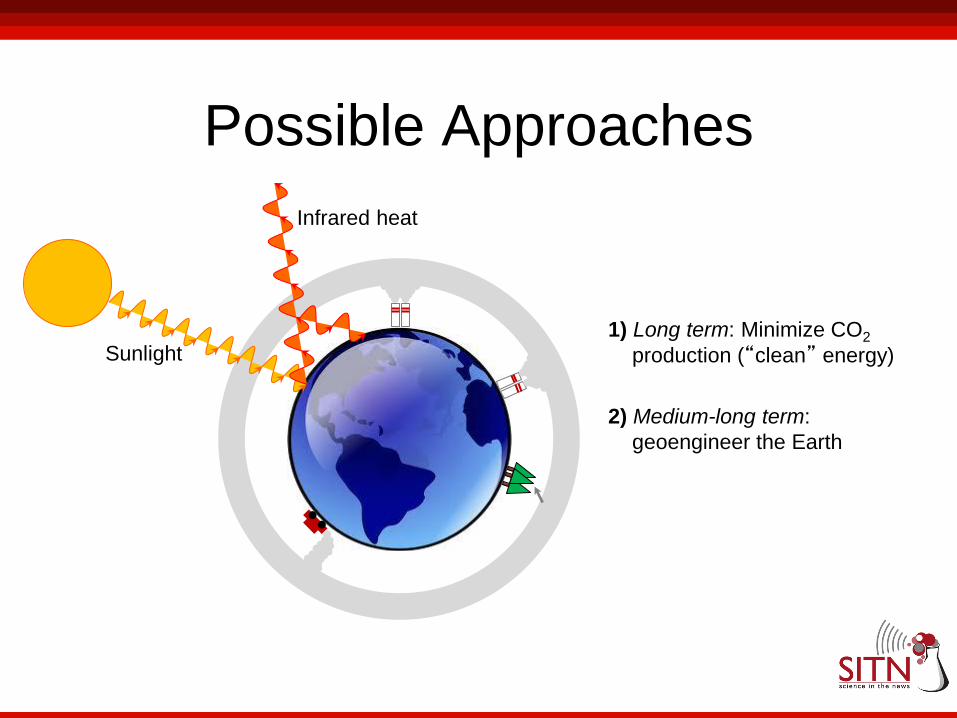
Possible Approaches
1) Long term: Minimize CO2
production (“clean” energy)
2) Medium-long term:
geoengineer the Earth
Sunlight
Infrared heat
Possible Approaches
1) Long term: Minimize CO2
production (“clean” energy)
2) Medium-long term:
geoengineer the Earth
Sunlight
Infrared heat
Possible Approaches
1) Long term: Minimize CO2
production (“clean” energy)
2) Medium-long term:
geoengineer the Earth
3) Short term: Reduce emission
of produced CO2
Sunlight
Infrared heat
Outline for this Segment
• Storing CO2 underground:
Why would you dream of such a thing?
• Ways in which CO2 can be stored
• Current state of the art

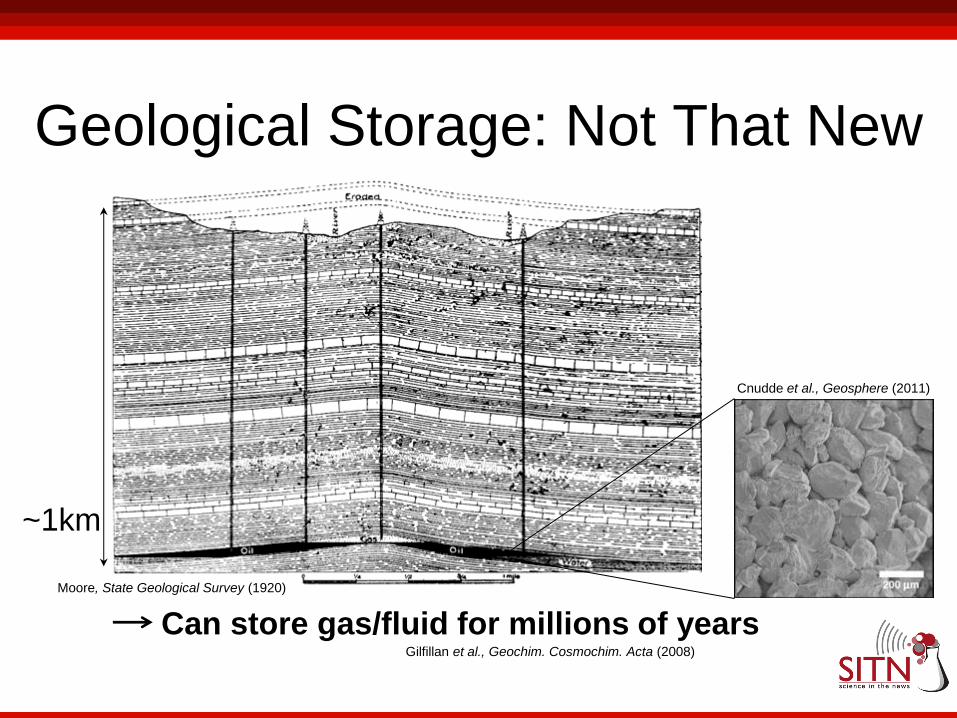
Geological Storage: Not That New
~1km
Can store gas/fluid for millions of years Gilfillan et al., Geochim. Cosmochim. Acta (2008)
Moore, State Geological Survey (1920)
Geological Storage: Not That New
~1km
Cnudde et al., Geosphere (2011)
Can store gas/fluid for millions of years Gilfillan et al., Geochim. Cosmochim. Acta (2008)
Moore, State Geological Survey (1920)

Geological Storage: Not That New
~1km
Cnudde et al., Geosphere (2011)
Can store gas/fluid for millions of years Gilfillan et al., Geochim. Cosmochim. Acta (2008)
Moore, State Geological Survey (1920)
Caprock
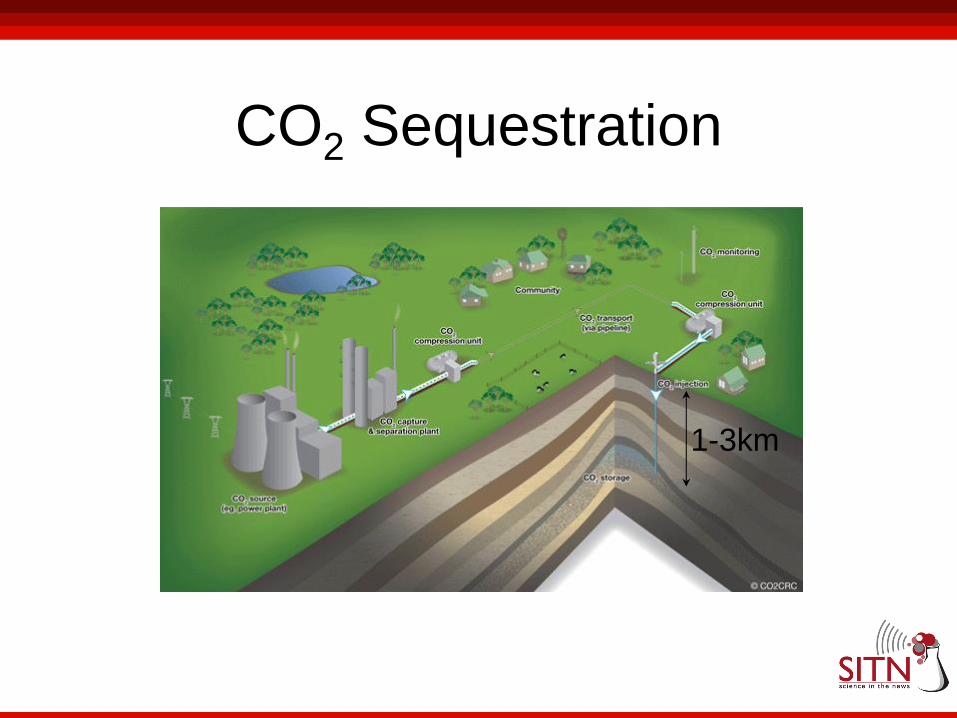
CO2 Sequestration
1-3km

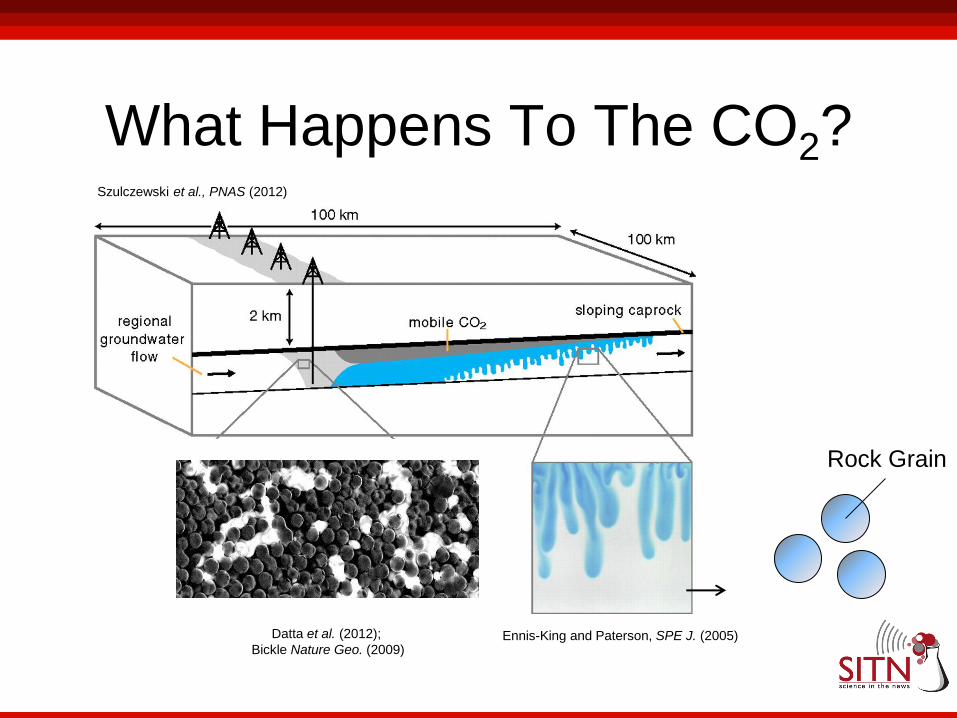
What Happens To The CO2? Szulczewski et al., PNAS (2012)

What Happens To The CO2?
Datta et al. (2012);
Bickle Nature Geo. (2009)
Szulczewski et al., PNAS (2012)

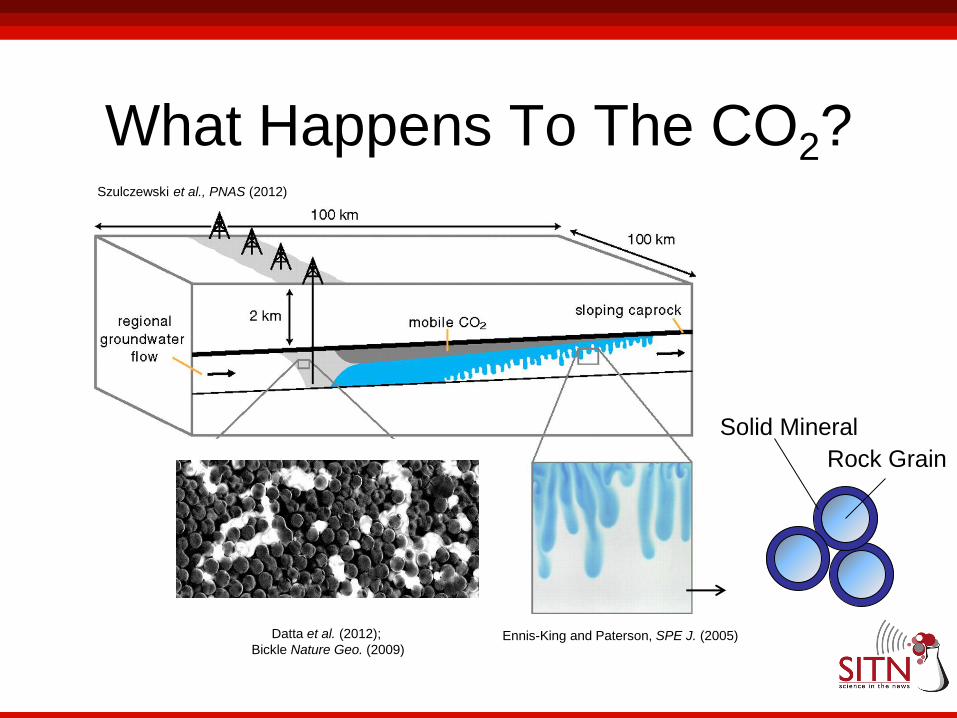
What Happens To The CO2?
Ennis-King and Paterson, SPE J. (2005)
Szulczewski et al., PNAS (2012)
Datta et al. (2012);
Bickle Nature Geo. (2009)
What Happens To The CO2?
Ennis-King and Paterson, SPE J. (2005)
Szulczewski et al., PNAS (2012)
Datta et al. (2012);
Bickle Nature Geo. (2009)
Rock Grain
What Happens To The CO2?
Ennis-King and Paterson, SPE J. (2005)
Szulczewski et al., PNAS (2012)
Datta et al. (2012);
Bickle Nature Geo. (2009)
Rock Grain
Solid Mineral
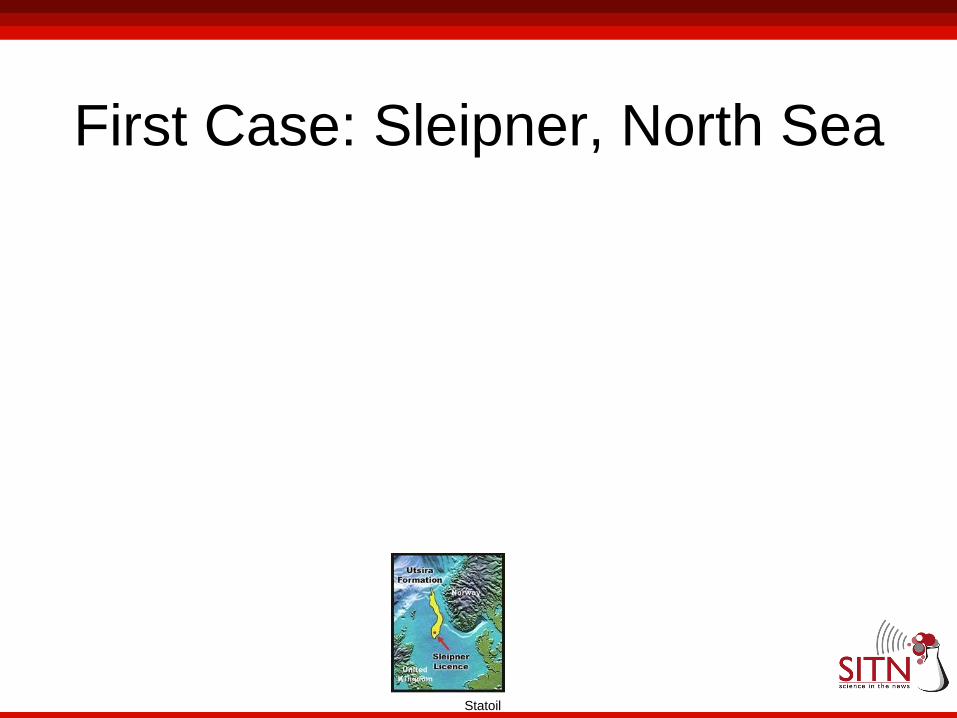
First Case: Sleipner, North Sea
Statoil
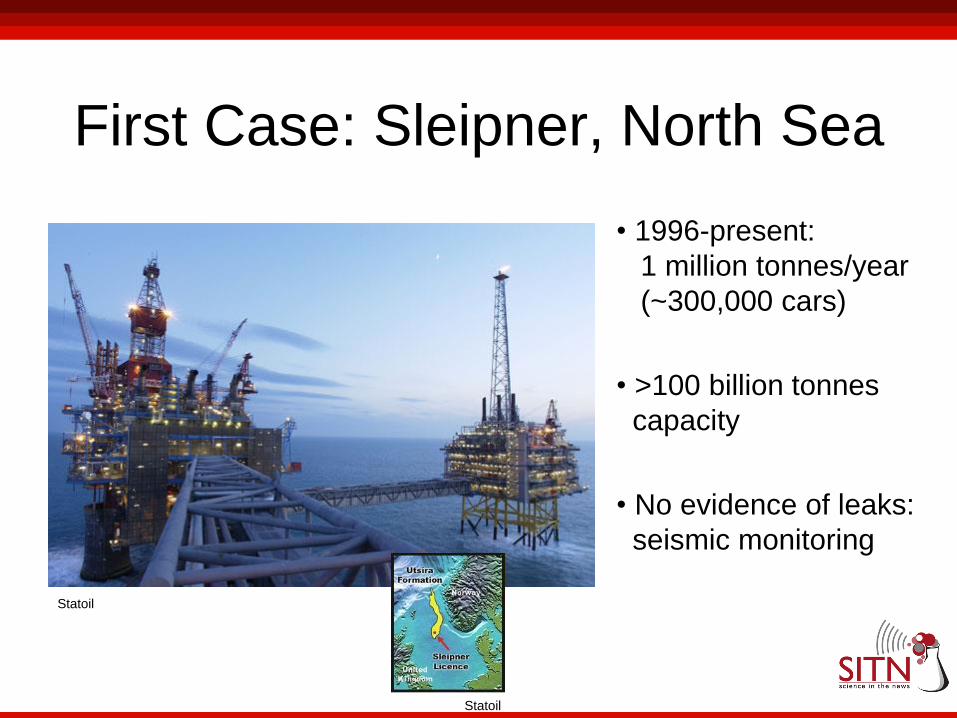
First Case: Sleipner, North Sea
• 1996-present:
1 million tonnes/year
(~300,000 cars)
• >100 billion tonnes
capacity
• No evidence of leaks:
seismic monitoring
Statoil
Statoil
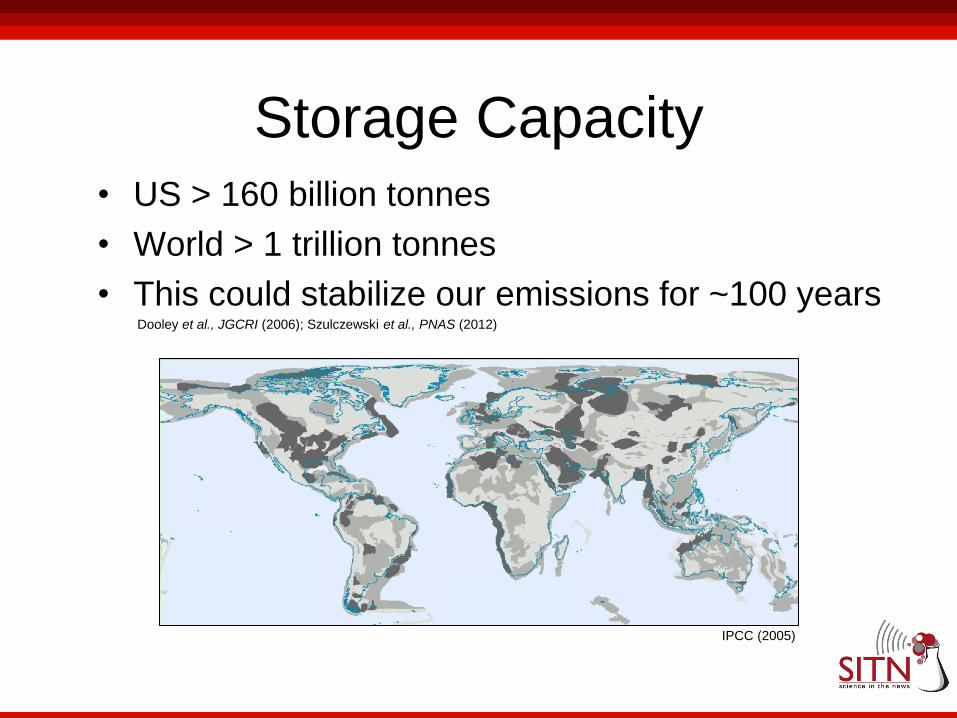
Storage Capacity • US > 160 billion tonnes
• World > 1 trillion tonnes
• This could stabilize our emissions for ~100 years
Dooley et al., JGCRI (2006); Szulczewski et al., PNAS (2012)
IPCC (2005)
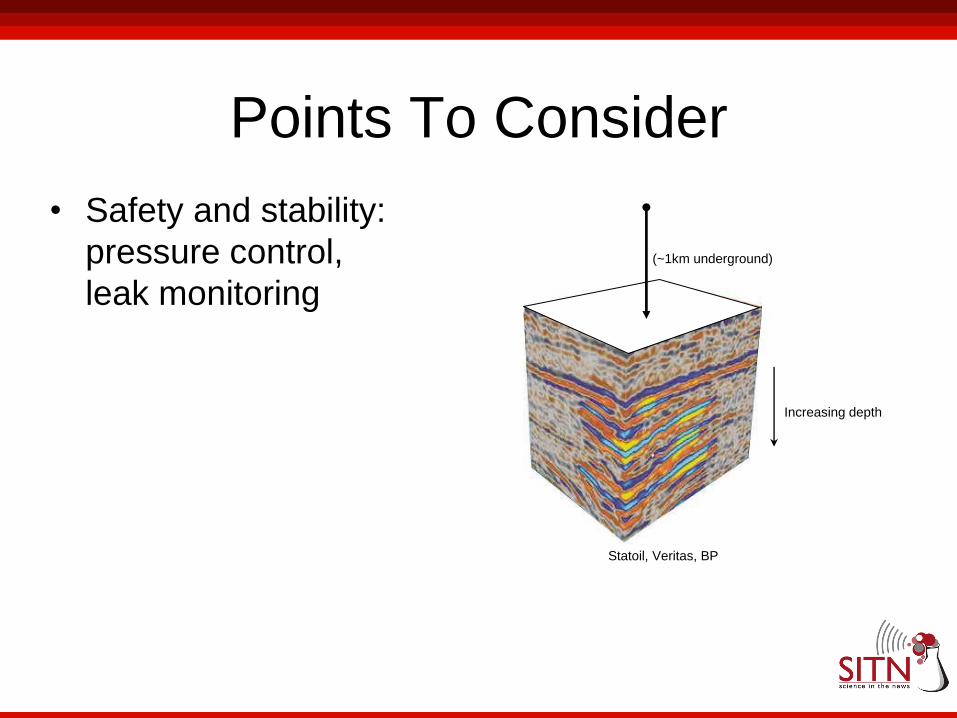
• Safety and stability:
pressure control,
leak monitoring
Statoil, Veritas, BP
(~1km underground)
Increasing depth
Points To Consider

• Safety and stability:
pressure control,
leak monitoring
• Economics:
capture to injection
= $45-170/tonne
Statoil, Veritas, BP
(~1km underground)
Increasing depth
Points To Consider

• Safety and stability:
pressure control,
leak monitoring
• Economics:
capture to injection
= $45-170/tonne
• Energy use: can be 25%
of a plant’s output!
Statoil, Veritas, BP
(~1km underground)
Increasing depth
Points To Consider

Overview
• Greenhouse gas emissions
can drive climate change
• Some of these emissions
can be stored underground
• But this isn’t the whole story! Dust…

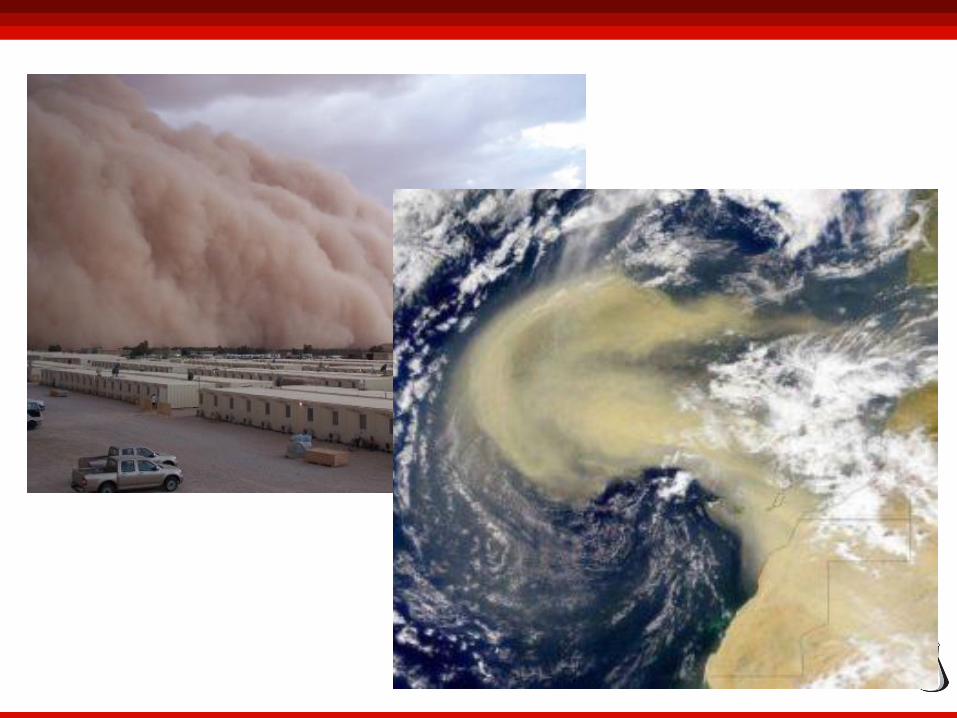
1.Desert dust as tracers of climate change
2. Dust as drivers of climate change.
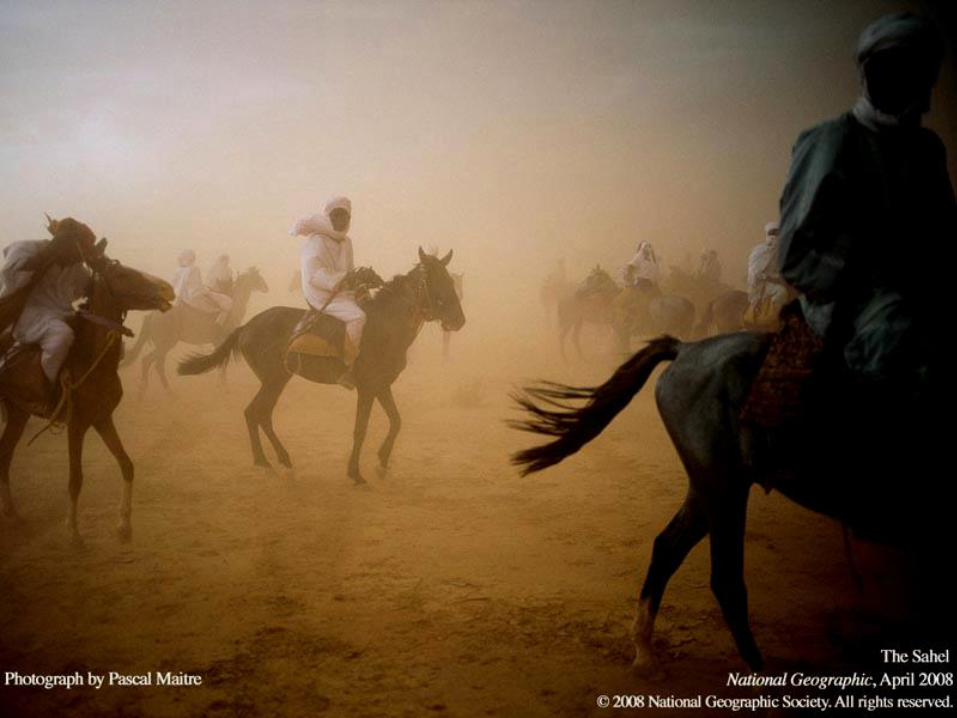
A case study in North African Sahel
Droughts –the ‘creeping disaster’
Atreyee Bhattacharya
Outline for the talk
and desert dust

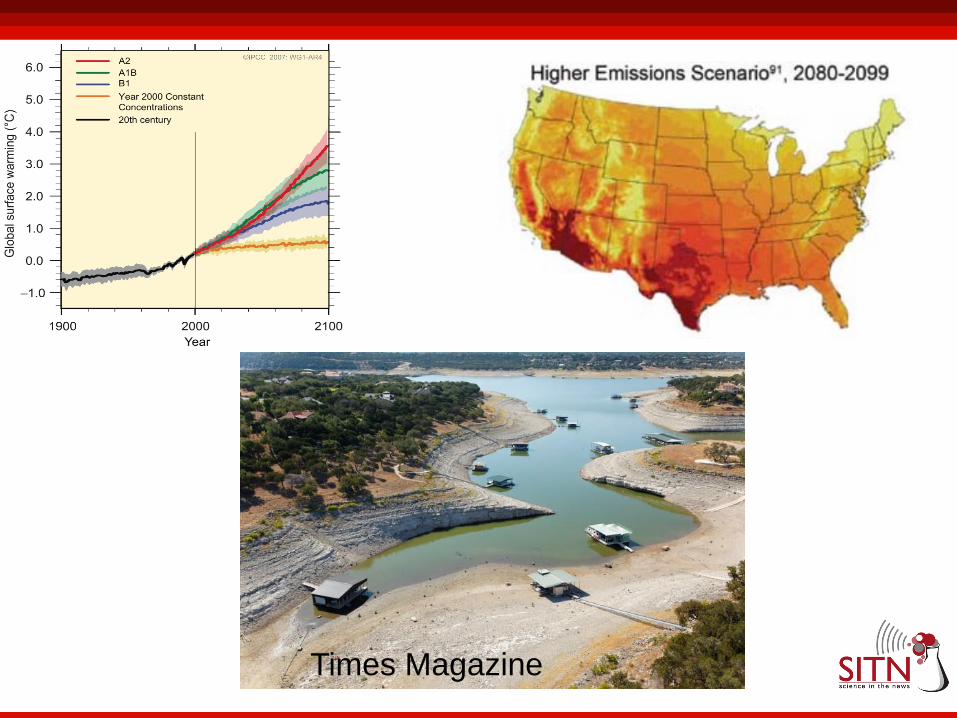
Times Magazine

Dry farm lands in southern Australia
Dry lake beds in southwestern China
Times Magazine
Times Magazine
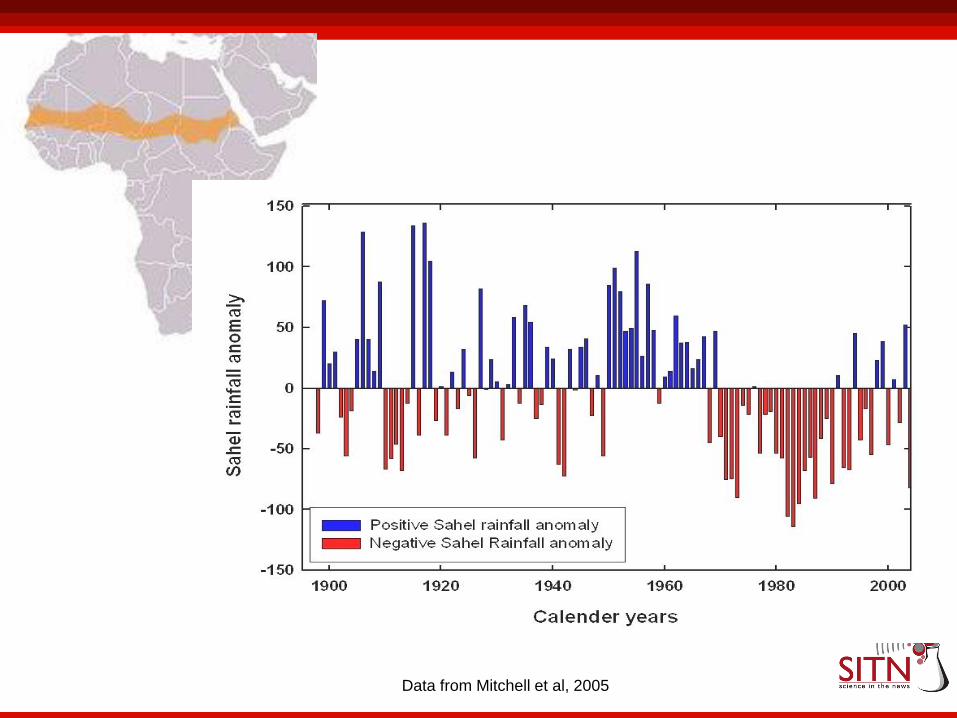
Data from Mitchell et al, 2005

NY Times
NY Times
PBS News

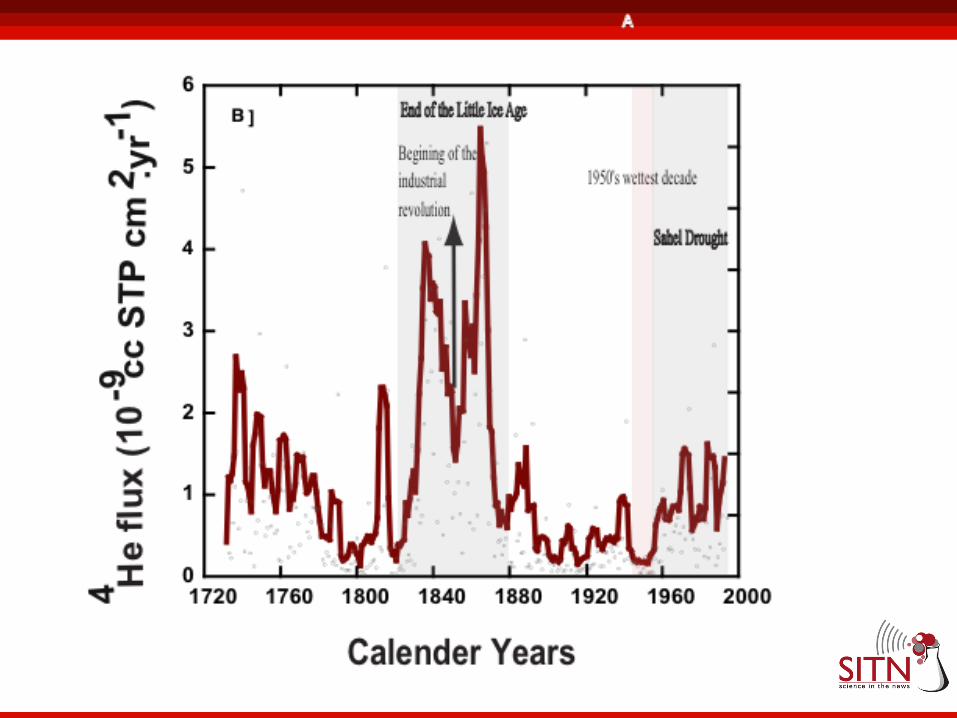
Sahel
Drought
Medieval
climate
anomaly
Dark
Ages
Little
Ice
Age
Russell and Johnson, 2007
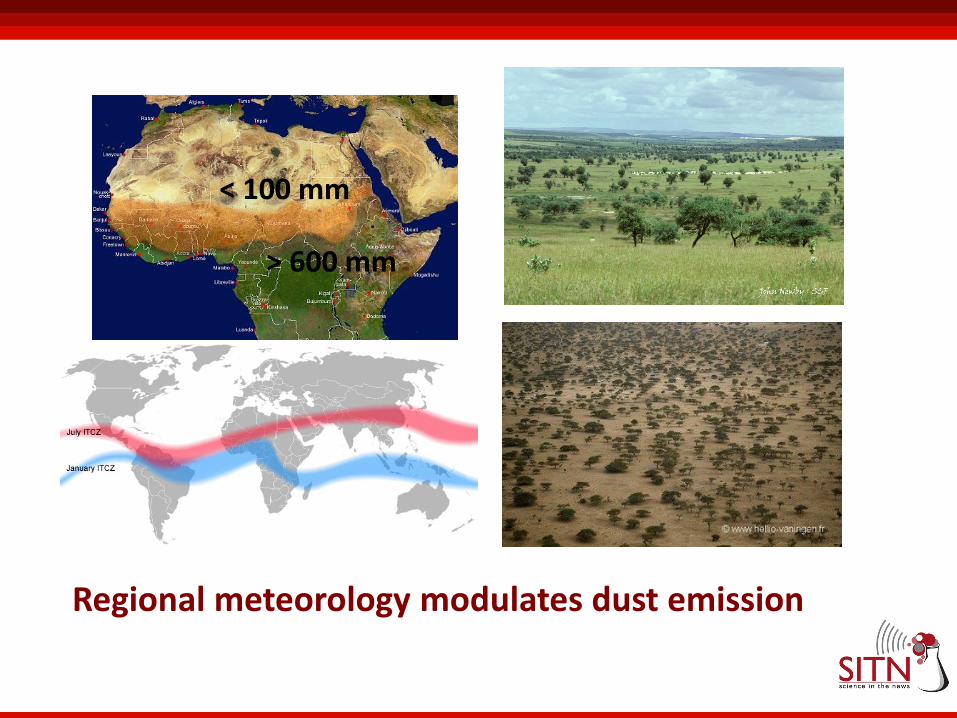
< 100 mm
> 600 mm
Regional meteorology modulates dust emission
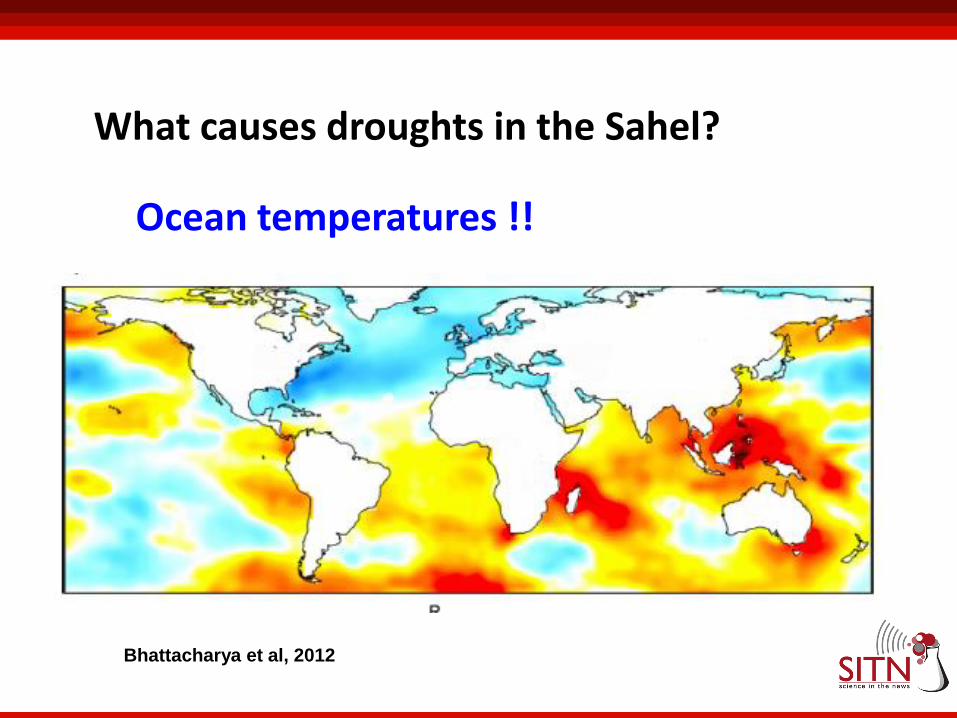
What causes droughts in the Sahel?
Ocean temperatures !!
Bhattacharya et al, 2012

Cape Verde
Mukhopadhyay and Kreycik, 2008

Barnard et al , Nature 1974 Corals as novel dust archives

Bhattacharya et al, 2012

Sahel
Drought
Medieval
climate
anomaly
Dark
Ages
Little
Ice
Age
Russell and Johnson, 2007

Ocean circulation
Ice sheet extent
Salinity
Atmospheric dust

data from
Dust transport from North Africa (illustration adapted from
Garrison et al., 2003)
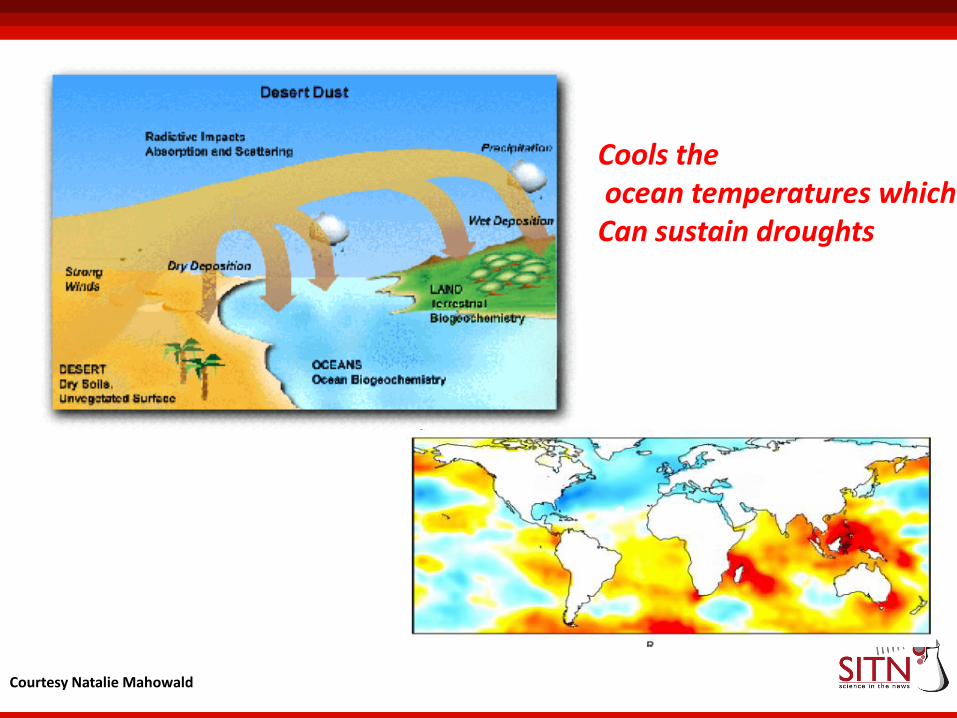
Courtesy Natalie Mahowald data from
Cools the ocean temperatures which Can sustain droughts

Natural causes
• Ocean temperatures
• Land temperatures
• Rain belt movement
Anthropogenic Impact
• Land degradation
• Overgrazing
• Loss of forest canopy

Heat trapping gases in the atmosphere has increased beyond anything natural over the last 400,000 years Migration of weather patterns and more severe weathers Dust in the atmosphere is a tracer for past droughts BUT can also have prolonged the late 20th century Sahel Drought. Geo engineering techniques may help although they are still cost prohibitive
Conclusions
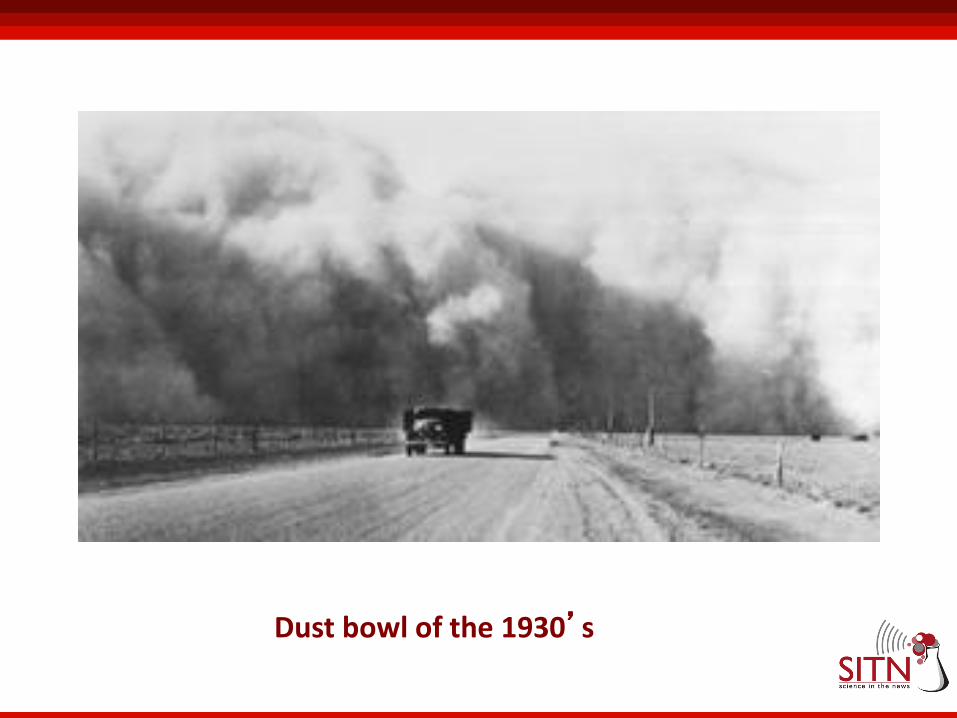
Dust bowl of the 1930’s
Sujoy Mukhopadhyay, Daniel P Schrag, Adam Maloof, Natalie Mahowald, Earle S William References: Barnard et al., 1974, Nature Bhattcharya et al., 2012, In revision Nature (PhD thesis) Bhattcharya et al., 2012, (PhD thesis) Mukhopadhyay and Kryechik, 2009 GRL Prospero and Lamb, Science 2003 Russell and Johnson 2007, Geology Shanahan et al., 2009 Nature
Acknowledgements