Embed Size (px)
Citation preview

Earth’s Climate: Past, Present and Future and reasons for concern
Fall Term - OLLI West: week 1, 9/15/2015Paul Belanger, Ph.D.
Geologist/Paleoclimatologist
• Introductions• Key principles of climate change• The difference between weather and climate• Climate system: feedbacks, cycles and self-regulation (climate, not
government)• What determines Earth’s climate

Intro:
• Intro: • my background, • web page
http://denverclimatestudygroup.com/ (OLLI tab) and
• CV (about tab)• Logistics• Maryann Mark: classroom assistant, liaison
to me/OLLI

Intro:
Going to:• web page: http
://denverclimatestudygroup.com/

“In this age of specialization, men who thoroughly know one field are
often incompetent to discuss another. . . . You must not fool yourself--and you are the easiest
person to fool”Richard Feynman, 1974
My comment:
We’ve become a country of self-proclaimed experts on everything.

Three books to consider:
• Simple succinct Summary:– What We Know About Climate Change (Boston Revie
w Books) by Kerry Emanuel (Nov 30, 2012)
• Intermediate Level Book: – Earth: The Operators' Manual by Richard B. Alley (Apr
18, 2011)–
http://earththeoperatorsmanual.com/ • More comprehensive book:
Experimenting on a Small Planet: A Scholarly Entertainment by William W. Hay (Dec 14, 2012)

Another book to consider:
• Economics:– Climate Shock; the economic consequence of a
hotter planet– by Gernot Wagner & Martin Weitzman

• If you had a 10 percent chance of having a fatal car accident, you'd take necessary precautions. If your finances had a 10 percent chance of suffering a severe loss, you'd reevaluate your assets. So if we know the world is warming and there's a 10 percent chance this might eventually lead to a catastrophe beyond anything we could imagine, why aren't we doing more about climate change right now? We insure our lives against an uncertain future--why not our planet?
• In Climate Shock, Gernot Wagner and Martin Weitzman explore in lively, clear terms the likely repercussions of a hotter planet, drawing on and expanding from work previously unavailable to general audiences. …..

• Which led to my email quote from Kerry Emanuel and the need for a social paradigm shift:
• “…there are few, if any, historical examples of civilizations consciously making sacrifices on behalf of descendants two or more generations removed”

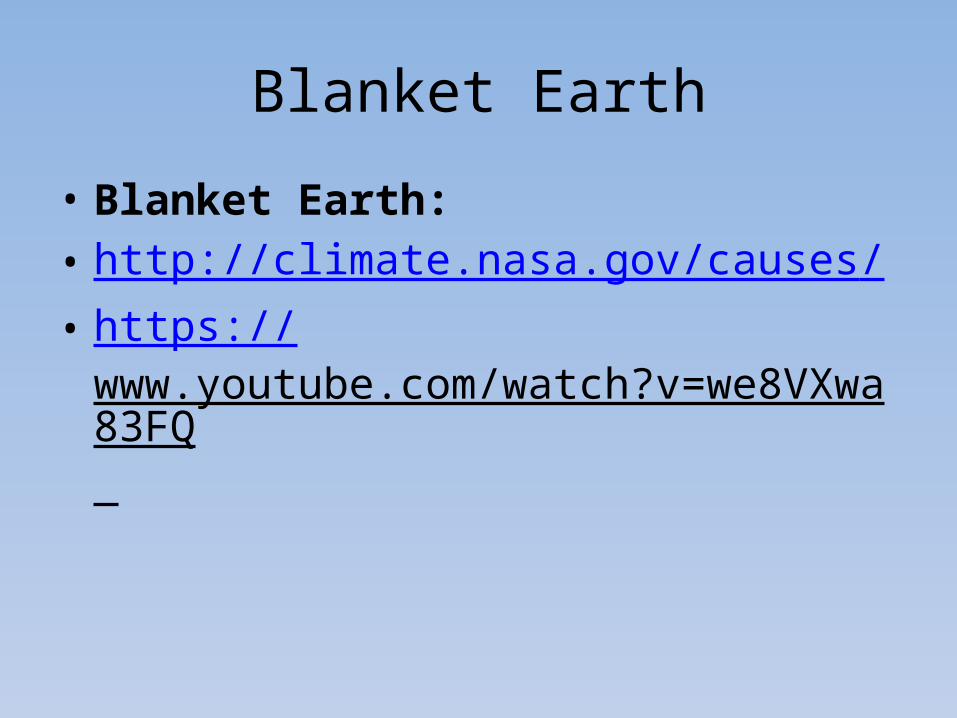
GREENHOUSE
• Visible vs. Infrared/longer wave – a function of “black body” temperature: instead of glass keeping the heat in it’s the gas properties keeping the heat of infrared in; blanket effect.

GREENHOUSE GASES
– Water – H2O – the amount is a feedback of temperature held in by the “blanket” of other GHGs
– Carbon dioxide - CO2
– Methane - CH4
– Ozone - O3
– Nitrous oxide- N2O– others
Blanket Earth
• Blanket Earth:• http://climate.nasa.gov/causes/• https://
www.youtube.com/watch?v=we8VXwa83FQ

VIDEO - what is climate
• https://www.futurelearn.com/courses/climate-change-challenges-and-solutions/todo/123
• And go to 1.4

What determines Earth’s climate

Obliquity Precession Eccentricity
INTRODUCTION: Definitions:• First order Forcings: EXTERNAL Influences (3):
SOLAR input:
0.9% less 100 My ago
Atmospheric Opacity (gases that absorb radiation in or out)
Albedo (30-85%)
• Feedbacks: INTERNAL dynamics and responses• e.g. higher water vapor in atm. due to heating of atm

Sunspots ~= 0.3 – 0.5 W/m2
CurrentGHGs ~= 1.6W/m2
Milankovitch ~= 3-8 W/m2
http://www.skepticalscience.com/Milankovitch.html
DOUBLING: 280 to 560 ppm CO2 =
~ 3 W/m2
Referred to as climate sensitivity

4: THE SUN’S ROLE IS MINIMIZING


Absorption of Radiation by Greenhouse GasesIncomingRadiation5700 K
OutgoingRadiation
289 K

3: EMISSIONS FROM HUMAN ACTIVITIES LARGELY TO BLAME
• 40% increase in CO2
• Dead carbon altering atmospheric C14
• That Carbon is more negative/enriched in C12

IPCC, 2007Incoming Solar irradiance: 342 W/m2
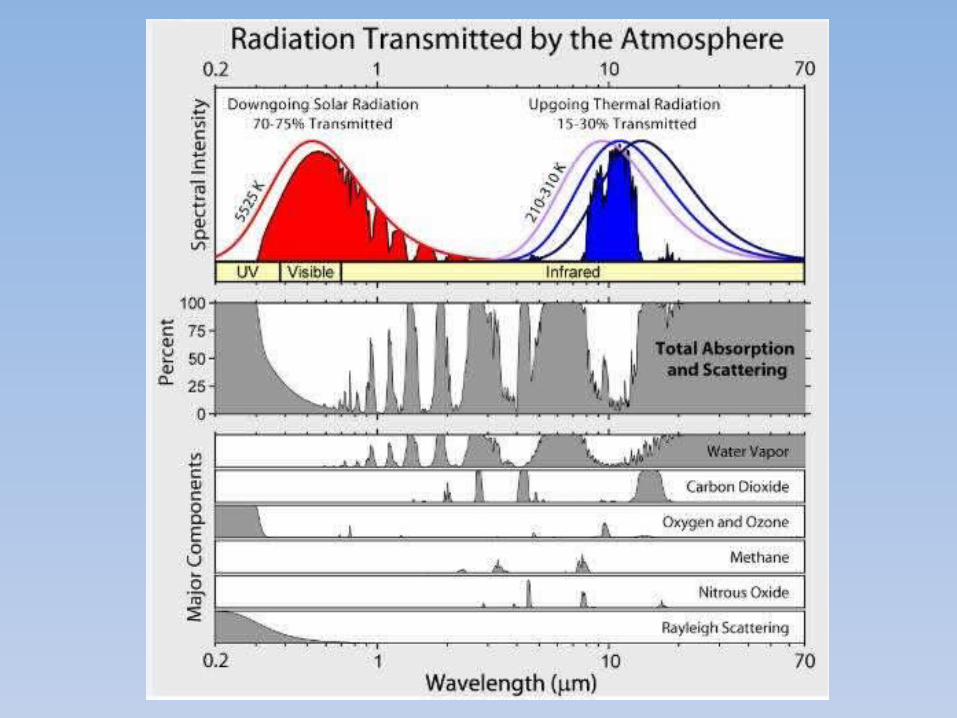
GLOBAL WARMING CONCERNS
• Drivers; aka forcings, i.e. causes1: THE CLIMATE IS WARMING


5: SURFACE TO STRATOSPHERE CHANGES

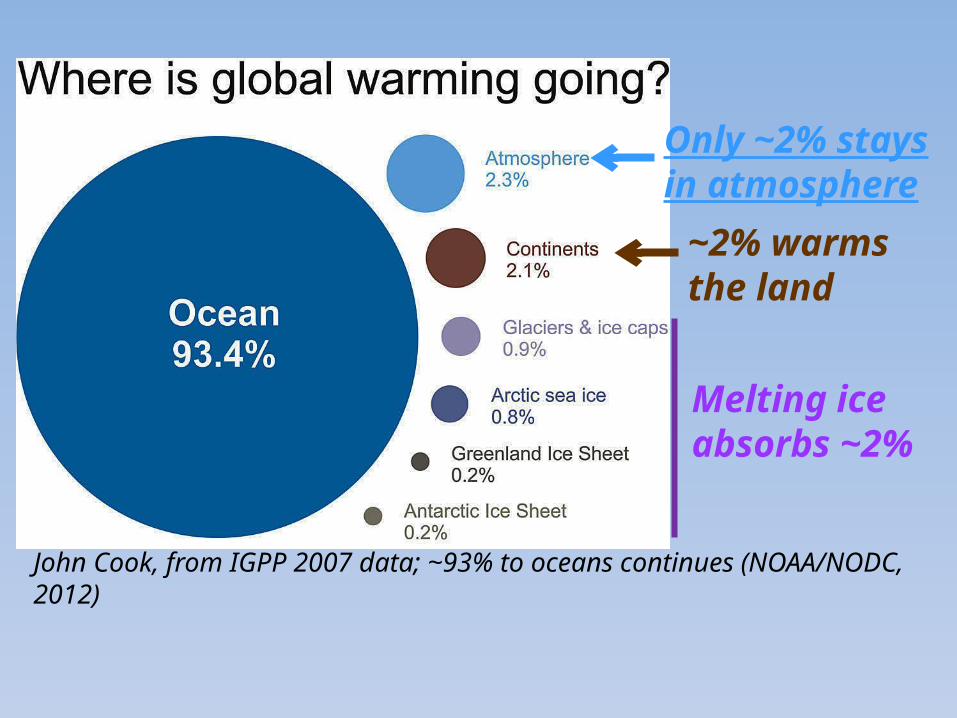
John Cook, from IGPP 2007 data; ~93% to oceans continues (NOAA/NODC, 2012)
Melting ice absorbs ~2%
Only ~2% stays in atmosphere
~2% warms the land
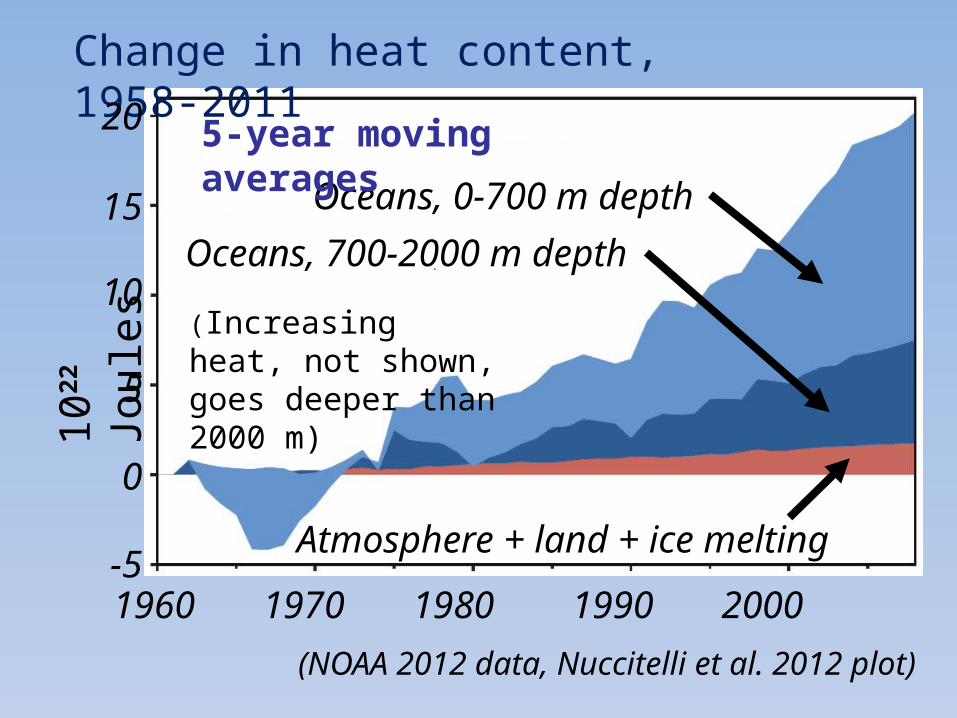
Oceans, 0-700 m depth
Oceans, 700-2000 m depth
Atmosphere + land + ice melting
Change in heat content, 1958-2011
20
15
10
5
0
-5
(NOAA 2012 data, Nuccitelli et al. 2012 plot)
5-year moving averages
1960 1970 1980 1990 2000
1022
Jou
les
(Increasing heat, not shown, goes deeper than 2000 m)

http://www.skepticalscience.com/graphics.php?g=47

El Niño
-4 -2 0 42Temperature Anomaly °C
The Pacific – ‘normal condition’
La Niña
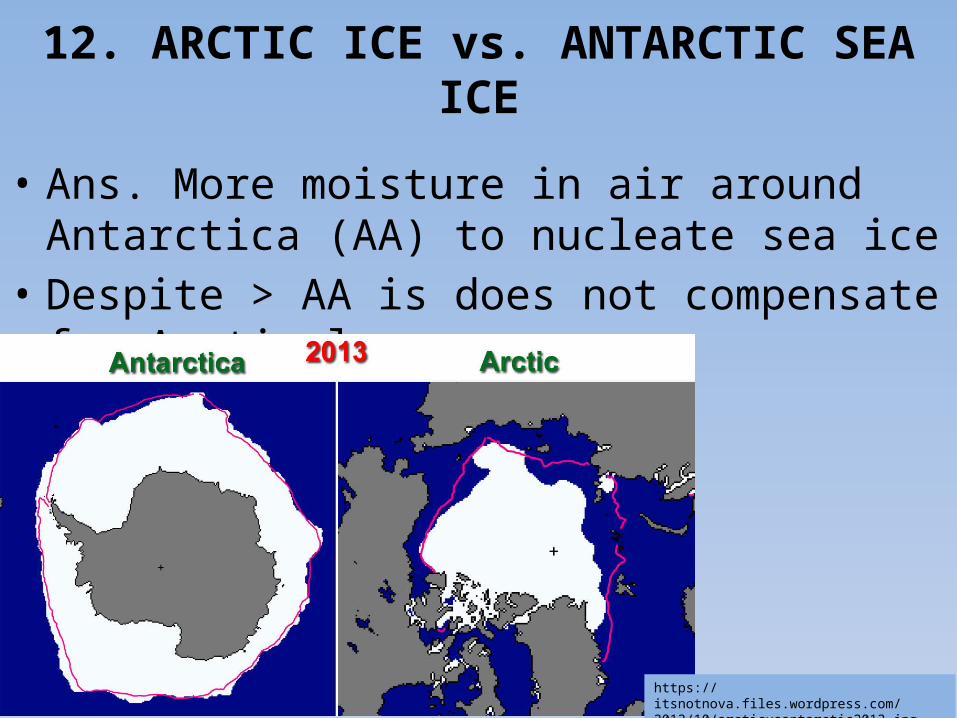
12. ARCTIC ICE vs. ANTARCTIC SEA ICE
• Ans. More moisture in air around Antarctica (AA) to nucleate sea ice
• Despite > AA is does not compensate for Arctic loss
https://itsnotnova.files.wordpress.com/2013/10/arcticvsantarctic2013.jpg
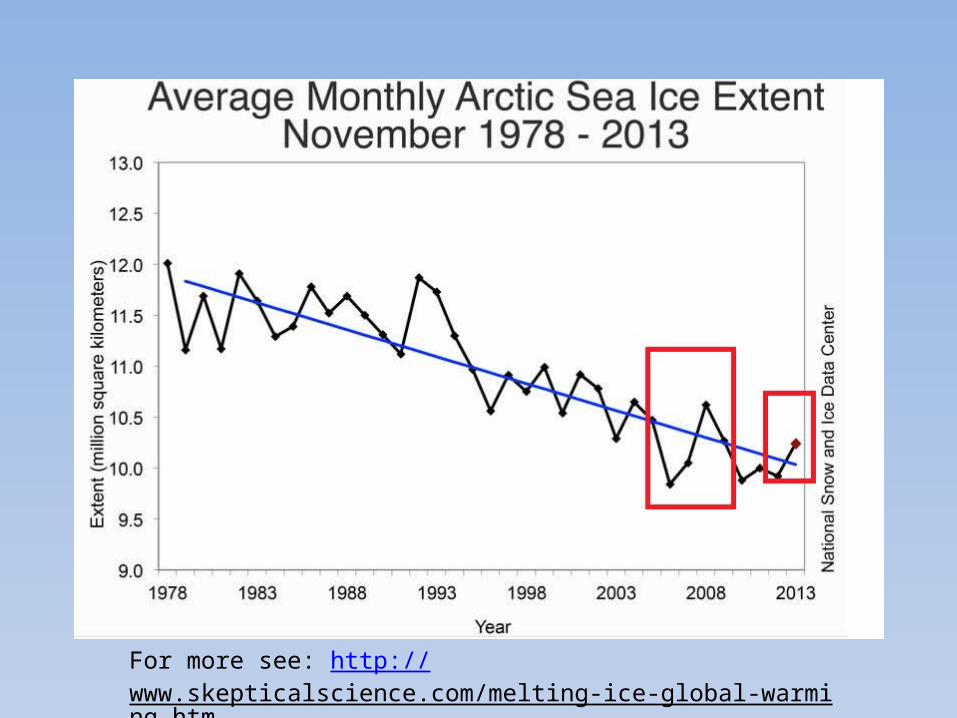
For more see: http://www.skepticalscience.com/melting-ice-global-warming.htm
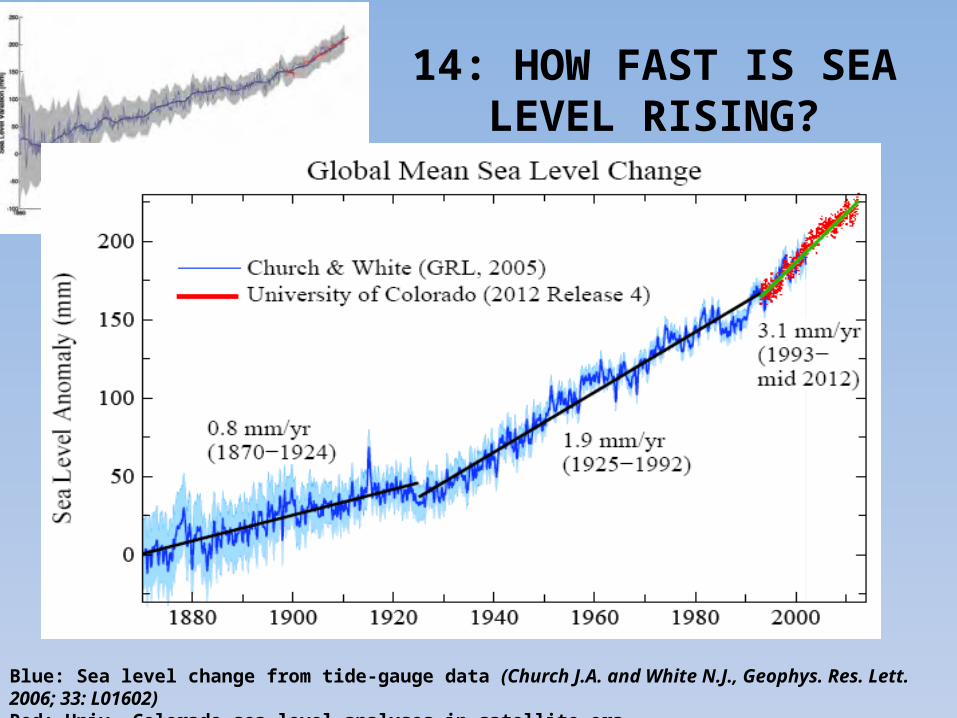
14: HOW FAST IS SEA LEVEL RISING?
Blue: Sea level change from tide-gauge data (Church J.A. and White N.J., Geophys. Res. Lett. 2006; 33: L01602)Red: Univ. Colorado sea level analyses in satellite era (http://www.columbia.edu/~mhs119/SeaLevel/).

Frequency of occurrence (vertical axis) of local June-July-August temperature anomalies (relative to 1951-1980 mean) for Northern Hemisphere land in units of local standard deviation (horizontal axis). Temperature anomalies in the period 1951-1980 match closely the normal distribution ("bell curve", shown in green), which is used to define cold (blue), typical (white) and hot (red) seasons, each with probability 33.3%. The distribution of anomalies has shifted to the right as a consequence of the global warming of the past three decades such that cool summers now cover only half of one side of a six-sided die, white covers one side, red covers four sides, and an extremely hot (red-brown) anomaly covers half of one side. Source: Hansen, J., Sato, M., and Ruedy, R., Proc. Natl. Acad. Sci., 2012.
Loaded Climate Dice: global warming is increasing extreme weather events.Extreme summer heat anomalies now cover about 10% of land area, up from 0.2%. This is based on observations, not models.
End of week 1