Embed Size (px)
Citation preview

2013
SEBI DRG STUDY
EARNINGS MANAGEMENT IN INDIA
D. AJIT*
SARAT MALIK
VIMAL KUMAR VERMA
* The authors are respectively, as follows: Associate Professor of Economics, University of Northern British
Columbia, Canada; Joint Director, Department of Economic and Policy Analysis (DEPA), Securities and Exchange
Board of India (SEBI), Mumbai, India; Officer- Research, DEPA, SEBI, Mumbai, India. The authors are solely
responsible for errors, if any. Opinions expressed here are strictly personal and do not reflect the opinions of the
organizations the authors are associated with, especially SEBI.

ii
EXECUTIVE SUMMARY
Earnings management (EM) by companies is widespread throughout the world. The
pressure to meet earnings targets of the market and thereby derive private benefits (in the form of
managerial compensation) was found to be the driving force for EM world-wide. In the process
the lack of quality of financial information disseminated by companies could affect investor
decision-making and when detected by the market leads to severe losses for investors. The
present study contributes to the literature by examining and quantifying the extent of EM in India
by studying a cohort of 2229 listed Indian companies (non-financial) during 2008-2011. The
study shows that the average earnings management in corporate sector(non-financial) in India is
2.9 per cent of the total assets of these firms which is comparable to the estimates in US, Europe
and elsewhere in the world (around 1 to 5 per cent of total assets). The study reveals that small
firms in India indulge relatively more in earnings management (10.6 per cent of the total asset)
than the medium and large size firms. Industry-wise categorization shows that the companies in
the line of business viz., construction and mining etc. are involved in relatively high levels of
earnings management. Another finding of the study is that discretionary accruals are inversely
related with leverage of companies. Further, the study did not find any statistically significant
relationship between EM and performance of companies.
From the regulators point of view, these findings may be useful as it provides an
additional tool for ensuring that financial reporting matches the real economic value of
companies. Greater improvement in accounting quality and financial information can reduce
asymmetry of information in capital market and protect investors who are ultimately lenders of
capital for these companies. Efficiency and stability of capital market and financial system is a
public good which every regulator seek to maximise. An increasing level of earnings
management in a company or industry (above the average threshold of the industry) may
provide much desired red signal for the regulator for enhanced monitoring and surveillance of
the company/industry, so that integrity and stability of the financial system is not compromised.
Another policy implication of the study is the need for better and timely disclosure of
financial information. Auditors can play an important role in monitor and disclosing financial
reporting of companies so that management discretion (as accorded by the GAAP India) is
minimized. The migration to IFRS planned in Indian corporate sector may reduce the
management discretion over financial reporting. Given the international evidence that effective
board of directors and audit committees can lead to reduced level of earnings management in
companies, it is imperative that effectiveness of board of directors and audit committees may
require greater attention of regulators.

iii
TABLE OF CONTENTS
Executive Summary ii
Table of contents iii
List of Tables iv
Acknowledgements v
Chapter I Introduction 1
Chapter II Literature Review and Hypothesis Development 5
EM and Accrual Anomaly 6
EM and Initial Public Offerings 6
EM and Seasoned Equity Issues 6
EM and Executive Compensation 7
EM and Audit Quality 7
EM and Analyst Coverage
EM and Sarbanes-Oxley Act
7
8
EM in Pre and Post IFRS period 8
Hypothesis Development 8
Chapter III Data Base and Methodology 9
Data Base 9
Methodology 10
Chapter IV Empirical Results 15
Chapter V Concluding Observations 19
References 22

iv
LIST OF TABLES
Table 1 Descriptive Statistics 16
Table 2 Industry-wise Average Discretionary Accruals 17
Table 3 Firm Size and Average Discretionary Accruals 18
Table 4 Correlations among Variables- DACC, Size, Lev and ROA 19

v
ACKNOWLEDGEMENT
The authors are grateful to Securities and Exchange Board of India for providing
financial support for the project. The authors are also grateful to Shri Prashant Saran, Whole-
Time Member, SEBI and the participants of a seminar presentation of the findings of the SEBI
DRG Study on “Earnings Management in India” on July 25, 2013 at SEBI, Mumbai for
providing valuable feedback/suggestions. However, any errors that remain are the sole
responsibility of the authors.

Page | 1
1. Introduction
Public companies face the pressure to meet or beat an important earnings benchmark,
normally market earnings estimates. Companies that consistently meet or beat market earnings
forecasts enjoy a high reputation as well as valuation premiums and lower cost of capital
(Kasznik and McNichols, 2002; Brown and Caylor, 2005).When companies miss their earnings
benchmarks, they suffer severe stock losses (Skinner and Sloan, 2002) and this adversely
impacts executive compensation (Matsunaga and Park, 2001). As a result, managers of
companies may use their discretion to manage earnings so that they can meet or beat current-year
market estimates. If the intention of reporting earnings figures is to provide private information
to the market about the prospects of the company (earning informativeness) it could be seen as
something ‘positive’. This is referred to as ‘efficient manipulation’ (Ronen and Sadan, 1981;
Chaney and Lewis, 1995; Tucker and Zarowin, 2006, Cahan et al., 2008). On the other hand, if
managers resort to earnings management with the intention of pursuing their individual goals
(such as managerial compensation), this is considered ‘opportunistic manipulation’ and the
earnings figures reported by such companies are of poor quality and a measure of the
information risk associated with them (Bhattacharya et al., 2003; Leuz et al., 2003).
Earnings management (EM) is possible by manipulating accruals (more by altering
discretionary accruals) or by manipulating real activities (operational activities)1. In practice, real
activities based EM occurs during the fiscal year and is realized by the fiscal-year end. After that,
it is still possible for managers to adjust the level of accrual-based EM. Thus, in the real world,
managers use multiple EM techniques at the same time. The term ‘accruals’ corresponds to the
earnings component that does not generate cash flows. Discretionary accruals are the portion of
accruals over which management exercises discretion and this estimated portion of accruals is
often used as a proxy of the earnings that are managed. EM, especially accrual-based earnings
management is possible because accounting standards like Generally Accepted Accounting
Principles (GAPP) allow alternative interpretation of accounting events (Teoh et al., 1988). The
1 Most of the current research is on earnings management focuses on detecting abnormal accruals. Managers also
have the incentives to manipulate real activities to meet earning targets (such as providing discounts to temporarily
increase sales, overproducing to report lower cost of goods sold, and reducing discretionary expenses like R&D,
advertising expenditures, sales of profitable assets, etc). See Graham et al. (2005), Roychowdhury (2006) and
Zhang (2012) for a discussion on real earnings management.
Page | 2
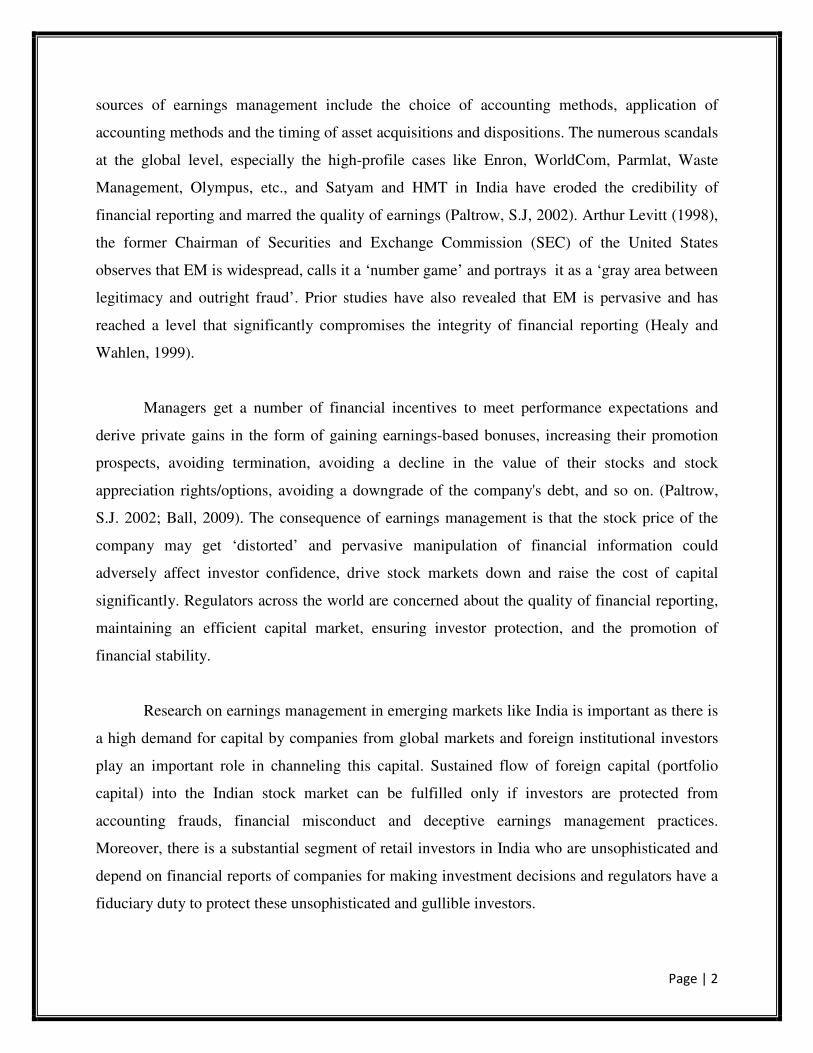
sources of earnings management include the choice of accounting methods, application of
accounting methods and the timing of asset acquisitions and dispositions. The numerous scandals
at the global level, especially the high-profile cases like Enron, WorldCom, Parmlat, Waste
Management, Olympus, etc., and Satyam and HMT in India have eroded the credibility of
financial reporting and marred the quality of earnings (Paltrow, S.J, 2002). Arthur Levitt (1998),
the former Chairman of Securities and Exchange Commission (SEC) of the United States
observes that EM is widespread, calls it a ‘number game’ and portrays it as a ‘gray area between
legitimacy and outright fraud’. Prior studies have also revealed that EM is pervasive and has
reached a level that significantly compromises the integrity of financial reporting (Healy and
Wahlen, 1999).
Managers get a number of financial incentives to meet performance expectations and
derive private gains in the form of gaining earnings-based bonuses, increasing their promotion
prospects, avoiding termination, avoiding a decline in the value of their stocks and stock
appreciation rights/options, avoiding a downgrade of the company's debt, and so on. (Paltrow,
S.J. 2002; Ball, 2009). The consequence of earnings management is that the stock price of the
company may get ‘distorted’ and pervasive manipulation of financial information could
adversely affect investor confidence, drive stock markets down and raise the cost of capital
significantly. Regulators across the world are concerned about the quality of financial reporting,
maintaining an efficient capital market, ensuring investor protection, and the promotion of
financial stability.
Research on earnings management in emerging markets like India is important as there is
a high demand for capital by companies from global markets and foreign institutional investors
play an important role in channeling this capital. Sustained flow of foreign capital (portfolio
capital) into the Indian stock market can be fulfilled only if investors are protected from
accounting frauds, financial misconduct and deceptive earnings management practices.
Moreover, there is a substantial segment of retail investors in India who are unsophisticated and
depend on financial reports of companies for making investment decisions and regulators have a
fiduciary duty to protect these unsophisticated and gullible investors.

Page | 3
Firms make sales by either collecting cash or extending credit to their customers. Their
accounting earnings are equal to their cash earnings plus accruals2. Insiders (managers) can
opportunistically manipulate earnings figures as managerial discretion allows them flexibility,
for example, in deciding how quickly to depreciate fixed assets and how large doubtful accounts
should be. Earnings Management3 thus can be defined as the discretionary use of judgment by
insiders (managers) in financial reporting and in structuring transactions to misinform
stakeholders about the underlying economic position and performance of the entity. Given this
definition, earnings management is a financial reporting phenomenon (Beneish, 2001).
Earnings management has become a topic of increased interest for financial regulators.
An understanding of earnings management practices helps regulator(s) to improve the
functioning of capital markets, reduce asymmetry of information, reduce cost of capital and
protect small and minority shareholders’ interests. Important regulatory interventions to mitigate
earning management practices in the US include the Regulation of Fair Disclosure passed in
2000 (to prohibit selective disclosure of material information) and the Sarbanes-Oxley Act of
20024. These interventions allow auditors to have a more consistent and precise framework for
evaluating the financial statements of firms. In turn, both financial analysts and public or private
shareholders benefit from not only more accurate financial information, but also more consistent
financial reporting by firms as well as across industries, thereby allowing the best possible
conclusions to be drawn. Financial reporting plays two important roles in the capital market.
Firstly, it enables capital providers (shareholders and creditors) to evaluate the return of potential
2Total accruals are defined as the change in non-cash working capital accounts minus depreciation and amortization.
3It is useful to distinguish earnings management (EM) from earnings manipulation, earnings fraud, and creative
accounting (Ning, 2005, 2006). Earnings manipulation means that management takes deliberate steps to bring
reported earnings to a desired level. EM refers to the earnings manipulation through exercising the discretion
accorded by accounting standards and corporate laws, and/or structuring activities in such a way that expected firm
value is not affected negatively. Earnings fraud refers to the earnings manipulation by violating accounting
standards and corporate laws, and/or structuring activities in such a way that reduces expected firm value; while
“creative accounting” refers to the earnings manipulation practices that do not violate accounting standards or
corporate laws because of the lack of relevant standards or laws.
4Sections 302 and 404 of SOX have received the most attention. Section 302 deals with corporate responsibility for
financial reports. In practice, this means that both the CEO and CFO of a public firm must take responsibility for the
content of the financial report. Section 404 deals with the assessment of internal controls by management.
Management is obliged to take responsibility for the establishment and maintenance of internal controls and it must
assess the effectives of the internal control structure and the procedures for financial reporting. Section 404 also
obliges the auditor to assess whether the assertions made by management are fair or not

Page | 4
investment opportunities. Secondly, it allows capital providers to monitor the use of capital once
committed (Beyer et al., 2010). Both these functions are undermined when managers
opportunistically manage financial reports to derive private benefits. EM is one of the reasons for
poor accounting quality. Less earnings management is considered one criterion of better
accounting quality (Barth et al., 2008).
Detecting earnings management is a challenging task. The literature has followed several
approaches, with varying characteristics. First, there is a large amount of literature that attempts
to identify discretionary accruals based on the relation between total accruals and hypothesized
explanatory factors. This literature began with Healy (1985) and DeAngelo (1986), who used
total accruals and change in total accruals, respectively, as measures of management's discretion
over earnings. Jones (1991) introduced a regression approach to control for non-discretionary
factors in influencing accruals, specifying a linear relation between total accruals and change in
sales and property, plant and equipment. These analytical and methodological advances have
enabled researchers and practitioners to detect and quantify the extent of EM using discretionary
accruals as a proxy for earnings management. There is substantial evidence in the US, Europe
and other emerging markets that managers engage in earnings management5. Empirical work has
also recorded that regulatory interventions like RFD and SOX in the US has resulted in a lower
earnings management (Ronen & Yaari, 2007, Wilson, 2009).
India is the one of the fastest growing economies of the world. The number of listed
companies in the Bombay Stock Exchange has risen from 4,344 in 1985 to 5,133 at end of
March 2012. The market capitalization of these companies was around 74 per cent of India’s
GDP at end of March 2012 (SEBI, 2012). It would be interesting to examine the magnitude of
EM existing among firms in the private corporate sector in India as well as in the
companies/industries where it is preponderant. This would provide valuable insights to regulators
like the Securities and Exchange Board of India (SEBI) about the adequacy or changes in
regulation required so that investors (especially unsophisticated investors) can make the best
possible conclusions from financial statements.
5 See Healey (1985), Guidry et al. (1999), Defond and Jiambalvo (1994), Barth et al. (1995, 2010), Kasznik (2002),
Healey and Whalen (1999).

Page | 5
Objectives of the Study
The objectives of the study are as follows:
1. To examine whether earnings management exists in India among firms which are
publicly listed;
2. If it exists, what is its magnitude compared with evidence from other countries;
3. What are the determinants of discretionary accruals – are they related to the firm’s
specific attributes (such performance, leverage, size);
4. What are the regulatory implications of EM?
The study is organized as follows: Section II reviews the literature on the subject and
develops a hypothesis for testing. Section III discusses the database and methodology for the
study. Section IV presents the empirical results and Section V summarizes the conclusions from
the study.
II. Review of Literature and Hypothesis Development
The use of earnings management is widely debated and actively researched. Schipper
(1989) defines EM as “..purposeful intervention in the external financial reporting process, with
the intent of obtaining some private gain..”. Healy and Wahlen (1999) also define EM as a “….
managers’ judgment ‘in financial reporting and in structuring transactions to alter financial
reports to either mislead some stakeholders about the underlying economic performance of the
company or to influence contractual outcomes that depend on reported accounting
numbers…”(p.368). Mulford and Comiskey (2002) define EM as “…active manipulation of
earnings towards a pre-determined target..”. All these definitions focus on the legal accounting
and economic choices that may be used to influence reported earnings.
Identifying earnings management is one of main challenges for both researchers and
practitioners (Dechow et al., 2012); it is neither visible nor transparent. Academicians have
devised indirect methods to estimate earnings management. One widely used method is to gauge
the non-discretionary part of accruals. Isolating discretionary and non-discretionary accruals is
the most important factor in developing a good earnings management detection model. The
difficulty in isolating the non-discretionary and discretionary portions from total accruals by
investigators (auditors, analysts, investors, and researchers) makes it convenient for firms

Page | 6
looking to engage in earnings management. The analysis of earnings management is often
discretionary accruals focused (Dechow et al., 1995, 2012).
The literatures on earnings management especially discretionary accruals as a proxy for
earnings management are far ranging and selectively reviewed in the following sections.
EM and Accrual Anomaly
One of the controversial issues in EM is whether accruals are priced efficiently by the
market (future stock returns). Starting with Sloan (19966), a large amount of literature has
emerged on the idea that the stock market struggles to understand the accruals components of
reported earnings. Sloan (1996) provides empirical evidence (based on US data) that the current
earnings performance of US companies is more persistent for companies with low levels of
accruals. Hence, investors tend to overweigh accruals and are subsequently surprised if accruals
turn out to be less persistent than expected. This overestimation of the persistence of earnings
leads to abnormal positive returns for low accrual companies and abnormal negative returns for
companies which have low levels of accruals.
EM and Initial Public Offerings (IPO)
There is research on the reporting of earnings around IPOs of common stock (Teoh,
Welch and Wong, 1988b). The study of Teoh et al. (1988b) shows that companies manage
earnings in anticipation of going public with an equity issue (with an IPO).
EM and Seasoned Equity Issues
Studies by Shivakumar (1996), Teoh et al., (1988a) and Rangan (1998) also provide
evidence of earnings management around seasoned equity offerings. They indicate that
management faces the incentive to manage earnings upwards around a seasoned equity offering
to maximize the offer price for its shares of the stock.
6 For an up-to-date survey of the literature in this field, see Richardson et al. (2010).
Page | 7
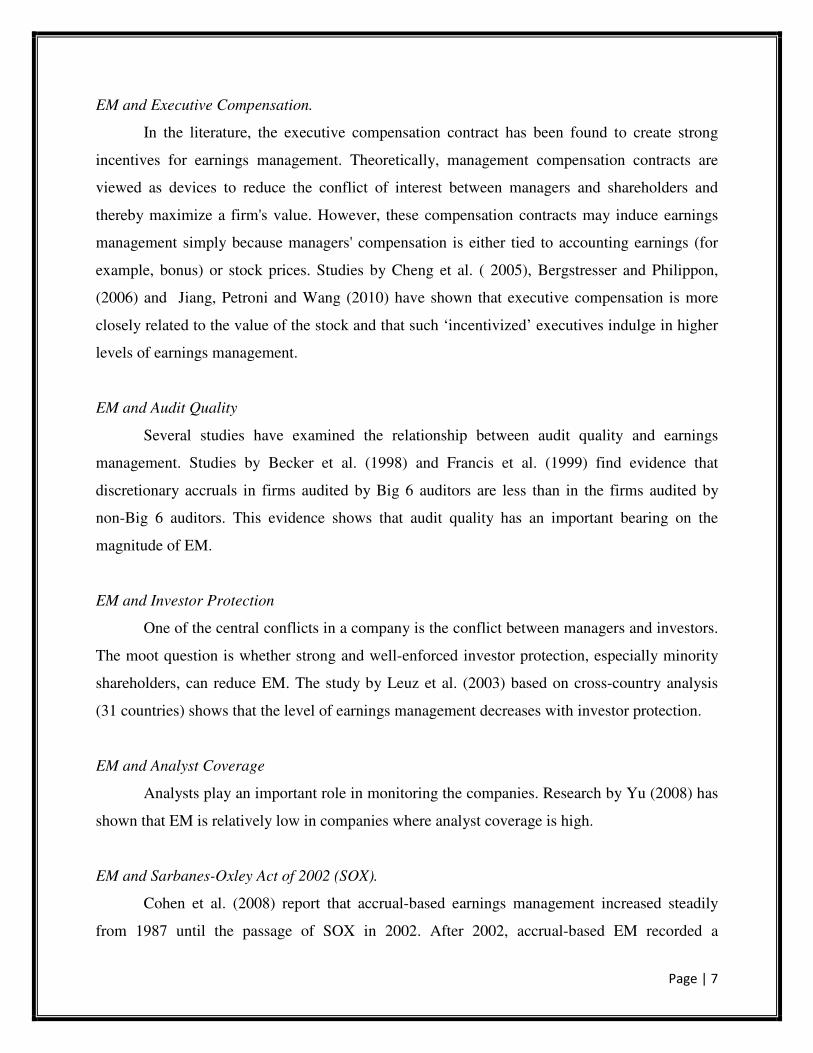
EM and Executive Compensation.
In the literature, the executive compensation contract has been found to create strong
incentives for earnings management. Theoretically, management compensation contracts are
viewed as devices to reduce the conflict of interest between managers and shareholders and
thereby maximize a firm's value. However, these compensation contracts may induce earnings
management simply because managers' compensation is either tied to accounting earnings (for
example, bonus) or stock prices. Studies by Cheng et al. ( 2005), Bergstresser and Philippon,
(2006) and Jiang, Petroni and Wang (2010) have shown that executive compensation is more
closely related to the value of the stock and that such ‘incentivized’ executives indulge in higher
levels of earnings management.
EM and Audit Quality
Several studies have examined the relationship between audit quality and earnings
management. Studies by Becker et al. (1998) and Francis et al. (1999) find evidence that
discretionary accruals in firms audited by Big 6 auditors are less than in the firms audited by
non-Big 6 auditors. This evidence shows that audit quality has an important bearing on the
magnitude of EM.
EM and Investor Protection
One of the central conflicts in a company is the conflict between managers and investors.
The moot question is whether strong and well-enforced investor protection, especially minority
shareholders, can reduce EM. The study by Leuz et al. (2003) based on cross-country analysis
(31 countries) shows that the level of earnings management decreases with investor protection.
EM and Analyst Coverage
Analysts play an important role in monitoring the companies. Research by Yu (2008) has
shown that EM is relatively low in companies where analyst coverage is high.
EM and Sarbanes-Oxley Act of 2002 (SOX).
Cohen et al. (2008) report that accrual-based earnings management increased steadily
from 1987 until the passage of SOX in 2002. After 2002, accrual-based EM recorded a

Page | 8
significant decline. Conversely, the level of real earnings management declined prior to SOX and
significantly after the passage of SOX. These findings suggest that companies switched from
accrual-based to real earning management methods after the passage of SOX.
EM in Pre and Post-IFRS period
One of the interesting areas of study is the effect of the introduction of International
Financial Reporting Standards (IFRS on earnings management. The study of Barth et al., (2008)
of 21 countries found that firms adopting IFRS were found to be indulging in ‘less’ earnings
management and more timely recognition of losses compared with firms which did not adopt
IFRS7.
The study by Mara et al. (2011) of Italian companies after the introduction of IFRS (in
2005) found that board independence and audit committees play a significant role in moderating
earnings management.
Hypothesis Development
There is also considerable literature (apart from the issues discussed above) on the
various facets of earnings management. Earnings management can be behaviorally attributed to
firm-specific or non firm-specific characteristics. Bartov et al. (2001) compiled evidence stating
that firms may meet or beat their earning expectation through earnings management. Myers et al.
(2007) argue that the firms that had preceding positive earnings are more likely to manipulate
earnings, to keep a consecutive earnings growth trend; therefore, the performance of the firm in
the prior year influences the manager’s tendency to manipulate earnings to meet or exceed the
analyst’s earnings forecast. Based on the above literature, it is hypothesized that:
H1: Earnings management and firm performance are positively related.
Earnings management is also related to the firm’s characteristics such as size, leverage,
etc. It also makes practical sense that highly leveraged firms would have a greater impetus to
meet or exceed their industry peers as well as analyst predictions when it comes to earnings
7 For an early result on the economic consequences of IFRS, see Daske et al. (2006).

Page | 9
reporting. Any substantial drop in their share price would have serious negative effects on their
leverage ratio, as it would increase in the event of a lowering of their stock price.
Consequentially, an increase in the leverage ratio could erode investor confidence in the firm’s
ability to manage payments on the higher leverage ratio. As per contracting theory, a high
levered firm is more likely to follow an income increasing approach (Watts and Zimmerman,
1986). The management of highly levered firms is more likely to report positive discretionary
accruals. Consistent with these viewpoints, it is hypothesized that:
H2: Earnings management and firm leverage are positively correlated.
One of the firm attributes that has an important bearing on earnings management is size.
Firm size is often used as a proxy for information availability in the market. Information for
large firms is generally more available than small firms. Richardson (2000) finds evidence that
large firms have less incentive to manage earnings than small firms. Lee and Choi (2002) also
find that smaller firms are more likely to manage earnings to avoid reporting losses than large
firms. Therefore, it is hypothesized that:
H3: Earnings management and firm size are negatively correlated.
III. Data Base and Methodology
Database
The focus of the present study is non-financial publicly-listed Indian companies. In order
to capture the overall picture of Indian corporate sector, the investigation started with 3457
publicly listed companies available on S&P Capital IQ(CIQ)8. Financial data were initially
collected initially for the period 1996-2012. Since the quality of financial data has varied
substantially over a period of time, our endeavor was to obtain comparable panel data for which
empirical investigations could be conducted. Since we could obtain comparable financial data for
2229 firms in India (which is the largest in the empirical investigation so far9) for the period
2008-2011, we focused our empirical investigation on this period .We excluded the year 2012
due to extraordinary discretionary accruals and considered 2012 as the outlier year. The market
8https://www.capitaliq.com/home.aspx
9 One recent study (Rudra et al., 2012) was based on 67 firms listed in BSE.

Page | 10
capitalization of 2229 firms in 2011 account for almost the market capitalization of firms listed
in the BSE. Financial institutions were excluded because of their different dynamics in earnings
management as opposed to non-financial firms.
Methodology
The amount of managed earnings is the difference between reported earnings and true
earnings. There are three methods of estimating earnings management. One approach is to focus
on specific accruals such as provision of bad debts (widely used in the banking industry). The
second approach is to investigate discontinuities in distribution earnings (for e.g., variability in
earnings). But the most common way of detecting earnings management is through the ‘accruals’
portion of company financial statements. Accounting adjustments known as accruals is the
difference between reporting earnings and operating cash flows. Accruals consist of a
discretionary portion which is often manipulated by managers and a non-discretionary portion
which is dictated by business conditions. Researchers use empirical models to decompose total
accruals into non-discretionary and discretionary accruals. Discretionary accruals are then used
as proxy for earnings management.
Discretionary Accrual Models
In the following section, we will discuss the five of the most widely used models in
measuring non-discretionary and discretionary accruals10
. Managers use accrual-based earnings
management techniques to provide flexibility within accounting rules to manage firm earnings.
One of the simplest methods to manage firm earnings is through early recognition of revenue.
This method affects several financial statement accounts including revenue, accounts receivable
and total assets. The models discussed below, try to detect earning management by measuring
percentage changes between financial statement accounts.
10
For a discussion of these discretionary models, see Dechow et al. (1995).

Page | 11
(a)The Healy Model (1985)
One of the earliest discretionary accrual models was developed by Healy in 1985. The
model uses mean of total accruals scaled by lagged total assets from the estimation period as the
measure of non-discretionary accruals. The Healy (1985) model assumes that non-discretionary
accruals follow a mean reverting process. This implies the following model for non-discretionary
accruals:
���� �∑���
�
(1)
Where:
NDA = estimated non-discretionary accrual;
TA = total accruals scaled by lagged total assets;
t = 1, 2...T is a year subscript for year included in the estimation period; and
Unlike other accrual models, the Healy model predicts that systematic earnings
management occurs in every period. Thus, in order to estimate mean total accruals, Healy
divided the sample into three groups, with earnings predicted to be managed upward into one
group and downward into the other two groups. This approach is equivalent to treating the group
that is predicted to be managed upwards as the estimation period and the other two groups as the
event period. The mean total accruals from the estimation period then represent the measure of
non-discretionary accruals.
(b)The DeAngelo Model (1986)
The underlying assumption of the DeAngelo(1986) model is that non-discretionary
accruals follow a random walk process. The DeAngelo (1986) model uses the previous year’s
total accruals (TAt-1) scaled by lagged total assets (At-2) as a measure of non-discretionary
accruals. The DeAngelo model can be viewed as a special case of the Healy model in which the
estimation period for non-discretionary accruals is restricted to previous year observations.
Dechow (1995) suggests that the DeAngelo model is more appropriate to be used when
discretionary accruals follow a random walk, while the Healy model is appropriate to be used
when discretionary accruals follow a white noise process around a constant mean. The empirical

Page | 12
results suggest that the total accruals follow an approximate white noise process (Dechow,
1995).
���� � ����
(2)
Where:
NDA t = non-discretionary accrual at time t;
TA t-1 = Total accrual at time t – 1;
A t-2 = Total Asset at time t-2.
(c.)The Jones Model (1991)
Jennifer Jones (1991) proposes a model that attempts to control for the effects of changes
in a firm’s economic circumstances on non-discretionary accruals. She indicates that changes in
total assets, gross revenue, and gross property plant and equipment (PPE) are the determinants of
non-discretionary accruals. The idea of the Jones (1991) model is that sales revenue proxies for
the economic events that generate current non-discretionary accruals, while gross PPE controls
for non-discretionary accruals related to depreciation expense. Thus the Jones (1991) model is
based on two key assumptions. Firstly, sales revenue is assumed to be unmanaged. Secondly,
changes in current assets and liabilities are assumed to be driven by changes in sales revenue.
The Jones (1991) model for non-discretionary accruals in the event year is:
���� � 1���� �
∆�������
��������
(3)
Where
∆�����= revenue of firm i in year t less revenue in year t - 1 scaled by total asset at t -1;
����� = gross property plant and equipment of firm i in year t scaled by total asset at t -1;
���= total assets at t-1; and
α1, α2, α3 = firm-specific parameters.
Estimates of the firm-specific parameters (α1, α2, α3) are generated using the following model
in the estimation period:
��� � 1
��� �∆���� ����� ��
(4)
(d) The Modified Jones Model (1995)
A major weakness of the Jones (1991) model is its inability to capture the impact of
sales-based manipulation, since changes in sales are assumed to result in a non-discretionary
model (Dechow et al. 1995). In an attempt to overcome this limitation, Dechow et al. (1995)
proposed a modification to the standard-Jones model. The modified Jones model is identical to

Page | 13
the standard Jones model (1991) with the exception that the change in debtors (∆REC) is
subtracted from ∆REV at the second stage (equation 6). The original Jones model (1991) uses a
three-stage approach to bifurcate total accruals into their discretionary (managed) and non-
discretionary components. In the first stage, total accruals (TA) are estimated using the following
definitional equation:
��� �∆��� � ∆��� � ∆����� ∆���� � ����
���
(5)
Where ,
�� = Total accruals,
∆��= change in current assets
∆�� = change in current liabilities
∆���� = change in cash and cash equivalents
∆��� = change in debt included in current liabilities
��� = depreciation and amortization expense
� = Total Assets
In the second stage, the Modified Jones Model (1995) is used to compute non-
discretionary accruals (NDA). The model is:
���� � 11
��� 2!∆���� � ∆����" 3���� ��
(6)
Here,,�, and � are firm-specific parameters for year t,
∆��� = change in revenues scaled by total assets;
∆REC= change in receivables scaled by total assets;
��� = gross property, plant and equipment scaled by total assets; and
Estimates of the firm specific parameters, α1, α2, andα3 are generated using the equation
(7) in the estimation period. Total accruals are regressed on the change in sales (∆REV) and the
gross level of property, plant and equipment (PPE) for the panel. Thus, the model is:
���� � �1
���� ��∆����� ������� ���
(7)
The descriptions of variables are the same as mentioned in previously discussed
equations. �, ���&'�� denote the OLS estimates of,� and �. The estimates of α1, α2,
and α3 are those obtained from the original Jones Model. The only adjustment relative to the

Page | 14
original model Jones Model is that the change in revenues is adjusted for the change in
receivables in the event period to determine non-discretionary accruals.
In the third stage, after computing total accruals (TA) and nondiscretionary accruals
(NDA), discretionary accruals (DA) were computed using equation (4):
���� � ���� ������ !8"
Positive DAs suggest income-increasing manipulations, while negative DAs indicate
income-decreasing manipulations. Managers have incentives to manage earnings not only
upward, but also downward. In good years, they could want to hide some earnings for future
reporting use, while in bad years they could take a bath (overstate bad assets or take a large
restructuring charge) to make future earnings targets easier to meet.
(e) Industry Model
The industry model was used by Dechow and Sloan (1991). Similar to the Jones model
(1991), the industry model relaxes the assumption that non-discretionary accruals are constant
over time. The industry model for non-discretionary accruals is
���� � ) )�*�'+�&!���"
(9)
Among the models described, modified Jones model is widely used in empirical
investigations. Dechow et al. (1995) finds that that a modified Jones model provides the most
powerful test of earnings management compared to the Healy, DeAngelo and standard Jones and
industry model. Dechow et al. (1995) evaluated the performance of various accrual models
discussed above in terms of specification (i.e., the probability of a Type 1 error) and power (
i.e., the probability of a Type II error) and found the Modified Jones Model to be superior.
Similarly, Guay, Kothari and Watts (1996) and Peasnell, Pople and Young (2000) also
corroborate the conclusions of Dechow et al. (1995). Hence, we adopt the Modified Jones Model
for empirical investigation with respect to India.

Page | 15
IV. Empirical Results
This section briefly reviews prior literature on EM in the Indian context and presents the
results of the present study on earnings management in the Indian corporate sector (non-
financial) in India during 2008 to 2011 and its determinants (as enunciated by hypothesis in the
section III).
Although there is considerable empirical literature of earnings management especially in
the context of the US, in the Indian context, there are only limited studies have been done (Shen
and Chih 2005; Chikpalkatti and Rishi 2007; Sarkar et al. 2008; and Rudra and Bhattacharjee
(2012). The Shen and Chih (2005) study found earnings management to be prevalent among
Indian banks. Chipalkatti and Rishi (2007) found banks with low profitability indulged in
earnings management. Sarkar et al. (2008) found a negative relationship between board
independence and earnings management. Rudra and Bhattacharjee (2012) found some evidence
of adoption of IFRS leading to low earnings management. The studies in the Indian context are
based on a relatively small sample and lack robustness11
. In the following paragraphs, we present
the results of our empirical study with respect to India.
Table 1 reports the descriptive statistics of estimates of discretionary accruals (DA) in the
Indian corporate sector during 2008-2011. The average discretionary accruals is estimated at 2.9
percent of the average total assets of Indian companies (of around $ 399 million) during 2008-
2011, which is slightly above of the recent estimates of 1% percent of the total assets in the US
context (Sra et al., 2013) . In the pre-SOX period, discretionary accruals were relatively higher -
1 to 5 per cent of the total assets of US corporations (Dechow, 1995). The magnitude of
discretionary accruals (DA) in the Indian context during 2008-2011 varied substantially as
evident from the minimum and maximum values. The average return on assets (ROA) was
around 7.5 percent and here also, the variation was substantial as evidenced by the minimum and
maximum values. On an average, most of the firms in the cohort had positive returns (ROA).
The average leverage ratio of the Indian non-financial corporate sector at 0.54 is relatively lower;
and median value is also similar (0.56).
11
The study by Rudra and Bhattacharjee (2012) found discretionary accruals among Indian firms to be as high as
48.3 percent (of total assets) for 2010.

Page | 16
Table 1: Descriptive Statistics
This table presents the variables for the analysis of measuring earnings management through
discretionary accruals (calculated by the Modified Jones Model) of 2229 publicly listed Indian
companies from 2008-2011. The variable SIZE is total assets. ROA is return on assets. LEV is
leverage (Total Liabilities/ Total Assets).
Discretionary
Accruals
(DA)
SIZE(in
million $s)
LOGSIZE ROA LEV
Mean
0.029 399.087 1.635 0.075 0.536
Median -0.020 40.700 1.610 0.072 0.563
Maximum 17.645 68989.100 4.839 2.923 13.636
Minimum -19.651 0.011 -1.959 -1.455 0.000
Skewness 0.534 14.764 0.293 2.563 11.217
Kurtosis 293.754 296.745 3.146 87.397 356.869
Std. Dev. 0.633 2203.515 0.850 0.102 0.328
Observations 8916 8916 8916 8916 8916
Table 2 reports the industry-wise picture of discretionary accruals in the Indian corporate
sector (non-financial). As is evident from Table 2, the highest magnitude of discretionary
accruals and hence earnings management was recorded in the construction and mining sectors
(9.4 percent and 3.4 percent of total assets respectively). The manufacturing sector had, on an
average, discretionary accruals of the magnitude of 2.6 percent of the total assets. The service
sector also had a relatively high earnings management (discretionary accruals were around 3.3
percent of total assets), while the trade sector (wholesale and retail) observed negative
discretionary accruals.

Page | 17
Table 2: Industry-wise Average Discretionary Accruals
This table presents the industrial sector-wise average discretionary accruals (calculated by the
Modified Jones Model) of 2229 publicly listed Indian companies from 2008-2011.Average
discretionary accruals are multiplied by 100 to get the average in percentage.
Four-digit SIC Codes Industry Classification
(Sector-wise)
Number of observations Average
Discretionary
Accruals
(DA)
01XX – 09XX Agriculture, Forestry, and
Fishing
36 1.7%
10XX;
12XX – 14XX
Mining 160 3.4%
15XX – 17XX Construction
340 9.4%
20XX – 39XX
Manufacturing 6388 2.6%
40XX – 49XX
Transport,
Communication, Electric,
Gas, and Sanitary Services
376 2.1%
50XX – 51XX
Wholesale Trade 252 -1.1%
52XX – 59XX
Retail Trade 76 -4.2%
70XX;
72XX – 73XX;
75XX – 84XX;
86XX – 89XX
Services 1228 3.3%
91XX – 99XX Others 60 23.3%
Table 3 reports discretionary accruals according to size of the companies. As is evident,
small firms have higher discretionary accruals (10.6% of total assets) compared to medium sized
companies (0.4% of total assets) and large sized companies (0.3% of total assets). Thus, it is
evident that EM (proxied by discretionary accruals) and size of the company are inversely related
(H3). This result is as per risk-reward theory – smaller firms are more risky and demand higher
returns from investors and hence managers of small firms indulge in higher EM. This is also
evident from the negative correlation between discretionary accruals (DA) and size reported in
Table 4.

Page | 18
Table 3: Firm Size and Average Discretionary Accruals
This table presents the average of discretionary accruals (calculated by the Modified Jones
Model) of 2229 publicly listed different-sized Indian firms. Here Q1 = 10.60 million and Q3 =
149.93 million. If TA (total assets) < Q1, firm size is considered as small and if TA > Q3, firm
size is assumed to be large. Firms with assets sizes from Q1 to Q3 are taken as medium-sized
firms. Average discretionary accruals are multiplied by 100 to get average in percentage.
Firm Size Average Discretionary accruals(DA)
Small (< Q1)
(n = 2227)
10.6%
Medium (Q1 to Q3)
(n = 4460)
0.4%
Large ( > Q3)
(n = 2229)
0.3%
All
(n = 8916)
2.9%
Table 4 also reports the correlation between discretionary accruals (DA) and leverage
(LEV) and performance (ROA). Evidence revealed in Table 4 shows that there is a negative and
statistically significant relationship (at 1% level of significance) between discretionary accruals
and leverage [negating hypothesis 2 (H2)]. This result is not surprising as leverage is relatively
low in the Indian non-financial corporate sector. Lastly, we also found a negative and statistically
insignificant relationship between discretionary accruals and performance of companies thereby
negating hypothesis 1(H1).

Page | 19
Table 4: Correlations among variables -DA, SIZE, LEV, and ROA
This table presents the correlations among variables for the analysis of measuring earnings
management through discretionary accruals (calculated by the Modified Jones Model) of 2229
publicly listed Indian companies from 2008-2011. The variable SIZE is total assets. ROA is
return on assets. LEV is leverage (Total Liabilities/ Total Assets).
DA SIZE LEV
SIZE -0.011
(0.294)
LEV -0.053
(0.000)***
0.031
(0.003)***
ROA -0.004
(0.711)
0.025
(0.017)**
-0.069
(0.000)***
Note: Figures in () are p-values.
***, **, and * indicate 1%, 5%, 10% significant levels.
V: Concluding Observations
The empirical study of discretionary accruals of 2229 listed Indian companies (non-
financial) during 2008-11 shows that the estimated average discretionary accruals of the
corporate sector in India is 2.9 per cent of the total asset of these firms. The study reveals that
small-sized companies in India indulge in relatively more earnings management (10.6 percent of
the total assets) than medium- and large-sized firms. Industry-wise categorization shows that the
companies in businesses such as construction and mining, etc. indulge in relatively high levels of
earnings management. Another finding of the study is that discretionary accruals (proxy for EM)
are inversely related to the leverage of companies. Further, the study did not find any statistically
significant relationship between EM and the performance of companies.
These findings provide a yardstick about the quality of financial accounts in the corporate
sector in India and its relevance for investor decision-making. The magnitude of EM is
confidential information and known only to the managers of the company. In capital markets,
sophisticated investors (like institutional investors) are capable of understanding the existence

Page | 20
and magnitude of EM and the EM risk. It is the unsophisticated investors who are gullible to EM
practices. Those who prepare financial accounts have a fiduciary duty to reflect real economic
outcomes in the financial accounts. When managers do not voluntarily disclose this private
information, there is a need for enhanced disclosure regulations. Accounting standards,
disclosure requirements, auditors, analysts and regulators enforcement actions can certainly
reduce information asymmetry in the capital market and ensure that the accounting system and
financial reporting provides information about firm value.
The study recommends enhanced surveillance, monitoring and regulatory action by the
securities market regulator, for a company or industry, which is indulged in high level of
earnings management (above the average threshold of the industry). Independent (external) audit
is the primary institutional mechanism for verification of financial reports. However, there is a
cost of committing to a particular level of independent audit in terms of quantity and quality of
audit resources required. The chosen level of independent audit will determine the accuracy of
financial reports and independence from managerial manipulation.
The quality of financial reports, financial restatements and instances of fraud are some
mechanisms through which financial reporting can be evaluated. EM studies provide
corroborating mechanisms to the prevalence and magnitude of EM. External monitoring agencies
like external auditors, analysts and institutional investors can play an important role in
preventing aggressive (deceptive) financial reporting by companies. EM studies can provide
additional tools to regulator(s) to verify the quality of financial reports so that capital providers
(shareholders and creditors) can evaluate the return potential of investments. Greater
improvement in accounting quality and financial information can certainly reduce asymmetry of
information in capital market and protect investors. Efficiency and stability of capital market and
financial system is a public good which needs to be maximized.
Another policy implication of the study is the need for better and timely disclosure of
accounting information. Auditors/regulators have an important role to play in this task. They are
required to monitor and disclose items in which management discretion is exercised widely. The
migration to IFRS planned in the Indian context could reduce the avenues of managerial

Page | 21
discretion in financial reporting. Given the international evidence that an effective board of
directors and audit committees can lead to reduced level of earnings management in companies,
it is imperative that regulators pay greater attention to the effectiveness of these boards and
committees. Besides, the enforcement of strong investor protection laws, especially to protect the
interests of minority shareholders can certainly reduce the level of earnings management as
proved by international evidence.

Page | 22
REFERENCES
Baber, W. R., Kang, S. H., & Li, Y. (2011) Modeling Discretionary Accrual Reversal and the
Balance sheet as an Earnings Management Consultant, The Accounting Review, Vol. 86,
pp. 1189-1212.
Ball, R. (2009) Market and Political/Regulatory Perspectives on the Recent Accounting
Scandals, Journal of Accounting Research, Vol. 47, pp.277-323.
Ball, R., & Shivakumar, L. (2008) Earnings Quality at Initial Public Offerings, Journal of
Accounting and Economics, Vol. 45, pp.324-439.
Barber, B. M., & Lyon, J. D. (1996) Detecting Abnormal Operating Performance: The Empirical
Power and Specification of Test Statistics, Journal of Financial Economics, Vol. 41, pp.
359-399.
Bartov, E. (1993) The Timing of Asset Sales and Earnings Manipulations, Accounting Review,
Vol. 68, pp. 840-855.
Bartov, E., Gul, F. A., & Tsui, J. S. L. (2001) Discretionary-Accruals Models and Audit
Qualifications, Journal of Accounting and Economics, Vol. 30, pp. 421-452.
Barth, M., Landsman, W & Lang, M. (2008) International Accounting Standards and Accounting
Quality, Journal of Accounting Research, Vol.46, pp.467-498.
Barth, M., & Taylor, D. (2010) In Defense of Fair Value: Weighing the Evidence on Earnings
Management and Asset Securitization, Journal of Accounting and Economics, Vol. 49,
pp;.26-33.
Becker, C.L., DeFond, M.L., Jiambalvo, J & Subramanyam, K.R. (1998) The Effect of Audit
Quality on Earnings Management, Contemporary Accounting Research, Vol. 15, pp.1-24.
Beneish, M.D. (2001) Earnings Management: A Perspective, Managerial Finance, Vol. 27, pp.3-
17.
Beyer, A., Cohen, D.A., Lys, T.Z., & Walther, B.R. (2010) The Financial Reporting
Environment: Review of Recent Literature, Journal of Accounting and Economics, Vol.
50, pp.296-343.
Bergstresser, D., & Philippon, T. (2006) CEO incentives and Earnings Management, Journal of
Financial Economics, Vol. 80, pp.511-529.
Blling, M.B., & Lewis, M.F. (2010) Opportunism and the related consequences in the IPO
setting, Working paper, New York University.

Page | 23
Bhattacharya, U., Daouk, H. & Welker, M. (2003) The World Price of Earnings Opacity, The
Accounting Review, Vol.78, pp.641-678.
Brown, L.D., & Caylor, M.L. (2005) A Temporal Analysis of Quarterly Earnings Thresholds:
Propensities and Valuation Consequences, Accounting Review, Vol. 80, pp. 423-440.
Burgstahler, D., & Dichev, I. (1997) Earnings management to avoid earnings decreases and
losses, Journal of Accounting and Economics, Vol. 24, pp. 99-126.
Cahen, S.F., Liu, G., & Sun, J. (2008) Investor Protection, Income Smoothing, and Earnings
Informativeness, Journal of International Accounting Research, Vol.7, pp.1-24.
Cheng, Q., Warfield, T ., & Ye, M. (2005) Equity Incentives and Earnings Management, The
Accounting Review, Vol. 80, pp.441-476.
Chaney, P.K. & Lewis, C.M. (1995) Earnings Management and Firm Valuation Under
Asymmetric Information, Journal of Corporate Finance, Vol. 1, pp.319-345.
Chipalkatti, N., & Rishi, M. (2007) Do Indian Banks understate their Bad Loans, The Journal of
Developing Areas, Vol. 40, pp. 75-91.
Cohen, D., Dey, A., & Lys, T. (2008) Real and Accruals-based Earnings Management in the pre
and post-Sarbanes Oxley Eras, The Accounting Review, Vol. 83, pp.757-788.
Daske, H., Hail, L., Leuz, C., & Verdi, R. (2006) Mandatory IFRS Reporting Around the World:
Early Evidence on the Economic Consequences, Journal of Accounting Research, Vol.
46, pp. 1085-1142.
Darrough, M &Rangan, S. (2005) Do Insiders Manipulate Earnings when they sell their shares in
an Initial Public Offering?, Journal of Accounting Research, Vol. 43, pp. 1-33.
DeAngelo, L. (1986) Accounting Numbers as Market Valuation Substitutes: A Study of
Management Buyouts of Public Stockholders, Accounting Review, Vol. 61, pp.400-420.
Dechow, P.M., & Sloan, R.G. (1991) Executive Incentives and the horizon problems: An
empirical investigation, Journal of Accounting and Economics, Vol. 14, pp. 51-89.
Dechow, P. M., Sloan, R. G., & Sweeney, A. P. (1995) Detecting Earnings Management,
Accounting Review, Vol. 70, pp.193-225.
Dechow, P.M., Hutton, A.P., Kim, J.H and Sloan R.G. (2012) Detecting Earnings Management:
A New Approach, Journal of Accounting Research, Vol. 50, pp. 275-334.
Dechow, P.M., & Skinner, D. (2000) Detecting Earnings Management, Accounting Review,
Vol. 70, pp. 133-168.

Page | 24
DeFond, M.L., & Jiambalvo, J. (1994) Debt Covenant Violation and manipulation of Accruals,
Journal of Accounting and Economics, Vol. 17, pp. 145-176.
DuCharme, L.L., Malatesta, P.H. & Sefcik, S.E. (2004) Earnings management, Stock issues and
Shareholder lawsuits, Journal of Financial Economics, Vol. 71, pp. 27-50.
Graham, J.C., Harvey, C., & Rajagopal, S. (2005) The Economic implications of Corporate
Financial Reporting, Journal of Accounting and Economics, Vol. 40, pp. 3-73.
Guay, W. R., Kothari, S. P., & Watts, R. L. (1996) A Market-based Evaluation of Discretionary
Accrual Models, Journal of Accounting Research, Vol. 34, pp. 83-105.
Guidry, F., Leone, A., & Rock, S. (1999) Earnings-based Bonus plans and Earnings
Management by Business Unit Managers, Journal of Accounting and Economics, Vol.
26, pp.113-142.
Francis, J.R., Maydew, E.L., & Spark, H.C. (1999) The Role of Big 6 Auditors in the Credible
Reporting of Accruals, Auditing: A Journal of Practice and Theory, Vol. 18, pp. 17-34.
Healey, P. (1985) The Effect of Bonus Schemes on Accounting Decisions, Journal of
Accounting and Economics, Vol. 7, pp. 85-107.
Healy, P. M., & Wahlen, J. M. (1999) A Review of the Earnings Management Literature and its
Implications for Standard Setting, American Accounting Association, Vol. 13, pp. 365-
383.
Hirshleifer, D., Hou K., & Teoh, S. H. (2009) Accruals, Cash Flow, and Aggregate Stock
Returns, Journal of Financial Economics, Vol. 91, pp. 389-406.
Hong, X. (2001) The Mispricing of Abnormal Accruals, Accounting Review, Vol. 76, pp. 357-
373.
Jiang, J., Petroni, K.R., & Wang, I.Y. (2010) CFOs and CEOs: Who Have the Most Influence on
Earnings Management?, Journal of Financial Economics, Vol. 96, pp.513-526.
Jones, J. J. (1991) Earnings Management during Import Relief Investigations, Journal of
Accounting Research, Vol. 29, pp. 193-228.
Jones, K. L., Krishnan, G. V., & Melendrez, K. D. (2008) Do Models of Discretionary Accruals
Detect Actual Cases of Fraudulent and Restated Earning? An Empirical Analysis,
Contemporary Accounting Research, Vol. 25, pp. 499-531.
Kang, Q., Liu, Q., & Qi, R (2010) Predicting Stock Market Returns with Aggregate
Discretionary Accruals, Journal of Accounting Research, Vol. 48, pp. 815-858.

Page | 25
Kasznik, R., &McNichols, M. F. (2002) Does Meeting Earnings Expectations matter? Evidence
from Analyst Forecast Revisions and Share Prices, Journal of Accounting Research, Vol.
40, pp. 727-759.
Kothari, S.P., Leone, A. J., & Wasley, C. E. (2005) Performance Matched Discretionary Accrual
Measures, Journal of Accounting and Economics, Vol. 39, pp.163-197.
Lee, B.B & Choi, B (2002) Company Size, Auditor type and Earnings Management, Journal of
Forensic Accounting, Vol. 3, pp. 27-50.
Leuz, C., Nanda, D., &Wysocki, P. D. (2003) Earnings Management and Investor Protection:
An International Comparison, Journal of Financial Economics, Vol. 69, pp.505-527.
Levitt, A. (1998) The “Numbers Game”, NYU Centre for Law and Business.
Marra, A., Mazzola, P., & Prencipe, A. (2011) Board Monitoring and Earnings Management Pre
and Post IFRS, The International Journal of Accounting, Vol. 46, pp. 206-230.
Matsunaga, S.R. & Park, C.W. (2001) The Effect of Missing a Quarterly Earnings Benchmark on
the CEO’s Annual Bonus, Accounting Review, Vol. 76, pp. 313-332.
McNichols, M. F. (2000) Research Design Issues in Earnings Management Studies, Journal of
Accounting and Public Policy, Vol. 19, pp.313-345.
Mulford, C.W. & Comiskey, E.E. (2002) The Financial Numbers Game: Detecting Creative
Accounting Practices, New York, John Wiley & Sons.
Myers, J.N., Myers, L.A & Skinner, D.J. (2007) Earnings Momentum and Earnings
Management, Journal of Accounting, Auditing and Finance, Vol. 22, pp. 249-284.
Ning, Y. (2005) The Theoretical Framework of Earnings Management, Canadian Social Science,
Vol. 1, pp.32-38.
_____(2006) A Different Perspective of Earnings Management, Canadian Social Science, Vol.
2,11-17.
Paltrow, S.J. (2002) Accounting for the Fall: Accounting Scandals have some Peering at
Industry’s Self-Policing, Wall Street Journal, January 14.
Peasnell, K., Pope, P & Young, S. (2000) Detecting Earnings Management using Cross-Sectional
Abnormal Accrual Models, Accounting and Business Research, Vol. 30, pp. 313-326.
Rangan, S. (1998) Earnings Management and the Performance of Seasoned Equity Offerings,
Journal of Financial Economics, Vol. 50, pp. 101-122.
Richardson, V.J. (2000) Information Asymmetry and Earnings Management: Some Evidence,
Review of Quantitative Finance and Accounting, Vol. 15, pp. 325-347.

Page | 26
Richardson, S., Tuna, I., & Wysocki, P., (2010) Accounting Anomalies and Fundamental
Analysis: A Review of Recent Research Advances, Journal of Accounting and
Economics, Vol. 50, pp. 410-454.
Ronen, J., & Sadan, S. (1981) Smoothing Income Numbers: Objectives, Means and Implications,
Massachusetts, Addison-Wesley Publishing Company.
Ronen, J., & Yaari, V., (2007) Earnings Management: Emerging Insight in Theory, Practice,
and Research, Springer Series in Accounting Scholarship.
Roychowdhury, S. (2006) Earnings Management through Real Activities Manipulation, Journal
of Accounting and Economics, Vol. 42, pp.335-370.
Rudra, T., & Bhattachararjee, C.A.D. (2012) Does IFRS influence Earnings Management:
Evidence from India, Journal of Management Research, Vol. 4, pp. 1-7.
Sarkar, J., Sarkar, S., & Sen, K. (2008) Board of Directors and Opportunistic Earnings
Management: Evidence from India, Journal of Accounting, Auditing and Finance, Vol.
23, pp. 517-551.
Schipper, K., (1989) Commentary on Earnings Management, Accounting Horizons, Vol. 3, pp.
91-102.
Securities Exchange Board of India (2012) Annual Report, Mumbai.
Shivakumar, L. (2006) Earnings Management Around Seasoned Equity Offerings, Unpublished
dissertation, Vanderbilt University Nashville, TN.
Skinner, D.J. & Sloan, R.G. (2002) Earnings Surprises, Growth Expectations and Stock Returns
or don’t let an Earnings Torpedo sink Your Portfolio, Review of Accounting Studies, Vol.
7, pp. 289-312.
Shen, C.H.,&Chih, H.L. (2005) Investor Protection, Prospect Theory and Earnings Management:
An International Comparison of the Banking Industry, Journal of Banking and Finance,
Vol. 29, pp. 2675-2697.
Sloan, R. (1996) Do Stock Prices fully Reflect Information in Accruals and Cash Flows about
Future Earnings?, The Accounting Review, Vol. 71, pp. 289-316.
Subramanyam, K. R. (1996) The Pricing of Discretionary Accruals, Journal of Accounting and
Economics, Vol. 22, pp. 249-281.
Sra, J, Ajit, D and Donker, H (2013) Business Cycles and Earnings Management, Paper
presented at the Annual Conference of the Administration Services Association of
Canada (ASAC) at Calgary, Canada.

Page | 27
Teoh, S. H., Welch, I., & Wong, T. J. (1998a) Earnings management and the Post-issue
Performance of Seasoned Equity Offering, Journal of Financial Economics, Vol. 50,
pp.63-99.
_____ (1998b) Earnings management and the Long-run Market Performance of Initial Public
Offerings, Journal of Finance, Vol. 53, pp. 1935-1974.
Tucker, J.W., & Zarowin, P.A. (2006) Does Income Smoothing Improve Earnings
Informativeness, The Accounting Review, Vol. 81, pp.251-70
Walsh. P., Craig, R., & Clarke, F. (1991) Big Bath accounting’ using Extraordinary Items
Adjustments: Australian Empirical Evidence, Journal of Business Finance & Accounting,
Vol. 18, pp. 173-189.
Watts, R.L., and Zimmerman, J.L. (1986) Positive Accounting Theory, Englewood Cliffs, N.J,
Prentice Hall.
Wilson, J. T. E. (2009) Financial Reporting in the Sarbanes-Oxley Era: Have Reforms In
Accounting Numbers as Market Valuation Substitutes: A Study of Management Buyouts
of Public Stockholders improved Earnings Quality?, Research in Business and
Economics Journal, Vol. 1, pp. 1-11.
Yu, F. (2008) Analyst Coverage and Earnings Management, Journal of Financial Economics,
Vol. 88, pp. 245-271.
Zhang,, A.Y. (2012) Evidence on the Trade-Off between Real Activities Manipulation and
Accrual-Based Earnings Management, The Accounting Review, Vol. 87, pp. 675-703.