Embed Size (px)
Citation preview

32%
20% 14%
9%
6%
4%
3% 12%
Earnings Contribution
BFI
BFT
DIV
TLE
MFG
P&E
OIL
OTHERS
25%
20%
20%
7%
5%
5%
4%
14%
Market capitalization composition
BFI
BFT
DIV
TLE
MFG
H&T
OIL
OTHERS
-10.00%
-5.00%
0.00%
5.00%
10.00%
15.00%
20.00%
OIL
F&T
MFG
L&P
C&
E
BFI
TLE
C&
P
H&
T
PLT
S&S
SRV
INV
MTR
TRD
DIV
BFT
P&
E IT
HLT
Sector Index Performance (Quarter)
5000
5500
6000
6500
7000
7500
10
11
12
13
14
15
16
09/24/13 12/24/13 03/24/14 06/24/14
ASPI Index and P/E Ratio
PE Ratio ASPI
-100.00%
-50.00%
0.00%
50.00%
100.00%
150.00%
200.00%
TLE
INV IT
S&S
DIV BFI
OIL
SRV
C&
E
BFT
MFG
H&
T
HLT
L&P
P&
E
MTR
TRD
Earnings Growth (Quarter)
Analysts:
Damith Wasantha +94 117 880837
Hiruni Perera +94 117 880809
Earnings Insight Special Report
Period ending 30th June 2014 23rd October 2014
Positive earnings drive the market
Overall interim results for the quarter ended 30th June have shown an increase of 26.84%, while for the 3 months (period) the results have increased by 19.76%. Majority of the sectors have posted positive earnings growths due to various industry specific reasons. The report is based on interim results of a sample of 242 counters. During the three months ended 30th June 2014 economy performed well with healthy economic factors such as low inflation, increase in GDP and improved external sector performance. Inflation for the June 2014 drops further to 2.8% from 4.9 % in April 2014, while external sector further improved. Proposed consolidation plans were submitted by banks and finance and leasing companies (NBFIs), and those were reviewed and evaluated by the Central Bank during the quarter.
Quarter profit increased by
26.84% QOQ to post a figure
of LKR 45Bn, while for the
period (6 months or 12
months) earnings have
increased by 19.76% to post a
figure of LKR 59 Bn.
Only Six sectors (H&T, HLT,
L&P, P&E, MTR and TRD)
provided negative earnings
growths.
0
10,000
20,000
30,000
40,000
50,000
60,000
70,000
3/6 months Quarter
LKR
Mn
Earnings Growth
2013 2014
Most of the sectors have
performed well during the
quarter ended 30th June
while oil palm and health
care has become the
highest and lowest index
performers respectively.

Special Report: Earnings Insight |23 October 2014
2 | LOLC Securities Limited
-3000.00%
-2000.00%
-1000.00%
0.00%
1000.00%
PABC HDFC CTCE ARPI CSF SFS
Gainers and losers (Earnings growth -Quarter)
11000
12000
13000
14000
15000
16000
17000
18000
9/23/13 12/23/13 3/23/14 6/23/14 9/23/14
Sector Index (12 months)
0
5,000
10,000
15,000
3/6 Months Quarter
LKR
Mn
Earnings Growth
2013 2014
-300.00%
-200.00%
-100.00%
0.00%
100.00%
200.00%
BREW CCS RWSL LMF LION CARG
Gainers and losers (Earnings growth -Quarter)
17%
15%
10%
8% 7%
43%
Earnings contribution (Quarter)
HNB
COMB
SAMP
DFCC
LOLC
others
49%
20%
11%
6%
5% 9%
Earnings Contribution (Quarter)
CTC
DIST
NEST
KFP
LION
others0
5000
10000
15000
20000
25000
09/23/13 12/23/13 03/23/14 06/23/14 09/23/14
Sector index (12 months)
0
10,000
20,000
30,000
3/6 Months Quarter
LKR
Mn
Earnings Growth
2013 2014
Bank, Finance and Insurance
Graph Set 1: Sector analysis
6 months
Source: CSE, Bloomberg, LOLC SEC Research
Beverage, Food & Tobacco
Graph Set 2: Sector analysis Source: CSE, Bloomberg, LOLC SEC Research
Bank, Finance and Insurance sector is the
largest sector with a market cap of LKR
693Bn (25% of the total market cap).
COMB, HNB and DFCC are biggest market
cap counters.
Quarterly earnings improved by 31.37%
while 3 or 6 months earnings have
increased by 28%. Most of the banks
recovered from previous quarter low
earnings due to gold loan provisions
while specialized finance companies like
SFS continued to suffer.
Finance sector consolidation process
triggered major deals in the market
whilst most of the merger proposals
were finalized. CBSL continued to have a
dovish outlook on the monetary policy
and decided to bring down the Standing
Deposit Rate to 5% from 6.5%, when the
number of deposit times exceeds 3 times
during a month. We believe this would
help curtail down the excess liquidity.
Beverage, Food and Tobacco sector has
a market cap of LKR 554Bn (19.98% of
the total market cap) while CTC, NEST
and DIST are the largest big cap
counters of the sector.
QOQ and 3 or 6 months earnings have
increased by 10.36% and 11.84%
respectively. CTC and DIST contributed
70% to the sector earnings. Inflation
remained under 4% during the quarter
helping volume driven FMCG categories
to grow. Beverage related counters
performed comparatively well.
Super market chains were affected with
the negative VAT difference such as
CARG.
Special Report: Earnings Insight |23 October 2014
3 | LOLC Securities Limited
-50
0
50
100
150
3/6 Months QuarterLK
R M
n
Earnings Growth
2013 2014-100.00%
-50.00%
0.00%
50.00%
100.00%
150.00%
200.00%
UCAR LCEY HAYC ASPH MULL MORI
Gainers and losers (Earnings growth- Quarter)
4000
5000
6000
7000
8000
9/23/13 12/23/13 3/23/14 6/23/14 9/23/14
Sector Index (12 months)
-200.00%
-150.00%
-100.00%
-50.00%
0.00%
50.00%
100.00%
150.00%
KAPI AEL LDEV DOCK
Gainers and Losers (Earnings growth- Quarter)
2000
2500
3000
3500
4000
9/23/13 12/23/13 3/23/14 6/23/14 9/23/14
Sector Index (12 months)
0
500
1,000
1,500
3/6 Months Quarter
LKR
Mn
Earnings Growth
2013 2014
50% 42%
4% 2% 2%
Earnings Contribution (Quarter)
CIC
HAYC
MORI
UCAR
MULL
0
2,000
4,000
6,000
8,000
10,000
2013 2014
LKR
Mn
Revenue for the period
AEL
KAPI
LDEV
DOCK
Chemical & Pharmaceuticals
Graph Set 3: Sector analysis Source: CSE, Bloomberg, LOLC SEC Research
Construction & Engineering
Graph Set 4: Sector analysis
Source: CSE, Bloomberg, LOLC SEC Research
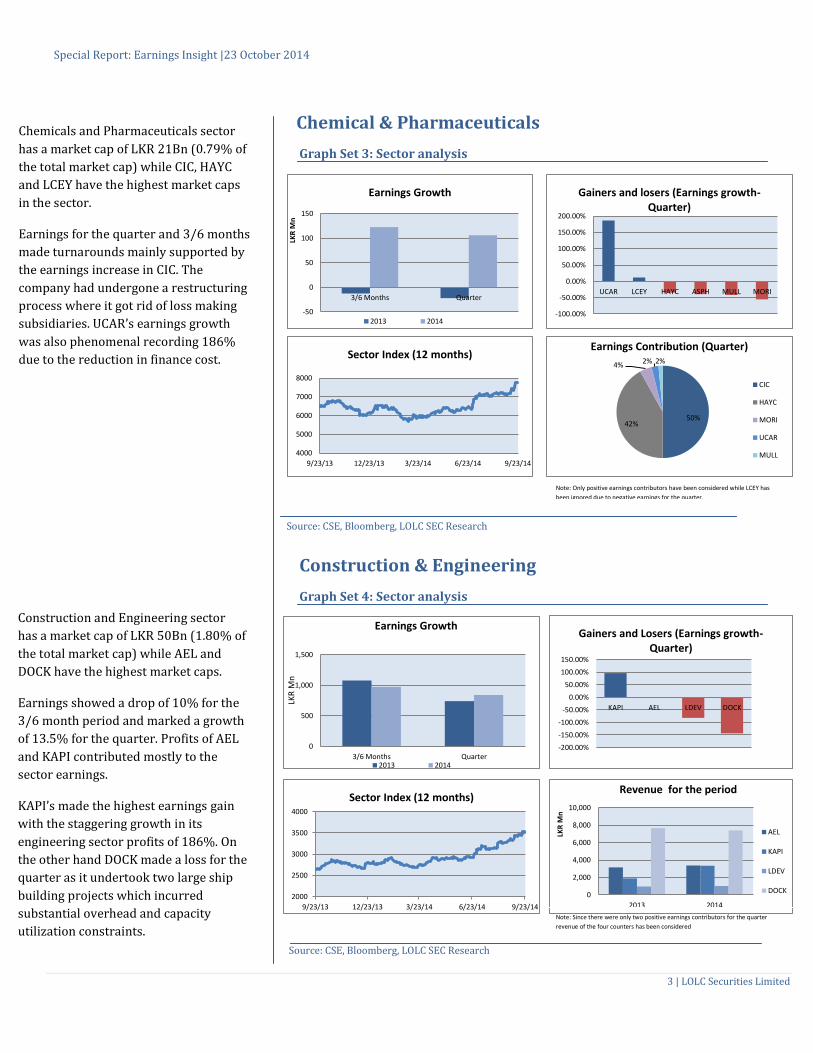
Chemicals and Pharmaceuticals sector
has a market cap of LKR 21Bn (0.79% of
the total market cap) while CIC, HAYC
and LCEY have the highest market caps
in the sector.
Earnings for the quarter and 3/6 months
made turnarounds mainly supported by
the earnings increase in CIC. The
company had undergone a restructuring
process where it got rid of loss making
subsidiaries. UCAR’s earnings growth
was also phenomenal recording 186%
due to the reduction in finance cost.
Construction and Engineering sector
has a market cap of LKR 50Bn (1.80% of
the total market cap) while AEL and
DOCK have the highest market caps.
Earnings showed a drop of 10% for the
3/6 month period and marked a growth
of 13.5% for the quarter. Profits of AEL
and KAPI contributed mostly to the
sector earnings.
KAPI’s made the highest earnings gain
with the staggering growth in its
engineering sector profits of 186%. On
the other hand DOCK made a loss for the
quarter as it undertook two large ship
building projects which incurred
substantial overhead and capacity
utilization constraints.
Note: Only positive earnings contributors have been considered while LCEY has
been ignored due to negative earnings for the quarter.
Note: Since there were only two positive earnings contributors for the quarter
revenue of the four counters has been considered

Special Report: Earnings Insight |23 October 2014
4 | LOLC Securities Limited
0
5,000
10,000
3/6 Months QuarterLK
R M
n
Earnings Growth
2013 2014-1000.00%
0.00%
1000.00%
2000.00%
3000.00%
CSEC SUN CARS EXPO CFLB BIL
Gainers and Losers (Earnings growth -Quarter)
1500
1700
1900
2100
2300
9/23/13 12/23/13 3/23/14 6/23/14 9/23/14
Sector Index (12 months)
35%
22%
13%
12%
7%
11%
Earnings Contribution (Quarter)
JKH
CARS
HAYL
SPEN
RICH
others
-150.00%
-100.00%
-50.00%
0.00%
50.00%
CLPL ODEL
Gainers and Losers (Earnings growth-Quarter)
-1,000
-500
0
500
3/6 Months QuarterLKR
Mn
Earnings Growth
2013 2014
0
200
400
600
800
1000
1200
09/23/13 12/23/13 03/23/14 06/23/14 09/23/14
Sector Index (12 months)
55% 38%
7%
Earnings Contribution (Quarter)
CLPL
MGT
KURU
Diversified Graph Set 5: Sector analysis
Source: CSE, Bloomberg, LOLC SEC Research
Footwear and Textiles
Graph Set 6: Sector analysis Source: CSE, Bloomberg, LOLC SEC Research
Diversified sector has a market cap of
LKR 544Bn (19.62% of the total market
cap) while JKH, CARS and SPEN are the
big cap counters.
3/6 months earnings increased by
32.42% while QOQ earnings increased by
32.74%. JKH, CARS and HAYL
contributed mostly to the sector earnings
while growth was more or less stagnant
during the quarter.
However, CSEC profits had a staggering
growth as profits of the financial services
unit, First Capital Holdings PLC were LKR
218 Mn compared to LKR 66 Mn in the
previous year. This significant increase in
profits was due to the capital gain in
fixed income securities trading
opportunities on decline of interest rates.
Market Capitalization of Footwear &
Textile sector is over LKR 14Bn (0.51%
of the total market Cap), while ODEL &
MGT contribute most to the Market
Capitalization of the sector.
F&T sector has shown a turnaround for
the period while reducing the negative
earnings figure for the quarter. CLPL
and MGT contributed mostly to the
sector earnings while KURU got delisted
during the quarter.
MGT experienced a turnaround from the
loss during the previous quarter
recording a profit of LKR 4.5 Mn
compared to a loss of LKR 92.6 Mn
during the corresponding previous
quarter.
Note: Only positive earnings contributors for the quarter has been considered
while ODEL has been ignored due to negative earnings

Special Report: Earnings Insight |23 October 2014
5 | LOLC Securities Limited
47%
15%
14%
11%
8% 5%
Earnings Contribution (Quarter) ASIR
AMSL
LHCL
CHL
NHL
ASHA
550
600
650
700
3/6 Months Quarter
LKR
Mn
Earnings growth
2013 2014
-600.00%
-400.00%
-200.00%
0.00%
200.00%
SHOT HUNA SIGV TANG KHC EDEN
Gainers and Losers (Earnings Growth Quarter)
-80.00%
-60.00%
-40.00%
-20.00%
0.00%
20.00%
40.00%
ASIR CHL AMSL NHL LHCL
Gainers and Losers (Earnings growth Quarter)
0
200
400
600
800
1,000
3/6 Months QuarterLK
R M
n
Earnings Growth
2013 2014
0
200
400
600
800
1000
09/23/13 12/23/13 03/23/14 06/23/14 09/23/14
Sector Index (12 months)
2800
3000
3200
3400
3600
3800
09/23/13 12/23/13 03/23/14 06/23/14 09/23/14
Sector Index (12 months)
57%
43%
Earnings Contribution- (Quarter)
AHPL
OTHERS
Healthcare Graph Set 7: Sector analysis
Source: CSE, Bloomberg, LOLC SEC Research
Hotels & Travels
Graph Set 8: Sector analysis Source: CSE, Bloomberg, LOLC SEC Research
Healthcare sector captures around 2.20%
of the total market capitalization with
market cap of over LKR 60Bn.
Sector earnings have dropped down for
both the quarter and for the period by
16.57% and 17% respectively.
ASIR was the only counter that posted an
earnings growth for both the periods
while all other counters have
experienced profit declines. ASIR’s
earnings increased for quarter as well as
3/6 period mainly due to foreign
exchange gain. ASIR, AMSL and LHCL
contributed mostly to the sector earnings
Hotels and Travel sector contributes
around 5.19% of the total market
capitalization. AHPL, AHUN and TRAN
are the biggest market caps in the
sector.
QOQ earnings have posted a drop 2.71%
while for the period of 3/6 months
earnings made a gain of 11.90%.
EDEN generated the lowest growth in
earnings to record a 124Mn loss for the
quarter due to increase in operating
expenses. Refurbishment activities
made an impact on the earnings as some
counters made a positive gain after the
closure for refurbishments during the
previous quarter such as SHOT.
Tourist boom continued as the number
of arrivals surpassed 1.1 Mn mark (1.5
Mn target for 2014) while the reduction
of gas prices could also benefit the
margins of the sector.

Special Report: Earnings Insight |23 October 2014
6 | LOLC Securities Limited
-200.00%
-100.00%
0.00%
100.00%
200.00%
300.00%
SHAW GUAR CINV CIT RHL CFI
Gainers and Losers (Earnings growth Quarter)
0
50
100
150
9/23/13 12/23/13 3/23/14 6/23/14 9/23/14
Sector index (12 months)
50%
32%
5%
5% 6%
2%
Earnings Contribution (Quarter)
GUAR
CINV
RHL
SHAW
GREG
OTHERS
0
500
1,000
1,500
3/6 Months QuarterLK
R M
n
Earnings Growth
2013 2014
0
10,000
20,000
30,000
40,000
50,000
2013 2014
Revenue for the period
0
5000
10000
15000
20000
25000
9/23/13 12/23/13 3/23/14 6/23/14 9/23/14
Sector Index (12 months)
0
10
20
30
3/6 Months Quarter
LKR
Mn
Earnings Growth
2013 20140.00%
50.00%
100.00%
Gainers and Losers (Earnings Growth -Quarter)
ECL
Investment Trusts Graph Set 9: Sector analysis
Source: CSE, Bloomberg, LOLC SEC Research
Information Technology
Graph Set 10: Sector analysis
Source: CSE, Bloomberg, LOLC SEC Research
Investment Trust Sector is with a Market
Capitalization of LKR 39Bn (1.41% of the
total market cap) where GUAR, CINV and
GUAR have contributed mostly to the
earnings.
Sector has posted a growth of 80.77% for
the quarter as well as for the 3/6 period
mainly due to increase in counters such
as SHAW, GUAR and CINV by 227.31%,
112.67% and 97.07%.
SHAW’s revenue increased by 513% for
the quarter while interest income
increased by 169%.
Positive growth in the stock market
raised the values of quoted investments
of most of these companies.
Information Technology sector
comprises of two counters, ECL and PCH
while ECL accounts for LKR 1.7Bn and
PCH accounts for LKR 1.8 Bn in the
market capitalization.
As at the date of preparing the report,
only ECL interim results had been
published. ECL’s 3/6 period as well as
quarter earnings increased by 71.73%.
Sector index has been stagnant while
revenue for the 3/6 month period grew
by 25.63%.
*Note: Revenue is there since only one counter has published results as at
preparing this report.
Earnings figure
Special Report: Earnings Insight |23 October 2014
7 | LOLC Securities Limited
0
500
1,000
1,500
2,000
3/6 Months Quarter
LKR
Mn
Earnings Growth
2013 2014
-400.00%
-200.00%
0.00%
200.00%
400.00%
ETWO YORK EQIT EAST KDL CLND
Gainers and Losers (Earnings growth-Quarter)
0
200
400
600
800
1000
9/23/13 12/23/13 3/23/14 6/23/14 9/23/14
Sector Index (12 months)
0
1,000
2,000
3,000
4,000
3/6 Months Quarter
LLK
R M
n
Earnings Growth
2013 2014-500.00%
0.00%
500.00%
1000.00%
LALU SIL BOGA GLAS SWAD SINI
Gainers and Losers (Earnings growth -Quarter)
24%
19%
8% 7%
6%
36%
Earnings Contributution (Quarter)
LLUB
TKYO
DIPD
CERA
TJL
OTHERS0
1000
2000
3000
4000
5000
9/23/13 12/23/13 3/23/14 6/23/14 9/23/14
Sector Index (12 months)
69%
10%
7%
5% 3%
6%
Earnings Contribution (Quarter)
OSEA
PDL
CABO
CTLD
COMD
others
Land & Property Graph Set 11: Sector analysis
Source: CSE, Bloomberg, LOLC SEC Research
Manufacturing
Graph Set 12: Sector analysis Source: CSE, Bloomberg, LOLC SEC Research
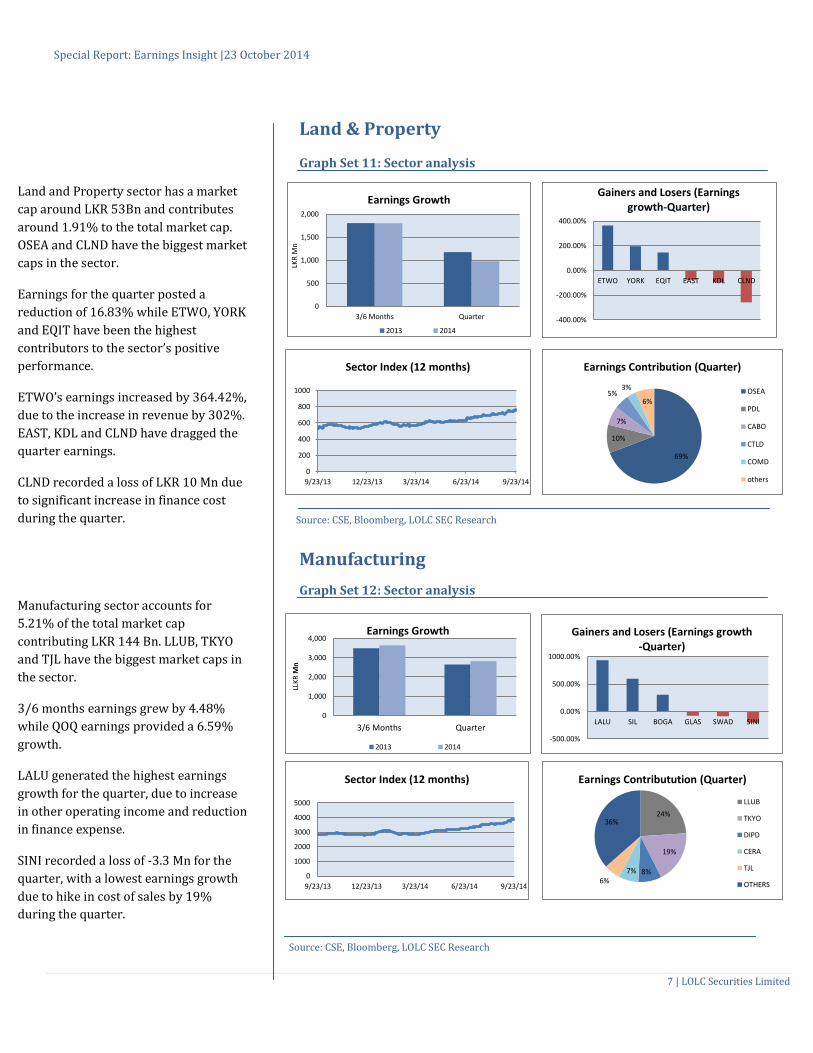
Land and Property sector has a market
cap around LKR 53Bn and contributes
around 1.91% to the total market cap.
OSEA and CLND have the biggest market
caps in the sector.
Earnings for the quarter posted a
reduction of 16.83% while ETWO, YORK
and EQIT have been the highest
contributors to the sector’s positive
performance.
ETWO’s earnings increased by 364.42%,
due to the increase in revenue by 302%.
EAST, KDL and CLND have dragged the
quarter earnings.
CLND recorded a loss of LKR 10 Mn due
to significant increase in finance cost
during the quarter.
Manufacturing sector accounts for
5.21% of the total market cap
contributing LKR 144 Bn. LLUB, TKYO
and TJL have the biggest market caps in
the sector.
3/6 months earnings grew by 4.48%
while QOQ earnings provided a 6.59%
growth.
LALU generated the highest earnings
growth for the quarter, due to increase
in other operating income and reduction
in finance expense.
SINI recorded a loss of -3.3 Mn for the
quarter, with a lowest earnings growth
due to hike in cost of sales by 19%
during the quarter.

Special Report: Earnings Insight |23 October 2014
8 | LOLC Securities Limited
0
200
400
600
800
3/6 Months QuarterLK
R M
n
Earnings Growth
2013 2014 -100.00%
0.00%
100.00%
200.00%
300.00%
COLO AUTO DIMO SMOT ASHO UML
Gainers and Losers ( Earnings growth -Quarter)
10000
12000
14000
16000
18000
20000
9/23/13 12/23/13 3/23/14 6/23/14 9/23/14
Sector Index -12 months
-100.00%
-50.00%
0.00%
50.00%
100.00%
150.00%
BUKI SELI SHAL GOOD INDO
Gainers and Losers (Earnings Growth -Quarter)
46%
31%
10%
7%
4% 2%
Earnings Contribution (Quarter)
UML
COLO
SMOT
DIMO
ASHO
OTHERS
0
500
1,000
1,500
3/6 Months Quarter
LKR
Mn
Earnings Growth
2013 2014
0
20000
40000
60000
80000
100000
120000
140000
9/23/13 12/23/13 3/23/14 6/23/14 9/23/14
Sector Index (12 months)
90%
2% 2% 2% 4%
Earnings Contribution (Quarter)
BUKI
SELI
SHAL
GOOD
INDO
Motors Graph Set 13: Sector analysis
Source: CSE, Bloomberg, LOLC SEC Research
Oil Palms
Graph Set 14: Sector analysis
Source: CSE, Bloomberg, LOLC SEC Research
Motors sector has a market cap of LKR
26Bn (0.96% of the total market cap).
UML, ASHO and DIMO are the biggest
counters in term of market cap.
All the counters (except UML, ASHO)
posted earning growths while COLO have
turned around. However the sector
performance has been dragged down by
profit decline of UML.
COLO’s earnings for the quarter
increased due to increase in sales by 29%
and other gains by 7379%.
UML recorded a negative growth in
earnings of 65% mainly due to decrease
in sales revenue, income sources and
finance income and increase in
distribution expenses.
Oil Palm sector has a market cap of LKR
124Bn (4.48% of the market cap). BUKI
has the biggest market cap while all the
other companies come under the same
group of BUKI.
QOQ and period earnings showed a
growth of 25.73% mainly due to
increase in earnings in BUKI by
120.50%.
Other companies such as SELI, SHAL,
GOOD and INDO recorded negative
earnings growth for the quarter.

Special Report: Earnings Insight |23 October 2014
9 | LOLC Securities Limited
0
1,000
2,000
3,000
3/6 Months Quarter
LKR
Mn
Earnings Growth
2013 2014
-200.00%
-100.00%
0.00%
100.00%
LGL LIOC VLL VPEL PAP HPWR
Gainers and Losers (Earnings Growth- Quarter)
100
120
140
160
180
9/23/13 12/23/13 3/23/14 6/23/14 9/23/14
Sector Index (12 months)
500
600
700
800
900
9/23/13 12/23/13 3/23/14 6/23/14 9/23/14
Sector Index (12 months)
-500
0
500
1,000
3/6 Months Quarter
LKR
Mn
Earnings Growth
2013 2014-1000.00%
0.00%
1000.00%
2000.00%
3000.00%
4000.00%
UDPL WATA TPL KGAL KOTA KVAL
Gainers and Losers (Earnings Growth - Quarter)
30%
12%
11% 10%
9%
28%
Earnings Contribution (Quarter)
WATA
MAL
ELPL
HAPU
UDPL
OTHERS
68%
19%
9%
2% 1% 1%
Earnings Contribution (Quarter)
LIOC
LGL
VPEL
VLL
FLCH
PAP
Plantations
Graph Set 15: Sector analysis
Source: CSE, Bloomberg, LOLC SEC Research
Power & Energy Graph Set 16: Sector analysis
Source: CSE, Bloomberg, LOLC SEC Research
Plantation sector has a market cap of LKR
27Bn (0.99% of the total market cap)
while WATA, KAHA, KVAL KGAL are the
big cap counters.
3/6 earnings improved by 138.49%
while quarter earnings increased
significantly.
UDPL, WATA and TPL generated highest
earnings growth for the quarter while
KGAL, KOTA and KVAL generated lowest
earnings growth due to the decline in
revenue caused by decrease in rubber
prices.
Main reason for UDPL’s significant profit
growth of 3546% is due to reduction in
cost of sales due to strategies
implemented to make operations more
effective and efficient during the period
under review.
Power and Energy sector has a market
cap of LKR 52Bn (1.90% of the market
cap) while LIOC, LGL and VPEL have the
biggest market caps.
Quarter and 3/6 months period
earnings dropped by 17.63% led by
decline in earnings in HPWR by
167.58%. HPWR generated a loss of
68.89 Mn , mainly owing to the loss of
Rs.77 million in its joint venture with
Heladhanavi.
Only LGL has achieved an earnings
growth for the quarter while other
counters have experienced a decline in
earnings growth.

Special Report: Earnings Insight |23 October 2014
10 | LOLC Securities Limited
-100.00%
-50.00%
0.00%
50.00%
100.00%
HUNT GEST EBCR
Gainers and Losers (Earnings Growth-Quarter)
-300
-200
-100
0
3/6 Months Quarter
LKR
Mn
Earnings Growth
2013 2014
-50.00%
0.00%
50.00%
100.00%
150.00%
200.00%
LPRT MSL CTBL JKL
Gainers and Losers (Earnings Growth- Quarter)
0
5000
10000
15000
20000
25000
30000
9/23/13 12/23/13 3/23/14 6/23/14 9/23/14
Sector Index (12 month)
0
5000
10000
15000
20000
25000
30000
9/23/13 12/23/13 3/23/14 6/23/14 9/23/14
Sector Index (12 months)
45
50
55
60
3/6 Months Quarter
LKR
Mn
Earnings Growth
2013 2014
76%
17%
7%
Earnings Contribution (Quarter)
JKL
CTBL
LPRT
93%
5% 2%
Revenue for the period
EBCR
HUNT
GEST
Services Graph Set 17: Sector analysis
Source: CSE, Bloomberg, LOLC SEC Research
Stores & Supplies
Graph Set 18: Sector analysis Source: CSE, Bloomberg, LOLC SEC Research
Services Sector has a market
capitalization of LKR 6.8Bn (0.25%),
while JKL and CTBL consist of highest
market cap of the sector.
Sector performance for the quarter as
well as for the period posted positive
growth.
LPRT generated the highest earnings
growth for the quarter with a profit of
LKR 6.266 Mn due to increase in revenue
and other income sources.
Market Capitalization of Stores &
Supplies sector amounts to LKR 5.5 Bn
while EBCR and HUNT being the big cap
counters of the sector.
Quarter earnings as well as 3/6
earnings showed a decrease in losses.
EBCR generated a loss of -86.28Mn due
to increase in admin, distribution,
finance and other expenses.
Note: PHAR’s revenue has not been considered since it is a small
figure when compared with other counters.
MSL has been ignored due to negative earnings contribution
during the quarter
Special Report: Earnings Insight |23 October 2014
11 | LOLC Securities Limited
100
150
200
250
09/23/13 12/23/13 03/23/14 06/23/14 09/23/14
Sector Index (12 months)
60%
40%
Earnings Contribution (Quarter)
SLTL
DIAL
11000
13000
15000
17000
9/23/13 12/23/13 3/23/14 6/23/14 9/23/14
Sector Index (12 months)
0
500
1,000
1,500
3/6 Months Quarter
LKR
Mn
Earnings Growth
2013 2014
0.00%
50.00%
100.00%
150.00%
200.00%
250.00%
DIAL SLTL
Gainers and Losers (Earnings Growth-Quarter)
0
2,000
4,000
6,000
8,000
3/6Months Quarter
LKR
Mn
Earnings Growth
2013 2014
45%
42%
11%
2%
Earnings Contribution (Quarter)
BRWN
SINS
CWM
CFT
-200.00%
-100.00%
0.00%
100.00%
RGEM SINS CFT BRWN EMER
Gainers and Losers (Earnings Growth- Quarter)
Telecommunication Graph Set 19: Sector analysis
Source: CSE, Bloomberg, LOLC SEC Research
Trading
Graph Set 20: Sector analysis
Source: CSE,
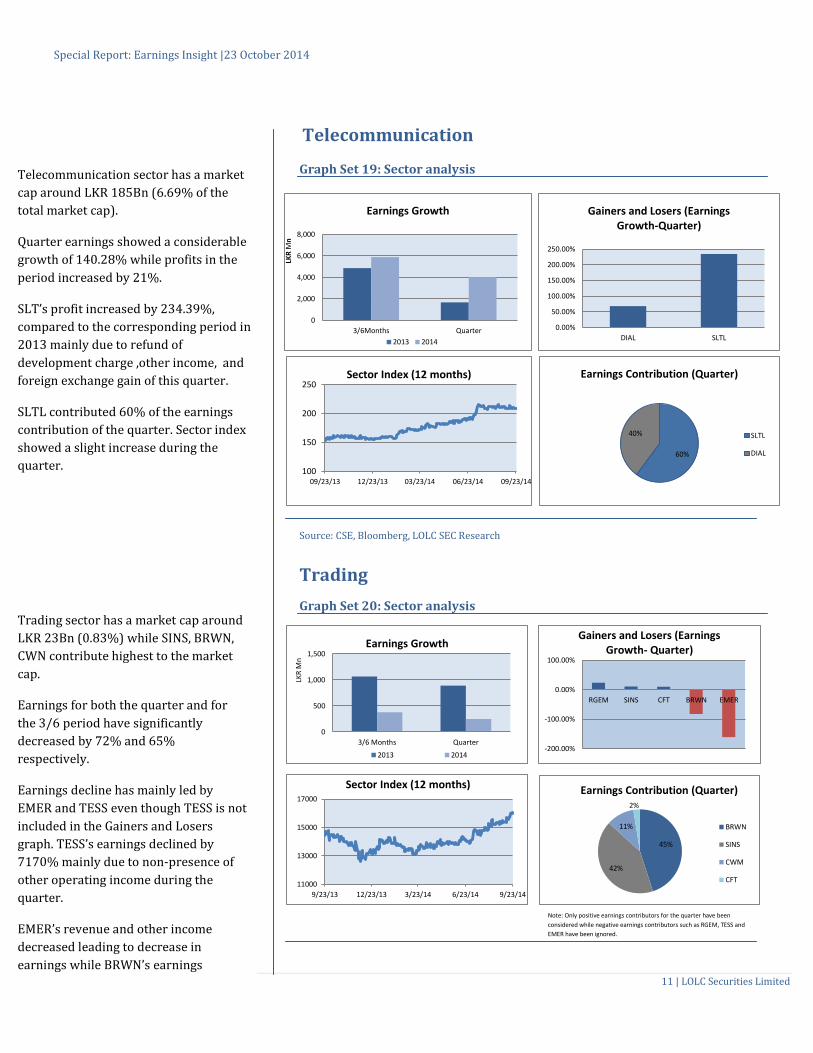
Telecommunication sector has a market
cap around LKR 185Bn (6.69% of the
total market cap).
Quarter earnings showed a considerable
growth of 140.28% while profits in the
period increased by 21%.
SLT’s profit increased by 234.39%,
compared to the corresponding period in
2013 mainly due to refund of
development charge ,other income, and
foreign exchange gain of this quarter.
SLTL contributed 60% of the earnings
contribution of the quarter. Sector index
showed a slight increase during the
quarter.
Trading sector has a market cap around
LKR 23Bn (0.83%) while SINS, BRWN,
CWN contribute highest to the market
cap.
Earnings for both the quarter and for
the 3/6 period have significantly
decreased by 72% and 65%
respectively.
Earnings decline has mainly led by
EMER and TESS even though TESS is not
included in the Gainers and Losers
graph. TESS’s earnings declined by
7170% mainly due to non-presence of
other operating income during the
quarter.
EMER’s revenue and other income
decreased leading to decrease in
earnings while BRWN’s earnings
decreased mainly due to decline in other
income, increase in other expenses and
negative fair valuation in the investment
properties.
Note: Only positive earnings contributors for the quarter have been
considered while negative earnings contributors such as RGEM, TESS and
EMER have been ignored.

Special Report: Earnings Insight |23 October 2014
12 | LOLC Securities Limited
Contact us
LOLC Securities Limited, a trading member of the Colombo Stock Exchange (CSE), is engaged in facilitating stock trading transactions at Colombo Stock Exchange,
providing investment research on Sri Lankan equity, providing investment planning advices with services such as portfolio construction & formulation of IPS
(Investment Policy Statement) and facilitating other investment opportunities in the country including private equity.
Disclaimer: This report is based on information from sources that LOLC Securities Limited believes to be reliable. Whilst reasonable care has been taken to ensure
accuracy of the information presented in the report, LOLC Securities Limited does not give a guarantee on the accuracy of the information presented in the paper nor
will take the responsibility on investment decisions taken based on the information provided by the report and hence LOLC Securities Limited nor its employees
accepts any liability whatsoever for any loss arising from investments decisions taken using the information provided in this paper. The reader also should note this
paper does not give recommendations to any particular category of investors and investor should consult investment advisors for further clarifications regarding risks
involved in investing in equity market. LOLC Securities Limited or its employees may or may not hold positions in the securities discussed in the report and the
information provided in the report should not be construed as a buy or sell instruction for any securities mentioned in the report.
LOLC SEC Research Reports are also available at Bloomberg LOLC <GO>
Head Office
LOLC Securities Limited
Level 18, West Tower,
World Trade Center
Colombo 01
Sri Lanka
Tel: +94 11 7880880
Fax: +94 11 2434771
Branches
Kurunegala Branch
No 06, 1st Floor,
Union Assurance Building,
Rajapilla Mawatha
Kurunegala,
Sri Lanka
Tel: +94 377 201221
Fax: +94 372 225511
Galle Branch
No 18,
Sri Dewamitta Mawatha,
Galle
Sri Lanka
Tel : +94 773 409243
Matara Branch
1st Floor,
E.H. Cooray Towers,
No.24,
Anagarika Dharmapala
Mawatha,
Matara, Sri Lanka
Tel: +94 414 936079
Sriyan Gurusinghe CEO/Managing Director
011 7880888 / 077 7891871 sriyang@ lolcsecurities.com
SALES Head Office
Maniesh Rodrigo Assistant General Manager 011 7880805 / 077 7896064 manieshr@ lolcsecurities.com
Samadhi Jayasinghe Manager Institutional Sales 011 7880806 / 077 3954993 samadhij@ lolcsecurities.com
Dinusha Gomes Assistant Manager – International Sales 011 7880812 / 077 1562193 dinushago@ lolcsecurities.com
Imesh Fernando Senior Investment Advisor 011 7880814 / 077 3954992 imeshf@ lolcsecurities.com
Balendiran Janegan Senior Investment Advisor 011 7880811 / 077 5619827 janeganb@ lolcsecurities.com
Naleen Sadeesh Investment Advisor 011 7880839 / 077 2383209 naleensa@ lolcsecurities.com
Damith Chaminda
Investment Advisor 011 7880819 / 077 3367313 damithc@ lolcsecurities.com
Dinuka Niwantha
Investment Advisor 011 7880838 / 077 3947928 dinukan@ lolcsecurities.com
Niraj Jayamanne Investment Advisor 011 7880813 / 077 5965645 [email protected]
Kurunegala Branch
Rohana Chandrasiri Assistant General Manager 037 7201221 / 077 3623001 rohanac@ lolcsecurities.com
Anurudda Rajakaruna Investment Advisor 037 7201221 / 077 3409464 anuruddhar@ lolcsecurities.com
Nuwan Fernando Investment Advisor 037 7201221 / 077 8365921 nuwanfe@ lolcsecurities.com
Galle Branch
Bimal Malinda Branch Head 091 7200852/ 077 3409243 bimalm@ lolcsecurities.com
Matara Branch
Lalinda Liyanapathirana Investment Advisor 041 4936079/ 077 3692257 lalindal@ lolcsecurities.com
Ahamed Aadil Investment Advisor 041 4936079/ 077 7538986 aadila@ lolcsecurities.com
RESEARCH
Shehan Bartholomeuz Head of Research 011 7880835 / 077 7699148 shehanb@ lolcsecurities.com
Damith Wasantha Research Analyst 011 7880837 / 077 7519416 damithwa@ lolcsecurities.com
Hiruni Perera Associate Research Analyst 011 7880809 / 077 4805784 hirunipe@ lolcsecurities.com
Rehan Ariyaratne Business Development Asosciate 011 7880831/ 0765446255 [email protected]