Embed Size (px)
Citation preview

CLINICAL ARTICLEJ Neurosurg 130:2016–2024, 2019
In today’s surgical treatment of low- and high-grade gliomas, a maximal safe tumor resection is regarded as the desirable goal of surgery.7,12,13 For WHO grade
II low-grade gliomas (LGGs), a growing body of evidence supports the positive prognostic impact of a maximized
resection on progression-free and overall survival.1,9, 14,32 However, the estimation of residual tumor after surgery to determine the extent of resection (EOR) remains challeng-ing in predominantly nonenhancing tumors and has been addressed very heterogeneously in the past. Moreover, the
ABBREVIATIONS ADC = apparent diffusion coefficient; CCC = concordance correlation coefficient; DWI = diffusion-weighted imaging; EOR = extent of resection; epMRI = early postoperative MRI; EM = expectation maximization; fuMRI = follow-up MRI; GTR = gross-total resection; IDH = isocitrate dehydrogenase; IQR = interquartile range; LGG = low-grade glioma; LOA = limits of agreement; MITK = medical imaging interaction toolkit; NWM = normal white matter; VOI = volume of interest.SUBMITTED November 27, 2017. ACCEPTED February 23, 2018.INCLUDE WHEN CITING Published online July 27, 2018; DOI: 10.3171/2018.2.JNS172951.
Early postoperative delineation of residual tumor after low-grade glioma resection by probabilistic quantification of diffusion-weighted imagingMoritz Scherer, MD,1 Christine Jungk, MD,1 Michael Götz, MSc, PhD,2 Philipp Kickingereder, MD,3 David Reuss, MD,4 Martin Bendszus, MD,3 Klaus Maier-Hein, MSc, PhD,2 and Andreas Unterberg, MD, PhD1
Departments of 1Neurosurgery, 3Neuroradiology, and 4Neuropathology, Heidelberg University Hospital; and 2Division of Medical Image Computing, German Cancer Research Center (DKFZ), Heidelberg, Germany
OBJECTIVE In WHO grade II low-grade gliomas (LGGs), early postoperative MRI (epMRI) may overestimate residual tumor on FLAIR sequences. Consequently, MRI at 3–6 months follow-up (fuMRI) is used for delineation of residual tumor. This study sought to evaluate if integration of apparent diffusion coefficient (ADC) maps permits an accurate esti-mation of residual tumor early on epMRI.METHODS From a consecutive cohort, 43 cases with an initial surgery for an LGG, and complete epMRI (< 72 hours after resection) and fuMRI including ADC maps, were retrospectively identified. Residual FLAIR hyperintense tumor was manually segmented on epMRI and corresponding ADC maps were coregistered. Using an expectation maximization algorithm, residual tumor segments were probabilistically clustered into areas of residual tumor, ischemia, or normal white matter (NWM) by fitting a mixture model of superimposed Gaussian curves to the ADC histogram. Tumor volumes from epMRI, clustering, and fuMRI were statistically compared and agreement analysis was performed.RESULTS Mean FLAIR hyperintensity suggesting residual tumor was significantly larger on epMRI compared to fuMRI (19.4 ± 16.5 ml vs 8.4 ± 10.2 ml, p < 0.0001). Probabilistic clustering of corresponding ADC histograms on epMRI identi-fied subsegments that were interpreted as mean residual tumor (7.6 ± 10.2 ml), ischemia (8.1 ± 5.9 ml), and NWM (3.7 ± 4.9 ml). Therefore, mean tumor quantification error between epMRI and fuMRI was significantly reduced (11.0 ± 10.6 ml vs -0.8 ± 3.7 ml, p < 0.0001). Mean clustered tumor volumes on epMRI were no longer significantly different from the fuMRI reference (7.6 ± 10.2 ml vs 8.4 ± 10.2 ml, p = 0.16). Correlation (Pearson r = 0.96, p < 0.0001), concordance correlation coefficient (0.89, 95% confidence interval 0.83), and Bland-Altman analysis suggested strong agreement between both measures after clustering.CONCLUSIONS Probabilistic segmentation of ADC maps facilitates accurate assessment of residual tumor within 72 hours after LGG resection. Multiparametric image analysis detected FLAIR signal alterations attributable to surgical trauma, which led to overestimation of residual LGG on epMRI compared to fuMRI. The prognostic value and clinical impact of this method has to be evaluated in larger case series in the future.https://thejns.org/doi/abs/10.3171/2018.2.JNS172951KEYWORDS low-grade glioma; extent of resection; postoperative imaging; diffusion-weighted imaging; medical image computing; oncology
J Neurosurg Volume 130 • June 20192016 ©AANS 2019, except where prohibited by US copyright law
Unauthenticated | Downloaded 04/01/22 09:54 PM UTC

J Neurosurg Volume 130 • June 2019 2017
Scherer et al.
impact of tumor biology on patient prognosis and treat-ment response—conveyed by molecular markers such as isocitrate dehydrogenase (IDH) mutations or 1p/19q code-letion—has advanced critically, yet has been infrequently assessed in surgical outcome studies.6,8,14,25
In nonenhancing gliomas, various studies suggest that residual tumor volume is prone to be overestimated on ear-ly postoperative MRI (< 72 hours postoperatively; epMRI) FLAIR sequences. This led to the practice of evaluating residual tumor on follow-up MRI (fuMRI) performed approximately 3–6 months after surgery to circumvent possible bias, which has been shown to more closely cor-relate with patient survival than epMRI.4,5,9,10,14,23 Image interpretation on fuMRI is anything but unequivocal, however, as delineating tumor progression from scarring, post-ischemic encephalomalacia, or postradiation injury can be difficult.4,5,31
Aberrant FLAIR hyperintensity predominantly re-sults from surgical trauma, which mixes with the hyper-intense signal from the residual tumor on epMRI. This corresponds to areas of restricted diffusion on diffusion-weighted imaging (DWI) present in 31%–64% of post-operative MRI.3,4,26,31,33 Apparent diffusion coefficient (ADC) maps can be derived from DWI and enable one to identify ischemic areas as well as to delineate various brain tumors and normal white matter (NWM), because ADC inversely correlates with cellular density.11,17,28,42 ADC in LGG is usually higher than NWM and shows less variability compared to high-grade tumors. This allows for LGG delineation and stratification of LGG subtypes as astrocytoma or oligodendroglioma according to respec-tive ADC characteristics.16,36
We hypothesized that, using additional information conveyed by DWI, epMRI FLAIR hyperintensity can be corrected for the effects of surgical trauma so that an accu-rate estimation of residual tumor can already be achieved early after LGG resection. Using a probabilistic approach, we clustered corresponding ADC histograms of epMRI FLAIR hyperintense areas as residual tumor, NWM, or is-chemia and compared the corrected tumor volumes to the results from fuMRI acquired approximately 3–6 months after surgery.
MethodsPatient Cohort
Our IRB approved this retrospective study, and the requirement for patient informed consent was waived. All adult patients (age > 18 years) with newly diagnosed, histologically confirmed WHO grade II gliomas treated by microneurosurgical tumor resection at the Depart-ment of Neurosurgery, University Hospital Heidelberg, from 2004–2013 were screened (n = 83). Eligible patients were selected if preoperative MRI, epMRI acquired < 72 hours after surgery, and fuMRI at 3–6 months after sur-gery was available (n = 48). Required sequences were pre/postcontrast T1- and T2-weighted FLAIR imaging for all cases. DWI sequences were mandatory for epMRI. Only primary tumor resections were included in the analysis. Cases with early adjuvant treatment (radiotherapy and/or chemotherapy) starting prior to fuMRI were excluded (n =
5). Using these criteria, a total of 43 cases were included in our analysis.
Medical chart review was performed, including clinical parameters (sex, age at initial diagnosis), tumor location (side, lobe, eloquence), and treatment history (resection, radiation, chemotherapy).
Tumor ResectionsMicroneurosurgical tumor resections were performed
by experienced neurosurgeons with the aid of neuronavi-gation (all cases) and intraoperative MRI (n = 31, 72%). The planned EOR was extracted from operating room records or retrospectively assessed by experienced neuro-surgeons (M.S. and C.J.) in cases in which records were inconclusive. Only brain regions directly associated with motor or speech function were regarded as eloquent.
Imaging ParametersPreoperative MRI and regular follow-up MRI were
performed on 3-T and 1.5-T MRI machines (Verio, Trio, or Symphony; Siemens). Intraoperative MRI was performed on a 1.5-T MR machine (Espree, Siemens). Standard imag-ing protocols included acquisition of T1-weighted magne-tization prepared rapid gradient echo (MPRAGE; 3D sag-ittal or axial, TI 900–1100 msec, TE 3–4 msec, TR 1710–2250 msec, FA 15°) before and after gadolinium-based contrast agent application (gadoteric acid [Gd-DOTA]), T2-weighted turbo spine echo (2D axial, TE 85–88 msec, TR 2740–5950 msec, section thickness 5 mm, spacing 5.5 mm), and T2-weighted FLAIR (2D axial, TI 2400–2500 msec, TE 85–135 msec, TR 8500–10000 msec, section thickness 5 mm, spacing 5.5 mm). DWI was performed using a single-shot, spin-echo, echo-planar sequence with the following parameters: TE 90 msec, TR 5300 msec, FA 90°, slice thickness 5 mm. Diffusion-sensitizing gradients were applied sequentially in the x, y, and z directions with b-values of 0 and 1000–1200 s/mm2. Apparent diffusion coefficient (ADC) maps were automatically calculated by the manufacturer’s software.
Image Segmentation and CoregistrationImage analysis was performed using the Medical Im-
aging Interaction Toolkit (MITK), a free open-source re-search platform for medical image analysis (www.mitk.org).
Segmentation of LGG tumor volumes was performed according to FLAIR sequences for preoperative MRI, epMRI, and fuMRI. Intraoperative MR images were not subject to analysis in this study. Tumor segments were traced manually with a semiautomatic region-growing tool on axial sections and were manually corrected in cor-onal and sagittal reconstructions. Volumes were retrieved by summation of axial segments using the image statistics app in MITK (in milliliters [cm3]).
For analysis of DWI on epMRI, FLAIR sequences were coregistered to corresponding ADC maps. This was performed using a rigid registration algorithm based on mutual information with linear interpolation included in MITK. This approach has been reported to be data in-dependent and to yield robust and plausible geometrical
Unauthenticated | Downloaded 04/01/22 09:54 PM UTC

Scherer et al.
J Neurosurg Volume 130 • June 20192018
alignments in multimodal imaging environments.20,24 All registrations were checked for accuracy to verify valid coregistration.
Histogram AnalysisThe segmentation of FLAIR hyperintense areas sug-
gestive for residual tumor on epMRI was used as a volume of interest (VOI) for analysis of corresponding and coreg-istered ADC maps. For each VOI, an ADC histogram was created and a subclassification of tissue composing the histogram was attempted. We chose a probabilistic approach to cluster the histogram into 3 different tissue classes according to their (increasing) ADC grayscale val-ue. We termed these tissue classes 1) ischemia, 2) NWM, and 3) residual tumor for this study. This methodology has been described previously by Simon et al., who devel-oped it for separation and quantification of heterogeneous regions in gliomas according to their ADC and have ex-tensively shown the reliability and reproducibility of this method.30,34 Subsequently, their work was implemented into the partial volume analysis app within MITK that was used for this analysis.
Probabilistic ClassificationFor the probabilistic classification approach, it was
assumed that the distribution of the ADC among the ex-
pected tissue classes of ischemia and residual tumor could be separated into a superposition of two Gaussian curves. This would allow for calculation of the probability for each voxel to belong to either tissue class.
Using an expectation maximization (EM) algorithm, a mixture model was calculated using two superpositioned (superimposed) Gaussian curves to find the desired tis-sue classes of ischemia and residual tumor. Additionally, a partial volume class (NWM) was created that included inconclusively clustered voxels resulting from signal over-lap among ischemia and residual tumor.30 The clustering approach is illustrated in Fig. 1C.
According to the ADC grayscale value, the EM algo-rithm produced posterior probabilities for each voxel to belong to either tissue class. Each voxel was weighted ac-cording to its posterior probability and the weighted sum of voxels was used to calculate the mean ADC for each class and to quantify the volume of each class. An exam-ple for image processing and analysis in given in Fig. 1.
ADC NormalizationProbabilistic histogram analysis was performed inde-
pendently for each case. To compare ADC values of re-trieved tissue classes within the study cohort, normaliza-tion was performed using a control VOI on the contralat-eral supratentorial NWM, preferably in the frontal lobe.
FIG. 1. Illustration of image analysis workflow in a left-sided temporoinsular LGG. A: Preoperative FLAIR image with segmented tumor. B: Coregistration of epMRI FLAIR (red) with corresponding ADC maps (green). C: epMRI with segmentation of FLAIR hy-perintensity. D: Corresponding ADC map with projected segments from FLAIR defining the VOI (red outline) for histogram analy-sis. E: fuMRI FLAIR. Note the possible postischemic encephalomalacia (green arrowhead) in contrast to suspected residual tumor (red arrowhead) in accordance with clustering results on epMRI. F: Probabilistic clustering of ADC histograms in VOI. Black line = original ADC histogram; blue line = sum of clustered Gaussian curves illustrating coherence to the original ADC histogram; green Gaussian curve = clustering for ischemia (low ADC); red Gaussian curve = clustering for residual tumor (high ADC); gray Gaussian curve = clustering for NWM (ambient ADC). C.1 and D.1: Clustering results projected on corresponding source sequences C and D (see above for color coding). Figure is available in color online only.
Unauthenticated | Downloaded 04/01/22 09:54 PM UTC

J Neurosurg Volume 130 • June 2019 2019
Scherer et al.
Mean ADC from the control VOI was used to create ADC ratios for each clustered tissue class for each patient (mean tissue class ADC/mean ADC of contralateral NWM).
Additionally, DWI was evaluated for signs of persistent areas of restricted diffusion on fuMRI, when available. Early postoperative tumor volumes retrieved from proba-bilistic clustering were statistically compared to the re-spective volumes according to regular epMRI and fuMRI FLAIR. Follow-up MRI was considered the reference measure for estimation of residual tumor in this study.
Statistical AnalysisTumor volumes were analyzed using standard descrip-
tive statistics. Limits of agreement (LOA) were calculated and Bland-Altman plots were drawn to assess agreement among different approaches to tumor quantification. Cor-relation and agreement were further assessed by Pear-son correlation coefficients and concordance correlation coefficients (CCCs). For the estimates of the CCC, lower 1-sided 95% confidence intervals were calculated. A re-peated measures ANOVA (followed by the Bonferroni multiple comparison test) and paired t-tests were used to test for differences in measured volumes. Those p values < 0.05 were considered statistically significant. The analy-ses were conducted using Prism software (version 5.0c, GraphPad Inc.).
ResultsDemographics
After identification of cases based on histopathology (WHO grade II glioma) and completeness of postopera-tive imaging, a total of 43 patients (20 women and 23 men) with a median age of 39 years (range 18–58 years) were included in the analysis. This LGG cohort comprised 24 astrocytomas, 15 oligodendrogliomas, and 4 oligoastrocy-tomas according to conventional histopathology. Molecu-lar diagnostics showed IDH mutations in 37 of 43 cases (86%). 1p/19q codeletion was found in 4 of 4 oligoastro-cytomas, which lead to their allocation as oligodendro-gliomas based on the modern integrated classification of gliomas in the study.27
The majority of tumors were located in the frontal lobe (n = 24, 56%) with an even distribution between left and right hemispheres. Fourteen tumors (33%) were regarded as eloquent in relation to motor or language function. All tumors were predominantly nonenhancing on MRI with 13 cases (30%) showing focal contrast enhancement. Gross-total resection (GTR) of the tumor was planned in 30 cases (70%). Postoperative imaging was performed on median day 2 after surgery (interquartile range [IQR] 1–3 days). Follow-up imaging was performed at a median of 111 days after surgery (IQR 96–156 days), which is consistent with standard imaging protocols after glioma resection.40 Table 1 gives an overview of the patient demographic data.
Volumetric DataMean preoperative tumor volume according to FLAIR
was 32.8 ± 27.0 ml. FLAIR hyperintensity suggestive for residual tumor was 19.4 ± 16.5 ml on epMRI and 8.4 ± 10.2 ml on fuMRI. Mean FLAIR signal alteration was
significantly larger on epMRI compared to fuMRI (p < 0.0001). This observation initially lead to our hypothesis that DWI could be suitable to define tissue subclasses within epMRI FLAIR hyperintensity in order to adjust for signs of surgical trauma and to prevent overestimation of residual tumor on epMRI.
The timing of epMRI (postoperative day 1, 2, or 3) did not affect mean epMRI volumes (p = 0.37). FLAIR vol-ume decreased from epMRI to fuMRI in 42 of 43 cases (98%). An increase in FLAIR volume from epMRI to fuMRI suggested progression in 1 of 43 cases (2%).
Mean overall EOR according to fuMRI was 76% (range 36%–100%), and 82% (range 55%–100%) in cases in which GTR was planned. In this cohort, oligodendro-gliomas were the larger tumors compared to astrocytomas concerning preoperative (p = 0.1), early postoperative (p = 0.4), and follow-up tumor volumes (p = 0.09), but without reaching statistical significance. Table 2 illustrates results from the volumetric analysis in this study.
Probabilistic ClusteringProbabilistic clustering was applied to distinguish re-
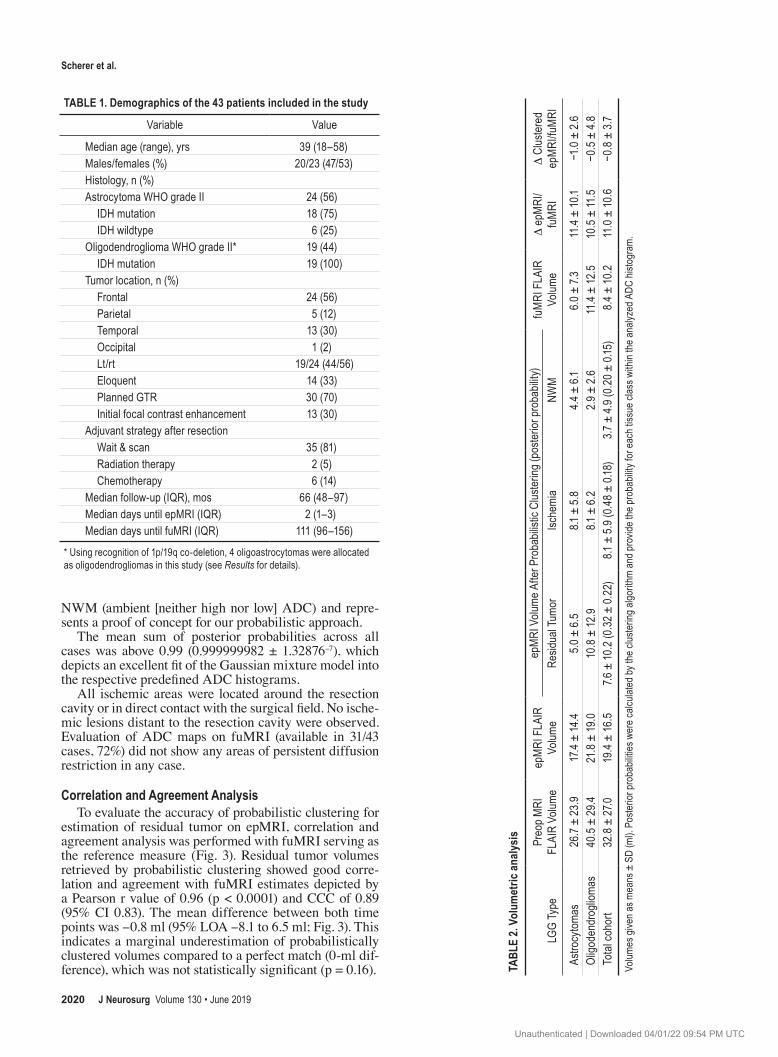
sidual tumor from ischemia and NWM on epMRI ADC maps. Mean posterior probabilities, which describe the probability/proportion for each tissue within the histo-gram, were 0.32 ± 0.22 for residual tumor, 0.48 ± 0.18 for ischemia, and 0.20 ± 0.15 for NWM (Table 2). This indicates that almost half of early postoperative FLAIR hyperintensity could be assigned to postoperative ische-mia while approximately 30% was suspicious for residual low-grade tumor; 20% of FLAIR hyperintensity showed ADCs comparable to NWM and could not be classified as either tissue.
To express volume differences, the weighted sum of voxels for each tissue class was multiplied by the respec-tive voxel volume. This subdivided mean initial epMRI FLAIR volume of 19.4 ± 16.5 ml into segments of mean ischemic volume of 8.1 ± 5.9 ml, mean residual tumor vol-ume of 7.6 ± 10.2 ml, and mean NWM volume of 3.7 ± 4.9 ml (Table 2).
As a key finding, probabilistic clustering significantly reduced the quantification error for residual tumor be-tween epMRI and fuMRI from 11.0 ± 10.6 ml (see above) to -0.8 ± 3.7 ml (p < 0.0001). After probabilistic cluster-ing, residual tumor volume on epMRI no longer showed a significant difference compared with the fuMRI reference (7.6 ± 10.2 ml vs 8.4 ± 10.2 ml, p = 0.16; Fig. 2).
Coherence of Probabilistic ClusteringProbabilistic analysis of ADC histograms defined three
tissue subclasses for each histogram in all cases in this study. After normalization of ADC values with their re-spective contralateral NWM, the mean ADC ratio was 0.76 ± 0.23 for ischemia, 1.11 ± 0.31 for NWM, and 1.48 ± 0.46 for residual tumor. Mean ADC ratios were signifi-cantly different for all three tissue classes (p < 0.0001) and matched well with respective tissue-specific ADC measures published in the literature.15–17,28,31,36 This de-picts successful clustering into distinct areas of ischemia (low ADC) and residual tumor (high ADC) in relation to
Unauthenticated | Downloaded 04/01/22 09:54 PM UTC
Scherer et al.
J Neurosurg Volume 130 • June 20192020
NWM (ambient [neither high nor low] ADC) and repre-sents a proof of concept for our probabilistic approach.
The mean sum of posterior probabilities across all cases was above 0.99 (0.999999982 ± 1.32876-7), which depicts an excellent fit of the Gaussian mixture model into the respective predefined ADC histograms.
All ischemic areas were located around the resection cavity or in direct contact with the surgical field. No ische-mic lesions distant to the resection cavity were observed. Evaluation of ADC maps on fuMRI (available in 31/43 cases, 72%) did not show any areas of persistent diffusion restriction in any case.
Correlation and Agreement AnalysisTo evaluate the accuracy of probabilistic clustering for
estimation of residual tumor on epMRI, correlation and agreement analysis was performed with fuMRI serving as the reference measure (Fig. 3). Residual tumor volumes retrieved by probabilistic clustering showed good corre-lation and agreement with fuMRI estimates depicted by a Pearson r value of 0.96 (p < 0.0001) and CCC of 0.89 (95% CI 0.83). The mean difference between both time points was -0.8 ml (95% LOA -8.1 to 6.5 ml; Fig. 3). This indicates a marginal underestimation of probabilistically clustered volumes compared to a perfect match (0-ml dif-ference), which was not statistically significant (p = 0.16).
TABLE 1. Demographics of the 43 patients included in the study
Variable Value
Median age (range), yrs 39 (18–58)Males/females (%) 20/23 (47/53)Histology, n (%)Astrocytoma WHO grade II 24 (56) IDH mutation 18 (75) IDH wildtype 6 (25)Oligodendroglioma WHO grade II* 19 (44) IDH mutation 19 (100)Tumor location, n (%) Frontal 24 (56) Parietal 5 (12) Temporal 13 (30) Occipital 1 (2) Lt/rt 19/24 (44/56) Eloquent 14 (33) Planned GTR 30 (70) Initial focal contrast enhancement 13 (30)Adjuvant strategy after resection Wait & scan 35 (81) Radiation therapy 2 (5) Chemotherapy 6 (14)Median follow-up (IQR), mos 66 (48–97)Median days until epMRI (IQR) 2 (1–3)Median days until fuMRI (IQR) 111 (96–156)
* Using recognition of 1p/19q co-deletion, 4 oligoastrocytomas were allocated as oligodendrogliomas in this study (see Results for details).
TABL
E 2.
Volu
met
ric an
alysis
LGG
Type
Preo
p MRI
FL
AIR
Volum
eep
MRI
FLA
IR
Volum
eep
MRI
Volu
me A
fter P
roba
bilist
ic Cl
uster
ing (p
oster
ior pr
obab
ility)
fuM
RI F
LAIR
Vo
lume
D ep
MRI
/fu
MRI
D C
luster
ed
epM
RI/fu
MRI
Resid
ual T
umor
Ische
mia
NWM
Astro
cytom
as26
.7 ±
23.9
17.4
± 14
.45.
0 ± 6.
58.1
± 5.
84.4
± 6.
16.0
± 7.
311
.4 ±
10.1
−1.0
± 2.
6Ol
igode
ndro
gliom
as40
.5 ±
29.4
21.8
± 19
.010
.8 ±
12.9
8.1 ±
6.2
2.9 ±
2.6
11.4
± 12
.510
.5 ±
11.5
−0.5
± 4.
8To
tal c
ohor
t32
.8 ±
27.0
19.4
± 16
.57.6
± 10
.2 (0
.32 ±
0.22
)8.1
± 5.
9 (0.4
8 ± 0.
18)
3.7 ±
4.9 (
0.20
± 0.
15)
8.4 ±
10.2
11.0
± 10
.6−0
.8 ±
3.7
Volum
es gi
ven a
s mea
ns ±
SD
(ml).
Poste
rior p
roba
bilitie
s wer
e calc
ulate
d by t
he cl
uste
ring a
lgorit
hm an
d pro
vide t
he pr
obab
ility f
or ea
ch tis
sue c
lass w
ithin
the a
nalyz
ed A
DC hi
stogr
am.
Unauthenticated | Downloaded 04/01/22 09:54 PM UTC

J Neurosurg Volume 130 • June 2019 2021
Scherer et al.
As shown in the Bland-Altman plot in Fig. 3, the amount of residual tumor volume was a driving force of deviation between both estimates analyzed. The largest tumors (> 10 ml residual volume) produced the highest differences, which affected the 95% LOA margins. Agreement be-tween clustered epMRI and fuMRI values by Pearson cor-relation coefficient, CCC, and Bland-Altman analysis in astrocytomas (r = 0.93, p < 0.0001; CCC = 0.92, 95% CI 0.85; mean difference = -1.0 ml, 95% LOA -6.2 to 4.2 ml) was comparable to agreement in oligodendrogliomas (r = 0.95, p < 0.0001; CCC = 0.84, 95% CI = 0.71; mean differ-ence = –0.5 ml, 95% LOA -9.9 to 8.9 ml).
DiscussionHypothesizing that DWI may already help to achieve
reliable estimations of residual tumor volume early after LGG resection, we have used a probabilistic approach to cluster ADC maps on epMRI. Areas of postoperative FLAIR hyperintensity suggestive for residual tumor were segmented, and clustering of corresponding ADC histo-grams helped to delineate residual tumor. Initially, residu-al FLAIR volumes differed significantly between epMRI and fuMRI. Through probabilistic clustering, however, ef-fects of postoperative ischemia evident on epMRI could successfully be adjusted for, leading to close approxima-tion of residual tumor volume to the volume observed on fuMRI. Correlation and agreement analysis with fuMRI underscore the feasibility of tumor volume estimation ear-ly after LGG resection.
As a consequence of the surgical trauma, MRI signal alterations attributable to a postresection injury have been described as time-dependent contrast enhancements on T1 and expression of FLAIR hyperintensity on MRI early af-
ter surgery.2,4,10,31,37 Over the course of time, scarring and the development of postischemic encephalomalacia or postradiation injury render accurate delineation of residual tumor or detection of tumor progression challenging, espe-cially in nonenhancing LGGs.5,31 Given the changing para-digms for the timing of adjuvant treatment in patients with LGG and the increasing role of molecular markers for di-agnosis and prognosis in LGG, the necessity to achieve accurate estimates of residual tumor early after resection might arise in the near future to allow for comprehensive risk stratification of patients after surgery.14,25,27,38,39 Con-sidering these current limitations and future aspects, we present a method that accounts for the postresection injury to already achieve accurate estimates of residual tumor early (within 72 hours) after resection of an LGG.
In general terms, a probabilistic segmentation approach increases objectivity in quantification of LGG compared to manual measurements, especially in areas of tissue inhomogeneity and blurred tissue margins as they are typically found in the early postoperative setting.30,34 By analyzing ADC histograms on epMRI, ischemic lesions could be readily identified and deducted from the total postoperative FLAIR volume. By means of the clustering algorithm, ischemic lesions were detected in all cases in this study and made up 48% ± 18% of all FLAIR hyperin-tensity on epMRI.
Compared to other series that divergently report ische-mic lesions in 25%–75% of LGG resections, the incidence of ischemia was high in this study. We attribute this obser-vation to our probabilistic approach that objectively aimed to identify any nontumor area based on the respective lower ADC. Despite the high incidence, however, mean ischemic volume was comparable to other reports on early postoperative ischemia.3,10,31
At b-values of 1000 s/mm2, ADC ranges are reported from 1000–1500 μm2/s for LGG and between 700 and 780 μm2/s for NWM in previous studies. This implies that ADC in LGG is higher compared to NWM by a factor of about 1.3–2.4.15–17,28,36 ADC for ischemia and stroke is reported to be approximately 500 μm2/s, which is inferior to NWM by a factor of 0.7.19,31 Accordingly, ADC of our clustered estimates for residual tumor (mean ADC ratio 1.48 ± 0.46) and ischemia (mean ADC ratio of 0.76 ± 0.23) matched well with the expected ranges for each respec-tive tissue class we sought to identify, which reflects co-herence of our clustering results. Tumor volumes retrieved by probabilistic clustering were statistically comparable to the reference measured on fuMRI, which illustrates that our approach mitigated previous limitations for early and accurate measurement of residual tumor after LGG resec-tion (Fig. 2). The definition of NWM as a separate mixture class for inconclusively clustered voxels allowed us to take partial volume effects into account and enabled us to com-pensate for segmentation errors at the tumor margins, as well as for minor misalignments during coregistration of sequences.30
Edema associated with infiltrative LGGs also appears as FLAIR hyperintensity and might also contribute to postoperative volume overestimation. However, edema has only played a minor role in LGG outcome studies be-cause its delineation from LGG tumor or infiltrated tissue
FIG. 2. Box-and-whisker plot showing quantification of tumor volumes. epMRI tumor volumes were significantly different from both fuMRI and clustered epMRI volumes (p < 0.0001, repeated measures ANOVA). No significant difference (n.s.) was found between fuMRI and clustered epMRI volumes (Bonferroni’s multiple comparison test). + = mean tumor volume.
Unauthenticated | Downloaded 04/01/22 09:54 PM UTC

Scherer et al.
J Neurosurg Volume 130 • June 20192022
remains challenging, even with advanced imaging.22,29,41 Rather, FLAIR hyperintensity in general, without consid-eration of its subcompartments, is typically used to show survival associations.9,14,32 Nevertheless, our clustering algorithm should be capable of adequately considering edema on epMRI. Vasogenic edema is usually considered the predominant form of edema in brain tumors and shows increased diffusion corresponding to high ADC.21,35 Cyto-toxic edema, in contrast, has been shown to be the major form of edema in acute traumatic lesions of the brain and ischemia, which applies to the early postoperative setting. This form of edema presents with restricted diffusion and low ADC.21 Therefore, the vasogenic component of ede-ma, which should remain stable during the early postoper-ative phase, should be incorporated into the tumor cluster in our analysis. Any formation of new cytotoxic edema resulting from the surgical trauma or postoperative ische-mia is expected to be clustered as ischemia according to its different ADC characteristics. This implies that probabi-listic clustering should identify and account for postoper-ative edema as a transient cause of FLAIR hyperintensity after LGG resection.
Ultimately, our clustering analysis of ADC histograms conclusively defined tissue subclasses according to ADC grayscale values. Bland-Altman comparisons as well as correlation statistics for clustered epMRI and fuMRI vol-umes suggest sufficient agreement between both measure-ments in order to accept our initial hypothesis that tumor estimation is already feasible early after LGG resection, with the additional information conveyed by DWI.
As these are preliminary observations designed to de-liver a proof of concept, there are certain limitations to our results. First, this is an analysis of retrospective data. Case selection was performed from a consecutive surgical LGG cohort according to completeness of postoperative imag-ing studies. This implies the possibility of selection bias toward cases with more extensive resections, opposed to partial resections or tumor debulkings, in which postop-
erative imaging showing the obvious (i.e., residual tumor) was frequently incomplete and lead to exclusion from our retrospective study. Albeit with possible selection bias, our study illustrates how to facilitate the delineation of tumor margins from postresection injury for a wide spectrum of residual tumor volumes ranging from 1.4 to 65 ml on epMRI. Second, survival analysis could not reasonably be performed in this cohort due to the small sample size in combination with the heterogeneity of histopathology and molecular markers that critically influence survival.6,8,25 Our selection criteria based on imaging parameters im-plies a strong bias for survival analysis in this regard, and furthermore yielded subgroups too small to calculate mul-tivariate models even after a median follow-up of more than 5 years. The effort to separately analyze astrocyto-mas and oligodendrogliomas in our study aimed to illus-trate and support the general applicability of our image analysis methodology in nonenhancing LGG, independent from histopathology. Consequently, further evaluation of the prognostic value of our method will require a larger clinical series in the future.
In its current form, our clustering method should pri-marily be applied to circumscribed tumor remnants around the resection cavity. As residual tumor volumes increase in size, the natural intratumoral inhomogeneity of ADCs gains significance for the clustering algorithm and can lead to classification errors.17,30,36 This, in part, ex-plains our observation made in agreement analysis, that tumor size was the main driving force for persisting dif-ferences between epMRI and fuMRI even after clustering (Fig. 3). To also generalize our method’s applicability to large tumor remnants, ADC histograms of the preopera-tive tumor would have to be implemented into the cluster-ing algorithm to account for the respective intratumoral ADC signature.
After clustering of epMRI, we attempted to quantify the spatial agreement of clustering results with residual tumor on fuMRI to further support our data. Tissue reorganiza-
FIG. 3. Agreement analysis for clustered epMRI tumor volumes and fuMRI. A: Pearson correlation. B: Bland-Altman plot. Note the split axes for tumor volumes.
Unauthenticated | Downloaded 04/01/22 09:54 PM UTC

J Neurosurg Volume 130 • June 2019 2023
Scherer et al.
tion and parenchymal involution occurring from surgery until fuMRI induced tissue distortion too large to account for by rigid registration algorithms, however (see Fig. 1C vs 1E for illustration).5,10 This precluded further evaluation of spatial overlap of segments and limited our presentation of data to quantitative comparison of agreement.
Tumor progression occurring from epMRI to fuMRI could be a source of bias for our agreement analysis.5 In this series, only 1 case showed increase of FLAIR hyper-intensity from epMRI to fuMRI, which did not affect the overall conclusion of this work, however.
Beyond this current analysis, probabilistic clustering of epMRI could also facilitate the detection of LGG pro-gression by identifying certain regions at risk for focused evaluation on later follow-up imaging. In the same man-ner, clustering could have implications for planning of postoperative radiotherapy as it might provide additional information about residual FLAIR hyperintensity helping to focus radiation.
The results of this study highlight the need to assess residual tumor after LGG resection, according to multiple parameters. We point out that areas of high ADC around the resection cavity on epMRI more closely correlate with the amount of residual tumor than FLAIR hyperintensity alone. Our analysis involved a substantial amount of im-age processing, however, which limits its clinical applica-bility in the current form. Along with the developments of automated image processing and analysis, we seek to streamline our image analysis and minimize user interac-tion in order to make probabilistic clustering more suitable for daily practice. In clinical routine, multiparametric ra-diological profiling of brain tumors, called radiomics, will help to derive adjusted survival stratifications and clinical decision support systems.18
ConclusionsProbabilistic segmentation of ADC maps facilitates ac-
curate assessment of residual tumor within 72 hours after LGG resection. Multiparametric image analysis detected FLAIR signal alterations attributable to surgical trauma, which led to overestimation of residual LGG tumor on epMRI compared with fuMRI. The prognostic value and clinical impact of this method need to be evaluated in larg-er case series in the future.
References 1. Ahmadi R, Dictus C, Hartmann C, Zürn O, Edler L, Hart-
mann M, et al: Long-term outcome and survival of surgically treated supratentorial low-grade glioma in adult patients. Acta Neurochir (Wien) 151:1359–1365, 2009
2. Albert FK, Forsting M, Sartor K, Adams HP, Kunze S: Early postoperative magnetic resonance imaging after resection of malignant glioma: objective evaluation of residual tumor and its influence on regrowth and prognosis. Neurosurgery 34:45–61, 1994
3. Bander ED, Jones SH, Kovanlikaya I, Schwartz TH: Util-ity of tubular retractors to minimize surgical brain injury in the removal of deep intraparenchymal lesions: a quantitative analysis of FLAIR hyperintensity and apparent diffusion coefficient maps. J Neurosurg 124:1053–1060, 2016
4. Belhawi SMK, Hoefnagels FWA, Baaijen JC, Aliaga ES, Reijneveld JC, Heimans JJ, et al: Early postoperative MRI
overestimates residual tumour after resection of gliomas with no or minimal enhancement. Eur Radiol 21:1526–1534, 2011
5. Bette S, Kaesmacher J, Huber T, Delbridge C, Ringel F, Boeckh-Behrens T, et al: value of early postoperative FLAIR volume dynamic in glioma with no or minimal enhancement. World Neurosurg 91:548–559, 559.e1, 2016
6. Brat DJ, Verhaak RGW, Aldape KD, Yung WKA, Salama SR, Cooper LAD, et al: Comprehensive, integrative genomic analysis of diffuse lower-grade gliomas. N Engl J Med 372:2481–2498, 2015
7. Brown TJ, Brennan MC, Li M, Church EW, Brandmeir NJ, Rakszawski KL, et al: Association of the extent of resection with survival in glioblastoma: a systematic review and meta-analysis. JAMA Oncol 2:1460–1469, 2016
8. Claus EB, Walsh KM, Wiencke JK, Molinaro AM, Wiemels JL, Schildkraut JM, et al: Survival and low-grade glioma: the emergence of genetic information. Neurosurg Focus 38(1):E6, 2015
9. Coburger J, Merkel A, Scherer M, Schwartz F, Gessler F, Roder C, et al: Low-grade glioma surgery in intraopera-tive magnetic resonance imaging: results of a multicenter retrospective assessment of the German Study Group for Intraoperative Magnetic Resonance Imaging. Neurosurgery 78:775–786, 2016
10. Gempt J, Förschler A, Buchmann N, Pape H, Ryang YM, Krieg SM, et al: Postoperative ischemic changes following resection of newly diagnosed and recurrent gliomas and their clinical relevance. J Neurosurg 118:801–808, 2013
11. Han H, Han C, Wu X, Zhong S, Zhuang X, Tan G, et al: Pre-operative grading of supratentorial nonenhancing gliomas by high b-value diffusion-weighted 3 T magnetic resonance imaging. J Neurooncol 133:147–154, 2017
12. Hervey-Jumper SL, Berger MS: Maximizing safe resection of low- and high-grade glioma. J Neurooncol 130:269–282, 2016
13. Hervey-Jumper SL, Berger MS: Role of surgical resection in low- and high-grade gliomas. Curr Treat Options Neurol 16:284, 2014
14. Jungk C, Scherer M, Mock A, Capper D, Radbruch A, von Deimling A, et al: Prognostic value of the extent of resection in supratentorial WHO grade II astrocytomas stratified for IDH1 mutation status: a single-center volumetric analysis. J Neurooncol 129:319–328, 2016
15. Kang Y, Choi SH, Kim YJ, Kim KG, Sohn CH, Kim JH, et al: Gliomas: Histogram analysis of apparent diffusion coeffi-cient maps with standard- or high-b-value diffusion-weighted MR imaging—correlation with tumor grade. Radiology 261:882–890, 2011
16. Khayal IS, McKnight TR, McGue C, Vandenberg S, Lambo-rn KR, Chang SM, et al: Apparent diffusion coefficient and fractional anisotropy of newly diagnosed grade II gliomas. NMR Biomed 22:449–455, 2009
17. Khayal IS, Nelson SJ: Characterization of low-grade gliomas using RGB color maps derived from ADC histograms. J Magn Reson Imaging 30:209–213, 2009
18. Kickingereder P, Burth S, Wick A, Götz M, Eidel O, Schlem-mer HP, et al: Radiomic profiling of glioblastoma: identify-ing an imaging predictor of patient survival with improved performance over established clinical and radiologic risk models. Radiology 280:880–889, 2016
19. Lopez-Mejia M, Roldan-Valadez E: Comparisons of apparent diffusion coefficient values in penumbra, infarct, and normal brain regions in acute ischemic stroke: confirmatory data us-ing bootstrap confidence intervals, analysis of variance, and analysis of means. J Stroke Cerebrovasc Dis 25:515–522, 2016
20. Maes F, Collignon A, Vandermeulen D, Marchal G, Suetens P: Multimodality image registration by maximization of
Unauthenticated | Downloaded 04/01/22 09:54 PM UTC
Scherer et al.
J Neurosurg Volume 130 • June 20192024
mutual information. IEEE Trans Med Imaging 16:187–198, 1997
21. Marmarou A: A review of progress in understanding the pathophysiology and treatment of brain edema. Neurosurg Focus 22(5):E1, 2007
22. Morita K, Matsuzawa H, Fujii Y, Tanaka R, Kwee IL, Nakada T: Diffusion tensor analysis of peritumoral edema using lambda chart analysis indicative of the heterogeneity of the microstructure within edema. J Neurosurg 102:336–341, 2005
23. Pala A, Brand C, Kapapa T, Hlavac M, König R, Schmitz B, et al: The value of intraoperative and early postoperative magnetic resonance imaging in low-grade glioma surgery: a retrospective study. World Neurosurg 93:191–197, 2016
24. Pluim JPW, Maintz JBA, Viergever MA: Mutual-informa-tion-based registration of medical images: a survey. IEEE Trans Med Imaging 22:986–1004, 2003
25. Reuss DE, Sahm F, Schrimpf D, Wiestler B, Capper D, Koelsche C, et al: ATRX and IDH1-R132H immunohisto-chemistry with subsequent copy number analysis and IDH sequencing as a basis for an “integrated” diagnostic approach for adult astrocytoma, oligodendroglioma and glioblastoma. Acta Neuropathol 129:133–146, 2015
26. Roder C, Bender B, Ritz R, Honegger J, Feigl G, Naegele T, et al: Intraoperative visualization of residual tumor: the role of perfusion-weighted imaging in a high-field intraoperative magnetic resonance scanner. Neurosurgery 72 (2 Suppl Operative):ons151–ons158, 2013
27. Sahm F, Reuss D, Koelsche C, Capper D, Schittenhelm J, Heim S, et al: Farewell to oligoastrocytoma: in situ molecular genetics favor classification as either oligodendroglioma or astrocytoma. Acta Neuropathol 128:551–559, 2014
28. Seo HS, Chang KH, Na DG, Kwon BJ, Lee DH: High b-value diffusion (b = 3000 s/mm2) MR imaging in cerebral gliomas at 3T: visual and quantitative comparisons with b = 1000 s/mm2. AJNR Am J Neuroradiol 29:458–463, 2008
29. Server A, Kulle B, Maehlen J, Josefsen R, Schellhorn T, Kumar T, et al: Quantitative apparent diffusion coefficients in the characterization of brain tumors and associated peritu-moral edema. Acta Radiol 50:682–689, 2009
30. Simon D, Fritzsche KH, Thieke C, Klein J, Parzer P, Weber MA, et al: Diffusion-weighted imaging-based probabilistic segmentation of high- and low-proliferative areas in high-grade gliomas. Cancer Imaging 12:89–99, 2012
31. Smith JS, Cha S, Mayo MC, McDermott MW, Parsa AT, Chang SM, et al: Serial diffusion-weighted magnetic reso-nance imaging in cases of glioma: distinguishing tumor recurrence from postresection injury. J Neurosurg 103:428–438, 2005
32. Smith JS, Chang EF, Lamborn KR, Chang SM, Prados MD, Cha S, et al: Role of extent of resection in the long-term outcome of low-grade hemispheric gliomas. J Clin Oncol 26:1338–1345, 2008
33. Smith JS, Lin H, Mayo MC, Bannerjee A, Gupta N, Perry V, et al: Diffusion-weighted MR imaging abnormalities in pediatric patients with surgically-treated intracranial mass lesions. J Neurooncol 79:203–209, 2006
34. Stieltjes B, Schlüter M, Didinger B, Weber MA, Hahn HK, Parzer P, et al: Diffusion tensor imaging in primary brain tumors: reproducible quantitative analysis of corpus callosum infiltration and contralateral involvement using a probabilis-tic mixture model. Neuroimage 31:531–542, 2006
35. Stummer W: Mechanisms of tumor-related brain edema. Neurosurg Focus 22(5):E8, 2007
36. Tozer DJ, Jäger HR, Danchaivijitr N, Benton CE, Tofts PS, Rees JH, et al: Apparent diffusion coefficient histograms may predict low-grade glioma subtype. NMR Biomed 20:49–57, 2007
37. Ulmer S, Braga TA, Barker FG II, Lev MH, Gonzalez RG, Henson JW: Clinical and radiographic features of peritumor-al infarction following resection of glioblastoma. Neurology 67:1668–1670, 2006
38. van den Bent MJ: Practice changing mature results of RTOG study 9802: another positive PCV trial makes adjuvant chemotherapy part of standard of care in low-grade glioma. Neuro Oncol 16:1570–1574, 2014
39. van den Bent MJ, Afra D, de Witte O, Ben Hassel M, Schraub S, Hoang-Xuan K, et al: Long-term efficacy of early versus delayed radiotherapy for low-grade astrocytoma and oligodendroglioma in adults: the EORTC 22845 randomised trial. Lancet 366:985–990, 2005
40. van den Bent MJ, Wefel JS, Schiff D, Taphoorn MJB, Jaeckle K, Junck L, et al: Response assessment in neuro-oncology (a report of the RANO group): assessment of outcome in trials of diffuse low-grade gliomas. Lancet Oncol 12:583–593, 2011
41. Vandendries C, Ducreux D, Lacroix C, Ducot B, Saliou G: Statistical analysis of multi-b factor diffusion weighted images can help distinguish between vasogenic and tumor-infiltrated edema. J Magn Reson Imaging 40:622–629, 2014
42. Yamasaki F, Kurisu K, Satoh K, Arita K, Sugiyama K, Ohta-ki M, et al: Apparent diffusion coefficient of human brain tumors at MR imaging. Radiology 235:985–991, 2005
DisclosuresThe authors report no conflict of interest concerning the materi-als or methods used in this study or the findings specified in this paper.
Author ContributionsConception and design: Scherer, Maier-Hein, Unterberg. Acquisi-tion of data: Scherer. Analysis and interpretation of data: Scherer, Jungk, Götz, Kickingereder. Drafting the article: Scherer. Criti-cally revising the article: Jungk, Götz, Kickingereder, Reuss, Bendszus, Maier-Hein, Unterberg. Approved the final version of the manuscript on behalf of all authors: Scherer. Statistical analy-sis: Maier-Hein. Administrative/technical/material support: Jungk, Götz, Reuss, Bendszus, Unterberg. Study supervision: Unterberg.
Supplemental InformationPrevious PresentationsPortions of this work were presented in abstract form at the Annual Scientific Meeting of the German Neurosurgical Society in Magdeburg, Germany, May 14–17, 2017.
CorrespondenceMoritz Scherer: Heidelberg University Hospital, Heidelberg, Ger-many. [email protected].
Unauthenticated | Downloaded 04/01/22 09:54 PM UTC