Embed Size (px)
Citation preview
Early Nuclear Retirements in Deregulated U.S. Markets: Causes, Implications and Policy OptionsGeoffrey Haratyk
M A S S A C H U S E T T S I N S T I T U T E O F T E C H N O L O G Y
March 2017 CEEPR WP 2017-009
Working Paper Series


1
Early Nuclear Retirements in Deregulated U.S. Markets:
Causes, Implications and Policy Options
Geoffrey Haratyka*
aMassachusetts Institute of Technology, 77 Massachusetts Avenue, Cambridge, MA 02139, Unites States
Abstract
Power prices have fallen significantly since 2008, putting commercial nuclear reactors in the United States
under substantial financial pressure. In this market environment characterized by persistently low natural gas
prices and stagnant electricity demand, the analysis shows that about two thirds of the 100 GW nuclear capacity
are uncompetitive over the next few years under the current trajectory. Among those in merchant deregulated
markets, 21 GW are retiring, or are at high risk of retiring prematurely.
The potential consequences of the hypothetical withdrawal of 30 GW of nuclear capacity include: 1) a ~5%
increase in carbon emissions if replaced by gas-fired units or 2) a cost of subsidies greater than $8 billion per year
if replaced by renewables.
Without a carbon price, out-of-the-market payments would be needed to effectively maintain nuclear capacity
in deregulated markets. Filling the revenue gap would come at a cost of $4-7/ MWh on average in these markets,
which is much lower than the cost of subsidizing wind power. The policy support could take the form of direct
zero-emission credits, renewable portfolio standard expansion, or clean capacity market mechanisms. As a last
resort, the exercise of a new mothballing status could prevent the retirement of nuclear plants.
In a context of uncertainty around future fuel price, technological advance, and climate policy, avoiding the
irreversible shutdown of nuclear assets is essential to minimize cost and damage to the environment while
ensuring long-term security of supply.
Highlights:
Two thirds of the U.S. nuclear power capacity is unprofitable over the next few years assuming the current
electricity price trajectory holds and there is no change in operating costs.
Low natural gas prices and negative electricity demand growth have driven down the competitiveness of
nuclear power plants.
In the absence of a carbon price, out-of-the-market subsidies are desirable to value the zero-emission attribute
of nuclear and prevent rapid early shutdowns.
We estimate that supporting the existing nuclear assets is a very cost-effective mean to lower carbon emissions
until more efficient carbon-free technologies develop.
Keywords: nuclear, deregulated market, retirement, mothballing, zero-emission credit, carbon
1. Introduction
In 2015, nuclear represented 20% of the total U.S. electricity generation and 60% of the country’s carbon-free
electricity (EIA, 2016). With a total installed capacity of 104 GW, the reactor fleet reported a record high 92.5%
* Corresponding author. E-mail address: [email protected].

2
capacity factor (NEI, 2016). Almost all reactors have been granted a 20-year license extension from 40 to 60 years
by the Nuclear Regulatory Commission (NRC, 2016).
Despite this consistently positive performance, in the past three years five nuclear power plants, totaling 4.7 GW
of installed capacity, retired from the electrical grid before the end of their operating license. Eight additional ones
have officially announced their retirement in the coming years (see Table 1), and many more are at risk of retiring
prematurely according to studies by Steckler (2016) and Rorke (2016). Low historical and forward power and
capacity prices, together with relatively large long-term operating costs, make nuclear plant operation unprofitable
in many locations. Even in regulated markets with guaranteed return on investments, utilities have started to shut
down expensive reactors (case of Fort Calhoun in 2016).
Table 1 – Executed, contingent, or planned nuclear retirements in the United States.
Plant name Year
Retirement
age (yr)
Capacity
(MW) Market
Retirement
executed
Crystal River 2013 36 877 South East
San Onofre 2013 30 2,150 CAISO
Kewaunee 2013 39 574 MISO
Vermont Yankee 2014 42 619 New England
Fort Calhoun 2016 43 478 SPP
Retirement
planned but may
be overturned by
policy
intervention
(subsidy)
Clinton 2017 30 1,078 MISO
Quad Cities 2018 46 1,819 PJM
Fitzpatrick 2017 42 853 NYISO
Retirement
announced
Palisades 2018 47 820 MISO
Oyster Creek 2019 50 637 PJM
Pilgrim 2019 47 685 New England
Indian Point 2 2020 46 1,030 NYISO
Indian Point 3 2021 45 1,041 NYISO
Diablo Canyon 2024 39 2,240 CAISO
Total 14,901
In this paper we first provide an updated assessment of the economic viability of the U.S. nuclear plants (Section
2). We then study the levers of profitability to explain why retirements occur (Section 3) using a wholesale electricity
market model. In Section 4 the potential consequences of the closures are discussed. In the last section, we propose
a set of regulatory options to the industry and policy-makers to prevent or mitigate the negative impacts identified.
This paper contributes to the existing literature in several ways. First, it provides an analysis of nuclear power
plant closures. Many papers have focused on new nuclear and its benefits for climate policy and economics (Joskow
and Parsons, 2009, Deutch et al., 2009, Joskow and Parsons, 2012, Linares and Conchado, 2013, Harris et al., 2013).
However very few have focused on the prospects for existing plants, as well as on the causes and the policy
consequences of nuclear power plant closures. The recent paper by Davis and Hausman (2016) is an exception. The
authors quantify the consequences of the closure of the San Onofre Nuclear Generating Station in California using
econometric techniques. Their analysis, though, is limited to California and to a past decision. They do not look at
the nation-wide picture nor at the prospects. Other papers, mainly from the banking and financial service industry,
have looked at the financial health of the U.S. nuclear reactor fleet and created forecasts on future retirements

3 G. Haratyk / Early Nuclear Retirements in Deregulated U.S. Markets
(Steckler, 2016, Rorke, 2016), but they lack long-term policy analysis and rigorous model description. Finally, some
of the regulatory options we propose at the end of the paper are new and have not been discussed before. The
reconciliation of competitive markets with environmental considerations is a common topic in the literature (IEA,
2016) but few studies have assessed its impact on the competitiveness of nuclear power specifically (OECD-NEA,
2011). Our discussion about the efficiency of regulatory measures in preserving nuclear power in competitive
markets aims at filling this gap.
2. Profitability Outlook for U.S. Nuclear Plants
What is the extent of the financial troubles of the U.S. nuclear power plants? This section provides an estimate
of the past, present and future profitability of every single plant in the country. The assessment is based on public
data, i.e. published prices and costs. Bilateral power purchase agreements, which are usually confidential, and
unforeseen expenditures are absent from the revenue estimate. Although bilateral purchase contracts can delay the
retirements of assets, we can reasonably assume that in the long run the re-negotiated price of these contracts match
the price listed on the exchange market.
2.1. Methodology
The profitability of the 61 U.S. nuclear plants is defined in this section as the net pre-tax earnings of the individual
facilities. For any given year, the profitability is the sum of a) the energy sales, b) the capacity market revenue, c)
the policy support (subsidies if applicable) minus d) the cost of generation. Both historical (from 2013 until 2016)
and future (2017-2019) earnings are estimated.
The historical generation of each facility in MWh is obtained from EIA survey forms 923 (2016). For future
estimates, we take the average over the 2012-2015 period (4 years, ~2.7 fuel cycles).
The power sales are approximated as the product of the yearly average of the day-ahead† Locational Marginal
Price of wholesale electricity (LMP, in $/MWh) at the plant location, and the total generation for the time period
considered. The hourly historical LMPs come from the market operator (ISO) websites when such an organization
exists. The name of the nodes are extracted from the SNL mapping tool (SNL, 2016).
For future LMPs, we summed the nearest hub forward price and the historical spread between hub and LMP at
the plant location. The forward price is the “fair value price” of electricity given by Bloomberg and retrieved from
a Bloomberg terminal. These forward values exist for every month in the future and for every major electricity hub
of the United States. Bloomberg indicates that they are “calculated through a proprietary model that uses future
prices, historical spreads, spot prices and other factors”. The historical spread is the average over the last two years,
which is long enough to smooth seasonal variations but short enough to incorporate recent structural changes in the
locational price signals (caused by the recent large introduction of renewables and associated flow congestion in
some areas for instance – see Figure 1).
† Except for ERCOT where the real-time LMP is used in lieu of the day-ahead LMP.
4
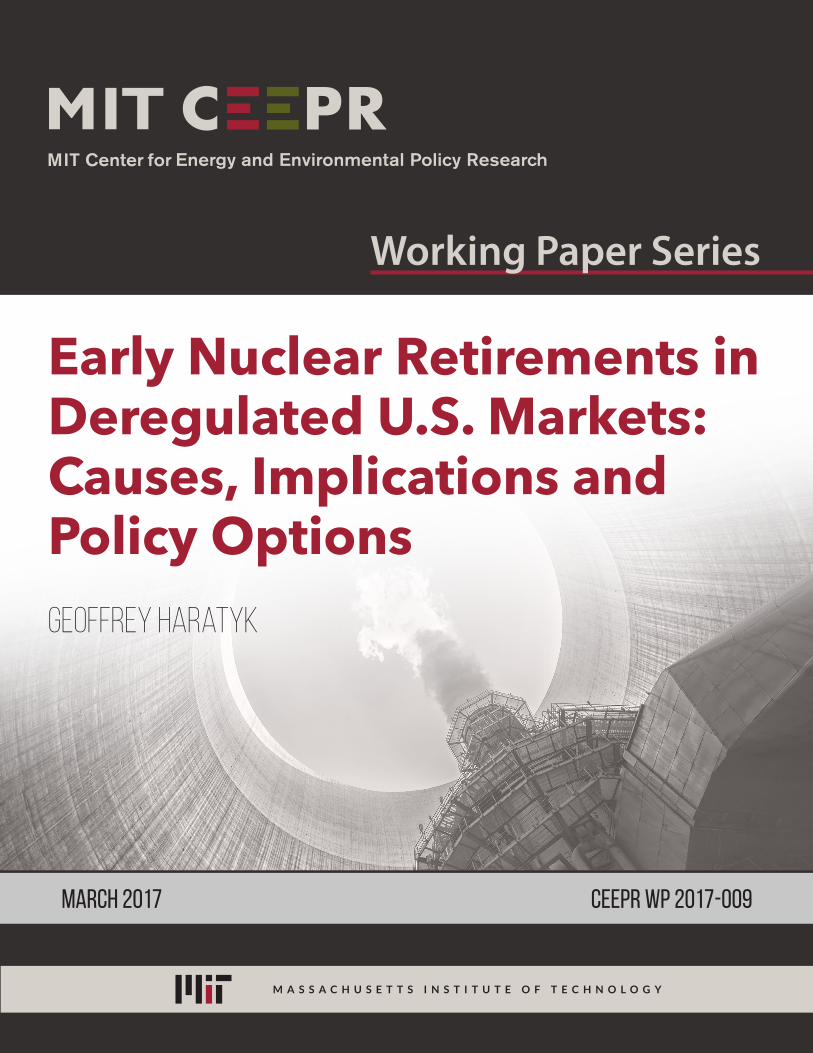
Figure 1. The spread in day-ahead price can be significant and evolves with time due to congestion between
nodes. This study takes the last 2-year average spread for projections into the future. In Byron (IL), the spread in
the Fall season is caused by a combination of high wind energy production and low electricity demand in West
Illinois, as well as limited transmission capacity to the Chicago hub.
In the “cost-of-service regulated” Southeast of the country, in the absence of an ISO, the bilateral contract values
of day-ahead electricity price in the Southern and Florida “hubs” are used in lieu of the LMP. These historical values
are reported by Platts and SNL. The price index is therefore similar for all the nuclear plants in the zone (15 plants,
28GW of capacity) and is less granular than in the other U.S. zones. The forecasted price is the sum of the closest
hub – Indiana – forward price and the historical spread between this hub and the zones.
Capacity market revenues are known once capacity auctions have been cleared. Preliminary auctions results
when they exist are used to forecast future capacity revenue (PJM, ISO-NE, NYISO and California). For MISO,
where preliminary auctions do not go as far into the future, we extrapolated the latest capacity market result.
The policy support is the potential subsidy that the plants receive for their zero-carbon attribute. If confirmed,
these subsidies will apply to 5 plants in the US, in the form of Zero Emission Credits (ZEC): Nine Mile Point,
Fitzpatrick and Ginna in New York and Clinton and Quad Cities in Illinois starting in 2017.
Finally, the cost of generation is taken from the SNL Financial database (2016). SNL provides plant-specific
estimates of annual generation cost, based on IEA, FERC, and RUS survey forms (which include fuel cost reporting
in particular) and/or a proprietary model when the data are incomplete. The SNL model is based on a three-year
regression of a “large enough sample”. The regression formula is based off net generation, age of plant and operation
capacity. The total costs comprises fuel, fixed operation and maintenance as well as non-fuel variable operation and
maintenance cost. The fleet-average cost of generation closely matches the number disclosed by the industry (see
NEI 2016 and Table 2). The O&M cost of future years is simply the O&M cost of the latest year augmented by the
expected inflation.
Table 2 – The plant-average cost of generation from SNL is lower but close to the one reported by NEI
-25
-20
-15
-10
-5
0
Jan
Mar
May
Jul
Sep
No
v
Jan
Mar
May
Jul
Sep
No
v
Jan
Mar
May
Jul
Sep
No
v
Jan
Mar
May
Jul
Sep
No
v
Jan
Mar
May
Jul
Sep
No
v
2012 2013 2014 2015 2016
Historical monthly spread in day-ahead wholesale price ($/MWh)
Byron node - N Illinois hub
Spread 2-yr average

5 G. Haratyk / Early Nuclear Retirements in Deregulated U.S. Markets
2012 2013 2014 2015 Unit
SNL estimates (61 plants) 34.1 33.4 34.4 33.9 $/MWh
[standard deviation] [5.3] [6.4] [6.5] [4.6] $/MWh
NEI (reported fleet average, in 2015 $) 39.7 36.9 36.4 35.5 $/MWh
adjusted to nominal $ 38.5 36.3 36.3 35.5 $/MWh
2.2. Results
Results were obtained for the 61 operating U.S. nuclear plants existing as of January 2017, regardless of whether
they are located in regulated or deregulated market environments. The precision of the estimates varies. In particular
the 15 plants located in the Southeast are subject to imprecision due to the coarse assessment of future bilateral
contract prices of electricity.
The plant-by-plant analysis reveals profitability in the range of -$29 to +$15 /MWh generated over the 2017-
2019 period (Figure 2). The number represents a crude average; no discount factor was applied. Prairie Island and
Monticello in Minnesota appear to be the least profitable plants by far, due to low wholesale price in North-West
MISO and low capacity factor (80-82%). Most of the Southeast plants show a negative outlook due to the larger
cost of production of regulated plants versus merchant plants. The difference in cost efficiency between merchant
and regulated plants was demonstrated by Zhang (2007) and is confirmed in this study.
Results show that 35 plants, totaling 58 GW of capacity, are out-of-the-money over the 2017-2019 period. 8 of
these plants – 14GW – are located in merchant deregulated electricity markets. When adding the 6 plants – 6 GW
– that have announced their retirement, nearly two thirds of the U.S. nuclear fleet display negative financial outlooks
(Figure 2 and Figure 3). In deregulated markets, 21 GW are retiring or unprofitable; in regulated markets, 44 GW
are “uncompetitive” in the sense that their cost of production is greater than the estimated wholesale price of
electricity.
The plants located in deregulated markets are of course more exposed and have a higher risk of shutting down
prematurely than those located in regulated environments. As a matter of fact in regulated environments, generators
are remunerated based on their cost-of-service and are largely protected from direct market forces. There is no real
market competition for power generation. We expect most of these plants to remain in operation. Figure 3 shows
the profitability outlook by market type.

6
Figure 2. The profitability of the 61 U.S. nuclear plants studied ranges
from -$29 to +$15 /MWh over the 2017-2019 time period.
-29.4-26.8
-21.6-17.6
-15.8-13.6
-12.8-11.1
-10.2-9.8-9.8-9.1-8.7-8.4-8.3-8.1-8.0
-7.1-6.5-6.4-6.4-6.4-6.0
-5.2-4.9-4.6-4.5-4.1-4.1-3.7-3.7
-3.0-2.6
-1.4-1.2-0.5-0.5-0.1
0.10.30.40.81.31.41.71.81.9
3.53.6
4.55.1
8.29.09.59.9
12.612.9
13.713.714.0
14.8
-35 -30 -25 -20 -15 -10 -5 0 5 10 15 20
MonticelloPrairie Island
H.B. RobinsonWolf Creek
Shearon Harris Nuclear Power PlantColumbia Generating (WNP-2)
Arkansas Nuclear OneDuane Arnold Energy Center (DAEC)
FermiCooper Nuclear Station
V.C. SummerBrunswickRiver Bend
CallawayWatts Bar Nuclear
SequoyahByron Generating Station
Three Mile IslandOyster Creek
CatawbaWaterford 3
Edwin I HatchJoseph M Farley
Point BeachTurkey Point Nuclear
Browns FerryComanche Peak
PalisadesDiablo Canyon
Quad CitiesOconee
McGuireSouth Texas Project
Alvin W. Vogtle Nuclear PlantGrand GulfHope CreekPalo Verde
Beaver ValleySt. Lucie
LaSalle County Generating StationSalem
Braidwood Generating StationSusquehanna Nuclear
Donald C. CookPeach Bottom
DresdenLimerick
PerryClinton Power Station
Davis-BesseSurry
R.E. Ginna/Ontario Sta. 13Indian Point 3Calvert Cliffs
Pilgrim Nuclear Power StationIndian Point 2
James A. FitzPatrickNorth Anna
Nine Mile PointSeabrookMillstone
Net profit per MWh generated over 2017-2019 ($/MWh)

7 G. Haratyk / Early Nuclear Retirements in Deregulated U.S. Markets
Figure 3. The majority of the 100 GW nuclear fleet is unprofitable or retiring in the near future. In deregulated
markets, 43% of the merchant capacity is on a path to retirement. The plants in regulated environments are to a
large extent protected from market forces. Note that recently-voted-on state subsidies are included in the
calculation.
The breakdown by region reveals strong discrepancies (Figure 4). The Midwest, California and Texas regions
are particularly unprofitable for merchant nuclear over the four-year period. PJM displays a mixed outlook,
whereas New York and New England are favorable. The next section analyzes why and how these differences
arise.
Figure 4. The Northeast markets are more favorable environments for nuclear power plants due to higher
wholesale power prices. By contrast, the Midwest, California and Texas markets are challenging.
Table 3 shows the revenue gap each year for the plants in distress out of the 61 plants studied (retired plants as
of January 2017 are not accounted). The numbers for merchant deregulated plants are also shown separately. The
total number of struggling plants varies from year to year and peaks at 52 in 2016, a particularly challenging year
for nuclear. The future is uncertain but forward markets seem to indicate a price recovery. Still, about 35-45
plants – 55-75 GW – are durably uncompetitive. The average revenue shortfall for these plants is about $5.5-7 /
MWh per year over 2016-2019. This number can be viewed as the minimum amount of policy support that would
be needed to bring them breakeven financially and prevent their retirement.
0
10,000
20,000
30,000
40,000
50,000
Positive Negative Plan to retire Positive Negative Plan to retire
Deregulated markets Regulated markets
Profitability outlook over 2017-2019 period
(MW of installed capacity)
-40
-30
-20
-10
0
10
20
New
England
New York PJM CAISO ERCOT MISO
Range of profitability by region over 2017-2019 period ($/MWh)
Region-average

8
Table 3 – The average revenue shortfall for the plants in financial distress ranges from $5.5-7 / MWh per year, for
a sum of $2.5-3.5 billion/ year. In merchant deregulated markets, the range is $4-7 / MWh and adds up to $0.4-0.9
billion / year.
2013 2014 2015 2016 2017 2018 2019
TO
TA
L U
.S.
Unprofitable
plants 29 9 37 52 36 38 43
Capacity (MW) 42,378 8,533 59,282 87,347 57,557 61,867 73,517
Total revenue gap
(M$) (1,466) (582) (2,943) (5,103) (2,604) (3,173) (3,562)
Average loss in
$/MWh -4.57 -9.29 -6.29 -7.53 -5.87 -6.66 -6.29
ME
RC
HA
NT
DE
RE
GU
LA
TE
D Unprofitable
plants 8 0 11 23 10 10 15
Capacity (MW) 13,480 - 17,902 39,377 17,794 16,088 27,738
Total revenue gap
(M$) (212) 0 (670) (1,579) -371 -620 -883
Average loss in
$/MWh -1.82 0 -4.70 -6.38 -3.82 -6.85 -5.99
3. Drivers of Un-Competitiveness in Deregulated Markets
The economics of nuclear power in competitive environment have been deteriorating. As seen previously the
revenues from the wholesale and capacity markets are often not sufficient to cover the cost of electricity generation.
In this section, we analyze the underlying sources of changes that drive down the competitiveness of nuclear. Electricity generation revenue comes from several sources, namely: supplying electricity (kWh); assuring electricity
generating capacity on demand (kW); and providing grid ancillary services.
3.1. Wholesale Prices
As displayed in Figure 5, the wholesale price of electricity has been declining everywhere in the United States
since the years 2007-08. This phenomena has directly impacted nuclear power plants, which supply base-load
electricity and for which the wholesale market is the primary source of revenue. In fact, the sales of electricity
represent >90% of the revenue of the nuclear plants. This ratio is larger than for coal and natural gas power plants,
for which capacity markets and ancillary services represent a larger share of revenue.

9 G. Haratyk / Early Nuclear Retirements in Deregulated U.S. Markets
Figure 5. Wholesale price of electricity have gone down everywhere in the United States in the past decade.
To better understand the reasons for the price decline, we propose replicating the price formation of wholesale
prices in two zones relevant for nuclear plants: the Midwest and the Mid-Atlantic region, which total 50 GW of
capacity. We compare the years 2008 and 2015 and analyzes the single structural changes affecting the price and
the magnitude of their impact.
3.1.1. Model of wholesale market
The wholesale price of electricity is simulated with a simple economic dispatch model of the generators in the
zone spanning one year (8760 hours). The model takes the hourly demand for electricity, the generation profile of
renewables (wind), the installed generation capacity, and its marginal cost in order to dispatch the generation and
meet the demand at minimal cost. The price of electricity for each hour is determined by the marginal unit that
serves the load. The transmission line constraints inside the zone are ignored, as well as the transmission losses
(single node approximation), and the power exchanged with the neighbouring regions is treated as an addition
(export) or reduction (import) of the total demand for the zone. The constraints introduced in the optimization
problem are: the load demand constraint, the constraints on the maximum output of each generator, and the
flexibility constraint (ability to power up and down each generator). The cost of not meeting the demand is equal
to the value of lost load, which is set at $500/MWh.
The formulation of the problem leads to the solving of a linear optimization problem, which is faster to
compute than if binary constraints had been introduced. The generators of a given class are aggregated when their
characteristics are similar. The cost and technical assumptions for the generators are listed in Appendix A.
3.1.2. Results: Midwest region (IA, IL, IN, MI, MN, MO, ND, WI)
0
10
20
30
40
50
60
70
80
2005 2006 2007 2008 2009 2010 2011 2012 2013 2014 2015 2016
Historical wholesale price of electricity at selected hubs
(yearly average of day-ahead price, in $/MWh)
New England hub NY West hub (A) PJM Western hub
Michigan hub Illinois hub Minnesota hub
N Texas hub (Real Time) Southern California (SP15)

10
The first region of interest is the Midwest, defined here as eight states together: Iowa, Illinois, Indiana, Michigan,
Minnesota, Missouri, North Dakota and Wisconsin. Nuclear plants in this region are particularly affected by low
wholesale prices. In Minnesota, average day-ahead hub prices were as low as $22.2 / MWh in 2015. Despite its
simplicity, our model reproduces fairly well the observed wholesale prices as well as their relative drop between
2008 and 2015 (Table 4). To do so, it is essential to correctly model the coal-fired power plants in the region since
they dominate the installed capacity (44-49% of all capacity). The model is very sensitive to their heat rate and
availability.
Table 4 – Actual vs. computed annual wholesale price in the Midwest region ($/MWh)
Hub name 2008 2015 Delta 2008-2015
Illinois hub 46.2 26.7 -42%
Michigan hub 52.1 28.6 -45%
Minnesota hub 47.7 22.2 -53%
Midwest model 42.4 26.9 -36%
The region has seen important structural changes from 2008 to 2015, specifically:
– Addition of 12.8 GW of wind power capacity, which added up to 9% of the total electricity supply in 2015.
– Decrease of natural gas price from $9.3 to $3.2 /MMBtu, and increase of coal price from $1.45 to $1.85
/MMBtu (EIA, 2016).
– Reduction of total electricity demand by 3.8%. Most of this change (3.3% out of 3.8%) was caused by a
reduction in electricity exports‡.
– Retirement of 4.5 GW of coal power plants.
To quantify the effects on price caused by each of these factors, we employed our wholesale electricity model.
Starting from the 2008 conditions, we replaced the inputs once-at-a-time by their 2015 value, and then reported the
effect on price. Note that due to the non-linear nature of the wholesale market model, the sum of the effects does
not equal the effect of their combination. The separate and combined price effects are reported in Figure 6.
‡ Net imports are calculated as the sum of the net interstate imports for each states reported by the EIA. The total demand is
equal to the total supply in the zone. The “internal” demand is defined as the difference between the total demand and the net
exports of electricity in the zone.
11 G. Haratyk / Early Nuclear Retirements in Deregulated U.S. Markets
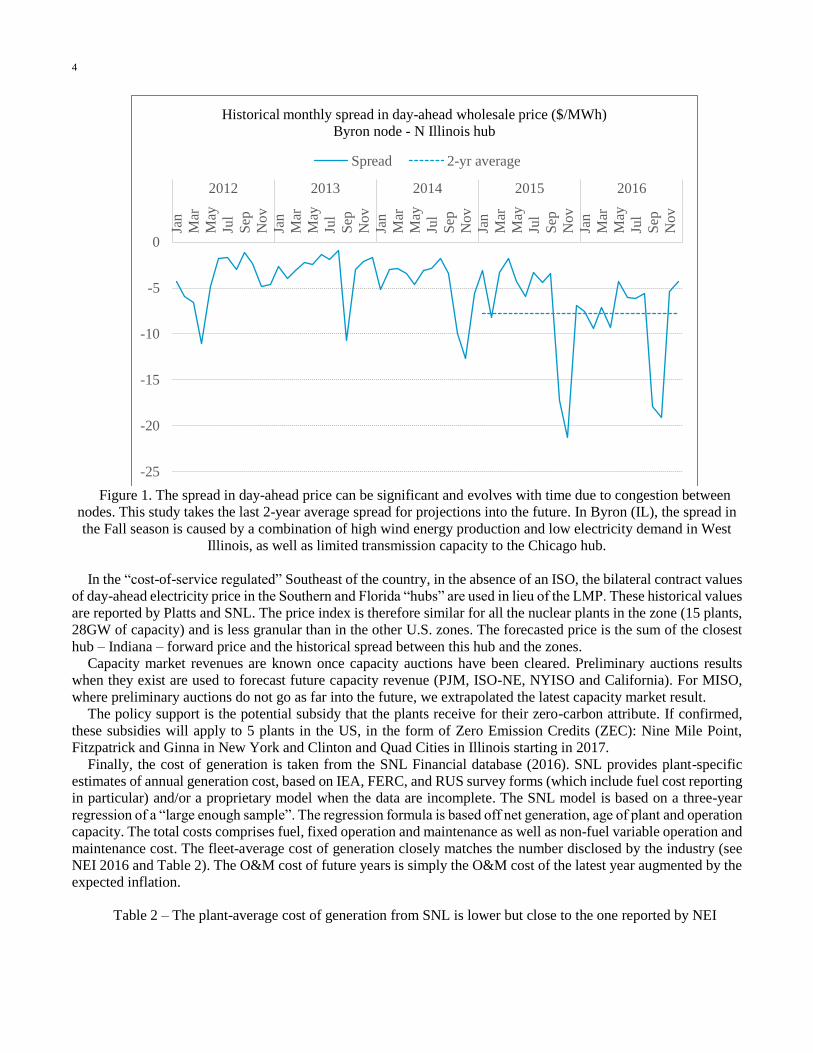
Figure 6. The primary drivers of the price collapse in the Midwest are the decline in load demand and the collapse
of natural gas prices. The effect of increased wind capacity is offset by the retirement of coal power plants during
the same period.
In the Midwest, despite natural gas price collapse, production costs from coal-fired generators have remained
cheaper than from Combined-Cycle Gas Turbines (CCGTs). The merit order of generation resources has stayed
mostly the same in the supply curve. However, the drop in marginal cost of production for gas-fired units has been
the primary cause of wholesale price contraction. The diminution in total electricity demand – and in exports in
particular – has been the second most significant contributor. More surprisingly, the large introduction of
renewables (wind) had a relatively small effect on price (-$4.6/ MWh). It was completely offset by the retirement
of coal-fired generators (+6.0/MWh). The effect of wind capacity introduction might have been more severe at the
nodal level, but our zonal market model did not capture these local effects.
3.1.3. Results: Mid-Atlantic region (DC, DE, KY, MD, NJ, OH, PA, VA, WV)
The Mid-Atlantic region (D.C., Delaware, Kentucky, Maryland, New Jersey, Ohio, Pennsylvania, Virginia and West Virginia) is another relevant region due to its high concentration of nuclear power plants (23 GW of capacity installed, 23% of the U.S. fleet). It is also the region that hosts the Marcellus shale gas deposit, whose exploitation has led to the dramatic boost in domestic natural gas production and associated price disruption between 2008 and 2015.
Nevertheless, the abundance of cheap natural gas has not yet materialized in electricity cheaper than in the Midwest, as can been observed in Table 5. Electricity prices were still $3 to $16/ MWh more expensive than in the Midwest in 2015. Our model replicated these wholesale prices in a satisfactory manner again; they lie in the range of the historical hub prices. For this region, the model is very sensitive to both coal- and gas-fired generator assumptions. These assumptions are reported in Appendix A.
42.4-4.2 -0.5 -0.2 -4.5
3.9
-15.1 0.1 -11.7
0.8-4.6 6.0
0.6 -1.1
26.9
05
101520253035404550
200
8 p
rice
Ex
po
rts
Inte
rnal
lo
ad
Lo
ad s
hap
e
Com
bin
ed
+28%
coal
pri
ce
-65.5
% N
G p
rice
Var
iable
O&
M
All
chan
ges
in c
ost
s
Gen
erat
or
avai
lab
ilit
y
+12.8
GW
win
d c
apac
ity
-4.5
GW
co
al c
apac
ity
All
chan
ges
in c
apac
ity
Win
d a
nd h
ydro
pro
file
201
5 p
rice
Load demand Generation costs Installed capacity
Factor decomposition of wholesale price drop ($/MWh)
Midwest (IA, IL, IN, MI, MN, MO, ND, WI), 2008 to 2015

12
Table 5 – Actual vs. computed annual wholesale price in the Mid-Atlantic region ($/MWh)
Hub name 2008 2015 Delta 2008-2015
PJM Western hub 69.8 35.8 -49%
AEP Dayton hub 53.2 31.5 -41%
Dominion hub 73.5 38.2 -48%
Mid-Atlantic model 59.4 31.8 -46%
The Mid-Atlantic zone saw the same list of structural changes as the Midwest, although their magnitude is
different: – Addition of 1.8 GW of wind power capacity, a very moderate amount compared to the Midwest.
– Decrease of natural gas price from $10.3 to $3.2 /MMBtu, and increase of coal price from $3.3 to $3.4
/MMBtu (EIA, 2016]. These relative changes are explained by the fact that the region sits on the newly-
exploited Marcellus gas deposit and is farther from the Powder River and Illinois coal deposits than the
Midwest.
– Reduction of total electricity demand by 8.3%. The internal load demand dropped by 12.1% but the region
imported less electricity, which alleviated the effect on price (when the local producers increase their total
supply, the locational marginal price of electricity increases).
– Retirement of 16 GW of coal power plants, and addition of 13.1 GW of new gas-fired power plants.
The price decomposition of these individual factors is shown in Figure 7. It follows the same methodology as for the Midwest price decomposition.
Figure 7. The primary drivers of the price collapse in the Mid-Atlantic are the collapse of natural gas prices and,
59.4 7.7
-18.0 -0.8 -10.7
0.5
-28.1 0.5 -25.2
-1.5 1.2 0.0 -1.3 23.1 17.6 -0.2
31.8
0.0
10.0
20.0
30.0
40.0
50.0
60.0
70.0
80.0
20
08 p
rice
Imp
ort
s re
du
ctio
n
Inte
rnal
lo
ad
Lo
ad s
hap
e
Co
mb
ined
+4
% c
oal
pri
ce
-69
% N
G p
rice
Var
iable
O&
M
All
ch
ang
es i
n c
ost
s
Hea
t ra
te
Gen
erat
or
avai
lab
ilit
y
+1
.8G
W w
ind
cap
acit
y
+13.1
GW
CC
GT
cap
acit
y
-16
.0 G
W c
oal
cap
acit
y
All
ch
ang
es i
n c
apac
ity
Win
d a
nd
hyd
ro p
rofi
le
2015 p
rice
Load demand Generation costs Installed capacity
Factor decomposition of wholesale price drop ($/MWh)
Mid-Atlantic (DC, DE, KY, MD, NJ, OH, PA, VA, WV), 2008-2015

13 G. Haratyk / Early Nuclear Retirements in Deregulated U.S. Markets
to lesser extents, the drop in load demand and the change in capacity mix. The replacement of base-load coal-fired
plants by base-load CCGT units yields a greater exposure to natural gas price.
As expected, the change in load demand had a more moderate impact in the Mid-Atlantic than in the Midwest.
Natural gas price collapse had the largest single effect (-$28.1/MWh). Not only did it decrease the cost of generating
electricity, but it changed the merit order of the technologies in the supply stack. Figure 8 shows that CCGT units
displaced coal as the source of base-load electricity, forcing a large number of them to retire. If natural gas prices
were to increase, the situation could revert and price could spike to high levels again. The retirement of coal-fired
units makes the Mid-Atlantic market more sensitive to natural gas prices than in 2008, as demonstrated by the
+$17.6/ MWh effect on price which would occur if 2008 natural gas prices were to return.
Figure 8. In the supply stack of 2008 (top), CCGT units are more expensive to dispatch than coal-fired units. In
2015 (bottom), the situation has been reversed and coal is being displaced by CCGT.
nuclear
coal
CCGT
peakers
average 2008 demand0
20
40
60
80
100
120
140
- 20,000 40,000 60,000 80,000 100,000 120,000 140,000
Mar
gin
al c
ost
($/M
Wh
)
Quantity (MW)
Mid-Atlantic Supply Stack in 2008
nuclear
CCGTcoal
peakers
average 2015 demand0
20
40
60
80
100
120
140
- 20,000 40,000 60,000 80,000 100,000 120,000 140,000
Mar
gin
al c
ost
($/M
Wh)
Quantity (MW)
Mid-Atlantic Supply Stack in 2015
14
3.1.4. Perspectives on future wholesale prices
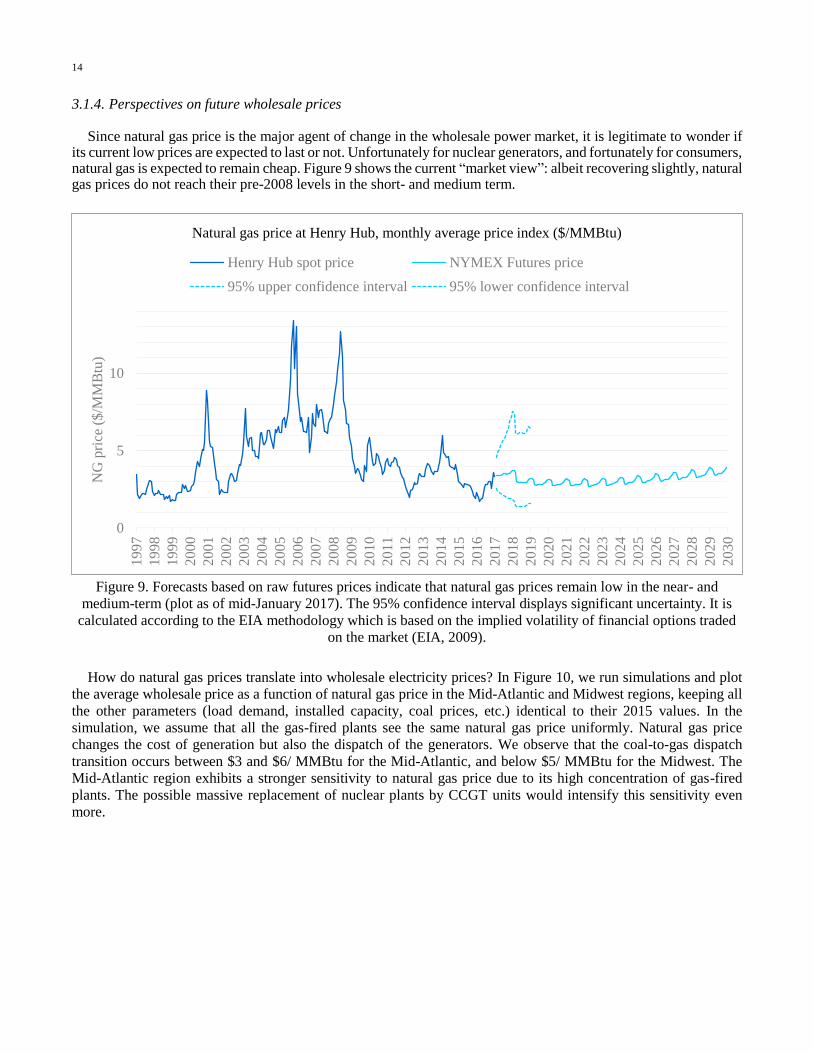
Since natural gas price is the major agent of change in the wholesale power market, it is legitimate to wonder if its current low prices are expected to last or not. Unfortunately for nuclear generators, and fortunately for consumers, natural gas is expected to remain cheap. Figure 9 shows the current “market view”: albeit recovering slightly, natural gas prices do not reach their pre-2008 levels in the short- and medium term.
Figure 9. Forecasts based on raw futures prices indicate that natural gas prices remain low in the near- and
medium-term (plot as of mid-January 2017). The 95% confidence interval displays significant uncertainty. It is
calculated according to the EIA methodology which is based on the implied volatility of financial options traded
on the market (EIA, 2009).
How do natural gas prices translate into wholesale electricity prices? In Figure 10, we run simulations and plot
the average wholesale price as a function of natural gas price in the Mid-Atlantic and Midwest regions, keeping all
the other parameters (load demand, installed capacity, coal prices, etc.) identical to their 2015 values. In the
simulation, we assume that all the gas-fired plants see the same natural gas price uniformly. Natural gas price
changes the cost of generation but also the dispatch of the generators. We observe that the coal-to-gas dispatch
transition occurs between $3 and $6/ MMBtu for the Mid-Atlantic, and below $5/ MMBtu for the Midwest. The
Mid-Atlantic region exhibits a stronger sensitivity to natural gas price due to its high concentration of gas-fired
plants. The possible massive replacement of nuclear plants by CCGT units would intensify this sensitivity even
more.
0
5
10
1997
1998
1999
2000
2001
2002
2003
2004
2005
2006
2007
2008
2009
2010
2011
2012
2013
2014
2015
2016
2017
2018
2019
2020
2021
2022
2023
2024
2025
2026
2027
2028
2029
2030
NG
pri
ce (
$/M
MB
tu)
Natural gas price at Henry Hub, monthly average price index ($/MMBtu)
Henry Hub spot price NYMEX Futures price
95% upper confidence interval 95% lower confidence interval

15 G. Haratyk / Early Nuclear Retirements in Deregulated U.S. Markets
Figure 10. The simulations show that the Mid-Atlantic zone is more sensitive to the price of natural gas than the
Midwest due to the former’s higher concentration of gas-fired power plants. The retirement of nuclear plants and
their replacement by gas-fired units would intensify this dependence and sensitivity.
With natural gas price not exceeding $4/MMBtu, wholesale power prices will not go beyond $35 and $30/ MWh
in the Mid-Atlantic and Midwest. The wholesale market will most likely continue to provide low revenue for nuclear
plants in the medium term. Therefore, saving the nuclear fleet requires other levers.
3.2. Cost of nuclear power generation
The cost of electricity generation from existing nuclear plants averaged $35.5/MWh in 2015 (NEI, 2016). This
includes annual capital expenditures (equipment replacement and upgrade), operation and maintenance (O&M),
and fuel. Unlike generators running on fossil fuels, a large share of the expenses are “fixed” and do not depend on
the electricity output. For instance, the number of security personnel (around 5% of the total cost) is set by the
regulator and is incurred whatever the size or power output of the plant. This characteristic favors large plants: the
average cost of generation was $32.9/ MWh for multi-unit plants and as high as $42.5/ MWh for single-unit plants.
Single-units plants are the first plants to suffer from low wholesale prices and this is not a surprise that they form
the majority of the plants that are expected to retire prematurely (Table 1).
Although relatively high, average generation costs have been decreasing since 2012 (Figure 11). Capital
expenditures have been reduced after the 2011-2012 peaks, which were due to post-Fukushima upgrades and license
extension programs. More recently, fuel costs have gone down thanks to progress in technology. O&M, the major
cost item, remains expensive nevertheless. The industry committed to reduce them by $3.5/MWh from the 2012
level (UBS, 2016). The objective of this initiative called “Delivering the Nuclear Promise” is to achieve $28/ MWh
in total generation cost by the end of the 2020’s. We quickly see that this initiative will not be sufficient for the
single-unit plants, and / or the plants located in regions with wholesale prices in the low $20 /MWh range such as
the Midwest.
0
10
20
30
40
50
60
70
0 1 2 3 4 5 6 7 8 9 10 11 12
Who
lesa
le e
lect
rici
ty p
rice
($
/MW
h)
Natural gas price delivered to the electric power sector ($/MMBtu)
Sensititivity of electricity price to natural gas price
Mid-Atlantic Midwest

16
Figure 11. After a peak in 2012 due to large capital expenditures, nuclear power generation costs have been
decreasing (NEI, 2016). However, they are still greater than market revenues in many locations. The costs are
converted into 2015 $ for comparison.
3.3. Capacity markets
Capacity markets are a secondary but important source of revenue for nuclear plants in deregulated regions where
capacity markets exist (Figure 12). They can add up $300/ MW-day ~ $14/MWh to the revenue of the plants in the
best case (Pilgrim, 2018). The fleet-average revenue was nevertheless more moderate, between $60 and $80/ MW-
day over the last years, i.e. around $3/ MWh. When plants fail to clear the capacity market, they receive zero for an
entire year which can precipitate their retirement.
Figure 12. Capacity price differ between regions but in general provide moderate revenue for nuclear plants when
these prices exist. The fleet-average price was $60-80/ MW-day over the last years, i.e. around $3/ MWh. Texas
does not have any capacity mechanism.
0
5
10
15
20
25
30
35
40
Average cost of nuclear power generation ($/MWh)
Fuel
Capital
Operating
0
50
100
150
200
250
300
350
2011 2012 2013 2014 2015 2016 2017 2018 2019
Capacity prices in selected regions ($/ MW-day)
PJM-PECO New England - SEMA NY - Zone A (Upstate)
MISO - Zone 4 California - PG&E

17 G. Haratyk / Early Nuclear Retirements in Deregulated U.S. Markets
Capacity markets were implemented in the late 2000’s, i.e. quite recently in the history of electricity market
deregulation. Capacity market design is still evolving. Important reforms were implemented in the Northeast after
the polar vortex in 2013-2014 when numerous fossil power plants failed at providing the capacity they promised.
More reforms could happen but they are not likely to change the revenue game for nuclear plants due to the relatively
low levels of capacity payments.
3.4. Other drivers of retirement: safety and business divestment strategy
Although economics are the origin of most premature nuclear retirements, and the main area of focus this paper, we should highlight that in some instances non-economic factors are more decisive.
In at least two recent cases – Oyster Creek and Indian Point – safety concerns and the associated cost of compliance with regulation led to the decision to close the facilities. Economics were not the primary driver. Indian Point appears for instance very profitable in our analysis of section 2. But political pressure pushed the owner of the plant, Entergy, to announce in January 2017 the closure of the plant, which sits 50 miles away from NYC.
The same owner Entergy also announced the shutdown of Pilgrim in Massachusetts. Similarly to Indian Point, the economics would advocate for continued operation but in this case the business strategy of Entergy is responsible. Entergy decided to divest from merchant nuclear power and entered the process of either selling or closing all its nuclear assets located in deregulated markets (K. Maize, 2016).
4. Implications of Premature Nuclear Retirements
What are the consequences of a massive wave of nuclear retirements? This section analyzes the impact of the
hypothetical retirement of 30 GW of nuclear capacity, which is about a third of the total U.S. nuclear capacity§.
Running at 92% capacity factor, 30 GW of nuclear generation represent 242 TWh of zero-emission electricity. Such
a large withdrawal impacts environmental policy, electricity price and the natural gas market.
Four scenarios are considered when it comes to the replacement of this nuclear power supply:
- Scenario 1: the retired nuclear generation is replaced by generation from other sources in place. These existing
sources, which run on fossil fuel, increase their production to make up for the withdrawal of nuclear capacity and
satisfy demand.
- Scenario 2: the retired nuclear generation is replaced by new gas combined cycle plants (CCGT). These modern
units have a heat rate of 6,600 Btu/ kWh and an availability factor of 87%.
- Scenario 3: the retired nuclear generation is replaced by renewable generation coming from new wind turbines.
Due to the intermittency of the wind turbines, a large amount of them is necessary to make up for lost nuclear
generation.
Although these scenarios are extreme, they have the merit of drawing the boundaries of the possible mix that
could replace the retired nuclear assets. Renewables and CCGT are now – and certainly will be – the preferred
generators installed in the coming years due to their good economics (Figure 14). The CCGT additions are based
on pure market economics while the renewable growth is more dependent on public subsidies. How much of each
will be built depends on the market conditions and the policy incentives.
4.1. Impact on Carbon Emission and Climate Policy
Unless replaced by emission-free hydro or renewable energy, the retirement of nuclear generation from the grid
results in a net increase in greenhouse gas emissions. The immediate impact of 30 GW nuclear retirement is an
8.7% increase in CO2 emissions for the U.S. power sector (carbon intensity of the dispatchable generators times
§ 30 GW would correspond to the retirement of the 21 GW merchant plants at risk identified in section 2.2, plus 7 GW cost-
of-service-regulated plants.

18
242 TWh). This would represent a large setback in achieving the objective of 32% emission reduction from the
2005 level by 2030**.
Is it feasible to reach climate policy objectives without nuclear? Calculations shows that carbon emissions
reduction goals could still achieved without nuclear if coal power plants retire massively and are replaced by natural
gas and renewables. An example of such a scenario is exhibited in Figure 13. A transition away from coal and
nuclear would be politically challenging but could be affordable if natural gas remains cheap and the cost of
renewables and energy storage continues to decrease (Lazard, 2016).
Figure 13. 2030 climate policy objectives could be achieved without nuclear in a hypothetical scenario where half
of the coal-fired capacity retires, demand is stable, renewables production expand by a factor 3 and natural gas
accounts for the rest (58%) of the electricity generation. Still, nuclear would be essential to meet the 2050 policy
objectives.
However, more aggressive goals such as an 80% emissions decrease by 2050 would require full utilization of
emission-free resources to eliminate coal power generation and reduce natural gas utilization. Nuclear would prove
essential to reach long-term climate objectives.
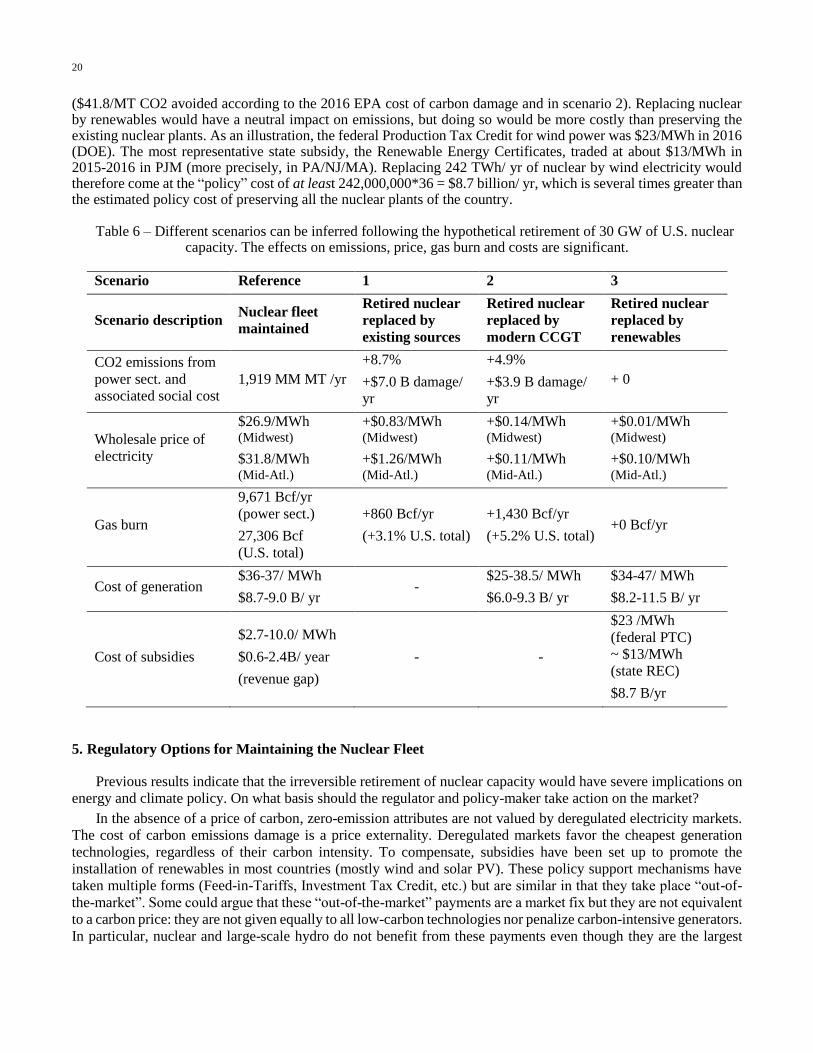
The cost of carbon damage avoided by 30 GW of nuclear capacity is evaluated to $7.0 billion / yr – at the current
social cost of carbon of $41.8/MT CO2 (EPA, 2016) and the 2015 carbon intensity of 0.695 MT CO2/ MWh for
the make-up generation (refer to Table 6 for scenario comparison).
4.2. Short-term Impact on Electricity Price
The immediate retirement of a power plant creates a shift to the left of the supply curve, leading to an upward
price shock. However such a case occurs rarely in practice. Instead, retirements are announced years in advance
(see Table 1) and the market agents have time to react, for instance by planning the construction of new power
plants, by refurbishing old ones, or by postponing the outage and retirements of existing generators. The price shock
observed is therefore less severe than if the plants were to retire overnight, without notice.
For the purposes of estimating the upper limit of the price shock, we nevertheless simulated the brutal retirement
of 30% of the nuclear capacity in the 2015 Midwest and Mid-Atlantic wholesale market models presented in 3.1.1
and in Appendix A. To meet the electricity demand, the other generators augment their production; this is our
scenario 1. The yearly-average price shock is +$0.8 and +$1.3/MWh in the Midwest and Mid-Atlantic respectively.
These represent an increase in the cost for the consumers of $561M and $840M/ year in these two regions.
** Goal of the Clean Power Plan for the power sector.

19 G. Haratyk / Early Nuclear Retirements in Deregulated U.S. Markets
4.3. Long-term Impact on Electricity Price
The long-term impact on price resulting from an adaptation of the market agents to the nuclear retirements is
more complex and uncertain to predict. Some types of electricity market models (Sepulveda, 2016) can infer what
type of generators and how many of them will replace the retired generators. As we can expect, the type of
generators being build depends heavily on fuel prices (for dispatchable generators) and policy support (for
renewables). For the purpose of brevity in this paper a simpler approach is employed. The wholesale market model
is conserved while modifying the assumption on the installed capacity mix. In scenario 2 and 3, 30% of the nuclear
capacity is replaced by new combined cycle plants and wind turbines respectively. The amount of capacity addition
is inversely proportional to the capacity factor of the technology considered (0.87 for CCGT and 0.39 for Midwest
wind for instance). The effect on price is summarized in Table 6. As expected, in both cases the effect is much milder than the “short-
term” effect where market agents do not have time to react. The price increase is less than +$0.14/MWh in scenario 2 due to currently low gas prices (2015 gas prices are assumed: $3.2/ MMBtu average)††. In the Mid-Atlantic region, the effect would be softer (+$0.11/MWh) due to the fact that gas plants are infra-marginal and that coal plants still set the price of electricity (Figure 8). In scenario 3 where renewables replace nuclear, there is nearly zero price effect because wind replaces nuclear base-load generators. Wind and nuclear are always infra marginal in the supply curve and never set the price of electricity.
4.4. Impact on Natural Gas Market
The retirement of base-load nuclear increases the production of electricity from fossil fuel, and from natural gas in particular. This additional demand has a significant impact on the natural gas market. In scenario 1 (nuclear replaced by existing generators), the increase in natural gas burn is 860 Bcf/year, i.e. 3.1% of the total U.S. consumption‡‡. In scenario 2 (nuclear replaced by modern CCGT), the increase is 1,430 Bcf/yr, 5.2% of the U.S. consumption. In scenario 3, there is no increase in gas consumption.
As seen previously in 3.1.4 and Figure 10, the replacement of nuclear plants by gas-fired plants would make electricity markets even more dependent on natural gas supply and therefore more sensitive to natural gas price variations. This high dependence could also jeopardize the security of electricity supply when natural gas is scarce (e.g. in case of polar vortex or pipeline failure).
4.5. Impact on the Cost of Generation
The average cost of generation of the nuclear capacity at risk is $36-37/ MWh over 2017-2019, which amounts to $8.7-9 B / yr for 30 GW of capacity. By comparison, the equivalent generation from new CCGT would come at a levelized cost of $25-38.5/ MWh§§ or $6.0-9.3 B / yr. The equivalent wind power generation would have a levelized cost of $34-47/MWh or $8.2-11.5 B / yr***.
4.6. Impact on the Cost of Subsidies
Preserving 30 GW of nuclear at risk would come at a minimal cost of $0.6 to 2.4 billion/ year, and $2.7 to 10.0/ MWh†††. This is well below the $3.9 billion / yr cost of carbon damage – a price externality – caused by its retirement
†† If gas prices were to reach $4/MMBtu, the price increase would be higher in the Midwest, about +$0.86/MWh. ‡‡ The natural gas consumption in the U.S. in 2015 was 27,306 Bcf (EIA, 2016). The heat rate for existing natural gas power
plant is assumed to be 7,476 Btu/kWh. §§ §§ Assumptions: 8% discount rate, CF= .4-.7, fuel price $2.4-5.2/MMBtu. Cost range based on Lazard, 2016. *** *** Assumptions: 8% discount rate, CF=.3-.55. Cost range based on Lazard, 2016. ††† The width of the range corresponds to the profitability gaps of the plants we select for policy support. It is more expensive
to support 30 GW of plants that are the very much “out-of-the-money” ($10.0/ MWh) than 30 GW that are close to
profitability ($2.7/ MWh).
20
($41.8/MT CO2 avoided according to the 2016 EPA cost of carbon damage and in scenario 2). Replacing nuclear by renewables would have a neutral impact on emissions, but doing so would be more costly than preserving the existing nuclear plants. As an illustration, the federal Production Tax Credit for wind power was $23/MWh in 2016 (DOE). The most representative state subsidy, the Renewable Energy Certificates, traded at about $13/MWh in 2015-2016 in PJM (more precisely, in PA/NJ/MA). Replacing 242 TWh/ yr of nuclear by wind electricity would therefore come at the “policy” cost of at least 242,000,000*36 = $8.7 billion/ yr, which is several times greater than the estimated policy cost of preserving all the nuclear plants of the country.
Table 6 – Different scenarios can be inferred following the hypothetical retirement of 30 GW of U.S. nuclear
capacity. The effects on emissions, price, gas burn and costs are significant.
Scenario Reference 1 2 3
Scenario description Nuclear fleet
maintained
Retired nuclear
replaced by
existing sources
Retired nuclear
replaced by
modern CCGT
Retired nuclear
replaced by
renewables
CO2 emissions from
power sect. and
associated social cost
1,919 MM MT /yr
+8.7%
+$7.0 B damage/
yr
+4.9%
+$3.9 B damage/
yr
+ 0
Wholesale price of
electricity
$26.9/MWh (Midwest)
$31.8/MWh (Mid-Atl.)
+$0.83/MWh (Midwest)
+$1.26/MWh (Mid-Atl.)
+$0.14/MWh (Midwest)
+$0.11/MWh (Mid-Atl.)
+$0.01/MWh (Midwest)
+$0.10/MWh (Mid-Atl.)
Gas burn
9,671 Bcf/yr
(power sect.)
27,306 Bcf
(U.S. total)
+860 Bcf/yr
(+3.1% U.S. total)
+1,430 Bcf/yr
(+5.2% U.S. total) +0 Bcf/yr
Cost of generation $36-37/ MWh
$8.7-9.0 B/ yr -
$25-38.5/ MWh
$6.0-9.3 B/ yr
$34-47/ MWh
$8.2-11.5 B/ yr
Cost of subsidies
$2.7-10.0/ MWh
$0.6-2.4B/ year
(revenue gap)
- -
$23 /MWh
(federal PTC)
~ $13/MWh
(state REC)
$8.7 B/yr
5. Regulatory Options for Maintaining the Nuclear Fleet
Previous results indicate that the irreversible retirement of nuclear capacity would have severe implications on
energy and climate policy. On what basis should the regulator and policy-maker take action on the market?
In the absence of a price of carbon, zero-emission attributes are not valued by deregulated electricity markets.
The cost of carbon emissions damage is a price externality. Deregulated markets favor the cheapest generation
technologies, regardless of their carbon intensity. To compensate, subsidies have been set up to promote the
installation of renewables in most countries (mostly wind and solar PV). These policy support mechanisms have
taken multiple forms (Feed-in-Tariffs, Investment Tax Credit, etc.) but are similar in that they take place “out-of-
the-market”. Some could argue that these “out-of-the-market” payments are a market fix but they are not equivalent
to a carbon price: they are not given equally to all low-carbon technologies nor penalize carbon-intensive generators.
In particular, nuclear and large-scale hydro do not benefit from these payments even though they are the largest

21 G. Haratyk / Early Nuclear Retirements in Deregulated U.S. Markets
contributors to carbon-free electricity in the United States. As a result, nuclear reactors have been competing directly
with fossil-fuel technologies on one hand and subsidized renewables on the other hand (see figure below and
prophetic article by Rothwell, 2000). A large share of the already-built, existing fleet is struggling financially, as
discussed in section 2 and 3. It is needless to say that in these conditions capital investments in new nuclear are even
less attractive, even in regulated markets‡‡‡. Figure 14 exhibits the competitiveness gap for nuclear at the moment,
on the basis of levelized cost of electricity (LCOE). LCOE has limitations – notably when it comes to compare the
system cost of intermittent generators versus dispatchable generators – but it is a simple way to compare the
competitiveness of technologies taken in isolation.
Figure 14. Under current costs, existing U.S. nuclear reactors are being replaced by CCGT units and subsidized
renewables§§§. The capital cost assumptions are from Lazard (2016).
As seen in sections 2 and 3, the threat to nuclear capacity is immediate and requires a rapid response, which
could effectively, timely and decisively come from the policy-makers and regulators. This section discusses possible
options that could relieve the financial pressure on nuclear. The discussion can also more broadly apply to any
capital-intensive low-carbon energy resources.
5.1. Putting a Price on Carbon
Putting a price on carbon would capture the externality of environmental and societal damage caused by carbon
emissions (I.J. Perez-Arriaga, 2013). Two systems are generally proposed for carbon price: a carbon tax or a cap &
trade system. The carbon tax lets the regulator control the price level, with the risk of over- or under-shooting the
emission targets. The cap & trade system relies on markets. The emission targets are set by the regulator who grants
credits, which are then traded between generators. In the second system, the difficulty lies in the initial allocation
of the credits.
Carbon pricing is a very efficient measure to achieve carbon emission reduction at a minimal cost. It is
technology-agnostic. It favors low-carbon generators at the expense of the carbon-intensive ones, such that the
‡‡‡ The last decision to build new reactors, the four AP1000s in Vogtle and VC Summer, happened in 2008 in much more
favorable economic conditions than today’s and with a loan guarantee from the federal government. §§§ Assumptions: 8% discount rate, CF= .9 (nuclear), .3-.55 (wind), 0.23-0.32 (solar), 0.93 (coal), .4-.7 (CCGT), fuel
price=$1.47/MMBtu (coal) and $2.4-5.2/MMBtu (NG), existing nuclear cost range based on 2016 estimates.
0 50 100 150
New nuclear
New coal
New CCGT
Utility-scale solar PV
Onshore wind
Existing nuclear
New
cap
acit
y
Levelized Cost of Electricity Generation in the United States in 2016
(unsubsidized USD/MWh)

22
current “out-of-the-market” payments are no longer justified. It leaves room for innovative clean technologies to
enter the market and displace the polluting and less efficient generators. However, putting a price of carbon is a
challenge. One of the major obstacles is the increase in the energy price resulting from the addition of the cost of
carbon. The price of goods would increase, which would hurt the economy in the short and medium term, even
though the long-term damages are minimized on the long run. If carbon pricing is implemented unevenly, the
markets that adopt it face a competitive disadvantage with respect to the other markets because their products
become pricier.
An intermediate approach was proposed by NEPOOL, an association of the market participants of ISO-NE
(Exelon, 2016). It consists in adding the cost of carbon to the bids of the market participants, for calculation in the
resource dispatch algorithm. Low carbon technologies like nuclear would benefit from a higher price of electricity,
and low-carbon subsidies could be eliminated. The new element of the mechanism is the re-allocation of the carbon
cost: carbon-emitting generators that are called and dispatched would compensate the ISO for their emissions. The
proceedings would then be allocated to the load serving entities (i.e. the consumers) to lower their energy bill. This
mechanism enables to partially alleviate the burden of carbon pricing to the consumer. This instrument could be
created rapidly because the ISOs centrally control the dispatch algorithm. The carbon price could be progressively
increased and the out-of-the-market subsidies progressively reduced to ensure a smooth transition and give market
agents time to adapt.
Table 7 illustrates the hypothetical outcome of a carbon price that would be applied to the Midwest and Mid-
Atlantic regions. The simulations use the 2015 wholesale market model presented in section 3.1.1. A moderate
carbon price as low as $10 / MT CO2 would provide extra revenues to the nuclear plants equal to $7.2 and $8.4/
MWh for the Midwest and Mid-Atlantic respectively. This measure would potentially suffice to prevent all nuclear
retirements (according to Table 3). By allocating the cost of carbon to coal-, gas- and oil-fired generators, the price
increase for the consumers would be limited to $2.0 and $4.6/ MWh respectively.
Table 7 – Putting a price on carbon lowers C02 emissions and increases the wholesale price of electricity, which would benefit nuclear plants. The price increase for consumers could be partly alleviated by charging the
polluters for their carbon damage (simulation results obtained with 2015 cost assumptions).
Carbon price ($/MT CO2) 0 10 20 30 41.2
(EPA social
cost of carbon)
Midwest Emissions (MM MT CO2) 430.93 360.85 272.32 258.84 258.57
Wholesale electricity price
($/MWh) 26.9 +7.2 +14.4 +23.1 +33.2
Consumer price w/ rebate ($/MWh) 26.9 +2.0 +6.6 +12.0 +17.9
Mid-
Atlantic Emissions (MM MT CO2) 271.90 263.15 263.00 262.99 262.99
Wholesale electricity price
($/MWh) 31.8 +8.4 +16.9 +25.3 +34.8
Consumer price w/ rebate ($/MWh) 31.8 +4.6 +9.2 +13.8 +18.9
5.2. Crediting Zero-Emission Attributes (direct subsidy)
The most direct way for maintaining (and expanding) zero-emission generators is to subsidize them. Direct
subsidies are the most popular form of policy support: Feed-in-Tariffs (FIT), Feed-in-Premiums (FIP), Contract-
for-Differences (CfD) for renewables or other technologies are already present all over the globe. The subsidies

23 G. Haratyk / Early Nuclear Retirements in Deregulated U.S. Markets
generally take the form of payments for the electricity supplied to the grid from a given technology or plant, and
are expressed in $/MWh. The cost is allocated to electricity bills in the form of “policy cost”. FITs have been a
common method of policy support for wind and solar PV technologies at the beginning, but were later replaced in
Europe by FIPs with competitive bidding. Premiums are a payment that is added to the wholesale electricity sale
revenue rather than a substitutive fixed tariff. Note that subsidies through competitive bidding requires multiple
independent agents to be effective. A CfD can be seen as a long-term power purchase agreement for the electricity
generated from a particular source. The U.K. implemented a CfD program for new nuclear which led investors to
the decision to build four large EPR reactors.
New York and Illinois States recently voted for another form of direct subsidy for nuclear, in the form of “Zero
Emission Credits” (ZECs). Both New York and Illinois subsidies are based on the social cost of carbon, which is
adjusted by an electricity price index (energy + capacity) in order to limit the cost to the consumers. The NY subsidy
is revised every other year based on the EPA cost of carbon and a forward power market index. The formula is as
follows:
𝑍𝐸𝐶($/𝑀𝑊ℎ) = 𝐶𝑎𝑟𝑏𝑜𝑛𝐶𝑜𝑠𝑡 − 𝑅𝐺𝐺𝐼 − 𝑚𝑎𝑥(𝑃𝑟𝑖𝑐𝑒𝐼𝑛𝑑𝑒𝑥 − 39,0)
with RGGI the Regional Greenhouse Gas Initiative payments ($10.4/short ton), and the carbon cost fixed at
$42.9/short ton. The market price index is equal to the sum of the a) the day-ahead fixed price future and b) the
capacity price, both averaged over two years in the zone (NY Public Service Commission, 2016). The initial ZEC
calculation results in a subsidy of $17.5/MWh. If implemented, the subsidy will secure the continued operation of
three nuclear plants (3.4 GW total capacity) in upstate New York for the next 14 years.
The Illinois program has a similar structure, with more provisions on the maximum payment that the plant
owners can receive. Nuclear capacity is large in Illinois, and the regulator cannot afford to subsidize all of it. The
subsidy is limited to 16% of electricity supplied to consumers, or 1.65% equivalent retail price increase on the bills
of the consumers – whichever is larger****. The subsidy is updated every year based on market price indexes. The
formula is the following:
𝑍𝐸𝐶($/𝑀𝑊ℎ) = 𝐶𝑎𝑟𝑏𝑜𝑛𝐶𝑜𝑠𝑡 − 𝑚𝑎𝑥(𝑃𝑟𝑖𝑐𝑒𝐼𝑛𝑑𝑒𝑥 − 𝐵𝑎𝑠𝑒𝑙𝑖𝑛𝑒𝑃𝑟𝑖𝑐𝑒, 0)
The carbon cost is originally taken at $16.5/ MWh and the baseline price at $31.4/MWh for the first calculation in
2017. The carbon cost is corrected for inflation in subsequent years. The price index is similar to the NY price
index: it is a sum of a) the forward wholesale price at the Northern Illinois hub and b) the capacity price in Illinois,
which is a 50/50 price blend of MISO zone 4 and PJM ComEd region (Illinois General Assembly, 2016). At current
future prices, the subsidy amounts to ~$14.7/MWh for the first year for Quad Cities and Clinton (2.9 GW total
capacity).
From a design perspective, ZECs or other direct subsidies have the advantage of being closely controlled by
the regulator or policy maker. The final dollar amount is set by the formulas above. Therefore, it can be tailored to
the exact “competitiveness gap” that the technologies deserve and include provisions to prevent deviations. For
instance the NY and Illinois subsidies target the specific plants at risk of shutdown and leave the profitable ones
unsubsidized. To further guarantee the legitimacy of the subsidy, Illinois demands the plant owner to (privately)
disclose its cost of generation.
History shows that in general it is difficult to determine the cost-effective level of direct subsidy that the
generators deserve. Direct support programs have commonly been more costly than anticipated, and past experience
shows that designers of FITs have often revised their tariff several times for the same country over a short period
of time (for example in Spain). Frequent regulatory changes can send confusing signals to investors, whereas long-
term vision and regulatory stability are essential for clean technologies to develop. To support large-scale
investments in new nuclear, subsidies must be guaranteed for tens of years (35 years in the U.K.) and cannot be left
at the mercy of changing political agendas.
Direct subsidies are effective but on the other hand they can have adverse effects. They distort the functioning
**** These two are effectively equivalent to a maximum subsidy of about $206 million/year for Clinton and Quad Cities.

24
of electricity markets. They alter the “natural” generation mix and the bids of the generators, which are in some
instance willing to bid negative prices to ensure their dispatch and receive policy payment. Negative prices have
for instance appeared in several wholesale markets at times when energy demand is low and renewable generation
large. The collapse of energy prices during some hours of the day negatively impacts the revenue of the technologies
that do not benefit from the same treatment. In some instances (such as the “Hughes vs. Talen Energy Marketing”
case), the regulator (FERC in this case) rejected the instrument because it interfered too much with markets. When
designing the mechanism, it is therefore essential to stress the value of the zero-carbon attribute as well as avoiding
the direct interference with day-ahead and real-time wholesale markets. The New York Clean Energy Standard was
designed according to this principle.
In the case of early nuclear shutdown, the best merits of ZECs are their effectiveness, easiness and rapidity of
implementation. If approved by the Federal Energy Regulatory Commission (FERC), the NY and Illinois subsidies
will have taken less than a year to be designed, voted and implemented. More states could follow and adopt a similar
ZEC to preserve their nuclear capacity.
5.3. Creating a Low-Carbon Capacity Mechanism
Capacity mechanisms are designed to ensure enough capacity is installed in the grid. They provide a substantial
source of revenue to generators. They solve the so-called “missing money” problem that occurs when energy prices
are capped and they ensure the generators are properly remunerated for the reliability they offer (Joskow, 2006).
Capacity mechanisms are therefore unnecessary when energy prices are not capped (such as in Texas, Australia).
They are present in most deregulated markets of the United States (PJM, New England, New York, MISO,
California) and in Europe. They enable the regulator to better control security of supply by running capacity auctions
several years before delivery. Early auctions also lower the risk for investors because stakeholders know what
capacity price and generation mix to expect before investing in new assets.
Capacity mechanisms can take several forms: capacity market, reliability options, or capacity payments. They
are a relatively recent addition to energy markets; their design is still on-going and changes regularly. A recent
change occurred in the PJM and New England capacity markets, following the 2014 polar vortex. The regulator
now imposes heavy penalties the generators that clear the capacity market but are not available when needed (i.e.
during scarcity periods). Bids and prices have consequently increased. The reform helps the most reliable generators
such as nuclear and hydro†††† be more profitable and competitive in the capacity market.
The advantage of capacity mechanisms is that they are already in place in many regions. They are a market-
based approach to value reliability: the capacity needed is forecasted by the regulator and the price is given by
market. It also means that the capacity price may be zero if there is over-capacity in the grid. From a design
perspective, the rules of the capacity auction (time-to-delivery) are crucial for determining which new technologies
can bid. If the costs of new generation change, the technology being built may be different than the one the policy-
maker expected in the first place.
A more oriented and innovative approach to value reliable, low-carbon generation capacity could be to add an
environmental dimension to capacity mechanisms. It would give an instrument for policy makers to ensure that a
“cleaner” capacity and energy mix is achieved. The concept would be to give a premium to zero-carbon technologies
and/or a penalty to carbon-emissive technologies. The environmental dimension could be directly included in the
market clearing algorithm (case of a penalty), or occur after market clearing (case of a premium/ credit). The
capacity auction could alternatively be set in a separate capacity market dedicated to low-carbon resource. The
tender for low-carbon capacity would be run 5 to 10 years before the date of capacity delivery, such as large
infrastructure projects such as nuclear and hydro –with or without new transmission lines– could compete. The
demand-side of the capacity market would be composed of aggregators, large consumers and retailers. The auction
would be run by the regulator or grid operator. The “clean” capacity mechanism would allow the regulator to better
control the capacity mix. As a downside, load-follow and peak generators (coal, gas-fired and oil-fired) could
†††† Provided there is no drought.

25 G. Haratyk / Early Nuclear Retirements in Deregulated U.S. Markets
accelerate their retirement if their capacity payments drop too quickly. It may have detrimental consequences on
grid reliability and the cost of energy (currently, there is no cheap zero-emission substitute to “dirty generators” for
peak generation). Therefore, the transition from classical to clean capacity mechanism should be progressive to
prevent the disruption of peak power supply.
5.4. Expanding Low-Carbon Portfolio Standards
A portfolio standard is a system where electricity providers are mandated to buy a certain target of “clean”
electricity, i.e. generated from clean energy sources. Certificates are granted to clean energy generators for the
electricity they produce. They are then traded on an exchange platform, which provides extra revenue to the clean
generators. In the U.S., portfolio standards usually comprise renewables but not nuclear nor large hydro. A more
consistent approach would be to include all low-carbon generators in these portfolios. The nuclear fleet, with its
large electricity output, would benefit considerably from this measure.
The advantage of a portfolio standard as opposed to a direct subsidy (FIT, ZEC, CfD, etc.) is that the price is
set by the market instead of being dictated by the regulator of policy maker. Only the target will need to be decided
in advance. Renewable portfolio standards already exist in many states of the U.S., and adding other technologies
would be a minimal modification to the rules – albeit it would change the price equilibrium of the certificates. The
regulator would have to adjust the mandates to prevent too much disruption.
As a disadvantage, the regulator does not directly control the level of investment in clean technologies. The
price is given by the market and can be too low if excess clean generation is present. If certificates are inexpensive,
new investment in low-carbon technologies will stall.
Note also that in this measure all clean generation technologies would be remunerated at the same price
($/MWh). Renewables would compete with nuclear on an equal field.
5.5. Cost-Effective Mothballing of Nuclear Assets
As seen previously, current market conditions displace nuclear power plants in the United States. They retire
and enter the decommissioning process a few months later, preventing their restart forever. What if we could restart
them at a minimal cost when the market conditions improve? This is the mothballing option. The idea of mothballing
a non-profitable nuclear asset is not new. It was for instance proposed in the 1970’s for the Zion plant. It consists
of temporarily stopping the generation of electricity for a few years in the hope that the market conditions will get
better.
For the mothballing option to be applied, it is necessary for the cost of mothballing to be lower than the expected
loss of continued operation. The expected losses in operation ranged in 2016 from $0 to 32/MWh throughout the
fleet, with an average at $7.5/MWh. Can the cost of mothballing be lower than this?
Unlike fossil-fuel generators, the cost of nuclear generation has a very large fixed component due to security
and operation personnel (labour), routine inspection and maintenance. These fixed cost average to $18-19/MWh.
Variable costs (fuel and variable O&M) represent the rest: 40 to 60% of the annual cost of generation. We see
immediately that stopping the plant and saving the variable cost is not sufficient for preventing plants to lose money.
This is why premature retirements have so far been the only option for uneconomic plants to stop losing money.
The temporary shutdown of a plant for several years has not been considered due to high fixed cost required for
security, safety and equipment care.
The mothballing option would become interesting for nuclear operators only if the fixed cost requirements were
lowered. After all, once the reactor has been shut-down and the core has cooled down, the risk of an accident or
malevolent act is considerably reduced. This would justify to lower the safety and security requirements, two major
cost items‡‡‡‡. Unfortunately, there is no special regulatory status for a mothballed plant in the United States
‡‡‡‡ Recent progress in dry cask fuel storage technology could accelerate fuel unloading and reduce the safety requirements

26
currently. The Nuclear Regulatory Commission (NRC) recognizes only two types of regulatory status: a nuclear
plant is either under an operation license or under a decommissioning license. It would be desirable to create a
mothballing license for uneconomic plants. This new licensing status would define a set of reduced requirements
to lower the cost of mothballing down to 7.5*8760*0.92 = ~$60 million / GW-yr. Society would then preserve the
option to restart these zero-emission generation assets in the future when appropriate. Note that the mothballing
option would also preserve the option to extend the lifetime of the plants. Mothballing should be a preferable
alternative to irreversible retirement.
There is indeed a fundamental policy issue beyond the near-term decisions. The historical energy record has
been one of major surprises—from the oil embargo of the 1970s to natural gas fracking. Once we shut down and
decommissions major facilities, there is a large cost in dollars and time to rebuild if conditions change. The future
is uncertain and that uncertainty should be an essential consideration of any public policy. Two examples going
forward urge caution on irrevocable decisions. If a major event occurred, similar to the oil shock of the 1970s,
energy policies could change overnight with the demand for rapid reductions in greenhouse gas emissions with
every technology available. If a major weather event occurs, the limits of other low-carbon options such as
renewables would require rethinking. The January 2017 weather in Germany (low solar and low wind) that
dramatically reduced renewables output resulted in every fossil plant in Europe powering up—an unexpected
weather event indicating we do not have a good understanding of the energy security risk implications in a high-
renewables world.
6. Conclusion and Policy Implications
The drops in wholesale electricity prices over the past few years have exerted significant pressure on nuclear power capacity in the United States. These low prices, mostly caused by negative demand growth and cheap natural gas, are expected to persist. About 58 GW of nuclear capacity are unprofitable over the next few years, with a profitability gap of $5.5-7 / MWh on average. In deregulated markets, 21 GW are unprofitable or retiring with an average revenue shortfall of $4-7.5 / MWh. They are at risk of premature retirement.
The potential consequences of such a massive capacity withdrawal depend on the future energy mix. If 30 GW were replaced by modern gas-fired combined cycle plants, U.S. gas burn and carbon emissions from the power sector would increase by 5.2% and 4.8% respectively in estimates. Electricity markets would rely even more heavily on natural gas. If replaced by renewables (wind), the withdrawal would be carbon-neutral, but the policy cost would be severe. The federal tax credit and Renewable Portfolio Standards (RPS) program alone would cost more than $8 billion/ year in subsidies. In comparison, saving 30 GW of unprofitable nuclear plants could come at a cost of only $0.6-2.4 billion/ year for the customers.
In a context of uncertainty about future fuel prices, technological progress, and climate policy, the irreversible closure of nuclear assets should be delayed. Maintaining the U.S. nuclear capacity via a policy support mechanism in the short term is an affordable measure that preserves optionality. Today, it is at least two to four times more cost-effective to subsidize existing reactors than it is to subsidize renewables on a $/MWh basis.
The New York and Illinois “zero-emission credits” are an effective way to rapidly save nuclear plants at risk. But, similarly to renewables feed-in-tariffs, these payments take place out-of-the-market. Carbon pricing is an alternative policy option that would eliminate market distortions and benefit nuclear plants first. Its wide implementation is a long process, but it could be tested at the ISO level before broader application. A carbon price as low as $10 / MT CO2 would be sufficient to maintain most U.S. nuclear capacity.
Alternative regulatory options are the expansion of the RPS to include nuclear, the transition to “cleaner” capacity mechanism, and the creation of a mothballing status for unprofitable nuclear reactors.
In parallel with policy actions, the nuclear industry should continue its efforts to lower costs and adapts its technology. Automation, simplified Small Modular Reactors (Locatelli, 2014), offshore reactors (Haratyk, 2014),
after shutdown faster than in the past (Holtec, 2017). Fuel could go to dry cask storage as early as 2.5 years after cooldown
rather than 5 or more years currently.

27 G. Haratyk / Early Nuclear Retirements in Deregulated U.S. Markets
and nuclear energy storage technologies (Forsberg, 2016) are promising advances that could help nuclear be part of future low-carbon, deregulated electricity markets.
Acknowledgements
I would like to warmly thank my thesis advisors, Professors R. K. Lester, C. W. Forsberg and J. E. Parsons, for their help and advice in reviewing this paper. R. K. Lester and J. E. Parsons are MIT CEEPR faculty affiliates. We are also very grateful to the U.S. Department of Energy for supporting this research and for the cooperation of the Ministry of Economy, Trade and Industry (METI) of Japan.
References
L. David and C. Hausman, 2016. “Market Impacts of a Nuclear Plant Closure”, American Economic Journal:
Applied Economics, Vol.2, No. 2, pp. 92-122, 2016.
J. M. Deutch et al, 2009. “Update of the MIT 2003 Future of Nuclear Power, an Interdisciplinary MIT Study”,
Massachusetts Institute of Technology Energy Initiative report, 2009.
Energy Information Administration (EIA), 2016. Electricity Data Browser: http://www.eia.gov/electricity/data.cfm.
Energy Information Administration (EIA), 2016. “Form EIA-923 detailed data”.
https://www.eia.gov/electricity/data/eia923/
Energy Information Administration (EIA), 2009. “Short-Term Energy Outlook Supplement: Energy Price Volatility
and Forecast Uncertainty”.
Exelon, 2016. “Using Carbon Pricing in Dispatch to Meet the IMAPP Process Goal”, Presentation at NE Pool
meeting, August 2016.
C. Forsberg and P. Peterson, 2016. “Basis for Fluoride Salt–Cooled High-Temperature Reactors with Nuclear
Air-Brayton Combined Cycles and Firebrick Resistance-Heated Energy Storage”, Nuclear Technology, Vol. 196,
Pp. 13–33, October 2016.
G. Haratyk et al., 2014. “Flexblue®: a subsea and transportable small modular power plant”, Proc. of ICAPP,
Charlotte, USA, 2014.
G. Harris et al., 2013. “Cost estimates for nuclear power in the UK, Energy Policy, Volume 62, November 2013,
Pages 431-442, 2013.
Holtec International, 2017. “Bolstering Public Health and Safety by Proto-Prompt Decommissioning of Closing
Nuclear Plants”, Press Release HH 32.02, Jan 2017. https://holtec.files.wordpress.com/2017/01/hh-32_02.pdf
Illinois General Assembly, Bill 2814, 2016.
http://www.ilga.gov/legislation/fulltext.asp?DocName=09900SB2814&GA=99&SessionId=88&DocTypeId=
SB&LegID=96125&DocNum=2814&GAID=13&Session=
IEA, 2016. “Re-powering Markets: Market Design and Regulation during the Transition to Lowe-Carbon Power
Systems”, IEA Electricity Market Series, 2016.
P. Joskow, 2006. “Competitive Electricity Markets and Investment in New Generating Capacity”, AEI-Brookings
Joint Center Working Paper No. 06-14, May 2006.
P. Joskow and J. Parsons, 2009. “The Economic Future of Nuclear Power”, Daedalus, Vol.138, No. 4, 2009.
P. Joskow and J. Parsons, 2012. “The Future of Nuclear Power after Fukushima”, Economics of Energy &
Environmental Policy, Vol. 1, No. 2, 2012.
J. Koomey and N. Hultman, 2007. “A Reactor-Level Analysis of Busbar Costs for US Nuclear Plants, 1970-2005”,
Energy Policy, Vol 35, pp. 5630-5642, 2007.
Lazard, 2016. “Lazard’s Levelized Cost of Energy Analysis – Version 10.0”, Dec 2016.
P. Linares and A. Conchado, 2013. “The Economics of New Nuclear Power Plants in Liberalized Electricity
Markets”, Energy Economics, Vol. 40, pp.S119-S125, 2013.
G. Locatelli et al., 2014. “Small Modular Reactors: A Comprehensive Overview of their Economics and Strategic
Aspects”, Progress in Nuclear Energy, Volume 73, May 2014, Pages 75-85, May 2014.
28
K. Maize, 2016. “Entergy Sheds Uneconomic Merchant Nuclear Plants to Focus on Regulated Business”, Power
magazine article, April 1st, 2016, http://www.powermag.com/entergy-sheds-uneconomic-merchant-nuclear-
plants-focus-regulated-business/?pagenum=1
OECD-NEA, 2011. “Carbon Pricing, Power Markets and the Competitiveness of Nuclear Power”, NEA report No.
6982, 2011.
OECD-NEA, 2015, “Nuclear New Build: Insights into Financing and Project Management”, NEA Report No. 7195,
2015.
A. Okagawa, 2012. “Assessment of GHG emission reduction pathways in a society without carbon capture and
nuclear technologies”, Energy Economics, Volume 34, Supplement 3, December 2012.
I.J. Perez-Arriaga and C. Meseguer, 1997. “Wholesale Marginal Price in Competitive Generation Markets”, IEEE
Transactions on Power Systems, Vol. 12, No. 2, May 1997.
I.J. Perez-Arriaga, 2013. Regulation of the Power Sector, Springer Verlag, London, 2013.
NY Public Service Commission, 2016. “Staff's Responsive Proposal For Preserving Zero-Emissions Attributes”.
July 2016.
Nuclear Energy Institute (NEI), 2016. US Nuclear Generating Statistics: http://www.nei.org/Knowledge-
Center/Nuclear-Statistics/US-Nuclear-Power-Plants/US-Nuclear-Generating-Statistics.
Nuclear Energy Institute (NEI), 2016. Nuclear Costs in Context. NEI White Paper.
Nuclear Regulatory Commission (NRC), 2016. Status of License Renewal Applications and Industry Activities:
http://www.nrc.gov/reactors/operating/licensing/renewal/applications.html
F. Roques et al., 2006. “Nuclear Power: A Hedge against Uncertain Gas and Carbon Prices?”, The Energy
Journal, Vol.27, No.4, 2006.
C. Rorke, 2016. Where Have All the Nuclear Plants Gone? R Street Policy Study No. 70, 2016.
G. Rothwell, 2000. “The Risk of Early Retirement of U.S. Nuclear Power Plants under Electricity Deregulation and
CO₂ Emission Reductions.” The Energy Journal, vol. 21, no. 3, pp. 61–87, 2000.
N. Sepulveda, 2016. “Decarbonization of Power Systems: Analyzing Different Technological Pathways”, Master’s
Thesis, MIT, 2016.
R. Sims et al., 2003. “Carbon Emission and Mitigation Cost Comparisons between Fossil Fuel, Nuclear and
Renewable Energy Resources for electricity Generation”, Energy Policy, Vol. 31, pp. 1315-1326, 2003.
SNL Financial, 2016. SNL Modeled Production Costs. www.snl.com.
SNL Financial, 2016. Generation Supply Curve Assumption and Methodology.
https://www.snl.com/help/Generation_Supply_Curve.htm?rhtocid=3.10.0_1#
N. Steckler, 2016. Reactors in the Red: Financial Health of the US Nuclear Fleet. Bloomberg New Energy Finance
research note.
US Government Interagency Working Group on Social Cost of Greenhouse Gases, 2016. “Technical Update of the
Social Cost of Carbon for Regulatory Impact Analysis – Under Executive Order 12866”, August 2016.
F. Zhang, 2007. “Does Electricity Restructuring Work? Evidence from the U.S. Nuclear Energy Industry”, The
Journal of Industrial Economics, Vol. LV, No. 3, September 2007

29 G. Haratyk / Early Nuclear Retirements in Deregulated U.S. Markets
Appendix A. Wholesale electricity market model and assumptions
The formulation of the economic dispatch problem is as follows:
Find:
min𝑞𝑖,𝑛,
𝑞𝑉𝑂𝐿𝐿,𝑛(
∑ (c𝑖 + 𝑐c𝑖)𝑞𝑖,𝑛 + c𝑉𝑂𝐿𝐿𝑞𝑉𝑂𝐿𝐿,𝑛𝑔𝑒𝑛𝑒𝑟𝑎𝑡𝑜𝑟 𝑖ℎ𝑜𝑢𝑟 𝑛 )
With
c𝑖 variable cost of generation for generator 𝑖cc𝑖 cost of CO2 emissions for generator 𝑖𝑞𝑖,𝑛 power output of generator 𝑖 during hour 𝑛c𝑉𝑂𝐿𝐿 value of lost load
𝑞𝑉𝑂𝐿𝐿,𝑛 lost load during hour 𝑛
Subject to :
- Power demand constraint
∑ 𝑞𝑖,𝑛 + 𝑞𝑉𝑂𝐿𝐿,𝑛𝑔𝑒𝑛𝑒𝑟𝑎𝑡𝑜𝑟 𝑖= 𝑑𝑛 , ∀𝑛
with 𝑑𝑛 the total electricity demand during hour 𝑛
- Minimum and maximum power constraint for each generator (except solar PV)
𝑞𝑖,𝑚𝑖𝑛 < 𝑞𝑖,𝑛 < 𝑞𝑖,𝑚𝑎𝑥 , ∀𝑖, 𝑛
- Minimum and maximum power from wind power generators during each hour of the year
(curtailment is allowed)
0 < 𝑞𝑤𝑖𝑛𝑑,𝑛 < 𝑞𝑤𝑖𝑛𝑑𝑀𝑎𝑥,𝑛 , ∀𝑛
- Minimum and maximum ramping rate (change in power output of the generator between two
consecutive hours)
𝑞𝑖,𝑛 + 𝑞𝑖 < 𝑞𝑖,𝑛+1 < 𝑞𝑖,𝑛 + 𝑞𝑖 , ∀𝑖, 𝑛
with 𝑞𝑖 and 𝑞𝑖 the maximum change in output down and up (MW/hour) respectively for generator 𝑖
The generators parameters for each year and region are listed in Table 8Table 9Table 10 and Table 11.
Table 8 – Cost and technical assumptions for generators in the Midwest region in 2015

30
Generator
name
Nameplate
capacity
(MW)
Availability
(%)
Fuel price
($/MMBtu)
Heat rate
(MMBtu/
MWh)
Fuel cost
($/ MWh)
Variable
O&M
cost
($/MWh)
Supply bid
= marginal
production
cost
($/MWh)
Ramp up
(%/hr)
Ramp
down
(%/hr)
Nuclear 20,200.5 0.92 0.72 10458 7.5 0.63 8.1 0% 0%
coal_IA 5,638.1 0.83 1.47 10495 11.3 5.50 16.8 31% 58%
coal_IL 14,658 0.83 1.75 10495 15.4 4.27 19.7 31% 58%
coal_IN 16,611.5 0.83 2.65 10495 18.2 5.36 23.5 31% 58%
coal_MI 10,743.7 0.83 2.33 10495 18.4 5.62 24.0 31% 58%
coal_MN 4,169.9 0.83 1.74 10495 18.3 7.31 25.6 31% 58%
coal_MO 12,101 0.83 1.73 10495 21.9 4.43 26.3 31% 58%
coal_ND 4,195.1 0.83 1.07 10495 24.5 4.78 29.3 31% 58%
coal_WI 7,220.1 0.83 2.09 10495 27.9 8.94 36.8 31% 58%
CCGT_IA 2,630.5 0.85 3.23 7878 25.4 6.07 31.5 82% 75%
CCGT_IL 13,507.7 0.85 3.23 7878 25.4 5.08 30.5 82% 75%
CCGT_IN 5,069.9 0.85 3.23 7878 25.4 2.15 27.6 82% 75%
CCGT_MI 7,492.9 0.85 3.21 7878 25.3 2.84 28.1 82% 75%
CCGT_MN 4,776.9 0.85 3.23 7878 25.4 4.91 30.4 82% 75%
CCGT_MO 5,499.7 0.85 3.23 7878 25.4 8.01 33.5 82% 75%
CCGT_ND 328 0.85 2.89 7878 22.8 2.01 24.8 82% 75%
CCGT_WI 5,945 0.85 3.23 7878 25.4 4.19 29.6 82% 75%
CCGT_new 0 0.87 3.23 6600 21.3 2.75 24.1 82% 75%
GT 9,120.1 1.00 6.74 10987 74.1 15 89.1 82% 75%
Hydro 2,144 0.51 0 0 0.0 0 0.0 5% 5%
Wind 19,271.1 CF=0.39 0 0 0.0 0 0.0 0% 0%
Total 171,323.7
Table 9 – Cost and technical assumptions for generators in the Midwest region in 2008
Generator
name
Nameplate
capacity
(MW)
Availability
(%)
Fuel price
($/MMBtu)
Heat rate
(MMBtu/
MWh)
Fuel cost
($/ MWh)
Variable
O&M
cost
($/MWh)
Supply bid
= marginal
production
cost
($/MWh)
Ramp up
(%/hr)
Ramp
down
(%/hr)
Nuclear 20,368 0.91 0.51 10452 5.29 0.56 5.85 0% 0%
coal_IA 6,528 0.84 1.01 10378 10.53 5.62 16.14 31% 58%
coal_IL 15,117 0.84 1.40 10378 14.50 3.53 18.03 31% 58%
coal_IN 18,916 0.84 2.03 10378 21.10 4.35 25.45 31% 58%
coal_MI 11,597 0.84 1.92 10378 19.90 4.43 24.33 31% 58%
coal_MN 5,077 0.84 1.48 10378 15.40 6.28 21.68 31% 58%
coal_MO 11,146 0.84 1.33 10378 13.79 4.28 18.07 31% 58%
coal_ND 4,098 0.84 0.72 10378 7.50 4.07 11.57 31% 58%
coal_WI 7,316 0.84 1.74 10378 18.04 5.19 23.23 31% 58%
CCGT_IA 2,395 0.88 9.02 8305 74.91 4.17 79.08 82% 75%
CCGT_IL 13,462 0.88 10.10 8305 83.88 13.42 97.30 82% 75%
CCGT_IN 5,360 0.88 9.61 8305 79.81 6.04 85.85 82% 75%
CCGT_MI 8,430 0.88 8.75 8305 72.67 9.27 81.93 82% 75%
CCGT_MN 4,226 0.88 9.23 8305 76.66 5.02 81.68 82% 75%
CCGT_MO 5,550 0.88 9.02 8305 74.91 5.11 80.02 82% 75%
CCGT_ND 10 0.88 9.02 8305 74.91 3.89 78.81 82% 75%
CCGT_WI 6,165 0.88 9.24 8305 76.74 7.03 83.77 82% 75%
CCGT_new 0 0.87 3.23 6600 21.3 2.75 24.1 82% 75%
GT 9,557 1.00 10.87 11015 119.73 19.39 139.12 82% 75%
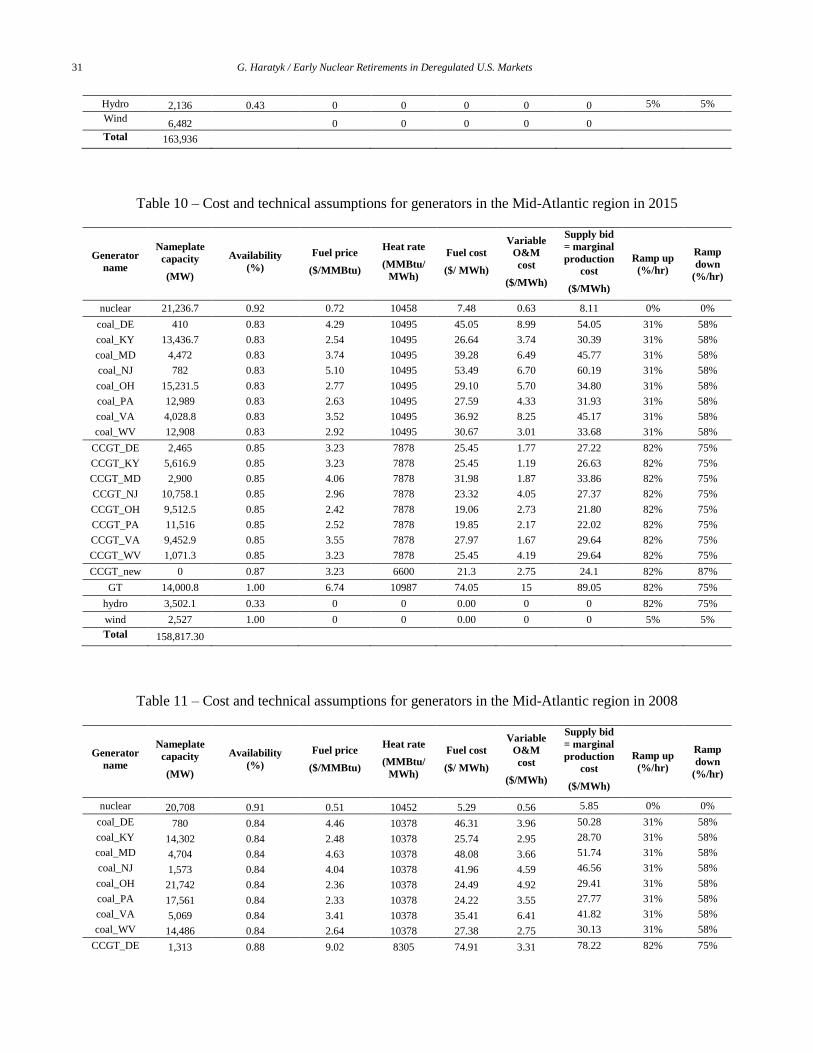
31 G. Haratyk / Early Nuclear Retirements in Deregulated U.S. Markets
Hydro 2,136 0.43 0 0 0 0 0 5% 5%
Wind 6,482 0 0 0 0 0
Total 163,936
Table 10 – Cost and technical assumptions for generators in the Mid-Atlantic region in 2015
Generator
name
Nameplate
capacity
(MW)
Availability
(%)
Fuel price
($/MMBtu)
Heat rate
(MMBtu/
MWh)
Fuel cost
($/ MWh)
Variable
O&M
cost
($/MWh)
Supply bid
= marginal
production
cost
($/MWh)
Ramp up
(%/hr)
Ramp
down
(%/hr)
nuclear 21,236.7 0.92 0.72 10458 7.48 0.63 8.11 0% 0%
coal_DE 410 0.83 4.29 10495 45.05 8.99 54.05 31% 58%
coal_KY 13,436.7 0.83 2.54 10495 26.64 3.74 30.39 31% 58%
coal_MD 4,472 0.83 3.74 10495 39.28 6.49 45.77 31% 58%
coal_NJ 782 0.83 5.10 10495 53.49 6.70 60.19 31% 58%
coal_OH 15,231.5 0.83 2.77 10495 29.10 5.70 34.80 31% 58%
coal_PA 12,989 0.83 2.63 10495 27.59 4.33 31.93 31% 58%
coal_VA 4,028.8 0.83 3.52 10495 36.92 8.25 45.17 31% 58%
coal_WV 12,908 0.83 2.92 10495 30.67 3.01 33.68 31% 58%
CCGT_DE 2,465 0.85 3.23 7878 25.45 1.77 27.22 82% 75%
CCGT_KY 5,616.9 0.85 3.23 7878 25.45 1.19 26.63 82% 75%
CCGT_MD 2,900 0.85 4.06 7878 31.98 1.87 33.86 82% 75%
CCGT_NJ 10,758.1 0.85 2.96 7878 23.32 4.05 27.37 82% 75%
CCGT_OH 9,512.5 0.85 2.42 7878 19.06 2.73 21.80 82% 75%
CCGT_PA 11,516 0.85 2.52 7878 19.85 2.17 22.02 82% 75%
CCGT_VA 9,452.9 0.85 3.55 7878 27.97 1.67 29.64 82% 75%
CCGT_WV 1,071.3 0.85 3.23 7878 25.45 4.19 29.64 82% 75%
CCGT_new 0 0.87 3.23 6600 21.3 2.75 24.1 82% 87%
GT 14,000.8 1.00 6.74 10987 74.05 15 89.05 82% 75%
hydro 3,502.1 0.33 0 0 0.00 0 0 82% 75%
wind 2,527 1.00 0 0 0.00 0 0 5% 5%
Total 158,817.30
Table 11 – Cost and technical assumptions for generators in the Mid-Atlantic region in 2008
Generator
name
Nameplate
capacity
(MW)
Availability
(%)
Fuel price
($/MMBtu)
Heat rate
(MMBtu/
MWh)
Fuel cost
($/ MWh)
Variable
O&M
cost
($/MWh)
Supply bid
= marginal
production
cost
($/MWh)
Ramp up
(%/hr)
Ramp
down
(%/hr)
nuclear 20,708 0.91 0.51 10452 5.29 0.56 5.85 0% 0%
coal_DE 780 0.84 4.46 10378 46.31 3.96 50.28 31% 58%
coal_KY 14,302 0.84 2.48 10378 25.74 2.95 28.70 31% 58%
coal_MD 4,704 0.84 4.63 10378 48.08 3.66 51.74 31% 58%
coal_NJ 1,573 0.84 4.04 10378 41.96 4.59 46.56 31% 58%
coal_OH 21,742 0.84 2.36 10378 24.49 4.92 29.41 31% 58%
coal_PA 17,561 0.84 2.33 10378 24.22 3.55 27.77 31% 58%
coal_VA 5,069 0.84 3.41 10378 35.41 6.41 41.82 31% 58%
coal_WV 14,486 0.84 2.64 10378 27.38 2.75 30.13 31% 58%
CCGT_DE 1,313 0.88 9.02 8305 74.91 3.31 78.22 82% 75%

32
CCGT_KY 4,615 0.88 9.02 8305 74.91 3.19 78.10 82% 75%
CCGT_MD 1,728 0.88 11.16 8305 92.68 2.05 94.73 82% 75%
CCGT_NJ 8,033 0.88 10.78 8305 89.53 4.44 93.96 82% 75%
CCGT_OH 8,169 0.88 10.79 8305 89.61 2.16 91.77 82% 75%
CCGT_PA 8,270 0.88 10.46 8305 86.87 2.23 89.11 82% 75%
CCGT_VA 6,982 0.88 10.87 8305 90.28 2.76 93.04 82% 75%
CCGT_WV 1,042 0.88 10.08 8305 83.71 7.03 90.74 82% 75%
CCGT_new 0 0.87 3.23 6600 21.3 2.75 24.1 82% 87%
GT 19,378 1.00 10.87 11015 119.73 19.39 139.12 82% 75%
hydro 3,107 0.31 0 0 0 0 0 82% 75%
wind 706 1.00 0 0 0 0 5% 5%
Total 164,268
The solving of the cost minimization procedure yields the hourly dispatch of the generator as well as the average
marginal cost of meeting electricity demand (dual variable of the demand constraint), which is equal to the
wholesale electricity price.
For validation purposes, we plotted the simulated mix and prices which we compared to their actual, historical
values. The mix is in reasonable agreement, except for the Mid-Atlantic region in 2015. This is due to the close
marginal cost from CCGT and from coal. The two technologies are very close in the merit order of the supply
stack. It would require a more a more granular modelling of the CCGT and coal units in the region to reproduce
the actual mix. However this is not needed to reproduce the actual price of electricity, which is simulated
accurately. Another simulation discrepancy is the price in Midwest region in 2008. The price is very sensitive to
the coal power plant flexibility and availability assumptions, which we may have overestimated.
Figure 15. The simulations are in reasonable agreement with the historical prices and energy mix despite the
simplicity of the model.
$42.4/MWh
Hubs $47.7-52.1/MWh
$26.9/MWh
Hubs $22.2-28.6/MWh
$59.4/MWh
Hubs $53.2-69.8/MWh
$31.8/MWh
Hubs $31.5-38.2/MWh
0%
10%
20%
30%
40%
50%
60%
70%
80%
90%
100%
simulated historical simulated historical simulated historical simulated historical
2008 2015 2008 2015
Midwest Mid-Atlantic
Simulation results vs. historical values
for energy mix composition and wholesale price
Wind
Hydro
Other
gas/CCGT
Coal
Nuclear


MIT CEEPR Working Paper Series is published by the MIT Center for Energy and Environmental Policy Research from submissions by affiliated researchers.
Copyright © 2017Massachusetts Institute of Technology
MIT Center for Energy and Environmental Policy Research 77 Massachusetts Avenue, E19-411Cambridge, MA 02139 USA
Website: ceepr.mit.edu
For inquiries and/or for permission to reproduce material in this working paper, please contact:
Email [email protected] (617) 253-3551Fax (617) 253-9845
Since 1977, the Center for Energy and Environmental Policy Research (CEEPR) has been a focal point for research on energy and environmental policy at MIT. CEEPR promotes rigorous, objective research for improved decision making in government and the private sector, and secures the relevance of its work through close cooperation with industry partners from around the globe. Drawing on the unparalleled resources available at MIT, affiliated faculty and research staff as well as international research associates contribute to the empirical study of a wide range of policy issues related to energy supply, energy demand, and the environment. An important dissemination channel for these research efforts is the MIT CEEPR Working Paper series. CEEPR releases Working Papers written by researchers from MIT and other academic institutions in order to enable timely consideration and reaction to energy and environmental policy research, but does not conduct a selection process or peer review prior to posting. CEEPR’s posting of a Working Paper, therefore, does not constitute an endorsement of the accuracy or merit of the Working Paper. If you have questions about a particular Working Paper, please contact the authors or their home institutions.