Embed Size (px)
Citation preview

Copyright # 2004 John Wiley & Sons, Ltd. DYSLEXIA 10: 265–288 (2004)Published online in Wiley InterScience (www.interscience.wiley.com). DOI: 10.1002/dys.272
& Early Language Developmentin Children with a GeneticRisk of DyslexiaPetra van Alphen, Elise de Bree, Ellen Gerrits, Jan de Jong,Carien Wilsenach and Frank Wijnen*
Utrecht Institute of Linguistics OTS, Utrecht University, Netherlands
We report on a prospective longitudinal research programmeexploring the connection between language acquisition deficits anddyslexia. The language development profile of children at-risk fordyslexia is compared to that of age-matched controls as well as ofchildren who have been diagnosed with specific languageimpairment (SLI). The experiments described concern the perceptionand production of grammatical morphology, categorical perception ofspeech sounds, phonological processing (non-word repetition),mispronunciation detection, and rhyme detection. The results of eachof these indicate that the at-risk children as a group underperform incomparison to the controls, and that, in most cases, they approach theSLI group. It can be concluded that dyslexia most likely hasprecursors in language development, also in domains other thanthose traditionally considered conditional for the acquisition ofliteracy skills. The dyslexia-SLI connection awaits further, particularlyqualitative, analyses. Copyright # 2004 John Wiley & Sons, Ltd.
Keywords: at-risk populations; language disorders; reading disabilities; morphology;grammar; phonology
INTRODUCTION
Previous studies have found that developmental dyslexiaz and languageacquisition deficiencies are related (Catts, Fey, Zhang, & Tomblin, 2001;Gallagher, Frith, & Snowling, 2000; Scarborough, 1991). The research
project reported on here was designed to explore this relationship in more detail,by using a prospective and longitudinal approach. The principal aim is todetermine whether children with a genetic risk for dyslexia show a delayed or
*Correspondence to: Frank Wijen, UIL OTS, Trans 10, 3512 JK Utrecht, Netherlands. Tel.:+31-30-253-6436; fax: +31-30-253-6000; e-mail: [email protected] is defined as an inability to attain fluent reading and writing skills in theabsence of general cognitive, neurological or sensory deficits, inadequate education,unfavourable social conditions, etcetera (cf. the World Federation of Neurology criteria).

deviant primary language acquisition in comparison to age-matched childrenfrom families without a history of dyslexia. The children were assessed on a widerange of linguistic abilities, including phonological, morphological, lexical andsyntactic skills. The results from these measures might contribute to the searchfor early linguistic precursors of dyslexia. Furthermore, in order to improve ourunderstanding of the linguistic difficulties that the at-risk children exhibit, theirlanguage development was compared to those of children with specific languageimpairment (SLI).} Thus, inclusion of children with SLI provides a ‘benchmark’of non-typical language acquisition. The comparison between the at-risk and SLIchildren also adds to the current discussion in the literature that dyslexia and SLIare closely related (Catts, 1993; Catts & Kamhi, 1999; MacArthur, Hogben,Edwards, Heath, & Mengler, 2000).
A number of prospective studies have looked at the connection betweenlanguage acquisition and dyslexia. Scarborough (1990, 1991) conducted apioneering study with children at-risk for developing dyslexia. Sixty-five percentof the children in her sample were classified as dyslexic by the age of 8 years. Atage 30 months, these children demonstrated a more restricted range of syntacticdevices and made more speech production errors. At the ages of 36 and 42months, the vocabulary skills of the dyslexic children were less well developedthan those of the controls and their syntactic difficulties persisted. Scarboroughclaimed that phonological awareness skills did not account for significantvariance in reading outcome, but that syntactic skills constituted a uniquepredictor of reading disability.
Despite Scarborough’s finding, the majority of more recent studies withchildren at-risk for dyslexia focussed on the areas of phonology, speechperception and verbal short memory. For example, Locke et al. (1997), Penningtonand Lefly (2001), Lefly and Pennington (1996) and Byrne, Fielding-Barnsley,Ashley, and Larsen (1997) found that the strongest predictors of dyslexia aredeficiencies in the areas of phonological processing and metaphonological ability.However, a few recent studies did investigate the syntactic proficiency of at-riskchildren. Gallagher et al. (2000) found (consistent with Scarborough) thatpreschool syntactic ability was a significant predictor of reading at 8 years.Lyytinen, Poikkeus, Laakso, Eklund, and Lyytinen (2001) reported that maximumsentence length at age two and object naming and inflectional morphology skillsat 3;6 years were less well developed in a group of at-risk children compared tonormal controls.
Summarising, many prospective studies indicate that at-risk children displaydeficiencies in speech perception, phonological processing, verbal short-termmemory and metaphonological abilities. The pattern with regard to productivephonology, the reception and production of morphology and of syntax is muchless clear. Our study overlaps in part with those reviewed above, but iscomplementary in part as well. In addition to some of the widelyapplied measures of speech perception skill, phonological processing andshort-term memory, we have included fine-grained assessments of primary
}SLI is defined as a delay in language acquisition in the absence of demonstrableperceptual or neurological deficits, low (non-verbal) intelligence, or sub-optimal socio-emotional conditions (Leonard, 1998).
P. van Alphen et al.266
Copyright # 2004 John Wiley & Sons, Ltd. DYSLEXIA 10: 265–288 (2004)

phonological, morphological, lexical and syntactic skills, both in production andreception.
The current study differs from previous prospective studies in that wecompared our at-risk children not only to ‘non-risk’ controls, but also to childrenwith SLI. The primary symptoms of SLI are most prominent in languageproduction. Typically, children with SLI display problems with the acquisition ofmorphology and sentence structure (Fletcher & Ingham, 1995). These gramma-tical problems are often accompanied by phonological shortcomings. Forty to50% of the children diagnosed with SLI experience difficulties in learning to read(Leonard, 1998). Conversely, the majority of children diagnosed with dyslexiaappear to have had difficulties in language development during the preschoolyears (Catts, 1993). Furthermore, the language (processing) symptomsobserved in children with dyslexia are by and large the same as those inchildren with SLI (Kamhi & Catts, 1986). Both groups have been found to showdeficits in speech perception, phonological awareness, repeating words andsentences, grammaticality judgment and rapid naming. The phenotypicalsimilarity between dyslexia and SLI is demonstrated by MacArthur et al.(2000), in which a blind re-evaluation procedure revealed that about 50% of bothdyslexic children and children with SLI fulfilled the criteria of the alternativediagnostic category.
One way to account for both the strong correlation between languageacquisition difficulties and dyslexia, as well as the overlap in symptoms, is tosay that dyslexia stems from a language disorder. Catts and Kamhi (1999) presentthis point of view, and argue that dyslexia is the outcome of a deficit inphonological processing (see Snowling, 2001), i.e. the perception, encoding,retrieval and use of phonological forms. However, as Scarborough’s results (1990)suggest, other aspects of linguistic competence, notably syntax, may also becompromised in dyslexic children. Our aim is therefore not only to investigatephonological abilities, but various linguistic skills in both at-risk and SLIchildren.
The children we study are between 18 and 60 months of age. The at-riskchildren, born from ‘dyslexic families’, have been estimated to have a 40–60%chance of becoming dyslexic, as compared to approximately 4% in the populationat large (Grigorenko, 2001). Since the children have not been exposed to formaleducation in reading and spelling at the time of testing, it is not possible todetermine who among them are dyslexic. Nevertheless, we anticipate that aconsiderable number of children in the at-risk group will display difficulties onthe language tasks. Therefore, we expect that the at-risk group as a whole willdisplay a level of performance in between that of the normally developingchildren and of the SLI children.
Each of the experiments presented here focus on either morphology/syntax oron phonetics/phonology. The morphology/syntax component includes a studyof the perceptual sensitivity to grammatical patterns, and an analysis of elicitedproduction of nominal and verbal inflections. The phonetics/phonologycomponent comprises experiments on categorical perception, phonologicalprocessing, mispronunciation detection (word recognition) and rhyme detection.The tasks were presented to the children at different ages, as indicated in Table 1.Each task can be considered constitute a separate experiment, and is presented assuch below. However, each experiment involved participants from the same pool
Language Development in At-risk Children 267
Copyright # 2004 John Wiley & Sons, Ltd. DYSLEXIA 10: 265–288 (2004)

(consisting of two cohorts, see below). Therefore, we first give a description ofour participants, followed by a sketch outline the general procedures followed inour project.
PARTICIPANTS
Approximately 250 children took part in the project. These children can be dividedin two age cohorts, labelled ‘infants’ and ‘toddlers’, referring to the age at whichthe participants joined the project. The infant cohort consists of about 70 at-riskchildren and 40 controls. These children were between the ages of 18 to 22 monthswhen they entered the programme. The toddler cohort comprises about 70 at-riskchildren, 40 controls and 30 children with SLI, each of them between age 3;0 (years;months) and 3;6 at entrance. SLI children were not included in the infant cohort,because SLI cannot be diagnosed reliably at that age (e.g. Paul, 2000).
The at-risk children were recruited through an advertisement campaign. Forchildren to be included in the at-risk group, at least one parent had to beclassified as dyslexic. Following the procedure described in Koster et al. (2004),the dyslexic parent was tested on a number of standardised measures: a singleword reading test (One-minute-test, Brus & Voeten, 1973), a pseudo-wordreading test (Van den Bos, Lutje Spelberg, Scheepstra, & de Vries, 1994), apseudo-word dictation, a non-word repetition task, as well as a rapid namingtask. The verbal comprehension test from the Wechsler Adult Intelligence Scalewas also administered. A parent was classified as dyslexic if either of the twoword reading test scores were in the bottom 10% range, or if both were in thelower 25% range. A strong discrepancy between the score on the pseudo-wordreading test and the verbal comprehension test (560%) also resulted in a dyslexicclassification. In view of the reported overlap between dyslexia and languageimpairment, we enquired about speech-language problems in the families of theat-risk children. Generally, the parents did not report having had any clinicallysignificant problems in this area. Unfortunately, no Dutch language test thatallows testing of language-impaired adults exists. Assessing whether the dyslexicparents in our sample might have been language-impaired as children thereforeremains difficult.}
Table 1. An overview of the experiments
Age Experiment
19 months 1A: sensitivity to grammatical patterns: preferential listening25 months 1B: sensitivity to grammatical patterns: preferential listening3;3–3;7 2: production of grammatical morphology3;11–4;4 3: categorical perception of speech sounds4;5–4;8 4: phonological processing (non-word repetition)5;1–5;4 5: mispronunciation detection5;1–5;4 6: rhyme detection
}Some researchers (e.g. Catts et al., 2001) have used the non-word repetition task todistinguish between adults with and without a language impairment, but this test is alsoadministered to distinguish between adults with and without dyslexia.
P. van Alphen et al.268
Copyright # 2004 John Wiley & Sons, Ltd. DYSLEXIA 10: 265–288 (2004)

The control children, age-matched with the at-risk children, were recruited viaday-care centres. We ascertained that no history of dyslexia and speech-languagedifficulties occurred in the families of these children.
Children in the SLI-group were recruited from schools providing full-timespecialised teaching to children suffering from language and speech problems.These children had been classified as language-impaired after extensiveassessment by a speech/language pathologist or a clinical linguist, whichcomprised assessment of their speech and language skills, nonverbal cognitiveabilities, and hearing. Exclusion criteria that are commonly adopted whenchildren with SLI are selected for research were used here as well: no primaryperceptual disorder or known neurological deficit should be attested, andintelligence should be within normal range. These criteria also answer theadmission criteria for the schools for language-impaired children. For ourpurpose, two exclusion criteria were added: signs of autism-spectrum disordersand signs of verbal dyspraxia.
Table 2 presents an overview of some of the relevant individual anddemographical characteristics of the participant groups. We looked at IQ (asmeasured by a Dutch standardised test (SON-R, Snijders, Tellegen, & Laros,1988), birth rank order and educational level of the mother. It should be kept inmind that these data are not complete as yet (cf. ‘number tested’ in Table 2).Nonetheless, we believe that the table provides a reliable characterisation of oursamples.
The educational level of the mother was classified in accordance with numberof years in secondary school (and school type, but these are correlated). Level 1represents 4 years of secondary school, Level 2, 5 years, Level 3, 6 years(comprising either advanced vocational training or preparatory training foruniversity), Level 4, 8 years and more, comprising tertiary education at BA up toMA level. It is clear from Table 1 that all mothers belong to the higher categories.There is no significant difference in education level between the three groups of
Table 2. Overview of some demographical and individual characteristics of theparticipants. Mother’s education level: 1 ¼ 4 years of secondary education; 2 ¼ 5 years;3 ¼ 6 years; 4 ¼ tertiary education up to BA/MA
Mother’s education IQ (SON-R) Birth order
Mean Mean Mean(s.d.) N tested (s.d.) N tested (s.d.) N tested
Baby cohortControl 3.6 35 110.7 31 1.5 36
(0.55) (17.3) (0.70)At-risk 3.2 66 108.5 63 1.7 60
(0.91) (15.0) (0.83)Toddler cohortControl 3.7 18 115.2 30 1.2 12
(0.77) (15.6) (0.67)At-risk 3.1 53 111.3 61 1.3 41
(1.2) (14.4) (0.59)SLI 3.3 9 101.9 22 2.4 9
(1.3) (10.1) (1.1)
Language Development in At-risk Children 269
Copyright # 2004 John Wiley & Sons, Ltd. DYSLEXIA 10: 265–288 (2004)

mothers in the toddler cohort. In the infant cohort, the control children’s mother’seducational careers have been slightly but significantly longer than those of theat-risk children’s mothers (F(1, 99Þ ¼ 4:92, p ¼ 0:029, one-way ANOVA).
Table 2 further indicates that the children in all groups fall within the normalIQ range. No statistically reliable difference was found between average IQs ofthe control and at-risk infants. In the toddler cohort, the three groups’ averagescores differ significantly in a one-way ANOVA (F(2, 110Þ ¼ 5:93, p ¼ 0:004). Posthoc tests indicate that the SLI group differs from both the controls and the at-riskchildren.
Regarding birth rank, the one interesting observation is that the average for SLIchildren is considerably higher than that of the other two toddler groups,resulting in a significant effect (F(2, 59Þ ¼ 12:53, p ¼ 0:004, one-way ANOVA).This is consistent with previous results showing that laterborn children havehigher rates of language problems (Bishop, 1997; Tomblin, 1989).
GENERAL PROCEDURE
All children were invited to take part in four test sessions, separated by 6-monthintervals. Consequently, the children in the infant cohort, who were first seen at1;6, were 3;0 or slightly older at the time of the final session. This is roughly thesame age as the children from the toddler cohort at their first time of testing. Thetoddlers were approximately 5;0 in the last test session.
The sessions took place either in the language acquisition lab at the Utrechtinstitute of Linguistics OTS (for most at-risk children and controls), or inchildren’s schools or homes (for most SLI children). Each test session consisted ofa number of age-appropriate and tailor-made tasks, allowing us to addressspecific questions, probing both perceptive and productive language skills.Procedural details will be given below. In addition, all children wereadministered a standardised IQ test (see above), as well as an adaptation ofthe digit span test from the WISC.
In this paper, we report on a subset of experiments within the programme (seeTable 1). All children in one age-cohort participated in all experiments assignedto their cohort. This means that the participant groups of the various experimentsoverlap. Note, however, that the results presented here may refer to subsets ofparticipants, due to subject drop-out (as reported where appropriate below), orbecause the analyses of the results have not been completed as yet.
EXPERIMENT 1: SENSITIVITY TO GRAMMATICAL PATTERNS
In dyslexia, (meta)phonological deficits have long been recognized as critical.Much less is known about the syntactic abilities of children with dyslexia. Oneprerequisite for the acquisition of grammar is the capacity to recognisegrammatical patterns in the ambient language. These grammatical patterns arealso referred to as ‘grammatical dependencies’, since the presence of onemorpheme in the pattern is dependent on the presence of another. Previousstudies (H .oohle & Weissenborn, 2003; Santelmann & Jusczyk, 1998) have shownthat normally developing children aged 18 months are sensitive to the occurrence
P. van Alphen et al.270
Copyright # 2004 John Wiley & Sons, Ltd. DYSLEXIA 10: 265–288 (2004)

of grammatical dependencies in their mother tongue. We assessed the at-riskinfants’ ability to recognise one specific grammatical dependency in Dutch byusing the preferential listening task. The preferential listening task measures thetime children listen to passages of continuous speech. The passages are usuallydivided into two types, in this case into grammatical and ungrammaticalpassages. A listening preference to either of the types of passages indicates thatchildren discriminate between the different passages. Although it is theoreticallynot possible to predict the direction of children’s preferences, previous studiesgenerally found a familiarity effect (i.e. a preference for familiar/grammaticalmaterials (e.g. Santelmann & Jusczyk, 1998). The present experiment focused onthe dependency between the temporal auxiliary heeft (‘has’) and the pastparticiple. We tested whether children were able to discriminate this from adistorted dependency, in which heeft is replaced by the modal auxiliary kan ‘can’.If children are sensitive to this particular dependency, we expect them to preferthe passages in which the dependency is maintained. The absence of a clearpreference, however, would imply a reduced sensitivity to the dependencybetween heeft and the past participle.
Participants
Two preferential listening experiments have been conducted, involving the sameprocedure and materials. In the first experiment (1A), 79 at-risk children tookpart, as well as 39 control children. The data of 22 at-risk and nine controlchildren had to be excluded for various reasons. The average age of both the at-risk and control infants was 19.7 months. In the second experiment (1B), weanalysed the results of 54 at-risk children, who had already participated inexperiment 1. The data of an additional 13 children were excluded for variousreasons. The children had an average age of 25.6 months.
Materials and Procedure
The stimuli consisted of 16 spoken passages. Eight of these contained fullygrammatical sentences each containing a grammatical combination of thetemporal auxiliary heeft ‘has’ and a past participle, as in example 1. The pastparticiple is marked by the prefix ge- [x=]. The other eight consisted of sentenceswith an ungrammatical combination of the modal auxiliary kan ‘can’ and a pastparticiple (example 2). The auxiliary and past participle were always separatedby a two-syllable adverb. The ungrammatical passages exactly matched thegrammatical passages except for the auxiliaries. All comprised eight sentences,and were 77 or 78 syllables long. Through editing, the duration of the passageswas set to a constant 20.9 s.
(1) De boer heeft gewerkt. (The farmer has worked).(2) *De boer kan gewerkt. (The farmer can worked).
The experiments were conducted in a soundproof booth, in which the stimuliwere presented randomly through either of two speakers, situated to thechildren’s right and left hand sides. At the beginning of each trial, the child’sattention was drawn to the centre by flashing a green light. When the child
Language Development in At-risk Children 271
Copyright # 2004 John Wiley & Sons, Ltd. DYSLEXIA 10: 265–288 (2004)
looked at this centre light, it stopped flashing while a red light on one of the sidepanels started flashing, indicating the availability of an auditory stimulus on thatside. Once the participant made a head turn of at least 308 to that side, the speechstimulus began to play. The speech stimulus and flashing light continued untilthe child turned away for a continuous period of 2 seconds or until the entirestimulus had been played. Listening time was calculated by adding up the totaltime the child was orientated to the speech sample. Each run of the experimentcomprised four training trials and 12 test trials.
Results and Discussion
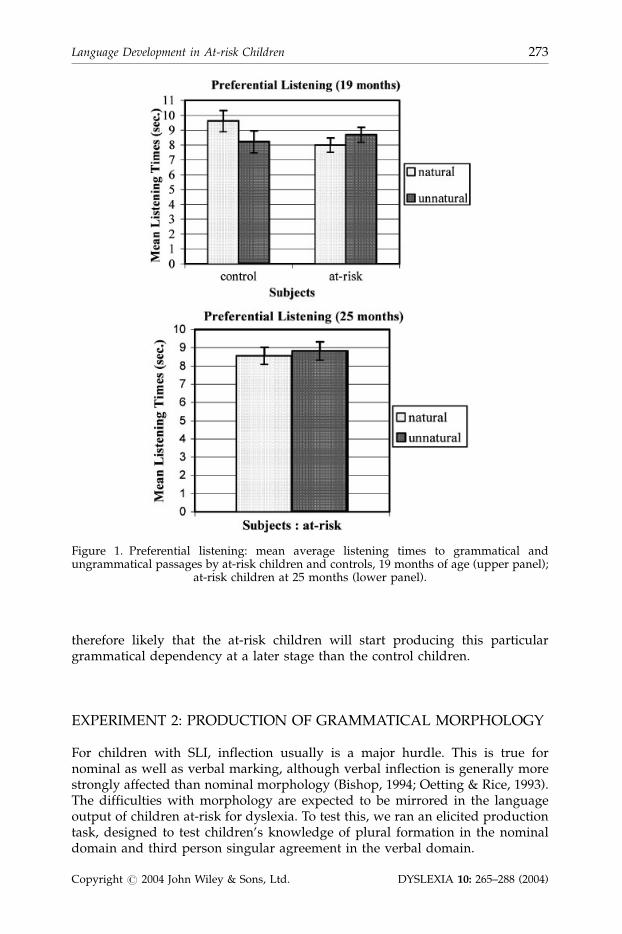
Mean listening times across all subjects in the control group were calculated forboth the grammatical and the ungrammatical passages. In experiment 1A, (seeFigure 1, upper panel) the mean listening time to the grammatical passages was9.61 seconds (SE ¼ 0:70) whereas the mean listening time to the ungrammaticalpassages was 8.21 seconds (SE ¼ 0:73). The difference is significant in a pairedsamples t-test [t ð29Þ ¼ 2:21, p ¼ 0:035]. 67% of the infants in the control group(i.e. 20 of the 30 subjects) preferred (i.e. listened longer to) the grammaticalpassages. The mean listening times across all children in the at-risk group were8.0 seconds (SE ¼ 0:46) for the grammatical passages and 8.69 seconds (SE ¼ 0:49)for the ungrammatical passages. A paired t-test indicated that the difference isnot significant: t ð56Þ ¼ �1:8, p ¼ 0:077. Only 46% of the at-risk infants (i.e. 26 ofthe 57 subjects) listened longer to the grammatical passages.
In experiment 1B (Figure 1, lower panel), the at-risk children listened to thegrammatical passages for 8.56 seconds on average (SE ¼ 0:46), while their meanlistening time to the ungrammatical passages was 8.83 seconds (SE ¼ 0:49). Apaired samples t-test indicated that the 0.27-s difference is not significant [tð52Þ ¼ �0:423, P ¼ 0:47]. Further inspection of the data revealed that 46%of the subjects listened longer to the grammatical passages and 54% listenedlonger to the ungrammatical passages. This result is identical to the result inexperiment 1A.
Taken together, the results of experiment 1A and 1B imply that the controlinfants are sensitive to the co-occurrence of the temporal auxiliary and the pastparticiple. The control children are able to discriminate between grammatical andungrammatical dependencies at the age of 19 months. The at-risk childrenshowed no significant preference for either the grammatical or the ungramma-tical passages, neither in experiment 1A nor experiment 1B, indicating that theywere unable to discriminate between the grammatical and the ungrammaticalpassages. This implies that the at-risk infants failed to recognise the grammaticaldependency between the auxiliary heeft and the past participle at the age of 19months. Furthermore at the age of 25 months, the at-risk children showed noevidence of catching up with the control children. This suggests that thedevelopment of the at-risk children’s perceptual language skills is delayed by (atleast) six months.
The inability of the at-risk children to track relationships between morphemesmight have a negative effect on the development of language production in thesechildren. It might be that the perceptual delay results in these children being lessequipped for structuring and decoding longer, more complex sentences. It is
P. van Alphen et al.272
Copyright # 2004 John Wiley & Sons, Ltd. DYSLEXIA 10: 265–288 (2004)
therefore likely that the at-risk children will start producing this particulargrammatical dependency at a later stage than the control children.
EXPERIMENT 2: PRODUCTION OF GRAMMATICAL MORPHOLOGY
For children with SLI, inflection usually is a major hurdle. This is true fornominal as well as verbal marking, although verbal inflection is generally morestrongly affected than nominal morphology (Bishop, 1994; Oetting & Rice, 1993).The difficulties with morphology are expected to be mirrored in the languageoutput of children at-risk for dyslexia. To test this, we ran an elicited productiontask, designed to test children’s knowledge of plural formation in the nominaldomain and third person singular agreement in the verbal domain.
Figure 1. Preferential listening: mean average listening times to grammatical andungrammatical passages by at-risk children and controls, 19 months of age (upper panel);
at-risk children at 25 months (lower panel).
Language Development in At-risk Children 273
Copyright # 2004 John Wiley & Sons, Ltd. DYSLEXIA 10: 265–288 (2004)

Participants
The verb inflection task was completed by 35 at-risk children (average 3;3), ninechildren with SLI (3;7) and 27 controls (3;3), all from the toddler cohort. Thenoun-plural task was completed by 37 at-risk children, 10 children with SLI and27 controls, their average ages being the same as for the sample in the verbinflection task. The number of children participating was different across thetasks, due to the fact that not every child completed each task.
Materials and Procedure
The format of the elicitation task was that of a standard grammatical closure task(cf. ITPA-GC, Kirk, McCarthy, & Kirk, 1968). The child was shown two pictures.The first picture was described by the experimenter, while in the description ofthe second picture the final constituent was omitted, inviting the child tocomplete the sentence. In the pluralisation conditions, the first picture containeda single exemplar of a referent to be named (e.g. a ball); the second picturecontained multiple referents. In this case, the experimenter would enounce Dit iseen bal en dit zijn twee. . .? (This is a ball and these are two . . .?). The numeral twee(‘two’) was stressed here. The noun plural task comprised 10 such itemspresented in a fixed order.
In the verb agreement task, pictures of an animate figure (a bear) performingdifferent actions were shown. The experimenter described the first action, using afull subject-predicate construction. The child was invited to complete thedescription of the action in the second picture, e.g. Deze beer loopt en deze beer. . .?(This bear walks and this bear. . .?). The introduction of the subject in the secondprompt, paired with the inflected verb in the first prompt, was expected toencourage the use of a finite lexical verb. This is important, given that in theinitial stages of verb use children often opt for bare infinitives (i.e. verbs withouta proper inflectional morpheme). It should be noted that, unlike English, Dutchhas an infinitive marker, -en. An infinitival verb in an independent sentence mustbe connected to an (inflected) auxiliary. Dutch children’s acquisition of thisconstraint is often reflected by an increase in the use of the semantically emptyauxiliary gaan (go) (Wijnen & Verrips, 1998). The task consisted of 10 itemspresented in a fixed order.
Results and Discussion
Table 3 shows the results of the pluralisation task. The at-risk children producefewer correct plurals than the controls, and the children with SLI in their turn
Table 3. Grammatical morphology. Average numbers of responses (standard deviations inparentheses) in the elicited production task, pluralisation conditions, for each of the threegroups of children
Response
Group Plural Singular None
Control 8.96 (1.22) 0.78 (0.97) 0.26 (0.52)At-risk 6.65 (2.85) 1.70 (1.79) 1.65 (1.99)SLI 5.80 (3.23) 2.60 (2.67) 1.60 (2.41)
P. van Alphen et al.274
Copyright # 2004 John Wiley & Sons, Ltd. DYSLEXIA 10: 265–288 (2004)

produce fewer than the at-risk children. The effect of participant group onaverage number of correct plurals is statistically reliable in a oneway ANOVA(F(2, 71Þ ¼ 9:39, p50.001). Post hoc Tukey HSD tests indicate significantdifferences (p ¼ 0:002 and less) between the control group and both the at-riskchildren and children with SLI. The difference in number of correctly producedplural forms between the latter two groups does not reach significance.
The results of the inflection task are presented in Table 4. With regard to theaverage number of third person singular (3SG) forms, the effect of group is notreliable in a one-way ANOVA (F(2, 68Þ ¼ 2:29, p ¼ 0:109). However, when wetake all}grammatical}finite forms into account, i.e. 3SG as well as combina-tions of a finite auxiliary (most often gaan) and an infinitive main verb, the effectof group is significant (F(2, 68Þ ¼ 8:77, p50.001). Furthermore, as to the incorrectresponses (ungrammatical forms), it appears that the response profiles of thethree groups are different. At-risks seem to produce more stem forms, whereaschildren with SLI seem to prefer bare infinitives. This is confirmed by the resultsof a multivariate ANOVA, with the numbers of stems, infinitives and non-verbresponses as dependent variables. We see an overall significant effect of group onthe incorrect response pattern (F(6, 134Þ ¼ 3:18, p ¼ 0:006). Tests for the separatedependent variables show an effect on stem forms (F(2, 68Þ ¼ 4:15, p ¼ 0:02), andinfinitives (F(2, 68Þ ¼ 4:72, p ¼ 0:012). Tukey HSD post hoc tests yield a significantdifference between the control group and the at-risk group with regard tonumber of stem forms (p ¼ 0:018), as well as a significant difference between thecontrol group and the SLI group with regard to the number of infinitives(p ¼ 0:009).
In summary, these results clearly indicate that the at-risk and SLI groupsproduce fewer correct forms (and more often fail to respond) both in the verbalinflection conditions and in the nominal plural conditions. The performance ofthe at-risk children is positioned in-between that of the controls and the SLIchildren. Taken together, the results of this experiment confirm that children witha genetic risk for dyslexia present a language profile in the domain ofgrammatical morphology similar to that of children with SLI.
A comparison between the nominal and verbal domain cannot be donestraightforwardly. The children (including the controls) do not seem to havereached the stage where finiteness is obligatory and where the conditions forfrequent use of finite lexical verbs are satisfied. On the other hand, in the nominal
Table 4. Grammatical morphology. Average numbers of responses (standard deviations inparentheses) collected in the elicited production task, verbal inflection conditions, for eachof the three groups of children
Response type
Group 3rd sing. Stem Infinitive auxþ inf. No verb
Control 4.00 0.30 1.63 2.70 1.37(3.43) (0.82) (2.07) (2.98) (1.49)
At-risk 3.06 1.00 2.51 1.33 1.60(3.09) (1.13) (2.29) (2.59) (1.26)
SLI 1.44 0.66 4.33 1.33 2.44(2.46) (0.72) (2.95) (2.69) (2.13)
Language Development in At-risk Children 275
Copyright # 2004 John Wiley & Sons, Ltd. DYSLEXIA 10: 265–288 (2004)

domain, the use of plural forms is near Brown’s (1973) acquisition criterion (90%use in obligatory context) among the controls. Consequently, the finding inprevious SLI research that production of correct noun morphology exceeds thatof verb morphology cannot be properly tested.
EXPERIMENT 3: CATEGORICAL PERCEPTION OF SPEECH SOUNDS
There are indications that categorisation of speech sounds in phonemic classes isless consistent in children with (manifest) dyslexia as compared to controlchildren. Dyslexic children’s phoneme categorisation is characterised by lesssharply defined phoneme boundaries and less steep categorisation functions, asdetermined with standard categorical perception tasks (Maassen, Groenen, &Crul, 2001). Such findings imply a speech processing problem in dyslexics. Itremains unclear, however, whether this problem is an antecedent or aconsequence of the reading difficulty. It has been shown that young childrenat-risk for familial dyslexia have oral language problems, but data about theirearly speech perception skills are scarce. An exception is a study by (Richardson,Lepp.aanen, Leiwo, & Lyytinen, 2003), who found that Finnish at-risk infants needa larger difference in occlusion time than control children in order to be able todiscriminate ‘atta’ from the minimally different ‘ata’. We ran a categoricalperception experiment, in which children at age 3;6 were exposed to continuaspanning the consonantal contrast (/p/-/k/) as well as vocalic (length & timbre)contrast />/-/a:/.
Participants
31 at-risk children (average age 3;11), 10 children with SLI (4;4), and 26 controls(3;11) took part. Of the 67 children tested, 25 (37%) failed to complete the task (16at-risk, 2 SLI, 7 control). The number of children completing one of the twoexperiments was higher. However, we only present the results of those childrenthat completed both the /k/-/p/ and the />/-/a:/ test.
Materials and Procedure
Two stimulus series with seven stimuli each were presented to the children. Thestimuli constituted a six-step continuum between the /p/ and /k/ in the words/pLp/ and /kLp/ (‘doll’ and ‘cup’) and a six-step continuum between the vowels/a:/ and />/ in the words /za:k/ and /z>k/ (‘shop’ and ‘bag’). The continuawere generated by interpolation between the relative amplitudes of the spectralenvelopes of the original words, as spoken by an adult male native speaker ofDutch. In the vowel continuum, vowel duration was also manipulated bydecreasing it in equal steps of 15ms.
The participants heard each token 6 times, and had to respond each time bypointing at one of two pictures matching the words that represented theendpoints of the continua. The stimuli were presented via headphones connectedto a computer. We expected that meaningful stimuli and simple picture selectionwould engage children more than the traditionally used nonsense syllablespresented as names of e.g. similar toy animals.
P. van Alphen et al.276
Copyright # 2004 John Wiley & Sons, Ltd. DYSLEXIA 10: 265–288 (2004)

Results and Discussion
Figure 2 shows the percentage /kLp/ responses of the three subject groups foreach of the 7 points on the continuum. The slope of the categorisation functions ofthe at-risk and the SLI groups are less steep than the function gradient of thecontrol group. The slope is the reciprocal of the standard deviation and indicatesthe range of uncertainty distinguishing one phoneme category from another. Asteep slope indicates a small uncertainty range and suggests a highly consistentability to categorise a speech contrast, whereas a shallow slope indicates a largerange of uncertainty, suggesting difficulties in identifying the speech stimuli. Thedata also show that the at-risk and SLI children had more difficulty withcategorising the (unambiguous) endpoint stimuli, which implies that theirphoneme identification was also impaired.
Analysis of variance (repeated measures) was employed to model percent/kLp/ responses as the dependent variable for the seven points on thecontinuum. All possible interactions between group, stimulus level, and agewere considered as potential terms. It appears group, stimulus level, as well asinteraction between group and stimulus level contributed significantly (p50.01)to the model fitting the phoneme categorisation scores. The slope of thecategorisation function differed significantly between the control group and boththe at-risk and the SLI group. The SLI group was older than the two other groups.However, after controlling for age, the SLI group still performed relatively poorly.The slopes for the three groups, after controlling for age (significant at p ¼ 0:042)were as follows:
* Control: 17.459* At-risk: 11.091* SLI: 11.607
Stop-consonant categorisation
0
20
40
60
80
100
1 2 3 4 5 6 7stimulus
per
cen
t 'k
op
' res
po
nse
s
riskSLIcontrol
Figure 2. Categorical perception: the mean percentages of /kLp/ responses in the threegroups, for each of the 7 points on the /pLp/-/kLp/ continuum.
Language Development in At-risk Children 277
Copyright # 2004 John Wiley & Sons, Ltd. DYSLEXIA 10: 265–288 (2004)

The results of the /za:k/-/z>k/ test are presented in Figure 3. The functionsindicate that the three groups do not differ in their categorization responses, aswas the case with the stop-consonant contrast. A repeated measurement analysiswas conducted with percent /za:k/ responses as the dependent variable for eachof the seven levels of stimulus. The most economic model adequately predictingthe phoneme categorization data only contained the parameter Stimulus.
The conclusion we draw from these results is that children at-risk for dyslexiaas a group clearly have less consistent perception of stop consonants (not vowels)than age-matched controls. Their performance resembles the profile observed inchildren with SLI. This outcome is consistent with Richardson et al.’s (2003) result,and parallels the performance of older, manifest dyslexics. Given the fact that theparticipants in our study have not been exposed to any formal instruction onorthography, it seems safe to conclude that the speech perception problemobserved in older dyslexics cannot be the result of the reading deficiency. Rather,it is likely that a deficient or delayed speech perception/processing skill is aprecursor of dyslexia. Such a finding is compatible with various models assuminga causal role for speech perception in the development of dyslexia.
EXPERIMENT 4: PHONOLOGICAL PROCESSING
Phonological processing, which comprises the perception, storage and reproduc-tion of phonological forms, is often operationalised by means of the non-wordrepetition task (NRT). NRT performance has been reported to be deficient inlanguage-impaired individuals, as well as in dyslexics and children at-risk fordyslexia (Carroll & Snowling, 2004; Ellis-Weismer et al., 2000; Gallagher et al.,2000; Goulandris, Snowling, & Walker, 2000). Generally, it has been found tocorrelate with reading skills. If we assume that a deficit in phonologicalprocessing predates the emergence of manifest dyslexia, we predict that NRTperformance in at-risk children}on average}will be worse than in controls.
Vowel categorisation
0
20
40
60
80
100
1 2 3 4 5 6 7
stimulus
per
cen
t 'z
ak' r
esp
on
ses
risk
SLI
control
Figure 3. Categorical perception: the mean percentages of /za:k/ responses in the threegroups, for each of the 7 points on the /z>k/-/za:k/ continuum.
P. van Alphen et al.278
Copyright # 2004 John Wiley & Sons, Ltd. DYSLEXIA 10: 265–288 (2004)

Participants
In the present experiment, 65 at-risk children, 22 children with SLI, and 31controls (all from the toddler cohort) took part. Seven at-risk children failed tocomplete this task. The average age of the at-risk children was 4;5, the SLIchildren were 4;8, and the control children 4;6.
Materials and Procedure
A non-word repetition test (NRT) was constructed after Dollaghan and Campbell(1998). This NRT minimises the effect of language knowledge and avoidsassessing productive phonological abilities rather than phonological processingskills. The test items consisted of two, three, four, and five syllable non-words.
The non-word items were introduced to the children as names of strangecreatures, which were depicted in colourful drawings. The non-words werepresented one at a time through a CD player and loudspeakers. Every word wasintroduced by a beep to ensure children’s attention. Order of presentation wasrandom with the restriction that the syllable length of two successive non-wordswas always different. All subjects heard the non-words once. The children’srepetitions were recorded on a DAT tape, and were phonetically transcribedafterward.
Results and Discussion
The performance on the NRT can be expressed in various measures, whichusually correlate rather strongly. Here, we only present the percentages ofphonemes correctly reproduced (PPC, for a more detailed report, see De Bree,Wilsenach, Gerrits, & Wijnen, 2003). The averages per group are presented inFigure 4. Visual inspection of these data suggests a clear trend, such that thecontrols perform best, the SLI children worst, while the at-risk children hold anintermediate position. A repeated measures analysis with Group as between-
Figure 4. Non-word repetition: average percentages of phonemes repeated correctly byeach of the three groups, and broken down over different word lengths (2, 3, 4 and 5
syllables).
Language Development in At-risk Children 279
Copyright # 2004 John Wiley & Sons, Ltd. DYSLEXIA 10: 265–288 (2004)

subjects and Phoneme Percentage Correct as within-subjects factor show aninteraction between group and PPC (F) (6, 321) 11.00, p50.001). Results arealso significant for each main efect, with PPC (F (3, 321) 82.68, p50.001) andgroup (F (1, 107) 63.30, p50.001). Post-hoc Tukey HSD analyses showed that all ofthe pair-wise differences among the conditions were significant at the 0.05 level.This result implies that the at-risk children have difficulty with phonologicalprocessing (as expected), i.e. difficulties with phonological segmentation andencoding. These skills are necessary for language-learning and reading acquisi-tion. In this respect they resemble the language-impaired children.
EXPERIMENT 5: MISPRONUNCIATION DETECTION
A deficit in phonological processing may result in less detailed or incorrectphonological representations of words in the mental lexicon (e.g. Brady, 1997). Ifthis is the case, a phonological deficit in children with dyslexia and SLI wouldaffect the recognition of words in these children. In particular, if the phonologicalrepresentations of words are not sufficiently specified, a phonological mismatchwould be less harmful for the recognition of these words. As a result, childrenwith a phonological deficit would have more difficulty in detecting phonologicalmispronunciations than children without a phonological deficit. Indeed, Carrolland Snowling (2004) found that in a group of 3–6 year-old children with a risk fordyslexia and speech-delayed children had more difficulty on a mispronunciationdetection task than normally developing children. Therefore, we predicted thatthe at-risk group and the SLI group would be less good in detectingmispronunciations at the beginning of words (resulting in non-existing words)than the control group.
Participants
In the present experiment, 48 at-risk children (average age 5;1), 18 children withSLI (5;4), and 29 controls (5;1) took part.
Materials and Procedure
There were two mispronunciation conditions in which the initial phoneme of thetarget word was mispronounced: a maximal mismatch condition and a minimalmismatch condition. Items in the maximal mismatch condition differed from thetarget words in place of articulation, manner and voicing of the initial phoneme(plosive of fricative), so for example pebrawas substitute for zebra, or saby for baby.In the minimal mismatch condition experimental items differed from the targetwords only in place of articulation of the initial phoneme (plosive of fricative), sothat zebra would be replaced by vebra, or baby by daby. There were 12 target words(6 with an plosive and 6 with a fricative). All words were bisyllabic with a strong-weak stress pattern. Each word appeared in the two mispronunciationconditions, as well as in the correct form, resulting in 36 items. In addition,there were 12 filler words, which were pronounced correctly. Thus, in all we had48 items, half of which were produced correctly and half incorrectly. The itemswere presented in random order.
P. van Alphen et al.280
Copyright # 2004 John Wiley & Sons, Ltd. DYSLEXIA 10: 265–288 (2004)

Children were told that they were going to teach the computer to speak. First,the computer had to learn the words. Therefore, the child had to name picturesthat appeared on the screen. In this way the child was familiarised with thepictures and it was ascertained that the child knew the names of the objectspresented. Subsequently, the children saw the same pictures again, but this timethe computer ‘named’ the pictures. The participants’ task was to push a big redbutton when a word was pronounced incorrectly. Before the real test sessionstarted, there was a training session consisting of two correctly and twoincorrectly pronounced words.
Results and Discussion
Figure 5 shows the mean percentage correct made by each of the subject groups,plotted separately for the two mispronunciation conditions. The control childrendetected more phonological mismatches correctly than the at-risk children, andthe percentage of correct detections was lower still in the SLI group (98.8, 94.6and 84.5%, respectively). This was confirmed by a repeated measures ANOVAwith mispronunciation condition as a within-subject factor and subject group as abetween-subject factor. There was a main effect of group (Fð2, 92Þ ¼ 11:67,p50.0001, and a post hoc Tukey HSD test showed that all pair-wise differencesamong the three groups were significant at the 0.05 level. Furthermore, theANOVA showed a significant effect of mispronunciation condition(F(1, 92Þ ¼ 22:54, p50.0001). More correct detections were made in the maximalmismatch condition (95.0%) than in the minimal mismatch condition (90.0%).Furthermore, there was a significant interaction between mispronunciationcondition and group (F(2, 92Þ ¼ 5:32, p50.01). A Tukey HSD test indicated thatthis interaction was due to the fact that in the maximal mismatch condition onlythe SLI group differed significantly from the at-risk and control groups, while inthe minimal mismatch condition all pair-wise differences among the three groupswere significant.
These findings indicate that the children at-risk for dyslexia and the childrenwith SLI have more difficulty detecting small phonological mismatches than
50
60
70
80
90
100
maximal mismatch(pebra)
minimal mismatch(vebra)
% c
orre
ct d
etec
tions
control
at-risk
SLI
Figure 5. Percentage of correct detections (misses) in the mispronunciation detection task(vertical bars present two standard errors).
Language Development in At-risk Children 281
Copyright # 2004 John Wiley & Sons, Ltd. DYSLEXIA 10: 265–288 (2004)

control children. This may be the result of insufficiently specified phonologicalrepresentations of words in the former two groups. However, it is also possiblethat these results reflect a problem at a lower level of processing. Although it isdifficult to determine the locus of the effect, it seems that the poorer performanceof both the children at-risk for dyslexia and the children with SLI is a result of aphonological deficit.
EXPERIMENT 6: RHYME DETECTION
Much work has stressed the role of phonological awareness in the aetiology ofdyslexia. This is backed up by data showing that children who have a difficultyin learning to read and spell in many cases also fail on tasks requiring explicitphonological analysis (Adams, 1991; Goswami & Bryant, 1990; Perfetti, Beck,Bell, & Hughes, 1987). Recognising rhyme is one such metaphonological ability,as it entails the capacity to segment syllables into constituents (onset, rime) andcompare these. The ability to rhyme has been estimated to develop around agefour (Menn & Stoel-Gammon, 1995) and is claimed to be a predictor of readingcomprehension skills (Bird, Bishop, & Freeman, 1995; Brady, 1997). Our odd-oneout task aimed to establish whether at-risk children and controls differ in rhymedetection ability, and, if so, whether at-risk children’s performance resembles thatof children with SLI.
Participants
In this experiment 56 at-risk children, 22 children with SLI, and 24 controlchildren (from the toddler cohort) took part. One child in the control group, 5 at-risk children and 2 children with SLI were unable to complete the task,apparently as a result of a lack of rhyming abilities and/or discrimination skills.The average age of the at-risk and control group was 5;1, that of the SLI group 5;4.
Materials and Procedure
Ten series of four monosyllabic existing words of Dutch were formed, such thatone of the four differed from the other three with the entire rime (e.g. zwaard[zwa:rt] - paard [pa:rt] - taart [ta:rt]}bloem [blum]). The words were controlledfor acquisition age. The four-word series were pronounced by the experimenter,more than once if necessary, and matching pictures were presented to help thechildren remember the series. Participants were instructed to select the word(picture) that did not rhyme with the others. The ten test trials were preceded by2 practice trials.
Results and Discussion
Correct and incorrect responses were scored during the experiment. The overallmean proportions of correct responses per group are displayed in Figure 6. Thebar graph indicates that the SLI children performed worst, the controls best, andthe at-risk children take a middle position.
P. van Alphen et al.282
Copyright # 2004 John Wiley & Sons, Ltd. DYSLEXIA 10: 265–288 (2004)

A one-way ANOVA shows that the differences between groups are statisticallysignificant (F(2, 83Þ ¼ 3:569, p ¼ 0:033). Tukey HSD post hoc tests established thatthe differences between the control and at-risk group, and between the controland SLI group were significant (p values 0.006 and 0.048, respectively). Thedifference between the at-risk and SLI group failed to reach significance. Theresults confirm our expectation that children at-risk for dyslexia have moredifficulties on a rhyme task than the control group. This implies that meta-phonological skills are less well developed in this population than can beexpected on the basis of age. The same is true for the SLI children.
GENERAL DISCUSSION
The goal of the longitudinal research project reported on here is to trace theprimary language development of children at-risk for dyslexia, and to determinewhether this deviates, quantitatively or qualitatively, from the typical patternobserved in children without a genetic risk. Children with specific languageimpairment were included in the comparison for two reasons. First, SLI can beviewed as a yardstick of deviant language development; it provides insight in thecomponents of linguistic skill that are particularly vulnerable, and in the waythey are affected by a developmental problem. Secondly, various hypothesessuggest an aetiological link between SLI and dyslexia, which would entail a closesimilarity of the language symptoms in individuals assigned to either of the twocategories. This similarity is under review here.
Our results indicate that children at-risk for dyslexia as a group display asystematic and consistent developmental language delay. The quantitativemeasures we obtained from the at-risk group are generally intermediate betweenthose of the control children and the children with SLI. With regard to grammar,we observed the following: (1) At the early age of 19 months, at-risk childrencannot discriminate between grammatical and ungrammatical sentences,whereas control children of the same age can. Six months later, the at-risk
GROUPSLIRiskControl
Mea
n C
OR
RE
CT
0.8
0.7
0.6
0.5
Figure 6. Rhyme detection: average proportion correct detection of the odd one out, in thethree groups of participants.
Language Development in At-risk Children 283
Copyright # 2004 John Wiley & Sons, Ltd. DYSLEXIA 10: 265–288 (2004)

children have not yet caught up with their peers. This finding suggests thatchildren at-risk for dyslexia have considerable problems in discovering thegrammatical structure of their native language, which may impact on and bereflected in language production. (2) In elicited language production, the at-riskchildren (around age 3;6) display a command of grammatical morphology typicalof younger normally developing children. Quantitatively (i.e. in the number oferrors) their performance approaches that of the SLI children. However,qualitatively, there are some subtle yet interesting difference between at-riskchildren and their age peers with SLI, which warrant further analyses.
In the domain of phonetics and phonology, we have seen that (3) thecategorical perception of stop consonants in at-risk children around age 4 issignificantly less clear-cut than in the control group, and in fact notdistinguishably better than in children with SLI. This is suggestive of a speechrecognition problem. (4) At age 4;6, at-risk children perform poorly on a non-word repetition task compared to the control group, but better than the SLIchildren, indicating that at-risk children’s phonological processing capacity isreduced. (5) At age 5, at-risk children make significantly more mistakes thancontrols in detecting phonemic mispronunciations, particularly when thesubstituting segment is phonologically close to the target. Children with SLImake even more errors. Apparently, at-risk as well as SLI children sustain deficitsin the analysis and/or representation of phonological word forms in differentdegrees. (6) The at-risk children display a marked delay in phonologicalawareness at age 5, as measured with a rhyme detection task. This is anindication that a capacity widely seen as a precondition for the smoothacquisition of orthographic skills is underdeveloped.
The differences between at-risk children and controls observed here replicatesome of the findings of earlier prospective studies. Notably, our data confirm theobservations by Locke et al. (1997) and Pennington and Lefly (2001) that childrenat-risk for dyslexia are deficient in processing and representing speech sounds, aswell as in the ability to deliberately judge and manipulate phonological form.Moreover, in line with the results of Lyytinen et al. (2001) and Scarborourgh(1990), we see a delay in the use of grammatical morphology. Our results suggestthat this is foreshadowed by a decreased sensitivity to grammatical patterns inthe input language at an early age. Importantly, the present results indicate thatthe language problems putatively anticipating dyslexia go beyond the well-attested literacy-related metaphonological skills.
A question that arises is whether the various deficits found in the at-riskchildren stem from a condition that impacts on speech processing, phonologyand grammar separately, or whether it is one component that carries the primarydysfunction, with a ‘cascading’ effect throughout the entire language system. Anexample of a general deficit impacting on each of the language modules directlymight be a reduced working memory capacity (Gathercole & Baddeley, 1989). Anexample of a ‘cascade model’ is one in which the primary problem is located inspeech perception (Mody, Studdert-Kennedy, & Brady, 1997; Studdert-Kennedy,2002), or phonological processing (Snowling, 2001). The consequence of thismight be that word form representations are insufficiently specified. In turn, thismay have detrimental consequences for the extraction and representation ofmorphological and grammatical regularities. The results presented here, showingdifferences between groups, are compatible with both types of hypotheses.
P. van Alphen et al.284
Copyright # 2004 John Wiley & Sons, Ltd. DYSLEXIA 10: 265–288 (2004)

Specific contrastive tests would require detailed analyses of individual children’slinguistic profiles, to determine, for example, whether deficits at various levelscan occur independently. The results of these analyses are pending.
The language profile presented by the at-risk children seems to put themapproximately halfway a continuum with control children at the high end andchildren with SLI at the low end. Our results corroborate findings reported earlier(Bishop & Adams, 1990; Catts, 1993) that children at-risk for dyslexia resemblechildren with a manifest developmental language delay. Could this mean that SLIand dyslexia are basically the same disorder, differing only in degree? It shouldbe emphasised here that the resemblance between the groups reported here islargely quantitative, not qualitative. The exception concerns the production ofgrammatical morphology, where a subtle difference between the at-risk and SLIgroup is found. Obtaining a better grasp of the (dis)continuity between SLI anddyslexia demands more qualitative analyses, as well as a detailed exploration ofthe patterns of correlations among the various quantitative data we obtained. Weare currently working on both types of analyses, attempting to pinpoint thelanguage acquisition differences between the two syndromes. We expect this willbe helpful in deciding between various models of pathogenesis.
Apart from performing qualitative and more fine-grained analyses, it is clearthat it is highly relevant to the continuity issue to determine which of our at-riskchildren actually become dyslexics. For a (strong version of) the continuityhypothesis to hold, we should find a biconditional relation between develop-mental language delays and reading problems. In other words, we should seethat the at-risk children with language problems will be the ones displayingdifficulties with reading acquisition. Short of such a relation, i.e. reading failuresin the absence of language problems, or vice versa, the similarity between at-riskchildren and children with SLI regarding language development would have tobe explained by recourse to more general mechanisms. This would perhaps bemore consistent with a clinical perspective. After all, dyslexia and SLI areconsidered to be clinically distinguishable. Nonetheless, particular phenomena inlanguage development may still turn out to be reliable and clinically relevantearly precursors of developmental dyslexia.
ACKNOWLEDGEMENTS
The research reported was made possible by a grant from the NetherlandsOrganisation for Scientific Research (NWO, No. 360-70-030), and substantialfinancial and technical support from the Utrecht institute of Linguistics OTS atUtrecht University. We would like to thank all the parents and children whoparticipated in the project. Furthermore, we thank two anonymous Dyslexiareviewers for their constructive commentary on a previous version of this paper.
References
Adams, M. J. (1991). Beginning to read. Cambridge, MA: The MIT Press.
Bird, J., Bishop, D., & Freeman, N. (1995). Phonological awareness and literacydevelopment in children with expressive phonological impairments. Journal of Speech andHearing Research, 38, 446–462.
Language Development in At-risk Children 285
Copyright # 2004 John Wiley & Sons, Ltd. DYSLEXIA 10: 265–288 (2004)

Bishop, D. V. M. (1994). Grammatical errors in specific language impairment: Competenceor performance limitations. Applied Psycholinguistics, 15, 507–550.
Bishop, D. V. M. (1997). Pre- and perinatal hazards and family background in children withspecific language impairments: A study of twins. Brain and Language, 56, 1–26.
Bishop, D. V. M., & Adams, C. (1990). A prospective study of the relationship betweenspecific language impairment, phonological disorders and reading retardation. Journal ofChild Psychology and Psychiatry, 21, 1027–1050.
Brady, S. (1997). Abilities to encode phonological representations: An underlying difficultyof poor readers. In B. Blachman (Ed.), Foundations of reading acquisition and dyslexia:Implications for early intervention. London etc: Lawrence Erlbaum.
Brown, R. (1973). A first language: The early stages. Cambridge, MA: Harvard UniversityPress.
Brus, B. T., & Voeten, M. J. M. (1973). Een-Minuut-Test [One Minute Test]. Nijmegen:Berkhout.
Byrne, B., Fielding-Barnsley, R., Ashley, L., & Larsen, K. P. (1997). Assessing the child’s andthe environment’s contribution to reading acquisition}what we know and what we don’tknow. In B. Blachman (Ed.), Foundations of reading acquisition and dyslexia: Implications forearly intervention (pp. 265–285). Mahwah, NJ: Lawrence Erlbaum.
Carroll, J. M., & Snowling, M. J. (2004). Language and phonological skills in children athigh risk of reading difficulties. Journal of Child Psychology and Psychiatry, 45(3), 631–640.
Catts, H. W. (1993). The relationship between speech-language impairments and readingdisabilities. Journal of Speech and Hearing Research, 36(5), 948–958.
Catts, H. W., Fey, M. E., Zhang, Y., & Tomblin, J. B. (2001). Estimating the risk of futurereading difficulties in kindergarten children: A research-based model and its clinicalimplementation. Language, Speech and Hearing Services in Schools, 32(1), 38–50.
Catts, H. W., & Kamhi, A. G. (Eds.). (1999). Language and reading disabilities. NeedhamHeights, MA: Allyn & Bacon.
De Bree, E., Wilsenach, C., Gerrits, E., & Wijnen, F. (2003). In search for precursors of dyslexia:Phonological processing and working memory in children at risk for dyslexia and children with SLI.Paper presented at the Child Phonology Conference, July 1–4, The University of BritishColumbia, Vancouver, BC, Canada.
Dollaghan, C., & Campbell, T. F. (1998). Nonword repetition and child languageimpairment. Journal of Speech, Language and Hearing Research, 41, 1136–1146.
Ellis-Weismer, E., Tomblin, J. B., Zhang, X., Buckwalter, P., Chynoweth, J. G., & Jones, A.(2000). Nonword repetition performance in school-age children with and withoutlanguage impairment. Journal of Speech, Language and Hearing Research, 43, 865–878.
Fletcher, P., & Ingham, R. (1995). Grammatical impairment. In P. Fletcher &B. MacWhinney (Eds.). The handbook of child language. Oxford: Blackwell.
Gallagher, A., Frith, U., & Snowling, M. J. (2000). Precursors of literacy delay amongchildren at genetic risk of dyslexia. Journal of Child Psychology and Psychiatry, 41(2), 203–213.
Gathercole, S., & Baddeley, A. D. (1989). Evaluation of the role of phonological STM in thedevelopment of vocabulary in children: A longitudinal study. Journal of Memory andLanguage, 28, 200–213.
Goswami, U., & Bryant, P. (1990). Phonological skills and learning to read. Hove: LawrenceErlbaum.
Goulandris, N. K., Snowling, M. J., & Walker, I. (2000). Is dyslexia a form of specificlanguage impairment? A comparison of dyslexic and language impaired children asadolescents. Annals of Dyslexia, 50, 103–120.
Grigorenko, E. L. (2001). Developmental dyslexia: An update on genes, brains andenvironments. Journal of Child Psychiatry and Psychology, 42, 91–125.
H .oohle, B., & Weissenborn, J. (2003). German-learning infants’ ability to detect unstressedclosed-class elements in continuous speech. Developmental Science, 6(2), 122–127.
P. van Alphen et al.286
Copyright # 2004 John Wiley & Sons, Ltd. DYSLEXIA 10: 265–288 (2004)

Kamhi, A. G., & Catts, H. W. (1986). Toward an understanding of developmental languageand reading disorders. Journal of Speech and Hearing Disorders, 5, 337–347.
Kirk, S., McCarthy, J., & Kirk, W. (1968). The Illinois test of psycholinguistic abilities. Urbana,IL: University of Illinois Press.
Koster, C., Been, P. H., Koster, F., Diepstra, H. D., van Leeuwen, T. H., & Krikhaar, E.(2004). Productive lexical acquisition in infants at risk for dyslexia and typicallydeveloping infants. Paper presented at the Sixth BDA International conference. Warwick,27–30 March 2004.
Lefly, D. L., & Pennington, B. F. (1996). Longitudinal study of children at high familyrisk for dyslexia: The first two years. In M. L. Rice (Ed.), Towards a genetics of language(pp. 49–75). Hillsdale, NJ: Lawrence Erlbaum.
Leonard, L. B. (1998). Children with specific language impairment. Cambridge, MA: MIT Press.
Locke, J. L., Hodgson, J., Macaruso, P., Roberts, J., Lambrecht-Smith, S., & Guttentag, C.(1997). The development of developmental dyslexia. In C. Hulme & M. J. Snowling (Eds.),Dyslexia: Biology, cognition and intervention (pp. 72–96). London: Whurr.
Lyytinen, P., Poikkeus, A. M., Laakso, M. L., Eklund, K., & Lyytinen, H. (2001). Languagedevelopment and symbolic play in children with and without familial risk for dyslexia.Journal of Speech, Language and Hearing Research, 44, 873–885.
Maassen, B., Groenen, P., & Crul, T. (2001). Identification and discrimination of voicingand place-of-articulation in developmental dyslexia. Clinical Linguistics and Phonetics, 15,319–339.
MacArthur, G. M., Hogben, J. H., Edwards, V. T., Heath, S. M., & Mengler, E. D. (2000). Onthe ‘specifics’ of specific reading disability and specific language impairment. Journal ofChild Psychology and Psychiatry, 41, 869–874.
Menn, L., & Stoel-Gammon, C. (1995). Phonological development. In P. Fletcher &B. MacWhinney (Eds.). The handbook of child language. Oxford: Blackwell.
Mody, M., Studdert-Kennedy, M., & Brady, S. (1997). Speech perception deficits in poorreaders: Auditory processing or phonological coding? Journal of Experimental ChildPsychology, 64, 199–231.
Oetting, J., & Rice, M. L. (1993). Morphological deficits of children with SLI:Evaluation of number marking and agreement. Journal of Speech and Hearing Research, 36,1249–1257.
Paul, R. (2000). Predicting outcomes of early expressive language delay: Ethicalimplications. In D. V. M. Bishop & L. B. Leonard (Eds.), Speech and language impairments inchildren: Causes, characteristics, intervention and outcome. Hove: Psychology Press.
Pennington, B. F., & Lefly, D. L. (2001). Early reading development in children at familyrisk for dyslexia. Child Development, 72(3), 816–833.
Perfetti, C. A., Beck, I. L., Bell, L. C., & Hughes, C. (1987). Phonemic knowledge andlearning to read are reciprocal: A longitudinal study of first grade children. Merrill-PalmerQuarterly, 33, 283–319.
Richardson, U., Lepp.aanen, P. H. T., Leiwo, M., & Lyytinen, H. (2003). Speech perception ofinfants with high familial risk for dyslexia differs at the age of 6 months. DevelopmentalNeuropsychology, 23, 385–397.
Santelmann, L., & Jusczyk, P. (1998). Sensitivity to discontinuous dependencies inlanguage learners: Evidence for processing limitations. Cognition, 69, 105–134.
Scarborough, H. S. (1990). Very early language deficits in dyslexic children. ChildDevelopment, 61, 1728–1734.
Scarborough, H. S. (1991). Antecedents to reading disability: Preschool languagedevelopment and literacy experiences of children from dyslexic families. Reading andWriting: An Interdisciplinary Journal, 3, 219–233.
Snijders, J. T., Tellegen, P. J., & Laros, J. A. (1988). Snijders-Oomen niet-verbale intelligentietestSON-R 5.5-17. Verantwoording en handleiding. Groningen: Wolters-Noordhoff.
Language Development in At-risk Children 287
Copyright # 2004 John Wiley & Sons, Ltd. DYSLEXIA 10: 265–288 (2004)

Snowling, M. J. (2001). From language to reading and dyslexia. Dyslexia, 7, 37–46.
Studdert-Kennedy, M. (2002). Deficits in phoneme awareness do not arise from failures inrapid auditory processing. Reading and Writing: An Interdisciplinary Journal, 15, 5–14.
Tomblin, J. B. (1989). The effects of birth order on the occurrence of development languageimpairment. British Journal of Disorders of Communication, 25, 77–84.
Van den Bos, K. P., Lutje Spelberg, H. C., Scheepstra, A. J. M., & de Vries, J. R. (1994).De Klepel, een test voor de leesvaardigheid van pseudowoorden. Verantwoording, handleiding,diagnostiek en behandeling. Nijmegen: Berkhout.
Wijnen, F., & Verrips, M. (1998). The acquisition of Dutch syntax. In S. Gillis &A. De Houwer (Eds.), The acquisition of Dutch (pp. 223–299). Amsterdam: John Benjamins.
P. van Alphen et al.288
Copyright # 2004 John Wiley & Sons, Ltd. DYSLEXIA 10: 265–288 (2004)