Embed Size (px)
Citation preview

EARLY CHILDHOOD VACCINATION TRENDS IN AMERICA PUBLISHED JANUARY 18, 2018

Early Childhood Vaccination Trends in America ( 2 )
BLUE CROSS BLUE SHIELD, THE HEALTH OF AMERICA REPORT
EXECUTIVE SUMMARY
Childhood vaccination is considered one of the top public health accomplishments of the 20th century.1,2 In this new report, the Blue Cross Blue Shield Association, in partnership with HealthCore and Blue Health Intelligence (BHI), examines early childhood vaccination trends for U.S. commercially insured children. The report looks at claims data for children in four birth cohorts (those born in 2010, 2011, 2012 and 2013) and follows their care continuously from birth through 3 years of age.3 This study focuses on completion rates of vaccines in the Centers for Disease Control and Prevention’s recommended seven-vaccine series for children between the years 2013 (by which time the vaccines should have been completed for the first birth cohort) and 2016.4,5,6 (See Appendix A for details on the seven-vaccine series and other CDC-recommended vaccinations and Appendices B and C for specific study methodology.)
This study finds early childhood vaccination rates increased steadily over time. However, wide variation in vaccination rates exists throughout the country at both the state and local levels. Missed well-child visits are a primary driver of under-vaccinated children.
1 For more information, see: https://www.healthypeople.gov/2020/topics-objectives/topic/immunization-and-infectious-diseases2 In recent years, emphasis has been placed on the lack of vaccination during unexpected outbreaks of preventable health conditions. For example, at least
569 people have been infected and 17 have died from the Hepatitis A virus since November in San Diego, Santa Cruz and Los Angeles counties. (For more information, see: http://www.latimes.com/local/California/la-me-ln-hepatitis-outbreaks-20171006-htmlstory.html) In addition, 79 cases of measles were reported in Minnesota between January and May 2017, exceeding the total number of measles cases among the entire U.S. population in 2016. (For more information, see: https://www.cdc.gov/measles/cases-outbreaks.html)
3 While claims data are a useful vehicle for consistent comparisons of vaccination rates across geographies and over time among commercially insured Americans, they do not capture vaccinations obtained from sources where an insurance claim is not filed. One way to supplement claims derived vaccination rates is to leverage state vaccination registries. In fact, a number of insurers use these registries to refine the vaccination rate estimates that they report publically for HEDIS and other purposes. However, to incorporate registry information systematically into a national trend report such as this one would require that payers in all states have access to them. This is currently not the case. For a comparison of the differences in the underlying methodology used in this report and those used in HEDIS measurement of vaccination rates, see Appendix C.
4 Although the CDC recommends that these vaccines should be completed before 18 months of age, this report looks at whether a child has completed these recommended vaccinations by 27 months, or age 2 years and 3 months.
5 The CDC estimates that for each U.S. birth cohort that receives the recommended childhood immunizations, about 20 million illnesses and more than 40,000 deaths are prevented, resulting in 70 billion dollars in financial savings. Despite this achievement, many measures indicate that vaccination rates in the U.S. remain below national public health goals, such as the 90 to 95 percent vaccination rates needed to achieve herd immunity for certain diseases. For more information, see: https://www.ncbi.nlm.nih.gov/pmc/articles/PMC4927017/
6 While the CDC’s seven-series vaccine was chosen as a summary measure, the methodology for calculating vaccine rates in this report differs substantially from the methodology used by the CDC. The methodology in this report uses claims data as its source while the CDC uses a survey with follow-up chart review. This report also looks at commercially insured children by birth cohort while the CDC looks at a sample of all children 19 to 35 months of age in a calendar year. These differences sometimes lead to differences in estimated rates, particularly for specific geographies. Despite differences in approach, national estimates of the seven-series rates are very similar to the CDC numbers with estimates differing less than two percentage points for the years 2013 through 2015.
Vaccines Included in the CDC-Recommended Seven-Vaccine Series
Diphtheria, Tetanus, and acellular Pertussis (DTaP)
Haemophilus influenzae type b (Hib)
Hepatitis B (Hep B)
Inactivated Poliovirus (IPV)
Measles, Mumps, & Rubella (MMR)
Pneumococcal Conjugate (PCV)
Varicella

( 3 )Early Childhood Vaccination Trends in America
BLUE CROSS BLUE SHIELD, THE HEALTH OF AMERICA REPORT
Specific Findings
• Early childhood vaccination rates continue to improve among commercially insured children in the U.S. Seventy-seven percent of children born in 2013 completed their CDC-recommended seven-vaccine series by 2016, up from 69 percent for children born in 2010 and completing the seven-vaccine series by 2013.
• The individual rates for each vaccine in this series also increased during this period, with all vaccines reaching 80 percent by 2016. However, despite these improvements, some of these vaccines remain below the CDC and World Health Organization (WHO) optimum levels to ensure herd immunity in the population, including vaccines for diphtheria, pertussis and measles.
• There is still wide geographic variation in vaccine rates across the country. For example, in 2016, the seven-vaccine series completion rates by state for children in the 2013 birth cohort ranged from a high of 86 percent in North Dakota to a low of 63 percent in Nevada.
• Vaccine refusals: Documented parental/guardian refusals increased nearly 70 percent for children born in 2013 compared to children born in 2010 (4.2 percent versus 2.5 percent, respectively).
• Under vaccination: Failure to attend routine well-child visits is the predominant reason identified in the data for under vaccination among commercially insured children. Missed well-child visits were identified as the reason for under vaccination 62 percent of the time among children completing their vaccinations in 2016. Among these same under-vaccinated children, documented parental/guardian refusal was identified 6 percent of the time.
of commercially insured children born in 2013 completed CDC-recommended seven-vaccine series
77%
I N 2 0 1 6

( 4 )Early Childhood Vaccination Trends in America
BLUE CROSS BLUE SHIELD, THE HEALTH OF AMERICA REPORT
Early Childhood Vaccination TrendsEXHIBIT 1: PERCENTAGE OF CHILDREN COMPLETING THE
CDC-RECOMMENDED SEVEN-VACCINE SERIES BY BIRTH YEARThe proportion of children up-to-date on the CDC-recommended seven-vaccine series by 27 months of age rose steadily in recent years (see Exhibit 1). Completion rates have increased 12 percent nationally from 69 percent for children born in 2010 (who completed the series by 2013) to 77 percent for children born in 2013 (who completed the series by 2016).
Completion rates for each of the seven individual vaccine regimens increased for children born in 2013 when compared to children born in 2010, with each vaccine now exceeding 80 percent (see Exhibit 2).
Despite these improvements, some vaccines remain below the CDC and WHO recommended levels to ensure herd immunity in the population.7 For example, diphtheria may need vaccination rates as high as 86 percent, and pertussis and measles as high as 94 percent, to ensure herd immunity. The vaccine rates (DTaP and MMR) for these diseases are currently 83 percent and 91 percent nationally, respectively. (See Appendix D.)
EXHIBIT 2: PERCENTAGE OF CHILDREN COMPLETING INDIVIDUAL VACCINE REGIMENS
7 The CDC defines herd immunity as: “A situation in which a sufficient proportion of a population is immune to an infectious disease (through vaccination and/or prior illness) to make its spread from person to person unlikely. Even individuals not vaccinated (such as newborns and those with chronic illnesses) are offered some protection because the disease has little opportunity to spread within the community.” For more information, see: https://www.cdc.gov/vaccines/terms/glossary.html#commimmunity; http://sitn.hms.harvard.edu/wp-content/uploads/2010/09/Lecture_1.2.pdf; and https://academic.oup.com/cid/article/52/7/911/299077.
69%
Birth Year
Vacc
ine
Serie
s Co
mpl
etio
n Ra
te
73% 74%77%
+12%
50%
60%
70%
80%
2013201220112010
2010Birth Year
2013
Pneumococcal DTaP Hep B Hib Polio MMR Varicella
Vacc
ine
Com
plet
ion
Rate
60%
70%
80%
90%
100%
75%
82%
77%
83%82%
89%
82%
87%
83%
88% 87%
91%
87%
90%

( 5 )Early Childhood Vaccination Trends in America
BLUE CROSS BLUE SHIELD, THE HEALTH OF AMERICA REPORT
Geographic Variation of Early Childhood VaccinationsWide geographic variation exists for completion rates of the CDC-recommended seven-vaccine series when comparing these rates by state, metropolitan statistical areas (MSAs) and counties. (See Appendix E.)
State-level completion rates for children born in 2013 (based on data collected through 2016) ranged from a high of 86 percent in North Dakota to a low of 63 percent in Nevada (see Exhibit 3).8
EXHIBIT 3: PERCENTAGE OF CHILDREN COMPLETING THE CDC-RECOMMENDED SEVEN-VACCINE SERIES BY STATE FOR CHILDREN BORN IN 2013 (AND COMPLETING VACCINES BY 2016)
8 Alaska, Hawaii, Montana, South Dakota, Washington, D.C. and Wyoming were excluded from reporting due to an insufficient study population.
<70
70 – 75
75 – 80
80 – 85
85+
WA
OR
CA
NV
ID
MT
WY
UTCO
NMAZ
TX
OK
KS
NE
ND
MN
SD
IAMI
WI
IL
MO
IN
KY
OH
TNAR
LA
MS AL GA
FL
PR
SC
NC
VA
WV
PA
NY
VTNH
ME
MACT RI
NJ
DEMD
Washington DC
HI
AK

( 6 )Early Childhood Vaccination Trends in America
BLUE CROSS BLUE SHIELD, THE HEALTH OF AMERICA REPORT
Rates of Vaccine Refusals
Among all children, the proportion with one or more documented parental/guardian vaccine refusal increased from 2.5 percent for children born in 2010 to 4.2 percent for children born in 2013 (see Appendix E). Refusals for the 2013 birth cohort are spread fairly evenly across all of the seven vaccines in the CDC-recommended series. This spread suggests that no single vaccine is more likely to result in a refusal than any other vaccine (see Exhibit 4).9
EXHIBIT 4: PERCENTAGE OF CHILDREN COMPLETING EACH OF THE VACCINATIONS IN THE CDC-RECOMMENDED SEVEN-VACCINE SERIES BY 27 MONTHS OF AGE – ALL BIRTH COHORTS
Documented parental/guardian vaccine refusal rates also vary by state and MSA (see Appendix E). Higher rates of refusal are found in the Northeast—particularly the New York City area—and in the Pacific Northwest, while lower rates are found in the South and Midwest.
9 Documented refusal rates are based on all ten CDC-recommended vaccines for early childhood. Forty percent of children with a documented parental/guardian vaccine refusal caught up on all of the CDC-recommended vaccines in the seven-vaccine series by their 27th month of age, suggesting that some initial refusals are not based on a sustained objection to vaccinations.
All infantsRefused at least 1 vaccine
DTaP Hep BHibPolio MMR Varicella PCV
Vacc
ine
Com
plet
ion
Rate
0%
20%
40%
60%
80%
100%
80%
66%
85%
68%
89%
69%
84%
68%
85%
64%
89%
66%
78%
61%

( 7 )Early Childhood Vaccination Trends in America
Reasons for Under-Vaccinated Children by Age 27 Months
Overall, early childhood vaccination rates are strong nationwide and increasing in recent years, yet there remains opportunity for improvement in many areas. Reasons identified in the data for under vaccination in children (those who fail to complete their seven-vaccine series by age 27 months) are presented in Exhibit 5.10
Among children scheduled to complete their vaccinations by 2016, 23 percent missed one or more of the vaccines in the CDC-recommended seven-vaccine series. Missed well-child visits accounted for 62 percent of all of these under-vaccinated children (see Exhibit 5). In contrast, documented vaccine refusals accounted for 6 percent of these under-vaccinated children. Delays due to scheduling vaccinations where children eventually completed the seven-vaccine series (called inferred delays) accounted for 4 percent of these under-vaccinated children.
EXHIBIT 5: REASONS FOR UNDER VACCINATION FOR CHILDREN SCHEDULED TO COMPLETE THE CDC-RECOMMENDED SEVEN-VACCINE SERIES BY 2016
10 Under-vaccinated children as defined here should not be confused with children with a “documented parental/guardian refusal” as defined in the previous section. Children in the former group do not complete their seven vaccine series by age 27 months. Forty percent of children in the latter group with a documented parental/guardian refusal eventually do complete the vaccine series despite the initial refusal.
77%Vaccinated
23%Under-
Vaccinated 62%Missed Visit
Refusal
6%
Inferred Delay
4%
28%Reason Not
Identified

( 8 )Early Childhood Vaccination Trends in America
BLUE CROSS BLUE SHIELD, THE HEALTH OF AMERICA REPORT
EXHIBIT 6: PERCENTAGE OF PARENT/GUARDIAN DOCUMENTED REFUSALS BY AGE OF THE CHILD WHEN THE REFUSAL OCCURRED – ALL BIRTH COHORTS
In general, children who have attended more well-child visits have higher vaccine completion rates. On average, sufficiently vaccinated children completing the seven-vaccine series by 27 months of age had two more well-child visits than children who did not complete the series.11
For the 6 percent of under-vaccinated children where a parental/guardian vaccine refusal was the reason for under vaccination, 29 percent of refusals took place on the first day of life (see Exhibit 6). An additional 15 percent of refusals took place before reaching 4 months of age. Parental/guardian vaccine refusals decrease rapidly as children grow older.
11 The American Academy of Pediatrics (AAP) recommends 10 well child visits by age 2.
0 Days 0-3 M 4-6 M 7-9 M 10-12 M 13-15 M 16-18 M 19-21 M 22-24 M 25-27 M
Child
ren
unde
r-vac
cina
ted
due
to re
fusa
l
0%
5%
10%
15%
20%
25%
30%29%
9%
15%
9%
6%
9%7% 7%
2%
8%
Age of Child (Months)

CONCLUSIONThis report, sponsored by the Blue Cross Blue Shield Association, in partnership with HealthCore and Blue Health Intelligence, demonstrates that early childhood vaccination rates are on the rise nationwide but there is room for further improvement. While the national rate of fully vaccinated children grew, there is still significant geographic variation. Missed well-child visits appear to be the largest reason for under-vaccination among children from birth to age 2 years 3 months. This study suggests continued awareness, education and compliance with the recommended well-child visits could improve vaccination rates. Administration of the seven-vaccine series will sustain improvements in vaccination rates of children in America.
© 2018 Blue Cross Blue Shield Association. All Rights Reserved.Blue Cross Blue Shield Association is an association of independent Blue Cross and Blue Shield companies.Health Intelligence Company, LLC operates under the trade name Blue Health Intelligence (BHI) and is an Independent Licensee of BCBSA. 17-659-V05
( 9 )

( 10 )Early Childhood Vaccination Trends in America
Appendix
Appendix A: CDC-Recommended Vaccinations by Age Group
CDC-Recommended Vaccines for Children by Age 18 months
Vaccine # of doses
Diphtheria, Tetanus, and acellular Pertussis (DTaP) 4
Haemophilus influenzae type b (Hib) 3 or 4 (depending on manufacturer)
Hepatitis B (Hep B) 1 at birth* + 2 outpatient
Inactivated Poliovirus (IPV) 3
Measles, mumps, & rubella (MMR) 1
Pneumococcal conjugate (PCV) 4
Varicella 1
* This report excludes birth dose of Hepatitis B.
This report focuses on the seven-vaccine series as the definitive CDC summary measure of childhood vaccinations. The CDC also recommends two vaccinations for Hepatitis A, two or three for rotavirus (depending on the manufacturer of the vaccine), and the seasonal flu shot to be given by age 18 months (24 months in the case of the Hepatitis A vaccine)
For more information, see: https://www.cdc.gov/mmwr/volumes/65/wr/pdfs/mm6539a4.pdf

( 11 )Early Childhood Vaccination Trends in America
Appendix B: Methodology
Data and Study Population
This is the seventeenth study of the Blue Cross Blue Shield: The Health of America Report series, a collaboration between the Blue Cross Blue Shield Association and Blue Health Intelligence, which uses a market-leading claims database to uncover key trends and insights into healthcare affordability and access to care. Analysis was performed by and also includes medical claims data from HealthCore, a wholly owned and independently operated health outcomes subsidiary of Anthem, Inc.
This study looks at medical claims for services taking place between January 1, 2010 through December 31, 2016. Children with three years of continuous medical eligibility in a commercial BCBS plan were included in the study as summarized below:
Birth cohorts under study Continuous eligibility requirement
Children born 2010 through 2013 Age 0 through 3.0 years
Total sample size (the number of children contributing data to the childhood vaccination rates) was 843,610 children.
For the children in this study, each birth cohort is labeled by the year in which the child is born, followed by data for three years for each cohort. As a result, for children born in 2010, data from 2010, 2011, 2012 and 2013 are included; for children born in 2011, data from 2011, 2012, 2013 and 2014 are included, and so on for the next two birth years.
Children are counted as fully immunized with the series or individual vaccines as long as they receive the needed vaccine(s) by age 27 months, allowing nine months of buffer time for parents/guardians running behind schedule to take their children to their physician to receive their vaccines.
The report does not capture members who will receive the childhood vaccines after 27 months of age or members who received vaccines from a free public or private local program that does not generate a medical claim.
For more information and to read past reports from The Health of America Report series, visit www.bcbs.com/the-health-of-america.
Methodological Notes
• The analysis included all medical claims for vaccine utilization.
• Metrics were adjusted for presence of “administration-only” vaccination claims.
• States, metropolitan statistical areas and counties with less than 500 children in a given sample were excluded from display.

( 12 )Early Childhood Vaccination Trends in America
Under Vaccination Rationale Hierarchy
A reason for under vaccination was assigned for each insufficiently vaccinated case based on information available in the claims data and following the order indicated below. When more than one reason is identified for a given child, the highest ranked item below was taken as the reason for under vaccination:
1. Child had a contraindication for vaccination, for example HIV.
2. Child’s parent/guardian refused at least one vaccine as identifiable by diagnosis code.
3. Child had the disease the vaccine is meant to prevent.
• For example: A diagnosis code for varicella (chicken pox) would be a “reason” for non-compliance with the varicella vaccine.
• Presence of disease was assessed from birth to age 2 years and 3 months.
4. Child missed at least two well-child visits to a physician.
• Number of well-child visits up to age 2 years and 3 months was less than nine visits. (AAP recommends 10 well-child visits by this age.)
5. Inferred delay
• Child was not up-to-date as of age 2 years and 3 months but was up-to-date as of age 3 years.
6. Unknown reason
Data Exclusion
Data from Anthem BCBS were excluded from California because of the prevalence of capitated payments to primary care providers, reducing the incentive for providers to submit claims for primary care, and under representing vaccination rates in that state. Additionally, in several cases, insufficient sample sizes resulted in the exclusion of certain states or metropolitan statistical areas from the reporting of results. Sample size minimums exclude the reporting of results from Alaska, Hawaii, Montana, South Dakota, Washington D.C. and Wyoming and select metropolitan areas.

( 13 )Early Childhood Vaccination Trends in America
Appendix C: Comparison with HEDIS Childhood Immunization Status Methodology
The vaccination rates in the report use different data sources and different methodology and have no direct connection to the HEDIS measurements published by individual health plans. HEDIS measures rely on multiple sources including medical records and state immunization data, whereas this report relies on claims data to ensure consistency across all areas of the country. Moreover, HEDIS measures are health plan or product-specific, while the measures in this report look at the entire BCBS commercially insured population and are reported based on the child’s state of residence. See below for a detailed comparison with HEDIS measures. The report also does not capture vaccinations that may be administered without a medical claim through public health departments and local programs.
Methodological Detail HEDIS Method – “Hybrid” Specification BCBS Study Method
Data source(s) Administrative claims, medical record review, and state-based immunization information systems (where made available)
Administrative claims
Age of children in study population Children who turn 2 years of age during the measurement year
Children aged 2 years and 3 months
Unit of reporting Plans: Separate measures for HMO and PPO; members are assigned to their plan state, i.e., the state where their insurance contract was written/issued.
States of residence: Members contribute data to the state where they live, based on zip code at beginning of eligibility.
Continuous enrollment required for inclusion in study, including allowable gaps
Twelve months continuous enrollment prior to child’s 2nd birthday, with no more than one gap of up to 45 days.
Continuous enrollment from birth to 3rd birthday, with allowable gaps of 30 days at the beginning of life and 2 days after that.
Inclusion of birth dose of hepatitis B in measure scope
Included in some measures Not included in study scope
Inclusion of annual vaccination for seasonal flu in measure scope
Included in some measures Not included in study scope
Minimum interval between doses of a given vaccine/antigen
Minimum age imposed (e.g., vaccination on 10th day of life does not count)
Minimum age and minimum 28-day interval between doses imposed
Children with contraindications for vaccination
Children with contraindication(s) are excluded from the calculation of the measure
Contraindication is considered a “reason” for not getting vaccinated
Children who “had the disease” (e.g., diagnosis code for chickenpox)
Count toward numerator Considered a reason for not getting vaccinated
Sources for HEDIS measure details: – National Committee for Quality Assurance, “Childhood Immunization Status,”
available http://www.ncqa.org/portals/0/Childhood%20Immunization%20Status.pdf. – Centers for Medicare and Medicaid Services, “2017 Quality Rating System Measure Technical
Specifications,” Page 111: https://www.cms.gov/Medicare/Quality-Initiatives-Patient-Assessment-Instruments/QualityInitiativesGenInfo/Downloads/2017_QRS-Measure_Technical_Specifications.pdf

( 14 )Early Childhood Vaccination Trends in America
Appendix D: Vaccination Rates for CDC-Recommended Vaccines
National Childhood Vaccination Rates for CDC-Recommend Vaccines by Birth Year for Children
Age 18 Months or Younger (Measured at 2 years and 3 months)
National Percentage of Infants Born in Given Year and Fully Vaccinated by Age 2 Years, 3 Months with Given Vaccine
Vaccine Born 2010 Born 2011 Born 2012 Born 2013Percent Change From 2010 to 2013
7-Vaccine Series 68.7% 72.1% 74.0% 76.7% 11.7%
DTaP - 3 doses 87.4% 89.3% 90.4% 92.0% 5.2%
DTaP - 4 doses 76.6% 79.2% 80.9% 83.4% 8.9%
Hep A - 1 dose 81.2% 83.7% 85.4% 86.8% 7.0%
Hep A - 2 doses 59.4% 63.0% 65.7% 68.2% 14.7%
Hep B - 2 doses 82.5% 84.4% 86.3% 88.6% 7.5%
Hib - 3/4 doses 81.6% 83.9% 85.0% 86.7% 6.3%
MMR - 1 dose 87.2% 88.7% 90.0% 91.1% 4.6%
Pneumcoccal - 3 doses 85.4% 87.4% 88.6% 90.0% 5.4%
Pneumcoccal - 4 doses 74.8% 77.7% 79.3% 81.5% 9.1%
Polio - 3 doses 82.7% 84.4% 85.1% 87.7% 6.0%
Rotavirus - 2/3 doses 69.0% 73.4% 75.6% 78.3% 13.6%
Varicella - 1 dose 86.7% 88.2% 89.3% 90.1% 3.9%

( 15 )Early Childhood Vaccination Trends in America
Appendix E-1: Seven-vaccine Series Vaccination Rates by State
Percent of Infants Born in Given Year and Fully Vaccinated with the Seven-Vaccine Series
by Age 2 Years, 3 Months
State Born 2010
Born 2013
Percent Change Between 2010 to 2013
Total Vaccination Rate for All Infants in Study
AL 76.4% 78.5% 2.8% 77.8%
AR 72.0% 82.3% 14.3% 75.0%
AZ 68.3% 73.8% 8.1% 71.5%
CA 70.8% 74.3% 4.9% 73.7%
CO 70.3% 74.9% 6.5% 72.3%
CT 69.4% 84.9% 22.4% 77.6%
DE 73.9% 83.3% 12.7% 81.6%
FL 69.4% 72.8% 5.0% 71.6%
GA 75.6% 80.4% 6.3% 78.4%
IA 70.6% 78.7% 11.5% 74.6%
ID 71.9% 77.7% 8.1% 75.0%
IL 69.1% 79.1% 14.4% 74.9%
IN 62.2% 73.2% 17.7% 68.6%
KS * 80.4% * *
KY 75.0% 78.8% 5.1% 77.6%
LA * 78.6% * *
MA 66.7% 77.9% 16.7% 72.9%
MD 73.4% 81.8% 11.5% 77.7%
ME 74.0% 68.6% -7.3% 70.8%
MI 57.6% 74.1% 28.6% 67.8%
MN 76.3% 83.5% 9.3% 81.3%
MO * 78.3% * *
MS * 73.9% * *
Percent of Infants Born in Given Year and Fully Vaccinated with the Seven-Vaccine Series
by Age 2 Years, 3 Months
State Born 2010
Born 2013
Percent Change Between 2010 to 2013
Total Vaccination Rate for All Infants in Study
NC 74.5% 81.9% 10.0% 79.8%
ND 85.8% 86.4% 0.8% 83.8%
NE 75.2% 85.7% 14.0% 81.3%
NH 72.6% 78.2% 7.8% 75.9%
NJ 69.3% 71.2% 2.8% 70.9%
NM 66.5% 72.9% 9.7% 69.2%
NV 57.7% 62.7% 8.7% 60.1%
NY 59.4% 70.6% 18.8% 64.2%
OH 69.3% 74.3% 7.3% 71.9%
OK 72.9% 76.7% 5.2% 74.6%
OR 70.7% 75.3% 6.4% 72.7%
PA 81.9% 85.4% 4.3% 83.8%
RI 77.0% 82.0% 6.5% 80.1%
SC 75.0% 80.1% 6.9% 77.8%
TN 75.2% 80.5% 7.1% 78.9%
TX 78.4% 82.1% 4.7% 80.6%
UT 71.7% 77.0% 7.3% 72.9%
VA 69.8% 75.6% 8.3% 73.9%
VT * 83.6% * *
WA 77.6% 81.4% 4.9% 79.7%
WI 71.5% 74.0% 3.5% 72.2%
WV 70.1% 74.5% 6.2% 73.4%
National 69.2% 77.2% 11.6% 73.5%
* Insufficient data

( 16 )Early Childhood Vaccination Trends in America
Appendix E-2: Seven-vaccine Series Vaccination Rates by MSA
Percent of Infants Born in Given Year and Fully Vaccinated with the Seven-Vaccine Series by Age 2 Years, 3 Months
MSA Born 2010
Born 2013
Percent Change Between 2010 to 2013
Total Vaccination Rate for All Infants in Study
AKRON, OH 80.3% 78.2% -2.6% 78.9%
ALBANY-SCHENECTADY-TROY, NY 49.5% 56.1% 13.3% 53.5%
ALBUQUERQUE, NM 69.6% 71.5% 2.6% 71.8%
ALLENTOWN-BETHLEHEM-EASTON, PA 82.1% 82.7% 0.7% 82.9%
ALTOONA, PA 81.5% 88.7% 8.8% 86.7%
ANN ARBOR, MI 62.1% 72.3% 16.4% 68.7%
APPLETON-OSHKOSH-NEENAH, WI 87.4% 84.0% -3.9% 82.1%
ATLANTA, GA 75.7% 80.4% 6.2% 78.8%
AUGUSTA-AIKEN, GA-SC 76.9% 81.8% 6.4% 79.9%
AUSTIN-SAN MARCOS, TX 73.7% 76.4% 3.7% 75.3%
BALTIMORE, MD 76.7% 84.4% 10.0% 79.5%
BATON ROUGE, LA 70.0% 83.9% 19.9% *
BEAUMONT-PORT ARTHUR, TX 74.7% 81.0% 8.5% 78.3%
BENTON HARBOR, MI * 80.4% * *
BERGEN-PASSAIC, NJ 67.3% 67.4% 0.2% 66.4%
BIRMINGHAM, AL 73.8% 72.3% -2.1% 76.1%
BISMARCK, ND 85.7% 86.0% 0.3% 85.8%
BLOOMINGTON, IN * 79.3% * *
BLOOMINGTON-NORMAL, IL * 89.6% * *
BOISE CITY, ID 73.6% 81.0% 10.1% 77.9%
BOSTON-CAMBRIDGE-QUINCY, MA* 66.1% 76.0% 15.0% 71.6%
BRAZORIA, TX 81.8% 88.9% 8.7% 84.1%
BRYAN-COLLEGE STATION, TX 80.4% 88.2% 9.6% 83.4%
BUFFALO-NIAGARA FALLS, NY 80.6% 84.1% 4.4% 82.4%
CANTON-MASSILLON, OH 70.6% 68.9% -2.4% 68.3%
CHARLESTON, WV 74.0% 75.0% 1.4% 76.4%
CHARLESTON-NORTH CHARLESTON, SC 75.4% 80.7% 7.0% 79.7%
CHARLOTTE-GASTONIA-ROCK HILL, NC-SC 71.5% 80.7% 12.8% 78.2%
CHARLOTTESVILLE, VA 59.4% 64.9% 9.3% 64.0%
CHATTANOOGA, TN-GA * 80.6% * *
CHICAGO, IL 70.6% 79.0% 11.9% 75.6%
CINCINNATI, OH-KY-IN 76.2% 78.9% 3.6% 77.8%
CLEVELAND-LORAIN-ELYRIA, OH 68.5% 72.4% 5.7% 70.4%
* The Boston-Cambridge-Quincy MSA includes the counties of Middlesex, Essex, Suffolk, Norfolk and Plymouth, Massachusetts.

( 17 )Early Childhood Vaccination Trends in America
Percent of Infants Born in Given Year and Fully Vaccinated with the Seven-Vaccine Series by Age 2 Years, 3 Months
MSA Born 2010
Born 2013
Percent Change Between 2010 to 2013
Total Vaccination Rate for All Infants in Study
COLORADO SPRINGS, CO 72.5% 67.5% -6.9% 67.1%
COLUMBIA, SC 79.2% 78.5% -0.9% 78.3%
COLUMBUS, GA-AL 82.3% 84.3% 2.5% 81.9%
COLUMBUS, OH 73.6% 78.7% 6.9% 77.4%
DALLAS, TX 80.9% 83.1% 2.7% 82.3%
DAVENPORT-ROCK ISLAND-MOLINE, IA-IL 74.6% 78.6% 5.4% 76.3%
DAYTON-SPRINGFIELD, OH 74.3% 77.4% 4.3% 75.7%
DENVER, CO 72.9% 78.1% 7.2% 75.9%
DETROIT, MI 54.6% 70.9% 29.8% 64.7%
DOVER, DE 77.4% 78.8% 1.8% 78.4%
DULUTH-SUPERIOR, MN-WI 72.2% 80.2% 11.1% 74.8%
DUTCHESS COUNTY, NY * 74.6% * *
EL PASO, TX 68.9% 78.7% 14.2% 73.9%
ELKHART-GOSHEN, IN 62.4% 69.5% 11.4% 66.6%
ERIE, PA 78.8% 82.3% 4.4% 78.4%
EVANSVILLE-HENDERSON, IN-KY 75.6% 84.8% 12.1% 81.2%
FARGO-MOORHEAD, ND-MN 85.6% 92.2% 7.6% 83.8%
FAYETTEVILLE-SPRINGDALE-ROGERS, AR 69.3% 84.0% 21.2% 76.3%
FLINT, MI 57.2% 72.8% 27.2% 67.9%
FORT COLLINS-LOVELAND, CO 70.4% 71.7% 1.7% 69.1%
FORT LAUDERDALE, FL 71.5% 73.0% 2.1% 73.7%
FORT WAYNE, IN 53.3% 69.2% 29.8% 63.4%
FORT WORTH-ARLINGTON, TX 80.1% 78.9% -1.4% 79.9%
GALVESTON-TEXAS CITY, TX 71.8% 81.0% 12.8% 80.5%
GARY, IN 61.3% 72.5% 18.1% 67.6%
GRAND FORKS, ND-MN 82.7% 87.7% 6.1% 86.3%
GRAND RAPIDS-MUSKEGON-HOLLAND, MI 68.0% 86.2% 26.8% 78.4%
GREELEY, CO 53.5% 68.8% 28.7% 62.5%
GREENSBORO--WINSTON-SALEM--HIGH POINT, NC
79.9% 80.3% 0.5% 80.5%
GREENVILLE-SPARTANBURG-ANDERSON, SC 74.4% 81.8% 9.9% 78.2%
HAMILTON-MIDDLETOWN, OH 69.9% 75.6% 8.1% 71.7%
HARRISBURG-LEBANON-CARLISLE, PA 82.4% 87.3% 5.9% 85.4%
HOUMA, LA * 76.5% * *
HOUSTON, TX 82.0% 85.2% 3.9% 84.1%
Seven-vaccine Series Vaccination Rates by MSA (continued)

( 18 )Early Childhood Vaccination Trends in America
Percent of Infants Born in Given Year and Fully Vaccinated with the Seven-Vaccine Series by Age 2 Years, 3 Months
MSA Born 2010
Born 2013
Percent Change Between 2010 to 2013
Total Vaccination Rate for All Infants in Study
HUNTINGTON-ASHLAND, WV-KY-OH 64.2% 68.3% 6.3% 65.3%
HUNTSVILLE, AL 82.5% 79.0% -4.3% 78.6%
INDIANAPOLIS, IN 71.8% 76.9% 7.1% 74.4%
JACKSONVILLE, FL 73.5% 65.7% -10.6% 69.5%
JERSEY CITY, NJ 63.2% 68.6% 8.6% 66.4%
JOHNSON CITY-KINGSPORT-BRISTOL, TN-VA 69.1% 79.6% 15.3% 74.1%
JOHNSTOWN, PA 85.6% 88.3% 3.2% 85.9%
JONESBORO, AR 81.6% 82.7% 1.4% 78.8%
JOPLIN, MO 58.1% 69.4% 19.5% 65.7%
KALAMAZOO-BATTLE CREEK, MI 64.7% 81.3% 25.6% 75.3%
KANKAKEE, IL 67.6% 73.5% 8.8% 73.7%
KANSAS CITY, MO-KS * 79.4% * *
KNOXVILLE, TN 70.4% 78.7% 11.8% 77.7%
LAFAYETTE, IN * 84.8% * *
LAFAYETTE, LA 71.0% 78.3% 10.3% *
LAKE CHARLES, LA * 67.5% * *
LAKELAND-WINTER HAVEN, FL 69.7% 76.6% 9.8% 74.2%
LANCASTER, PA 79.1% 83.8% 6.0% 81.6%
LANSING-EAST LANSING, MI 62.0% 73.9% 19.2% 65.2%
LAREDO, TX * 72.4% * *
LAS VEGAS, NV-AZ 50.2% 63.5% 26.7% 57.7%
LEXINGTON, KY 80.6% 73.8% -8.4% 77.7%
LINCOLN, NE 77.2% 83.6% 8.3% 79.6%
LITTLE ROCK-NORTH LITTLE ROCK, AR 81.8% 86.4% 5.6% 84.5%
LOS ANGELES-LONG BEACH, CA 69.2% 71.4% 3.2% 72.0%
LOUISVILLE, KY-IN 76.7% 80.9% 5.5% 78.5%
LUBBOCK, TX 85.8% 84.3% -1.7% 82.0%
LYNCHBURG, VA 65.4% 65.0% -0.5% 67.4%
MADISON, WI 57.9% 57.6% -0.5% 56.0%
MCALLEN-EDINBURG-MISSION, TX 65.3% 69.9% 7.1% 71.1%
MEMPHIS, TN-AR-MS 78.8% 79.5% 1.0% 78.3%
MIAMI, FL 64.9% 70.8% 9.0% 68.2%
MIDDLESEX-SOMERSET-HUNTERDON, N 65.4% 65.1% -0.4% 65.1%
MILWAUKEE-WAUKESHA, WI 73.1% 75.6% 3.3% 74.4%
Seven-vaccine Series Vaccination Rates by MSA (continued)

( 19 )Early Childhood Vaccination Trends in America
Percent of Infants Born in Given Year and Fully Vaccinated with the Seven-Vaccine Series by Age 2 Years, 3 Months
MSA Born 2010
Born 2013
Percent Change Between 2010 to 2013
Total Vaccination Rate for All Infants in Study
MINNEAPOLIS-ST. PAUL, MN-WI 76.9% 83.8% 9.0% 82.3%
MONMOUTH-OCEAN, NJ 62.9% 63.8% 1.4% 64.9%
MYRTLE BEACH, SC 74.3% 80.6% 8.5% 77.3%
NASHVILLE, TN 79.0% 81.6% 3.3% 80.9%
NASSAU-SUFFOLK, NY 59.5% 60.3% 1.3% 59.5%
NEW ORLEANS, LA 68.0% 80.4% 18.2% *
NEW YORK-NEWARK, NY-NJ-PA 56.3% 62.4% 10.7% 59.3%
NEWARK, NJ 63.4% 67.4% 6.3% 66.3%
NEWBURGH, NY-PA 53.6% 63.9% 19.4% 58.2%
NORFOLK-VIRGINIA BEACH-NEWPORT NEWS, VA-NC
70.8% 78.5% 10.9% 74.8%
OAKLAND, CA 80.2% 78.8% -1.7% 77.9%
ODESSA-MIDLAND, TX 76.5% 77.3% 1.0% 77.4%
OKLAHOMA CITY, OK 75.6% 79.3% 4.9% 77.8%
OMAHA, NE-IA 83.2% 88.0% 5.7% 86.2%
ORANGE COUNTY, CA 72.6% 75.6% 4.1% 74.1%
ORLANDO, FL 65.8% 72.1% 9.6% 69.3%
PEORIA-PEKIN, IL * 81.7% * *
PHILADELPHIA, PA-NJ 82.9% 86.7% 4.6% 85.4%
PHOENIX-MESA, AZ 68.2% 75.5% 10.7% 72.4%
PITTSBURGH, PA 81.5% 85.0% 4.3% 82.8%
PORTLAND-VANCOUVER,OR-WA 70.5% 75.4% 7.0% 72.4%
RALEIGH-DURHAM-CHAPEL HILL, NC 75.5% 84.3% 11.7% 80.9%
READING, PA 83.8% 85.8% 2.3% 84.7%
RICHLAND-KENNEWICK-PASCO, WA 73.7% 77.8% 5.6% 72.7%
RICHMOND-PETERSBURG, VA 72.4% 79.1% 9.3% 76.7%
RIVERSIDE-SAN BERNADINO, CA 69.2% 63.6% -8.1% 68.9%
ROANOKE, VA 67.4% 78.7% 16.7% 75.6%
ROCHESTER, NY * 87.7% * *
ROCKFORD, IL 69.4% 76.7% 10.4% 73.6%
SAGINAW-BAY CITY-MIDLAND, MI * 73.5% * *
SALT LAKE CITY-OGDEN, UT 70.9% 76.5% 7.9% 73.1%
SAN ANTONIO, TX 80.3% 84.1% 4.7% 82.8%
Seven-vaccine Series Vaccination Rates by MSA (continued)

( 20 )Early Childhood Vaccination Trends in America
Percent of Infants Born in Given Year and Fully Vaccinated with the Seven-Vaccine Series by Age 2 Years, 3 Months
MSA Born 2010
Born 2013
Percent Change Between 2010 to 2013
Total Vaccination Rate for All Infants in Study
SAN DIEGO, CA 71.7% 78.5% 9.5% 75.5%
SAN FRANCISCO, CA 77.1% 75.2% -2.4% 78.1%
SCRANTON-WILKES-BARRE-HAZLETON, PA 74.9% 78.5% 4.8% 76.1%
SEATTLE-BELLEVUE-EVERETT, WA 80.7% 84.2% 4.3% 82.8%
SHARON, PA 78.7% 82.7% 5.1% 79.0%
SHREVEPORT-BOSSIER CITY, LA 57.1% 70.4% 23.2% *
SIOUX FALLS, SD 76.4% 74.7% -2.2% 72.5%
SOUTH BEND, IN 57.4% 68.2% 18.7% 63.0%
SPOKANE, WA 68.0% 70.6% 3.7% 69.4%
SPRINGFIELD, IL 68.2% 80.0% 17.3% 76.5%
SPRINGFIELD, MO 74.9% 75.7% 1.2% 76.2%
ST. CLOUD, MN 80.6% 84.1% 4.3% 83.8%
ST. LOUIS, MO-IL 77.9% 82.4% 5.9% 80.7%
STATE COLLEGE, PA 80.2% 84.9% 5.9% 85.2%
SYRACUSE, NY 78.8% 85.4% 8.4% 84.4%
TACOMA, WA 68.3% 76.1% 11.3% 72.0%
TAMPA-ST. PETERSBURG-CLEARWATER, FL 71.8% 80.2% 11.6% 77.2%
TOLEDO, OH 65.4% 75.4% 15.3% 71.0%
TOPEKA, KS * 87.2% * *
TULSA, OK 72.2% 77.5% 7.3% 73.9%
WASHINGTON, DC-MD-VA-WV 69.9% 75.0% 7.3% 73.5%
WEST PALM BEACH-BOCA RATON, FL 69.3% 73.0% 5.3% 74.4%
WICHITA, KS * 74.8% * *
WILMINGTON-NEWARK, DE-MD 70.9% 84.2% 18.7% 81.7%
YORK, PA 84.1% 87.1% 3.6% 86.5%
YOUNGSTOWN-WARREN, OH 66.7% 67.6% 1.4% 65.5%
National 69.2% 77.2% 11.6% 73.5%
Seven-vaccine Series Vaccination Rates by MSA (continued)

( 21 )Early Childhood Vaccination Trends in America
Appendix E-3: Seven-vaccine Series Vaccination Rates by County
Percent of Infants Born in Given Year and Fully Vaccinated with the Seven-Vaccine Series by Age 2 Years, 3 Months
County State Born 2010
Born 2013
Percent Change Between 2010 to 2013
Total Vaccination Rate for All Infants in Study
Jefferson AL 73.6% 70.7% -3.9% 74.2%
Madison AL 82.5% 80.3% -2.7% 80.3%
Benton AR 66.2% 83.8% 26.6% 75.8%
Craighead AR 81.6% 82.7% 1.4% 78.8%
Faulkner AR 87.9% 75.0% -14.7% 81.8%
Pulaski AR 81.5% 88.1% 8.2% 85.3%
Washington AR 75.3% 84.3% 11.9% 77.4%
Maricopa AZ 69.0% 75.9% 10.0% 73.1%
Los Angeles CA 69.0% 72.9% 5.6% 72.9%
Orange CA 72.6% 75.6% 4.1% 74.1%
Riverside CA 66.5% 61.1% -8.1% 66.3%
San Diego CA 71.7% 78.5% 9.5% 75.5%
Santa Clara CA 78.9% 73.8% -6.5% 78.6%
Adams CO 70.1% 78.0% 11.3% 75.7%
Arapahoe CO 74.3% 81.6% 9.7% 78.4%
Boulder CO 53.5% 68.8% 28.7% 62.5%
Denver CO 77.7% 81.7% 5.1% 78.1%
Douglas CO 78.9% 77.4% -1.9% 79.0%
El Paso CO 72.5% 67.5% -6.9% 67.1%
Jefferson CO 65.5% 76.3% 16.3% 72.6%
Larimer CO 70.4% 71.7% 1.7% 69.1%
Weld CO 69.7% 73.5% 5.4% 71.7%
Fairfield CT 70.3% 79.1% 12.5% 74.8%
Hartford CT 72.0% 86.1% 19.6% 80.5%
New Haven CT 68.1% 87.2% 28.0% 78.3%
New London CT 76.4% 93.1% 21.8% 82.0%
Kent DE 77.4% 78.8% 1.8% 78.4%
New Castle DE 70.9% 83.4% 17.6% 81.4%
Sussex DE 90.0% 87.6% -2.7% 85.6%
Broward FL 71.5% 73.0% 2.1% 73.7%
Duval FL 73.6% 59.1% -19.6% 65.0%
Hillsborough FL 75.4% 81.1% 7.5% 78.5%
Miami-Dade FL 64.9% 70.8% 9.0% 68.2%

( 22 )Early Childhood Vaccination Trends in America
Percent of Infants Born in Given Year and Fully Vaccinated with the Seven-Vaccine Series by Age 2 Years, 3 Months
County State Born 2010
Born 2013
Percent Change Between 2010 to 2013
Total Vaccination Rate for All Infants in Study
Orange FL 60.7% 72.1% 18.9% 67.2%
Palm Beach FL 69.3% 73.0% 5.3% 74.4%
Polk FL 69.7% 76.6% 9.8% 74.2%
Cherokee GA 77.8% 68.5% -11.9% 76.2%
Cobb GA 74.3% 85.2% 14.7% 81.1%
DeKalb GA 73.3% 84.5% 15.3% 78.9%
Forsyth GA 79.2% 77.5% -2.1% 82.3%
Fulton GA 78.8% 81.1% 2.9% 80.8%
Gwinnett GA 78.1% 85.2% 9.2% 81.6%
Muscogee GA 83.2% 83.3% 0.1% 81.5%
Ada ID 74.9% 83.5% 11.4% 79.3%
Canyon ID 69.2% 74.6% 7.8% 74.0%
Cook IL 69.6% 78.6% 12.9% 74.8%
DeKalb IL 62.6% 63.4% 1.4% 64.8%
DuPage IL 75.9% 82.7% 8.9% 79.8%
Grundy IL 57.6% 70.9% 23.3% 67.0%
Kane IL 67.6% 75.1% 11.1% 71.7%
Kankakee IL 67.6% 73.5% 8.8% 73.7%
Kendall IL 69.8% 76.4% 9.5% 75.7%
La Salle IL 57.9% 79.3% 37.0% 67.1%
Lake IL 78.5% 83.2% 6.0% 81.4%
Madison IL 78.7% 77.6% -1.4% 79.2%
McHenry IL 74.8% 79.0% 5.6% 77.3%
McLean IL * 89.6% * *
Sangamon IL 68.2% 80.0% 17.3% 76.5%
Will IL 64.4% 77.5% 20.3% 72.4%
Winnebago IL 73.4% 78.2% 6.5% 76.1%
Allen IN 53.3% 71.8% 34.6% 64.4%
Bartholomew IN 66.9% 86.6% 29.5% 77.2%
Boone IN 76.9% 78.1% 1.6% 79.0%
Elkhart IN 62.4% 69.5% 11.4% 66.6%
Hamilton IN 75.5% 79.7% 5.4% 77.6%
Hancock IN 74.0% 78.2% 5.6% 75.4%
Hendricks IN 71.0% 65.2% -8.1% 70.9%
Johnson IN 73.6% 80.3% 9.1% 78.1%
Seven-vaccine Series Vaccination Rates by County (continued)

( 23 )Early Childhood Vaccination Trends in America
Percent of Infants Born in Given Year and Fully Vaccinated with the Seven-Vaccine Series by Age 2 Years, 3 Months
County State Born 2010
Born 2013
Percent Change Between 2010 to 2013
Total Vaccination Rate for All Infants in Study
La Porte IN 41.5% 58.6% 41.2% 51.1%
Lake IN 63.9% 71.0% 11.0% 66.8%
Marion IN 72.3% 78.4% 8.4% 74.1%
Monroe IN * 79.3% * *
Porter IN 56.1% 75.1% 33.8% 69.3%
St Joseph IN 57.4% 68.2% 18.7% 63.0%
Tippecanoe IN 70.3% 85.3% 21.3% 77.0%
Vanderburgh IN 74.7% 85.7% 14.7% 81.2%
Johnson KS * 85.7% * *
Sedgwick KS 52.4% 75.5% 44.0% 69.1%
Shawnee KS * 87.2% * *
Boone KY 80.9% 91.5% 13.1% 84.7%
Fayette KY 82.3% 71.4% -13.2% 77.1%
Jefferson KY 76.9% 81.9% 6.5% 79.2%
Caddo LA 69.4% 69.3% -0.2% *
Calcasieu LA * 67.5% * *
East Baton Rouge LA 67.3% 83.3% 23.6% *
Jefferson LA 72.4% 78.7% 8.7% *
Lafayette LA 71.0% 82.4% 16.1% *
Saint Tammany LA 65.2% 82.1% 26.0% *
Bristol MA 71.2% 83.0% 16.6% 77.4%
Essex MA 53.2% 72.7% 36.5% 62.3%
Hampden MA 66.5% 75.4% 13.4% 70.4%
Middlesex MA 68.0% 77.6% 14.1% 72.5%
Norfolk MA 69.2% 79.3% 14.7% 76.1%
Plymouth MA 72.0% 77.1% 7.0% 76.9%
Suffolk MA 67.8% 62.8% -7.5% 68.0%
Worcester MA 70.0% 83.2% 18.8% 77.8%
Anne Arundel MD 79.7% 80.4% 0.8% 78.4%
Montgomery MD 68.9% 76.6% 11.0% 75.0%
Cumberland ME 75.4% 65.3% -13.4% 70.1%
York ME 76.5% 73.8% -3.5% 74.9%
Berrien MI 57.9% 80.4% 38.9% 70.6%
Calhoun MI 68.2% 78.5% 15.1% 75.0%
Genesee MI 57.2% 72.8% 27.2% 67.9%
Seven-vaccine Series Vaccination Rates by County (continued)

( 24 )Early Childhood Vaccination Trends in America
Percent of Infants Born in Given Year and Fully Vaccinated with the Seven-Vaccine Series by Age 2 Years, 3 Months
County State Born 2010
Born 2013
Percent Change Between 2010 to 2013
Total Vaccination Rate for All Infants in Study
Ingham MI 67.5% 75.3% 11.5% 65.7%
Kalamazoo MI 64.2% 81.7% 27.2% 75.6%
Kent MI * 86.2% * *
Livingston MI 59.5% 69.4% 16.7% 66.8%
Macomb MI 46.5% 70.5% 51.7% 60.3%
Monroe MI 54.8% 72.3% 31.9% 66.4%
Oakland MI 58.7% 74.0% 26.0% 68.9%
Ottawa MI 74.6% 87.6% 17.4% 80.0%
Saginaw MI * 70.9% * *
Washtenaw MI 64.3% 74.2% 15.4% 70.3%
Wayne MI 58.1% 68.3% 17.6% 63.9%
Anoka MN 81.0% 85.6% 5.6% 85.6%
Dakota MN 81.4% 87.6% 7.5% 84.9%
Hennepin MN 76.2% 84.0% 10.3% 82.2%
Ramsey MN 75.4% 80.7% 7.0% 79.4%
Saint Louis MN 72.2% 80.2% 11.1% 74.8%
Scott MN 70.5% 83.3% 18.1% 80.6%
Stearns MN 82.3% 85.2% 3.5% 84.4%
Washington MN 74.5% 86.5% 16.1% 81.2%
Wright MN 76.7% 80.1% 4.4% 80.8%
Clay MO * 78.0% * *
Greene MO 75.4% 77.3% 2.5% 77.1%
Jackson MO * 72.1% * *
Jasper MO 58.1% 69.4% 19.5% 65.7%
Jefferson MO 71.8% 76.5% 6.5% 78.3%
Platte MO * 73.2% * *
Saint Charles MO 82.2% 84.2% 2.5% 82.1%
Saint Louis MO 77.0% 83.9% 9.1% 80.9%
Guilford NC 81.8% 80.9% -1.1% 81.1%
Mecklenburg NC 72.0% 84.1% 16.8% 80.7%
Wake NC 76.2% 84.0% 10.3% 81.6%
Burleigh ND 84.8% 85.9% 1.4% 85.5%
Cass ND 86.2% 91.8% 6.5% 83.9%
Grand Forks ND 84.1% 88.7% 5.4% 87.1%
Ward ND 91.1% 85.1% -6.6% 88.2%
Seven-vaccine Series Vaccination Rates by County (continued)
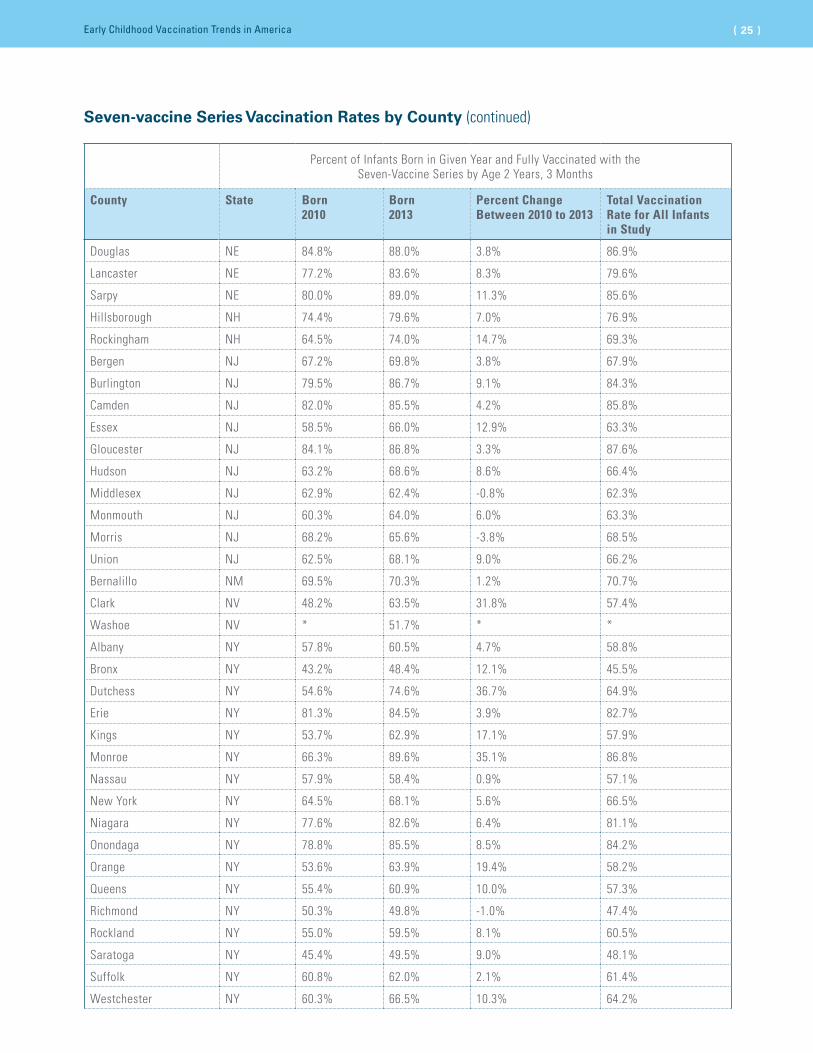
( 25 )Early Childhood Vaccination Trends in America
Percent of Infants Born in Given Year and Fully Vaccinated with the Seven-Vaccine Series by Age 2 Years, 3 Months
County State Born 2010
Born 2013
Percent Change Between 2010 to 2013
Total Vaccination Rate for All Infants in Study
Douglas NE 84.8% 88.0% 3.8% 86.9%
Lancaster NE 77.2% 83.6% 8.3% 79.6%
Sarpy NE 80.0% 89.0% 11.3% 85.6%
Hillsborough NH 74.4% 79.6% 7.0% 76.9%
Rockingham NH 64.5% 74.0% 14.7% 69.3%
Bergen NJ 67.2% 69.8% 3.8% 67.9%
Burlington NJ 79.5% 86.7% 9.1% 84.3%
Camden NJ 82.0% 85.5% 4.2% 85.8%
Essex NJ 58.5% 66.0% 12.9% 63.3%
Gloucester NJ 84.1% 86.8% 3.3% 87.6%
Hudson NJ 63.2% 68.6% 8.6% 66.4%
Middlesex NJ 62.9% 62.4% -0.8% 62.3%
Monmouth NJ 60.3% 64.0% 6.0% 63.3%
Morris NJ 68.2% 65.6% -3.8% 68.5%
Union NJ 62.5% 68.1% 9.0% 66.2%
Bernalillo NM 69.5% 70.3% 1.2% 70.7%
Clark NV 48.2% 63.5% 31.8% 57.4%
Washoe NV * 51.7% * *
Albany NY 57.8% 60.5% 4.7% 58.8%
Bronx NY 43.2% 48.4% 12.1% 45.5%
Dutchess NY 54.6% 74.6% 36.7% 64.9%
Erie NY 81.3% 84.5% 3.9% 82.7%
Kings NY 53.7% 62.9% 17.1% 57.9%
Monroe NY 66.3% 89.6% 35.1% 86.8%
Nassau NY 57.9% 58.4% 0.9% 57.1%
New York NY 64.5% 68.1% 5.6% 66.5%
Niagara NY 77.6% 82.6% 6.4% 81.1%
Onondaga NY 78.8% 85.5% 8.5% 84.2%
Orange NY 53.6% 63.9% 19.4% 58.2%
Queens NY 55.4% 60.9% 10.0% 57.3%
Richmond NY 50.3% 49.8% -1.0% 47.4%
Rockland NY 55.0% 59.5% 8.1% 60.5%
Saratoga NY 45.4% 49.5% 9.0% 48.1%
Suffolk NY 60.8% 62.0% 2.1% 61.4%
Westchester NY 60.3% 66.5% 10.3% 64.2%
Seven-vaccine Series Vaccination Rates by County (continued)

( 26 )Early Childhood Vaccination Trends in America
Percent of Infants Born in Given Year and Fully Vaccinated with the Seven-Vaccine Series by Age 2 Years, 3 Months
County State Born 2010
Born 2013
Percent Change Between 2010 to 2013
Total Vaccination Rate for All Infants in Study
Butler OH 69.9% 75.6% 8.1% 71.7%
Clermont OH 74.9% 78.3% 4.5% 75.6%
Cuyahoga OH 66.9% 77.4% 15.6% 72.5%
Delaware OH 78.2% 80.7% 3.2% 79.6%
Franklin OH 72.4% 77.8% 7.6% 76.9%
Greene OH 72.5% 76.6% 5.6% 74.0%
Hamilton OH 77.5% 77.5% 0.1% 78.3%
Lorain OH 68.0% 63.0% -7.3% 67.7%
Lucas OH 64.9% 76.0% 17.2% 71.0%
Mahoning OH 69.0% 65.0% -5.8% 64.8%
Medina OH 76.9% 74.8% -2.8% 71.5%
Miami OH 60.6% 73.5% 21.3% 69.9%
Montgomery OH 79.4% 79.5% 0.1% 78.9%
Stark OH 70.6% 68.9% -2.4% 68.3%
Summit OH 80.3% 78.2% -2.6% 78.9%
Trumbull OH 61.5% 65.0% 5.7% 61.4%
Warren OH 69.1% 75.2% 8.7% 73.9%
Cleveland OK 81.3% 88.4% 8.8% 83.0%
Oklahoma OK 77.3% 78.7% 1.8% 78.1%
Tulsa OK 72.1% 77.0% 6.9% 73.9%
Multnomah OR 70.2% 69.6% -1.0% 70.5%
Washington OR 70.4% 75.2% 6.8% 72.5%
Allegheny PA 84.0% 85.8% 2.1% 84.7%
Beaver PA 81.9% 84.6% 3.3% 83.4%
Berks PA 83.8% 85.8% 2.3% 84.7%
Blair PA 81.5% 88.7% 8.8% 86.7%
Bucks PA 81.4% 88.3% 8.5% 85.9%
Butler PA 79.5% 82.4% 3.7% 79.8%
Cambria PA 86.7% 90.2% 4.0% 86.3%
Centre PA 80.2% 84.9% 5.9% 85.2%
Chester PA 83.0% 85.0% 2.4% 83.9%
Cumberland PA 87.1% 89.6% 2.8% 87.4%
Dauphin PA 77.0% 86.4% 12.2% 83.9%
Delaware PA 83.0% 88.3% 6.3% 86.6%
Erie PA 78.8% 82.3% 4.4% 78.4%
Seven-vaccine Series Vaccination Rates by County (continued)

( 27 )Early Childhood Vaccination Trends in America
Percent of Infants Born in Given Year and Fully Vaccinated with the Seven-Vaccine Series by Age 2 Years, 3 Months
County State Born 2010
Born 2013
Percent Change Between 2010 to 2013
Total Vaccination Rate for All Infants in Study
Fayette PA 65.0% 73.4% 12.8% 68.9%
Franklin PA 78.4% 80.2% 2.3% 81.1%
Indiana PA 76.8% 81.7% 6.5% 80.7%
Lancaster PA 79.1% 83.8% 6.0% 81.6%
Lebanon PA 78.0% 82.6% 6.0% 81.3%
Lehigh PA 84.1% 85.5% 1.6% 84.8%
Montgomery PA 84.1% 86.5% 2.8% 85.5%
Northampton PA 80.0% 80.4% 0.5% 81.3%
Philadelphia PA 82.9% 86.2% 3.9% 84.9%
Schuylkill PA 86.3% 86.1% -0.2% 86.7%
Washington PA 84.0% 87.7% 4.4% 85.3%
Westmoreland PA 79.8% 86.6% 8.5% 82.2%
York PA 84.1% 87.1% 3.6% 86.5%
Kent RI 80.4% 83.7% 4.2% 83.9%
Providence RI 75.5% 81.1% 7.4% 79.0%
Washington RI 73.5% 82.1% 11.7% 77.3%
Berkeley SC 74.8% 79.8% 6.6% 78.6%
Charleston SC 70.9% 81.2% 14.5% 79.8%
Dorchester SC 84.1% 80.6% -4.2% 80.8%
Greenville SC 67.3% 85.0% 26.3% 77.2%
Horry SC 74.3% 80.6% 8.5% 77.3%
Lexington SC 78.0% 77.9% -0.2% 77.0%
Richland SC 80.2% 79.2% -1.2% 79.6%
Spartanburg SC 79.5% 82.0% 3.1% 80.7%
York SC 73.1% 76.4% 4.5% 74.4%
Davidson TN 77.3% 84.4% 9.3% 82.3%
Hamilton TN 63.0% 80.8% 28.3% 76.1%
Knox TN 67.8% 77.9% 15.0% 76.8%
Rutherford TN 76.7% 79.5% 3.6% 78.0%
Shelby TN 78.7% 81.8% 4.0% 79.3%
Sumner TN 81.7% 75.8% -7.2% 79.4%
Williamson TN 80.3% 83.5% 4.0% 81.7%
Bexar TX 81.2% 83.2% 2.4% 82.1%
Brazoria TX 81.8% 88.9% 8.7% 84.1%
Brazos TX 80.4% 88.2% 9.6% 83.4%
Seven-vaccine Series Vaccination Rates by County (continued)

( 28 )Early Childhood Vaccination Trends in America
Percent of Infants Born in Given Year and Fully Vaccinated with the Seven-Vaccine Series by Age 2 Years, 3 Months
County State Born 2010
Born 2013
Percent Change Between 2010 to 2013
Total Vaccination Rate for All Infants in Study
Collin TX 83.6% 83.4% -0.2% 84.0%
Dallas TX 80.4% 83.7% 4.1% 82.3%
Denton TX 80.1% 82.1% 2.6% 81.2%
El Paso TX 68.9% 78.7% 14.2% 73.9%
Fort Bend TX 80.7% 89.1% 10.4% 85.3%
Galveston TX 71.8% 81.0% 12.8% 80.5%
Harris TX 81.9% 85.6% 4.5% 84.4%
Hidalgo TX 65.3% 69.9% 7.1% 71.1%
Lubbock TX 85.8% 84.3% -1.7% 82.0%
Midland TX 76.1% 79.3% 4.2% 79.4%
Montgomery TX 84.8% 78.2% -7.7% 81.2%
Tarrant TX 79.3% 77.8% -1.9% 79.2%
Travis TX 71.1% 76.0% 6.8% 73.7%
Webb TX 53.1% 72.4% 36.4% 67.3%
Williamson TX 77.6% 76.2% -1.8% 77.6%
Davis UT 72.9% 79.4% 8.9% 73.0%
Salt Lake UT 71.5% 74.3% 3.9% 72.7%
Chesapeake City VA 68.7% 80.4% 17.1% 76.1%
Chesterfield VA 72.4% 77.5% 7.0% 75.6%
Fairfax VA 75.7% 79.6% 5.1% 77.1%
Hampton City VA 67.4% 73.8% 9.5% 72.0%
Hanover VA 79.1% 86.9% 10.0% 83.0%
Henrico VA 76.1% 82.1% 7.9% 80.3%
James City VA 76.4% 77.6% 1.6% 74.3%
Loudoun VA 71.9% 77.6% 7.9% 74.9%
Montgomery VA 66.1% 77.6% 17.5% 77.3%
Newport News City VA 63.9% 75.7% 18.4% 69.8%
Prince William VA 69.5% 75.7% 8.9% 74.4%
Richmond City VA 67.7% 72.4% 6.9% 72.2%
Spotsylvania VA 59.7% 66.2% 10.8% 63.6%
National 69.2% 77.2% 11.6% 73.5%
* Insufficient data
Seven-vaccine Series Vaccination Rates by County (continued)

( 29 )Early Childhood Vaccination Trends in America
Appendix E-4: Vaccination Rates by Vaccine and State
Percent of Infants in All Years in Study Fully Vaccinated with the Seven-Vaccine Series by Age 2 Years, 3 Months
State DTaP Hep B Hib MMR Polio Pneumococcal Varicella
AL 83.7% 86.6% 88.3% 90.6% 88.5% 83.2% 90.6%
AR 75.1% 84.0% 83.7% 85.8% 82.5% 75.2% 86.0%
AZ 80.4% 84.7% 83.8% 88.1% 84.5% 78.1% 87.5%
CA 79.5% 84.0% 88.7% 89.1% 84.8% 76.9% 88.1%
CO 83.4% 84.7% 85.1% 90.0% 86.6% 81.8% 88.0%
CT 86.1% 88.3% 87.4% 93.0% 89.0% 88.0% 92.2%
DE 85.8% 88.4% 91.6% 93.5% 89.7% 85.7% 93.0%
FL 79.0% 85.6% 84.1% 86.4% 83.5% 77.3% 87.3%
GA 86.8% 90.3% 87.6% 92.2% 90.1% 86.0% 92.6%
IA 79.1% 87.5% 82.9% 89.0% 85.2% 78.9% 88.1%
ID 80.1% 89.0% 84.4% 88.2% 87.1% 78.0% 86.9%
IL 81.9% 85.0% 87.4% 89.0% 86.0% 80.8% 87.9%
IN 78.9% 83.9% 78.7% 87.8% 84.7% 78.5% 87.1%
KS 74.1% 81.1% 79.5% 90.1% 79.3% 73.5% 89.1%
KY 87.6% 90.6% 85.9% 92.3% 91.3% 87.1% 91.7%
LA 52.4% 60.4% 59.1% 82.7% 57.3% 51.4% 82.1%
MA 74.7% 84.3% 83.9% 91.7% 82.3% 72.5% 90.3%
MD 86.9% 89.8% 89.6% 93.4% 90.6% 85.7% 92.5%
ME 87.0% 86.9% 84.2% 91.6% 89.4% 84.8% 90.7%
MI 71.8% 80.1% 78.2% 84.6% 77.8% 69.9% 84.0%
MN 84.1% 88.9% 90.8% 91.5% 88.8% 83.2% 89.7%
MO 79.2% 84.4% 82.3% 90.2% 83.0% 78.9% 89.3%
MS 77.2% 87.1% 80.7% 88.0% 85.2% 77.0% 88.2%
NC 86.9% 90.2% 89.6% 93.2% 90.9% 86.6% 92.9%
ND 85.7% 88.2% 92.1% 92.3% 91.6% 85.8% 91.4%
NE 82.1% 86.8% 89.6% 91.4% 87.9% 82.3% 90.6%
NH 83.0% 85.6% 85.8% 89.2% 85.6% 80.3% 88.3%
NJ 82.9% 88.7% 85.1% 89.2% 86.4% 81.5% 89.5%
NM 73.0% 84.5% 83.9% 88.4% 81.5% 71.1% 86.9%
NV 77.8% 85.9% 70.5% 87.9% 83.3% 75.6% 88.0%
NY 80.1% 85.8% 81.0% 87.4% 84.7% 71.9% 87.0%

( 30 )Early Childhood Vaccination Trends in America
Percent of Infants in All Years in Study Fully Vaccinated with the Seven-Vaccine Series by Age 2 Years, 3 Months
State DTaP Hep B Hib MMR Polio Pneumococcal Varicella
OH 82.6% 86.1% 83.3% 89.2% 87.0% 81.7% 88.0%
OK 79.3% 87.9% 86.1% 88.2% 85.3% 77.3% 88.4%
OR 83.9% 82.5% 86.0% 87.8% 85.7% 81.3% 85.6%
PA 88.0% 90.6% 93.5% 93.2% 91.7% 87.4% 92.9%
RI 87.6% 95.3% 90.5% 94.4% 90.6% 87.0% 94.5%
SC 82.2% 89.6% 86.0% 91.4% 87.0% 82.0% 91.2%
TN 82.2% 88.7% 88.3% 89.6% 87.4% 82.2% 89.6%
TX 83.6% 88.1% 90.1% 92.1% 87.8% 82.9% 91.7%
UT 78.0% 87.3% 82.7% 89.3% 85.5% 76.1% 88.3%
VA 86.3% 88.4% 85.6% 91.8% 89.9% 84.9% 91.5%
VT 86.6% 90.3% 95.9% 94.6% 87.3% 86.2% 90.9%
WA 83.9% 87.8% 89.8% 92.2% 87.7% 81.7% 90.4%
WI 80.0% 83.5% 81.9% 87.3% 83.0% 78.8% 85.8%
WV 81.0% 87.1% 87.9% 89.0% 85.6% 79.1% 89.5%
National 80.1% 85.6% 84.4% 89.3% 85.1% 78.8% 88.6%
Vaccination Rates by Vaccine and State (continued)

( 31 )Early Childhood Vaccination Trends in America
Appendix E-5: Vaccination Rates by Vaccine and MSA
Percent of Infants in All Years in Study Fully Vaccinated with the Seven-Vaccine Series by Age 2 Years, 3 Months
MSA DTaP Hep B Hib MMR Polio Pneumococcal Varicella
AKRON, OH 89.2% 90.8% 87.9% 94.0% 92.1% 88.6% 92.3%
ALBANY-SCHENECTADY-TROY, NY 88.0% 91.8% 85.3% 93.9% 91.9% 61.5% 92.1%
ALBUQUERQUE, NM 76.4% 85.7% 85.6% 89.8% 83.8% 75.4% 89.1%
ALLENTOWN-BETHLEHEM-EASTON, PA
87.4% 89.8% 93.7% 94.0% 92.0% 86.3% 93.5%
ALTOONA, PA 89.7% 93.4% 94.2% 94.4% 93.6% 89.4% 92.7%
ANN ARBOR, MI 74.6% 81.3% 80.8% 86.2% 80.2% 71.7% 84.9%
APPLETON-OSHKOSH-NEENAH, WI 85.2% 88.1% 89.1% 90.3% 89.3% 84.5% 89.3%
ATLANTA, GA 87.0% 90.3% 87.9% 91.8% 90.2% 86.0% 92.3%
AUGUSTA-AIKEN, GA-SC 83.6% 89.7% 88.2% 92.7% 89.2% 86.0% 93.4%
AUSTIN-SAN MARCOS, TX 83.9% 84.1% 88.9% 90.3% 85.7% 81.6% 89.6%
BALTIMORE, MD 89.2% 90.4% 91.5% 94.4% 92.5% 86.7% 93.5%
BATON ROUGE, LA 53.8% 62.9% 61.7% 87.4% 58.7% 54.3% 87.0%
BEAUMONT-PORT ARTHUR, TX 77.5% 84.6% 85.2% 90.3% 82.4% 78.4% 90.4%
BENTON HARBOR, MI 74.6% 83.4% 79.3% 86.9% 80.3% 73.1% 86.4%
BERGEN-PASSAIC, NJ 82.3% 87.6% 82.2% 88.0% 84.6% 81.6% 88.0%
BIRMINGHAM, AL 82.6% 83.4% 87.5% 89.6% 86.8% 82.3% 89.5%
BISMARCK, ND 86.8% 90.0% 93.1% 92.3% 92.5% 86.6% 91.5%
BLOOMINGTON, IN 87.4% 90.8% 69.1% 90.4% 89.4% 87.0% 90.4%
BLOOMINGTON-NORMAL, IL 88.1% 85.1% 90.1% 92.1% 91.5% 88.3% 91.6%
BOISE CITY, ID 83.6% 89.4% 88.4% 91.5% 88.4% 81.2% 88.9%
BOSTON-CAMBRIDGE-QUINCY, MA* 73.0% 83.3% 82.5% 91.0% 81.1% 69.9% 89.3%
BRAZORIA, TX 86.3% 90.6% 91.7% 94.1% 89.6% 85.4% 94.0%
BRYAN-COLLEGE STATION, TX 84.5% 89.4% 93.4% 92.9% 88.2% 84.6% 92.9%
BUFFALO-NIAGARA FALLS, NY 89.5% 93.2% 94.5% 93.7% 93.2% * 93.1%
CANTON-MASSILLON, OH 81.0% 85.5% 81.9% 86.5% 85.7% 80.9% 85.1%
CHARLESTON, WV 84.4% 88.8% 91.9% 91.2% 88.0% 84.3% 91.9%
CHARLESTON-NORTH CHARLESTON, SC
83.7% 91.4% 86.8% 91.8% 88.3% 83.9% 91.6%
CHARLOTTE-GASTONIA-ROCK HILL, NC-SC
86.5% 90.5% 88.2% 92.8% 90.8% 85.9% 92.4%
CHARLOTTESVILLE, VA 79.7% 79.4% 82.7% 85.7% 81.0% 81.2% 83.3%
CHATTANOOGA, TN-GA 79.9% 84.0% 85.5% 88.4% 84.6% 79.1% 87.1%
CHICAGO, IL 82.9% 85.8% 88.2% 89.5% 86.6% 81.7% 88.4%
CINCINNATI, OH-KY-IN 87.6% 88.7% 88.1% 92.1% 91.1% 87.3% 91.4%
* The Boston-Cambridge-Quincy MSA includes the counties of Middlesex, Essex, Suffolk, Norfolk and Plymouth, Massachusetts.
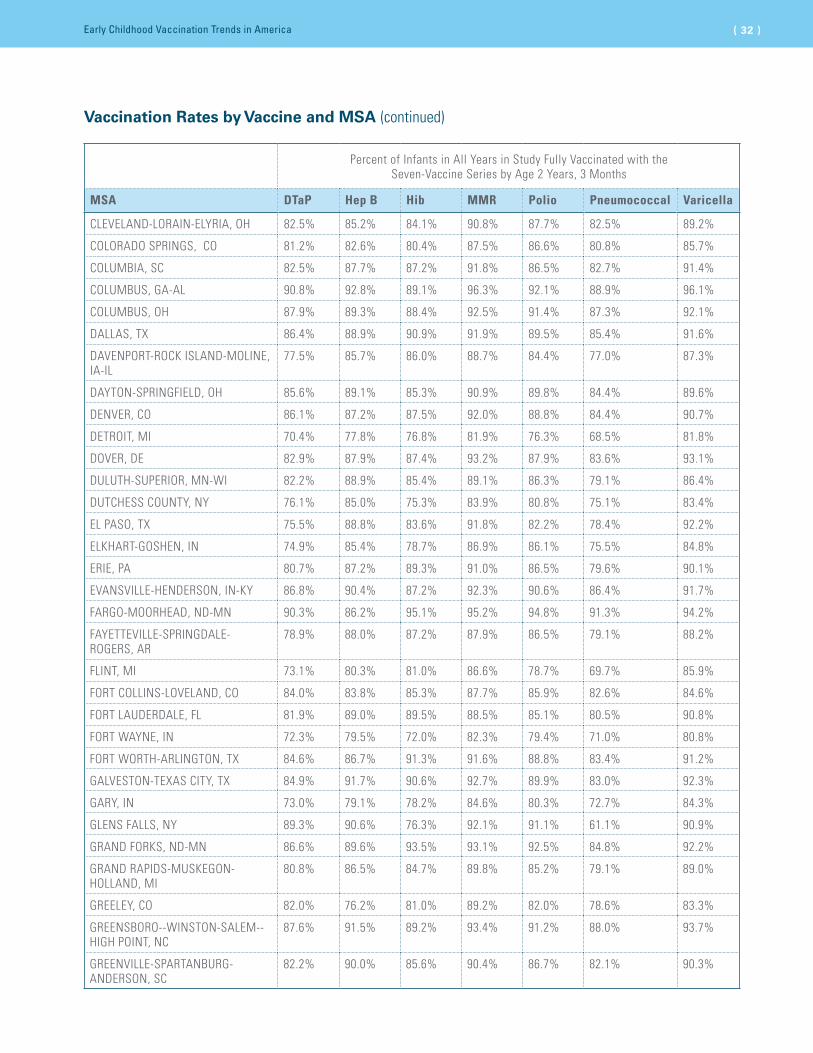
( 32 )Early Childhood Vaccination Trends in America
Percent of Infants in All Years in Study Fully Vaccinated with the Seven-Vaccine Series by Age 2 Years, 3 Months
MSA DTaP Hep B Hib MMR Polio Pneumococcal Varicella
CLEVELAND-LORAIN-ELYRIA, OH 82.5% 85.2% 84.1% 90.8% 87.7% 82.5% 89.2%
COLORADO SPRINGS, CO 81.2% 82.6% 80.4% 87.5% 86.6% 80.8% 85.7%
COLUMBIA, SC 82.5% 87.7% 87.2% 91.8% 86.5% 82.7% 91.4%
COLUMBUS, GA-AL 90.8% 92.8% 89.1% 96.3% 92.1% 88.9% 96.1%
COLUMBUS, OH 87.9% 89.3% 88.4% 92.5% 91.4% 87.3% 92.1%
DALLAS, TX 86.4% 88.9% 90.9% 91.9% 89.5% 85.4% 91.6%
DAVENPORT-ROCK ISLAND-MOLINE, IA-IL
77.5% 85.7% 86.0% 88.7% 84.4% 77.0% 87.3%
DAYTON-SPRINGFIELD, OH 85.6% 89.1% 85.3% 90.9% 89.8% 84.4% 89.6%
DENVER, CO 86.1% 87.2% 87.5% 92.0% 88.8% 84.4% 90.7%
DETROIT, MI 70.4% 77.8% 76.8% 81.9% 76.3% 68.5% 81.8%
DOVER, DE 82.9% 87.9% 87.4% 93.2% 87.9% 83.6% 93.1%
DULUTH-SUPERIOR, MN-WI 82.2% 88.9% 85.4% 89.1% 86.3% 79.1% 86.4%
DUTCHESS COUNTY, NY 76.1% 85.0% 75.3% 83.9% 80.8% 75.1% 83.4%
EL PASO, TX 75.5% 88.8% 83.6% 91.8% 82.2% 78.4% 92.2%
ELKHART-GOSHEN, IN 74.9% 85.4% 78.7% 86.9% 86.1% 75.5% 84.8%
ERIE, PA 80.7% 87.2% 89.3% 91.0% 86.5% 79.6% 90.1%
EVANSVILLE-HENDERSON, IN-KY 86.8% 90.4% 87.2% 92.3% 90.6% 86.4% 91.7%
FARGO-MOORHEAD, ND-MN 90.3% 86.2% 95.1% 95.2% 94.8% 91.3% 94.2%
FAYETTEVILLE-SPRINGDALE-ROGERS, AR
78.9% 88.0% 87.2% 87.9% 86.5% 79.1% 88.2%
FLINT, MI 73.1% 80.3% 81.0% 86.6% 78.7% 69.7% 85.9%
FORT COLLINS-LOVELAND, CO 84.0% 83.8% 85.3% 87.7% 85.9% 82.6% 84.6%
FORT LAUDERDALE, FL 81.9% 89.0% 89.5% 88.5% 85.1% 80.5% 90.8%
FORT WAYNE, IN 72.3% 79.5% 72.0% 82.3% 79.4% 71.0% 80.8%
FORT WORTH-ARLINGTON, TX 84.6% 86.7% 91.3% 91.6% 88.8% 83.4% 91.2%
GALVESTON-TEXAS CITY, TX 84.9% 91.7% 90.6% 92.7% 89.9% 83.0% 92.3%
GARY, IN 73.0% 79.1% 78.2% 84.6% 80.3% 72.7% 84.3%
GLENS FALLS, NY 89.3% 90.6% 76.3% 92.1% 91.1% 61.1% 90.9%
GRAND FORKS, ND-MN 86.6% 89.6% 93.5% 93.1% 92.5% 84.8% 92.2%
GRAND RAPIDS-MUSKEGON-HOLLAND, MI
80.8% 86.5% 84.7% 89.8% 85.2% 79.1% 89.0%
GREELEY, CO 82.0% 76.2% 81.0% 89.2% 82.0% 78.6% 83.3%
GREENSBORO--WINSTON-SALEM--HIGH POINT, NC
87.6% 91.5% 89.2% 93.4% 91.2% 88.0% 93.7%
GREENVILLE-SPARTANBURG-ANDERSON, SC
82.2% 90.0% 85.6% 90.4% 86.7% 82.1% 90.3%
Vaccination Rates by Vaccine and MSA (continued)
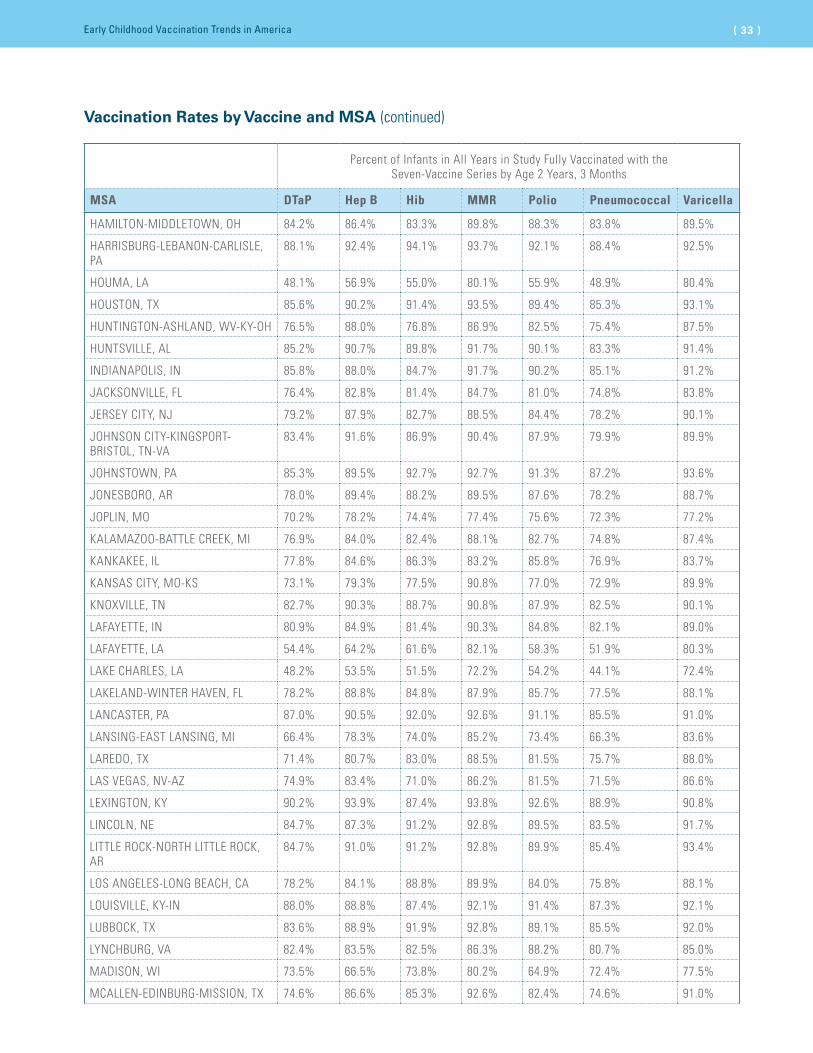
( 33 )Early Childhood Vaccination Trends in America
Percent of Infants in All Years in Study Fully Vaccinated with the Seven-Vaccine Series by Age 2 Years, 3 Months
MSA DTaP Hep B Hib MMR Polio Pneumococcal Varicella
HAMILTON-MIDDLETOWN, OH 84.2% 86.4% 83.3% 89.8% 88.3% 83.8% 89.5%
HARRISBURG-LEBANON-CARLISLE, PA
88.1% 92.4% 94.1% 93.7% 92.1% 88.4% 92.5%
HOUMA, LA 48.1% 56.9% 55.0% 80.1% 55.9% 48.9% 80.4%
HOUSTON, TX 85.6% 90.2% 91.4% 93.5% 89.4% 85.3% 93.1%
HUNTINGTON-ASHLAND, WV-KY-OH 76.5% 88.0% 76.8% 86.9% 82.5% 75.4% 87.5%
HUNTSVILLE, AL 85.2% 90.7% 89.8% 91.7% 90.1% 83.3% 91.4%
INDIANAPOLIS, IN 85.8% 88.0% 84.7% 91.7% 90.2% 85.1% 91.2%
JACKSONVILLE, FL 76.4% 82.8% 81.4% 84.7% 81.0% 74.8% 83.8%
JERSEY CITY, NJ 79.2% 87.9% 82.7% 88.5% 84.4% 78.2% 90.1%
JOHNSON CITY-KINGSPORT-BRISTOL, TN-VA
83.4% 91.6% 86.9% 90.4% 87.9% 79.9% 89.9%
JOHNSTOWN, PA 85.3% 89.5% 92.7% 92.7% 91.3% 87.2% 93.6%
JONESBORO, AR 78.0% 89.4% 88.2% 89.5% 87.6% 78.2% 88.7%
JOPLIN, MO 70.2% 78.2% 74.4% 77.4% 75.6% 72.3% 77.2%
KALAMAZOO-BATTLE CREEK, MI 76.9% 84.0% 82.4% 88.1% 82.7% 74.8% 87.4%
KANKAKEE, IL 77.8% 84.6% 86.3% 83.2% 85.8% 76.9% 83.7%
KANSAS CITY, MO-KS 73.1% 79.3% 77.5% 90.8% 77.0% 72.9% 89.9%
KNOXVILLE, TN 82.7% 90.3% 88.7% 90.8% 87.9% 82.5% 90.1%
LAFAYETTE, IN 80.9% 84.9% 81.4% 90.3% 84.8% 82.1% 89.0%
LAFAYETTE, LA 54.4% 64.2% 61.6% 82.1% 58.3% 51.9% 80.3%
LAKE CHARLES, LA 48.2% 53.5% 51.5% 72.2% 54.2% 44.1% 72.4%
LAKELAND-WINTER HAVEN, FL 78.2% 88.8% 84.8% 87.9% 85.7% 77.5% 88.1%
LANCASTER, PA 87.0% 90.5% 92.0% 92.6% 91.1% 85.5% 91.0%
LANSING-EAST LANSING, MI 66.4% 78.3% 74.0% 85.2% 73.4% 66.3% 83.6%
LAREDO, TX 71.4% 80.7% 83.0% 88.5% 81.5% 75.7% 88.0%
LAS VEGAS, NV-AZ 74.9% 83.4% 71.0% 86.2% 81.5% 71.5% 86.6%
LEXINGTON, KY 90.2% 93.9% 87.4% 93.8% 92.6% 88.9% 90.8%
LINCOLN, NE 84.7% 87.3% 91.2% 92.8% 89.5% 83.5% 91.7%
LITTLE ROCK-NORTH LITTLE ROCK, AR
84.7% 91.0% 91.2% 92.8% 89.9% 85.4% 93.4%
LOS ANGELES-LONG BEACH, CA 78.2% 84.1% 88.8% 89.9% 84.0% 75.8% 88.1%
LOUISVILLE, KY-IN 88.0% 88.8% 87.4% 92.1% 91.4% 87.3% 92.1%
LUBBOCK, TX 83.6% 88.9% 91.9% 92.8% 89.1% 85.5% 92.0%
LYNCHBURG, VA 82.4% 83.5% 82.5% 86.3% 88.2% 80.7% 85.0%
MADISON, WI 73.5% 66.5% 73.8% 80.2% 64.9% 72.4% 77.5%
MCALLEN-EDINBURG-MISSION, TX 74.6% 86.6% 85.3% 92.6% 82.4% 74.6% 91.0%
Vaccination Rates by Vaccine and MSA (continued)

( 34 )Early Childhood Vaccination Trends in America
Percent of Infants in All Years in Study Fully Vaccinated with the Seven-Vaccine Series by Age 2 Years, 3 Months
MSA DTaP Hep B Hib MMR Polio Pneumococcal Varicella
MEMPHIS, TN-AR-MS 79.9% 89.9% 88.4% 88.7% 87.2% 81.0% 89.8%
MIAMI, FL 78.0% 88.1% 83.1% 85.8% 82.9% 76.3% 88.4%
MIDDLESEX-SOMERSET-HUNTERDON, N
80.8% 89.2% 81.9% 88.8% 85.4% 79.8% 89.5%
MILWAUKEE-WAUKESHA, WI 81.6% 84.9% 83.5% 88.2% 85.4% 80.9% 86.5%
MINNEAPOLIS-ST. PAUL, MN-WI 85.1% 90.0% 91.4% 92.0% 89.0% 84.0% 90.4%
MONMOUTH-OCEAN, NJ 80.0% 88.6% 82.8% 85.5% 83.7% 79.2% 85.3%
MYRTLE BEACH, SC 80.7% 88.0% 86.6% 90.5% 86.6% 79.8% 90.0%
NASHVILLE, TN 84.6% 89.1% 89.2% 90.2% 88.6% 85.1% 90.6%
NASSAU-SUFFOLK, NY 77.5% 84.8% 76.9% 83.6% 82.4% 75.1% 84.5%
NEW ORLEANS, LA 55.9% 59.1% 62.8% 85.0% 59.3% 53.8% 83.6%
NEW YORK-NEWARK, NY-NJ-PA 74.4% 80.9% 74.5% 84.2% 79.7% 71.3% 83.6%
NEWARK, NJ 80.2% 86.3% 81.8% 87.5% 83.9% 77.1% 87.5%
NEWBURGH, NY-PA 74.8% 81.5% 71.6% 84.0% 79.7% 74.2% 83.7%
NORFOLK-VIRGINIA BEACH-NEWPORT NEWS, VA-NC
87.0% 88.3% 85.3% 92.9% 90.8% 85.6% 92.4%
OAKLAND, CA 83.4% 87.3% 90.4% 91.3% 88.1% 81.9% 90.7%
ODESSA-MIDLAND, TX 78.5% 86.7% 87.4% 89.6% 83.9% 79.1% 89.1%
OKLAHOMA CITY, OK 83.2% 89.6% 88.5% 89.5% 87.9% 81.6% 89.8%
OMAHA, NE-IA 86.3% 89.8% 92.8% 93.7% 91.1% 86.0% 93.0%
ORANGE COUNTY, CA 82.6% 83.9% 91.2% 89.4% 87.2% 77.8% 89.3%
ORLANDO, FL 77.9% 83.3% 83.1% 85.9% 83.1% 76.6% 86.5%
PEORIA-PEKIN, IL 76.6% 68.9% 80.8% 85.1% 82.3% 76.2% 83.0%
PHILADELPHIA, PA-NJ 89.4% 90.8% 95.0% 94.6% 92.6% 88.5% 94.5%
PHOENIX-MESA, AZ 81.0% 84.8% 84.8% 88.3% 84.9% 79.3% 87.8%
PITTSBURGH, PA 87.9% 90.3% 92.4% 91.0% 90.7% 87.5% 91.3%
PORTLAND-VANCOUVER,OR-WA 84.4% 81.8% 86.5% 87.8% 86.0% 82.0% 86.0%
RALEIGH-DURHAM-CHAPEL HILL, NC 87.4% 90.7% 90.0% 94.1% 91.5% 87.7% 93.8%
READING, PA 89.8% 93.7% 93.8% 94.5% 93.1% 88.5% 93.9%
RENO, NV 82.1% 89.5% 67.5% 89.7% 86.5% 82.5% 89.1%
RICHLAND-KENNEWICK-PASCO, WA 80.6% 86.8% 84.8% 92.6% 85.6% 77.0% 90.6%
RICHMOND-PETERSBURG, VA 88.0% 90.4% 88.2% 92.8% 90.2% 86.4% 93.2%
RIVERSIDE-SAN BERNADINO, CA 72.3% 81.6% 83.6% 86.0% 79.6% 70.8% 85.1%
ROANOKE, VA 88.8% 86.3% 88.6% 92.4% 91.6% 87.4% 91.9%
ROCHESTER, NY 91.1% 94.0% 96.0% 95.5% 93.9% 86.1% 94.6%
ROCKFORD, IL 79.8% 85.3% 85.5% 87.4% 85.3% 78.3% 87.4%
SAGINAW-BAY CITY-MIDLAND, MI 65.6% 77.5% 74.8% 83.2% 72.6% 63.0% 82.7%
Vaccination Rates by Vaccine and MSA (continued)

( 35 )Early Childhood Vaccination Trends in America
Percent of Infants in All Years in Study Fully Vaccinated with the Seven-Vaccine Series by Age 2 Years, 3 Months
MSA DTaP Hep B Hib MMR Polio Pneumococcal Varicella
SALT LAKE CITY-OGDEN, UT 78.9% 87.8% 82.2% 90.1% 85.8% 77.4% 89.2%
SAN ANTONIO, TX 84.6% 90.0% 91.2% 93.9% 89.0% 83.4% 93.2%
SAN DIEGO, CA 81.4% 82.6% 88.6% 89.4% 84.1% 78.4% 88.6%
SAN FRANCISCO, CA 84.4% 83.8% 91.7% 89.2% 88.7% 83.2% 89.0%
SCRANTON-WILKES-BARRE-HAZLETON, PA
83.1% 87.6% 88.9% 90.5% 88.3% 82.7% 90.4%
SEATTLE-BELLEVUE-EVERETT, WA 86.1% 89.2% 91.5% 93.4% 89.3% 84.1% 91.8%
SHARON, PA 85.4% 88.9% 91.0% 90.4% 89.7% 84.8% 89.0%
SHREVEPORT-BOSSIER CITY, LA 50.3% 59.4% 52.7% 78.9% 55.5% 50.6% 79.2%
SIOUX FALLS, SD 76.4% 89.5% 70.3% 83.5% 89.4% 89.5% 82.4%
SOUTH BEND, IN 76.0% 87.0% 77.0% 87.2% 84.6% 78.5% 86.4%
SPOKANE, WA 79.5% 85.8% 85.7% 88.9% 83.9% 76.3% 84.8%
SPRINGFIELD, IL 83.5% 83.4% 90.7% 90.1% 89.9% 83.8% 90.7%
SPRINGFIELD, MO 82.6% 87.1% 85.4% 89.9% 85.4% 82.0% 89.3%
ST. CLOUD, MN 84.6% 89.0% 91.2% 90.6% 89.6% 85.3% 87.3%
ST. LOUIS, MO-IL 87.5% 90.3% 89.3% 92.7% 91.0% 87.4% 91.8%
STATE COLLEGE, PA 85.0% 91.2% 94.0% 94.2% 91.5% 90.6% 93.8%
SYRACUSE, NY 89.3% 92.1% 94.1% 95.0% 94.1% 87.5% 94.7%
TACOMA, WA 79.1% 84.7% 85.9% 89.3% 84.5% 77.8% 86.9%
TAMPA-ST. PETERSBURG-CLEARWATER, FL
84.8% 89.8% 87.9% 90.9% 88.4% 84.0% 91.6%
TOLEDO, OH 78.2% 84.9% 79.4% 85.5% 83.7% 79.1% 84.9%
TOPEKA, KS 72.6% 76.3% 75.8% 89.3% 76.9% 69.6% 88.6%
TULSA, OK 80.5% 89.4% 86.9% 89.2% 86.3% 76.4% 89.3%
WASHINGTON, DC-MD-VA-WV 85.4% 88.7% 85.4% 91.9% 89.9% 84.3% 91.3%
WEST PALM BEACH-BOCA RATON, FL
80.9% 86.9% 84.2% 88.5% 85.2% 79.1% 88.2%
WICHITA, KS 72.4% 82.7% 77.4% 86.1% 79.1% 72.6% 85.6%
WILMINGTON-NEWARK, DE-MD 85.9% 87.9% 92.4% 93.2% 89.6% 85.5% 92.6%
YORK, PA 89.2% 92.1% 93.8% 94.0% 93.3% 89.1% 93.7%
YOUNGSTOWN-WARREN, OH 74.9% 80.5% 77.7% 82.6% 79.8% 73.9% 80.6%
National 80.1% 85.6% 84.4% 89.3% 85.1% 78.8% 88.6%
Vaccination Rates by Vaccine and MSA (continued)

( 36 )Early Childhood Vaccination Trends in America
Appendix E-6: Vaccination Rates by Vaccine and County
Percent of Infants in All Years in Study Fully Vaccinated with the Seven-Vaccine Series by Age 2 Years, 3 Months
County State DTaP Hep B Hib MMR Polio Pneumococcal Varicella
Jefferson AL 81.8% 82.4% 86.5% 88.6% 85.9% 81.9% 88.5%
Madison AL 86.4% 91.9% 91.2% 93.2% 91.6% 84.4% 92.6%
Benton AR 78.9% 88.1% 86.1% 88.1% 86.0% 78.2% 87.9%
Craighead AR 78.0% 89.4% 88.2% 89.5% 87.6% 78.2% 88.7%
Faulkner AR 84.1% 92.2% 90.5% 91.3% 91.5% 85.1% 90.9%
Pulaski AR 86.2% 90.7% 91.7% 93.2% 90.2% 86.2% 94.4%
Washington AR 78.8% 88.0% 89.5% 87.4% 87.5% 80.7% 88.9%
Maricopa AZ 81.6% 85.0% 85.2% 88.7% 85.3% 79.7% 88.1%
Los Angeles CA 80.2% 84.8% 89.9% 90.3% 85.0% 77.0% 88.2%
Orange CA 82.6% 83.9% 91.2% 89.4% 87.2% 77.8% 89.3%
Riverside CA 70.7% 79.7% 82.8% 85.3% 78.8% 69.7% 84.9%
San Diego CA 81.4% 82.6% 88.6% 89.4% 84.1% 78.4% 88.6%
Santa Clara CA 83.9% 84.4% 91.1% 88.3% 88.4% 82.9% 88.7%
Adams CO 82.7% 88.3% 85.6% 91.5% 87.7% 82.1% 90.6%
Arapahoe CO 86.9% 89.0% 88.4% 92.6% 90.4% 87.2% 92.0%
Boulder CO 82.0% 76.2% 81.0% 89.2% 82.0% 78.6% 83.3%
Denver CO 88.2% 85.7% 89.2% 93.1% 89.8% 87.0% 91.9%
Douglas CO 87.3% 87.5% 88.5% 91.3% 89.4% 85.2% 90.7%
El Paso CO 81.2% 82.6% 80.4% 87.5% 86.6% 80.8% 85.7%
Jefferson CO 87.3% 85.5% 86.7% 92.3% 86.8% 83.7% 89.5%
Larimer CO 84.0% 83.8% 85.3% 87.7% 85.9% 82.6% 84.6%
Weld CO 83.0% 87.6% 85.8% 91.4% 88.5% 80.0% 89.4%
Fairfield CT 85.6% 88.8% 86.2% 91.6% 88.6% 84.6% 90.2%
Hartford CT 86.3% 89.4% 88.0% 93.9% 89.8% 89.4% 93.7%
New Haven CT 88.0% 88.3% 89.2% 93.4% 90.4% 89.2% 92.1%
New London CT 88.5% 91.4% 90.0% 95.1% 91.1% 88.7% 94.2%
Kent DE 82.9% 87.9% 87.4% 93.2% 87.9% 83.6% 93.1%
New Castle DE 86.0% 87.7% 92.3% 93.3% 89.6% 85.6% 92.5%
Sussex DE 88.3% 91.8% 93.8% 94.8% 92.2% 88.5% 94.9%
Broward FL 81.9% 89.0% 89.5% 88.5% 85.1% 80.5% 90.8%
Duval FL 71.6% 79.5% 77.0% 82.5% 76.9% 71.3% 81.5%
Hillsborough FL 86.3% 90.2% 89.9% 92.7% 89.5% 84.9% 93.0%
Miami-Dade FL 78.0% 88.1% 83.1% 85.8% 82.9% 76.3% 88.4%
Orange FL 76.2% 80.6% 80.0% 84.6% 80.8% 74.3% 85.4%
Palm Beach FL 80.9% 86.9% 84.2% 88.5% 85.2% 79.1% 88.2%

( 37 )Early Childhood Vaccination Trends in America
Percent of Infants in All Years in Study Fully Vaccinated with the Seven-Vaccine Series by Age 2 Years, 3 Months
County State DTaP Hep B Hib MMR Polio Pneumococcal Varicella
Polk FL 78.2% 88.8% 84.8% 87.9% 85.7% 77.5% 88.1%
Cherokee GA 85.0% 87.4% 84.9% 88.1% 88.3% 84.2% 88.7%
Cobb GA 88.0% 90.0% 89.1% 93.2% 90.9% 88.1% 93.1%
DeKalb GA 88.0% 89.8% 89.1% 93.1% 90.9% 86.1% 94.1%
Forsyth GA 90.9% 92.4% 92.3% 92.0% 93.5% 90.2% 93.3%
Fulton GA 88.4% 90.8% 89.6% 92.5% 90.5% 86.8% 92.8%
Gwinnett GA 87.4% 91.9% 89.7% 92.6% 90.7% 87.3% 93.3%
Muscogee GA 90.6% 92.9% 88.9% 96.1% 92.2% 88.9% 95.8%
Ada ID 84.5% 89.2% 88.8% 92.0% 88.7% 83.1% 89.2%
Canyon ID 80.9% 90.0% 87.4% 89.8% 87.6% 75.7% 88.0%
Cook IL 81.7% 84.1% 87.9% 89.2% 85.3% 81.0% 88.0%
DeKalb IL 78.7% 82.1% 83.8% 85.2% 84.0% 73.8% 81.2%
DuPage IL 86.6% 88.2% 91.0% 91.3% 89.9% 84.9% 90.3%
Grundy IL 76.4% 85.0% 81.5% 86.8% 81.6% 74.2% 85.9%
Kane IL 82.0% 86.6% 84.5% 89.0% 86.3% 80.8% 87.6%
Kankakee IL 77.8% 84.6% 86.3% 83.2% 85.8% 76.9% 83.7%
Kendall IL 82.7% 85.9% 87.2% 88.1% 86.7% 80.8% 87.3%
La Salle IL 72.3% 82.3% 82.7% 83.7% 80.1% 69.0% 82.5%
Lake IL 88.3% 88.7% 92.8% 92.1% 90.1% 86.7% 90.9%
Madison IL 83.3% 87.1% 89.8% 92.4% 90.0% 84.6% 91.9%
McHenry IL 84.7% 89.3% 88.6% 89.8% 88.1% 82.1% 88.9%
McLean IL 88.1% 85.1% 90.1% 92.1% 91.5% 88.3% 91.6%
Sangamon IL 83.5% 83.4% 90.7% 90.1% 89.9% 83.8% 90.7%
Will IL 80.1% 86.4% 85.8% 88.4% 85.7% 79.0% 87.4%
Winnebago IL 81.5% 86.2% 86.8% 88.5% 86.5% 81.0% 88.4%
Allen IN 72.8% 79.7% 73.0% 82.9% 80.0% 71.0% 81.1%
Bartholomew IN 86.9% 89.1% 86.4% 92.2% 92.2% 85.8% 91.7%
Boone IN 89.1% 89.7% 88.8% 93.5% 93.4% 89.1% 92.9%
Elkhart IN 74.9% 85.4% 78.7% 86.9% 86.1% 75.5% 84.8%
Hamilton IN 87.4% 89.3% 88.1% 92.0% 91.7% 86.9% 90.9%
Hancock IN 85.3% 86.8% 84.7% 92.3% 87.5% 84.9% 93.3%
Hendricks IN 88.8% 89.4% 79.8% 93.4% 91.9% 86.6% 92.8%
Johnson IN 87.1% 90.6% 87.3% 93.7% 92.2% 85.7% 93.3%
La Porte IN 64.9% 72.6% 66.8% 82.9% 72.8% 64.4% 80.3%
Lake IN 72.7% 79.1% 79.3% 84.7% 81.0% 72.6% 84.5%
Marion IN 84.9% 86.8% 85.3% 91.4% 89.4% 84.5% 91.3%
Vaccination Rates by Vaccine and County (continued)

( 38 )Early Childhood Vaccination Trends in America
Percent of Infants in All Years in Study Fully Vaccinated with the Seven-Vaccine Series by Age 2 Years, 3 Months
County State DTaP Hep B Hib MMR Polio Pneumococcal Varicella
Monroe IN 87.4% 90.8% 69.1% 90.4% 89.4% 87.0% 90.4%
Porter IN 73.5% 79.0% 76.1% 84.6% 79.0% 72.9% 84.1%
St Joseph IN 76.0% 87.0% 77.0% 87.2% 84.6% 78.5% 86.4%
Tippecanoe IN 84.0% 87.1% 84.6% 91.8% 87.9% 85.3% 90.5%
Vanderburgh IN 87.4% 90.6% 88.0% 92.6% 91.1% 86.9% 92.2%
Johnson KS 77.3% 81.5% 81.2% 93.3% 80.7% 77.4% 92.7%
Sedgwick KS 73.0% 82.6% 77.4% 85.7% 78.9% 73.0% 85.8%
Shawnee KS 72.6% 76.3% 75.8% 89.3% 76.9% 69.6% 88.6%
Boone KY 91.3% 92.2% 91.9% 92.9% 94.3% 90.5% 93.4%
Fayette KY 89.9% 94.0% 87.2% 94.4% 92.3% 89.2% 91.1%
Jefferson KY 88.3% 88.3% 88.2% 92.6% 91.4% 87.1% 92.1%
Caddo LA 49.3% 58.6% 51.0% 79.4% 53.8% 49.8% 80.2%
Calcasieu LA 48.2% 53.5% 51.5% 72.2% 54.2% 44.1% 72.4%
East Baton Rouge LA 50.1% 59.6% 58.1% 86.7% 55.5% 51.2% 85.4%
Jefferson LA 54.4% 54.6% 61.2% 85.3% 57.7% 52.0% 84.4%
Lafayette LA 55.9% 64.5% 62.9% 83.0% 58.8% 53.4% 81.5%
Saint Tammany LA 59.8% 63.4% 64.8% 83.3% 63.7% 58.4% 82.1%
Bristol MA 83.4% 88.8% 90.0% 94.3% 89.2% 78.7% 93.9%
Essex MA 72.8% 82.1% 81.5% 93.6% 79.5% 71.0% 89.3%
Hampden MA 64.1% 84.4% 76.3% 91.4% 76.6% 75.2% 91.7%
Middlesex MA 71.3% 82.5% 80.2% 88.7% 79.6% 70.5% 88.0%
Norfolk MA 76.2% 84.5% 85.2% 92.7% 84.3% 68.5% 91.5%
Plymouth MA 78.6% 87.5% 90.1% 94.2% 86.4% 75.6% 91.7%
Suffolk MA 65.0% 80.7% 78.3% 88.5% 76.5% 58.9% 86.6%
Worcester MA 82.8% 87.1% 89.7% 94.0% 88.3% 80.6% 92.6%
Anne Arundel MD 90.9% 89.3% 91.5% 94.7% 92.7% 86.7% 93.6%
Montgomery MD 83.8% 88.6% 84.7% 93.5% 87.1% 84.3% 91.4%
Cumberland ME 87.4% 86.7% 83.3% 93.2% 89.1% 86.9% 91.7%
York ME 87.3% 86.0% 85.0% 89.5% 89.6% 82.9% 89.2%
Berrien MI 74.6% 83.4% 79.3% 86.9% 80.3% 73.1% 86.4%
Calhoun MI 74.9% 82.6% 83.2% 87.4% 81.3% 73.3% 86.7%
Genesee MI 73.1% 80.3% 81.0% 86.6% 78.7% 69.7% 85.9%
Ingham MI 65.9% 78.8% 73.3% 86.0% 72.6% 65.6% 84.1%
Kalamazoo MI 78.2% 84.6% 82.1% 88.3% 83.5% 75.9% 87.5%
Kent MI 79.2% 86.0% 83.3% 89.3% 84.3% 77.8% 88.8%
Livingston MI 73.2% 78.3% 78.3% 83.9% 77.5% 69.9% 82.8%
Vaccination Rates by Vaccine and County (continued)

( 39 )Early Childhood Vaccination Trends in America
Percent of Infants in All Years in Study Fully Vaccinated with the Seven-Vaccine Series by Age 2 Years, 3 Months
County State DTaP Hep B Hib MMR Polio Pneumococcal Varicella
Macomb MI 65.9% 72.5% 71.6% 75.8% 71.1% 63.9% 75.9%
Monroe MI 70.5% 81.6% 78.1% 83.8% 77.4% 70.7% 84.5%
Oakland MI 75.1% 80.9% 80.8% 84.6% 80.0% 72.9% 84.5%
Ottawa MI 83.9% 87.8% 86.9% 90.5% 86.9% 81.8% 89.5%
Saginaw MI 65.7% 78.3% 74.8% 83.3% 72.7% 61.3% 82.9%
Washtenaw MI 75.2% 82.8% 81.4% 87.7% 81.1% 73.1% 86.3%
Wayne MI 69.0% 78.6% 76.2% 83.5% 76.1% 67.7% 83.5%
Anoka MN 87.1% 92.0% 92.7% 92.8% 91.2% 87.1% 91.7%
Dakota MN 87.3% 90.8% 92.4% 93.1% 89.8% 86.3% 91.7%
Hennepin MN 86.0% 89.7% 91.3% 92.8% 89.2% 84.5% 91.4%
Ramsey MN 82.3% 89.5% 89.3% 90.6% 86.6% 82.7% 88.4%
Saint Louis MN 82.2% 88.9% 85.4% 89.1% 86.3% 79.1% 86.4%
Scott MN 83.5% 88.6% 90.8% 89.9% 88.3% 81.7% 88.1%
Stearns MN 86.2% 89.4% 92.6% 91.2% 91.0% 86.6% 88.1%
Washington MN 84.7% 91.4% 92.7% 91.1% 89.7% 83.2% 89.5%
Wright MN 81.4% 88.2% 89.8% 90.4% 87.8% 80.6% 88.2%
Clay MO 70.0% 79.1% 73.4% 90.2% 73.9% 69.2% 89.0%
Greene MO 84.0% 88.2% 86.3% 91.4% 86.1% 83.1% 90.6%
Jackson MO 70.1% 76.0% 74.1% 88.5% 74.1% 70.2% 87.9%
Jasper MO 70.2% 78.2% 74.4% 77.4% 75.6% 72.3% 77.2%
Jefferson MO 87.3% 89.0% 87.9% 92.3% 91.5% 87.0% 91.2%
Platte MO 73.8% 80.7% 75.4% 90.2% 74.7% 71.3% 89.1%
Saint Charles MO 87.9% 92.0% 89.5% 93.2% 91.4% 88.3% 92.3%
Saint Louis MO 89.1% 90.7% 89.6% 92.9% 91.1% 88.4% 91.7%
Guilford NC 90.5% 93.0% 90.0% 94.6% 93.4% 90.2% 94.7%
Mecklenburg NC 88.3% 91.1% 90.8% 94.1% 91.2% 87.0% 93.5%
Wake NC 87.8% 91.1% 90.3% 94.0% 91.4% 88.0% 93.8%
Burleigh ND 86.8% 89.4% 92.9% 91.8% 92.5% 86.4% 91.1%
Cass ND 90.2% 86.1% 95.0% 95.1% 94.8% 91.2% 94.2%
Grand Forks ND 87.9% 90.5% 94.1% 93.3% 92.9% 86.9% 92.3%
Ward ND 85.6% 90.6% 93.2% 91.2% 91.9% 86.2% 90.6%
Douglas NE 87.1% 90.2% 93.2% 94.1% 91.5% 86.4% 93.4%
Lancaster NE 84.7% 87.3% 91.2% 92.8% 89.5% 83.5% 91.7%
Sarpy NE 85.5% 88.9% 91.7% 93.0% 90.2% 85.9% 92.3%
Hillsborough NH 81.7% 85.2% 85.5% 88.0% 84.7% 78.2% 87.1%
Rockingham NH 78.4% 80.2% 81.0% 86.4% 81.8% 76.4% 85.5%
Vaccination Rates by Vaccine and County (continued)

( 40 )Early Childhood Vaccination Trends in America
Percent of Infants in All Years in Study Fully Vaccinated with the Seven-Vaccine Series by Age 2 Years, 3 Months
County State DTaP Hep B Hib MMR Polio Pneumococcal Varicella
Bergen NJ 82.9% 87.8% 83.2% 87.9% 85.1% 82.1% 88.1%
Burlington NJ 87.5% 90.7% 92.3% 92.9% 90.5% 86.2% 93.6%
Camden NJ 90.6% 91.2% 94.2% 94.1% 92.1% 89.0% 93.7%
Essex NJ 78.4% 84.9% 80.3% 85.5% 82.4% 74.0% 85.8%
Gloucester NJ 89.1% 93.4% 94.9% 93.4% 92.4% 89.7% 94.5%
Hudson NJ 79.2% 87.9% 82.7% 88.5% 84.4% 78.2% 90.1%
Middlesex NJ 78.9% 88.8% 80.1% 87.2% 84.1% 78.7% 89.6%
Monmouth NJ 80.4% 88.5% 82.3% 84.9% 83.6% 79.8% 85.5%
Morris NJ 82.5% 87.8% 84.3% 88.5% 85.1% 79.6% 88.3%
Union NJ 79.2% 86.4% 80.5% 88.4% 84.1% 77.2% 88.1%
Bernalillo NM 75.4% 85.6% 85.2% 89.6% 83.4% 74.4% 88.5%
Clark NV 74.7% 83.3% 70.7% 86.1% 81.2% 71.2% 86.5%
Washoe NV 82.1% 89.5% 67.5% 89.7% 86.5% 82.5% 89.1%
Albany NY 86.0% 90.3% 88.0% 92.9% 90.6% 64.0% 92.0%
Bronx NY 58.3% 70.5% 60.4% 77.5% 67.3% 57.3% 76.5%
Dutchess NY 76.1% 85.0% 75.3% 83.9% 80.8% 75.1% 83.4%
Erie NY 89.7% 93.1% 94.4% 94.0% 93.3% * 93.5%
Kings NY 72.2% 80.0% 71.4% 82.1% 77.5% 67.6% 82.0%
Monroe NY 92.0% 94.1% 96.0% 95.8% 94.6% 89.2% 95.1%
Nassau NY 78.2% 85.0% 76.2% 85.5% 82.0% 73.5% 85.5%
New York NY 78.9% 81.7% 79.5% 88.2% 82.7% 76.5% 86.5%
Niagara NY 88.4% 93.7% 94.7% 91.8% 92.7% * 91.4%
Onondaga NY 89.3% 92.0% 94.2% 94.7% 94.8% 87.3% 94.3%
Orange NY 74.8% 81.5% 71.6% 84.0% 79.7% 74.2% 83.7%
Queens NY 73.5% 80.2% 73.6% 84.1% 79.3% 69.8% 83.5%
Richmond NY 72.5% 82.3% 72.1% 74.3% 77.2% 63.9% 77.0%
Rockland NY 72.0% 81.6% 72.2% 81.2% 80.0% 73.2% 80.8%
Saratoga NY 89.4% 91.5% 79.9% 94.4% 92.8% 61.4% 91.7%
Suffolk NY 77.0% 84.7% 77.5% 82.0% 82.7% 76.4% 83.7%
Westchester NY 79.8% 84.7% 80.0% 88.3% 84.9% 78.2% 87.4%
Butler OH 84.2% 86.4% 83.3% 89.8% 88.3% 83.8% 89.5%
Clermont OH 86.5% 87.0% 88.4% 90.6% 89.7% 85.9% 91.4%
Cuyahoga OH 84.3% 86.5% 86.6% 92.3% 89.6% 84.5% 90.9%
Delaware OH 91.0% 89.5% 90.6% 92.6% 93.1% 89.9% 93.0%
Franklin OH 87.7% 89.7% 88.3% 92.8% 91.4% 87.3% 92.3%
Greene OH 87.5% 87.5% 85.9% 90.9% 89.8% 85.5% 88.2%
Vaccination Rates by Vaccine and County (continued)

( 41 )Early Childhood Vaccination Trends in America
Percent of Infants in All Years in Study Fully Vaccinated with the Seven-Vaccine Series by Age 2 Years, 3 Months
County State DTaP Hep B Hib MMR Polio Pneumococcal Varicella
Hamilton OH 88.0% 89.6% 88.2% 93.0% 91.6% 88.3% 91.9%
Lorain OH 78.6% 86.6% 82.6% 91.7% 86.9% 80.7% 88.8%
Lucas OH 78.2% 85.3% 80.0% 85.8% 83.8% 79.3% 85.0%
Mahoning OH 74.3% 78.4% 76.5% 80.3% 78.1% 72.5% 77.1%
Medina OH 83.1% 85.2% 82.5% 90.7% 87.9% 81.2% 89.2%
Miami OH 80.2% 86.7% 80.7% 87.7% 86.4% 77.0% 86.0%
Montgomery OH 86.9% 90.1% 87.0% 92.0% 90.9% 87.1% 90.7%
Stark OH 81.0% 85.5% 81.9% 86.5% 85.7% 80.9% 85.1%
Summit OH 89.2% 90.8% 87.9% 94.0% 92.1% 88.6% 92.3%
Trumbull OH 70.7% 76.9% 74.8% 78.3% 75.4% 69.3% 75.7%
Warren OH 84.9% 86.5% 85.6% 90.1% 88.9% 84.0% 88.7%
Cleveland OK 85.5% 89.5% 91.3% 91.8% 90.1% 84.7% 90.8%
Oklahoma OK 84.2% 89.9% 89.2% 88.9% 88.6% 82.0% 90.2%
Tulsa OK 81.9% 90.0% 87.3% 89.6% 87.1% 77.5% 89.7%
Multnomah OR 83.6% 82.3% 85.7% 87.4% 86.0% 80.3% 84.1%
Washington OR 87.0% 81.4% 87.4% 86.6% 87.3% 85.0% 84.9%
Allegheny PA 89.0% 91.4% 93.1% 92.0% 91.3% 88.8% 91.8%
Beaver PA 89.7% 91.4% 93.6% 93.0% 93.1% 90.9% 93.3%
Berks PA 89.8% 93.7% 93.8% 94.5% 93.1% 88.5% 93.9%
Blair PA 89.7% 93.4% 94.2% 94.4% 93.6% 89.4% 92.7%
Bucks PA 90.1% 91.5% 94.8% 93.6% 93.4% 89.3% 94.1%
Butler PA 86.6% 89.6% 91.2% 88.4% 89.9% 86.2% 88.8%
Cambria PA 85.9% 90.3% 93.2% 93.2% 91.4% 87.1% 93.8%
Centre PA 85.0% 91.2% 94.0% 94.2% 91.5% 90.6% 93.8%
Chester PA 89.5% 89.4% 94.2% 94.5% 92.2% 88.8% 93.9%
Cumberland PA 89.9% 93.8% 95.2% 94.0% 93.3% 89.4% 93.4%
Dauphin PA 86.3% 90.8% 93.6% 93.0% 90.7% 87.0% 91.6%
Delaware PA 90.9% 92.2% 95.7% 95.4% 93.3% 89.7% 95.1%
Erie PA 80.7% 87.2% 89.3% 91.0% 86.5% 79.6% 90.1%
Fayette PA 78.8% 81.6% 86.3% 87.2% 83.8% 77.4% 87.4%
Franklin PA 86.4% 90.6% 92.6% 90.0% 92.1% 86.0% 90.4%
Indiana PA 85.9% 88.4% 92.5% 89.6% 90.7% 88.5% 91.1%
Lancaster PA 87.0% 90.5% 92.0% 92.6% 91.1% 85.5% 91.0%
Lebanon PA 85.7% 91.2% 91.7% 93.3% 90.9% 87.0% 90.4%
Lehigh PA 88.1% 89.8% 94.1% 94.3% 92.9% 87.9% 93.9%
Montgomery PA 90.3% 91.3% 95.9% 94.8% 93.6% 89.2% 94.6%
Vaccination Rates by Vaccine and County (continued)
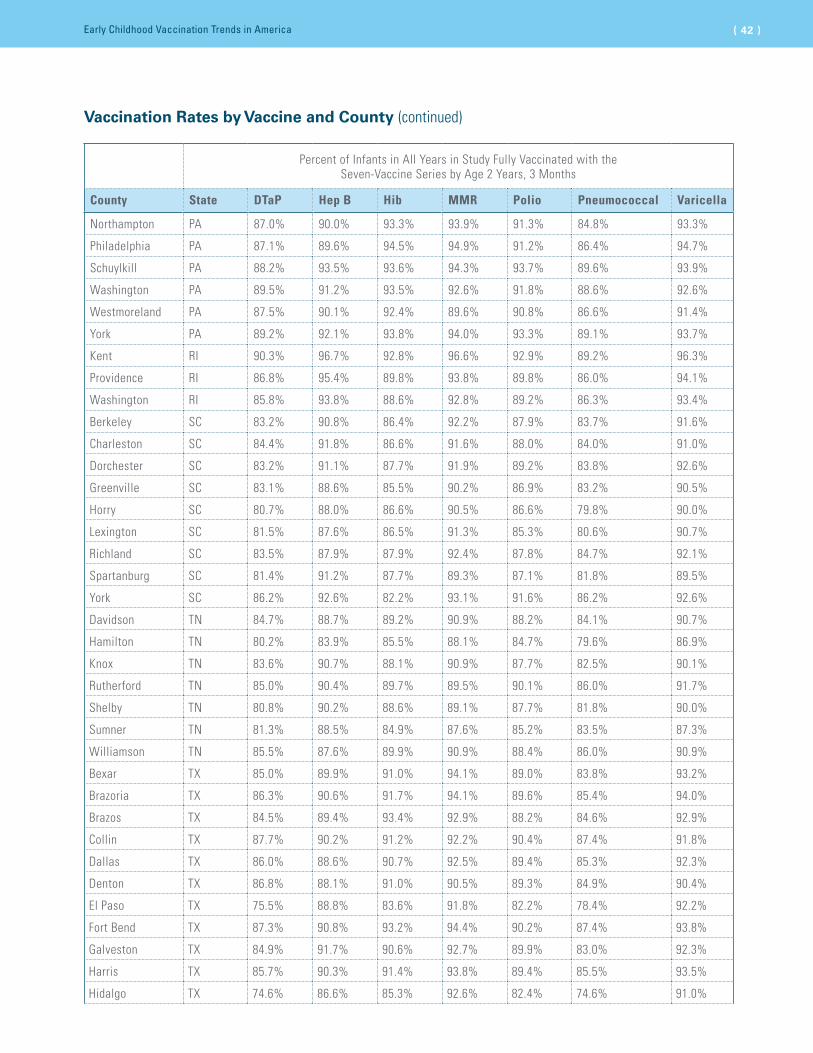
( 42 )Early Childhood Vaccination Trends in America
Percent of Infants in All Years in Study Fully Vaccinated with the Seven-Vaccine Series by Age 2 Years, 3 Months
County State DTaP Hep B Hib MMR Polio Pneumococcal Varicella
Northampton PA 87.0% 90.0% 93.3% 93.9% 91.3% 84.8% 93.3%
Philadelphia PA 87.1% 89.6% 94.5% 94.9% 91.2% 86.4% 94.7%
Schuylkill PA 88.2% 93.5% 93.6% 94.3% 93.7% 89.6% 93.9%
Washington PA 89.5% 91.2% 93.5% 92.6% 91.8% 88.6% 92.6%
Westmoreland PA 87.5% 90.1% 92.4% 89.6% 90.8% 86.6% 91.4%
York PA 89.2% 92.1% 93.8% 94.0% 93.3% 89.1% 93.7%
Kent RI 90.3% 96.7% 92.8% 96.6% 92.9% 89.2% 96.3%
Providence RI 86.8% 95.4% 89.8% 93.8% 89.8% 86.0% 94.1%
Washington RI 85.8% 93.8% 88.6% 92.8% 89.2% 86.3% 93.4%
Berkeley SC 83.2% 90.8% 86.4% 92.2% 87.9% 83.7% 91.6%
Charleston SC 84.4% 91.8% 86.6% 91.6% 88.0% 84.0% 91.0%
Dorchester SC 83.2% 91.1% 87.7% 91.9% 89.2% 83.8% 92.6%
Greenville SC 83.1% 88.6% 85.5% 90.2% 86.9% 83.2% 90.5%
Horry SC 80.7% 88.0% 86.6% 90.5% 86.6% 79.8% 90.0%
Lexington SC 81.5% 87.6% 86.5% 91.3% 85.3% 80.6% 90.7%
Richland SC 83.5% 87.9% 87.9% 92.4% 87.8% 84.7% 92.1%
Spartanburg SC 81.4% 91.2% 87.7% 89.3% 87.1% 81.8% 89.5%
York SC 86.2% 92.6% 82.2% 93.1% 91.6% 86.2% 92.6%
Davidson TN 84.7% 88.7% 89.2% 90.9% 88.2% 84.1% 90.7%
Hamilton TN 80.2% 83.9% 85.5% 88.1% 84.7% 79.6% 86.9%
Knox TN 83.6% 90.7% 88.1% 90.9% 87.7% 82.5% 90.1%
Rutherford TN 85.0% 90.4% 89.7% 89.5% 90.1% 86.0% 91.7%
Shelby TN 80.8% 90.2% 88.6% 89.1% 87.7% 81.8% 90.0%
Sumner TN 81.3% 88.5% 84.9% 87.6% 85.2% 83.5% 87.3%
Williamson TN 85.5% 87.6% 89.9% 90.9% 88.4% 86.0% 90.9%
Bexar TX 85.0% 89.9% 91.0% 94.1% 89.0% 83.8% 93.2%
Brazoria TX 86.3% 90.6% 91.7% 94.1% 89.6% 85.4% 94.0%
Brazos TX 84.5% 89.4% 93.4% 92.9% 88.2% 84.6% 92.9%
Collin TX 87.7% 90.2% 91.2% 92.2% 90.4% 87.4% 91.8%
Dallas TX 86.0% 88.6% 90.7% 92.5% 89.4% 85.3% 92.3%
Denton TX 86.8% 88.1% 91.0% 90.5% 89.3% 84.9% 90.4%
El Paso TX 75.5% 88.8% 83.6% 91.8% 82.2% 78.4% 92.2%
Fort Bend TX 87.3% 90.8% 93.2% 94.4% 90.2% 87.4% 93.8%
Galveston TX 84.9% 91.7% 90.6% 92.7% 89.9% 83.0% 92.3%
Harris TX 85.7% 90.3% 91.4% 93.8% 89.4% 85.5% 93.5%
Hidalgo TX 74.6% 86.6% 85.3% 92.6% 82.4% 74.6% 91.0%
Vaccination Rates by Vaccine and County (continued)

( 43 )Early Childhood Vaccination Trends in America
Percent of Infants in All Years in Study Fully Vaccinated with the Seven-Vaccine Series by Age 2 Years, 3 Months
County State DTaP Hep B Hib MMR Polio Pneumococcal Varicella
Lubbock TX 83.6% 88.9% 91.9% 92.8% 89.1% 85.5% 92.0%
Midland TX 80.6% 88.9% 88.4% 88.3% 86.3% 80.9% 87.8%
Montgomery TX 83.2% 89.0% 88.8% 90.5% 88.2% 82.3% 90.2%
Tarrant TX 84.8% 86.5% 91.0% 91.4% 88.8% 83.2% 90.9%
Travis TX 84.9% 82.9% 89.5% 90.4% 85.6% 81.9% 89.4%
Webb TX 71.4% 80.7% 83.0% 88.5% 81.5% 75.7% 88.0%
Williamson TX 82.8% 86.8% 88.1% 90.2% 86.3% 81.7% 90.4%
Davis UT 80.2% 88.6% 84.6% 90.6% 86.6% 76.2% 89.3%
Salt Lake UT 78.7% 87.8% 81.5% 89.9% 85.6% 77.9% 89.3%
Chesapeake City VA 85.9% 86.3% 85.0% 92.3% 89.6% 85.0% 91.8%
Chesterfield VA 87.9% 90.6% 88.7% 93.4% 90.2% 86.4% 93.4%
Fairfax VA 86.8% 89.3% 87.8% 92.3% 91.0% 86.0% 91.3%
Hampton City VA 86.0% 87.7% 84.3% 94.6% 90.7% 83.6% 92.9%
Hanover VA 91.7% 92.1% 91.2% 93.8% 93.3% 89.9% 94.1%
Henrico VA 89.2% 91.8% 90.1% 93.6% 91.3% 88.7% 94.4%
James City VA 88.5% 88.2% 84.9% 93.3% 90.6% 86.0% 92.5%
Loudoun VA 87.4% 88.3% 86.4% 91.5% 91.4% 84.8% 92.0%
Montgomery VA 86.4% 91.4% 86.5% 93.0% 89.4% 86.1% 92.3%
Newport News City
VA 86.1% 87.9% 83.0% 92.4% 89.0% 83.8% 91.9%
Prince William VA 87.1% 90.9% 86.0% 93.7% 91.6% 86.2% 93.0%
Richmond City VA 86.2% 86.8% 85.8% 91.5% 87.7% 83.8% 90.6%
Spotsylvania VA 82.4% 86.2% 83.5% 88.9% 87.5% 77.5% 88.9%
Virginia Beach City
VA 86.3% 89.0% 86.4% 92.2% 90.5% 86.5% 92.0%
Benton WA 82.5% 87.8% 85.0% 92.9% 87.0% 78.7% 91.2%
Clark WA 80.4% 81.1% 86.1% 88.6% 84.4% 78.7% 88.0%
King WA 86.8% 90.0% 92.2% 94.0% 90.2% 85.2% 92.8%
Pierce WA 79.1% 84.7% 85.9% 89.3% 84.5% 77.8% 86.9%
Snohomish WA 84.5% 87.2% 90.0% 91.9% 87.0% 81.2% 89.2%
Spokane WA 79.5% 85.8% 85.7% 88.9% 83.9% 76.3% 84.8%
Dane WI 73.5% 66.5% 73.8% 80.2% 64.9% 72.4% 77.5%
Milwaukee WI 81.2% 85.4% 82.8% 88.7% 85.0% 80.3% 86.5%
Outagamie WI 85.0% 88.4% 89.0% 90.2% 89.4% 85.2% 89.5%
Waukesha WI 83.8% 87.1% 86.8% 89.3% 88.4% 82.6% 88.6%
Kanawha WV 84.2% 87.2% 93.4% 91.8% 88.3% 84.2% 92.5%
National 80.1% 85.6% 84.4% 89.3% 85.1% 78.4% 88.6%
Vaccination Rates by Vaccine and County (continued)

( 44 )Early Childhood Vaccination Trends in America
Appendix E-7: Rate of Vaccine Refusal by State+
StatePercent of infants in all years in study with at least one parental vaccination refusal
AL 0.9%
AR 1.4%
AZ 6.4%
CA 2.3%
CO 5.7%
CT 1.7%
DE 2.7%
FL 4.8%
GA 2.9%
IA 1.1%
ID 2.5%
IL 3.2%
IN 1.7%
KS 3.5%
KY 1.7%
LA 0.8%
MA 3.5%
MD 2.0%
ME 3.7%
MI 5.4%
MN 2.7%
MO 2.6%
MS 1.2%
StatePercent of infants in all years in study with at least one parental vaccination refusal
NC 3.4%
ND 1.5%
NE 1.5%
NH 2.2%
NJ 6.5%
NM 3.1%
NV 2.3%
NY 8.4%
OH 2.2%
OK 1.8%
OR 6.8%
PA 3.2%
RI 2.4%
SC 1.2%
TN 2.3%
TX 2.9%
UT 2.6%
VA 2.4%
VT 2.7%
WA 7.0%
WI 3.5%
WV 1.2%
National 3.3%
+ Documented refusal rates are based on all ten CDC-recommended vaccines for early childhood.
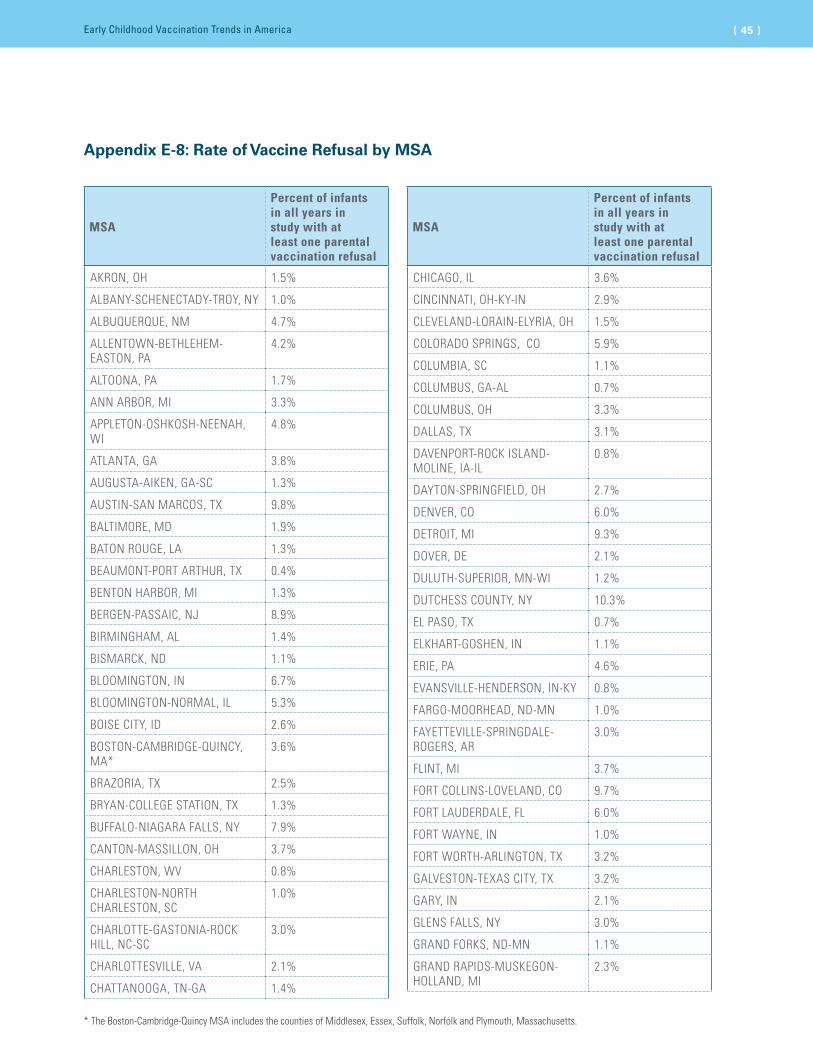
( 45 )Early Childhood Vaccination Trends in America
Appendix E-8: Rate of Vaccine Refusal by MSA
MSA
Percent of infants in all years in study with at least one parental vaccination refusal
AKRON, OH 1.5%
ALBANY-SCHENECTADY-TROY, NY 1.0%
ALBUQUERQUE, NM 4.7%
ALLENTOWN-BETHLEHEM-EASTON, PA
4.2%
ALTOONA, PA 1.7%
ANN ARBOR, MI 3.3%
APPLETON-OSHKOSH-NEENAH, WI
4.8%
ATLANTA, GA 3.8%
AUGUSTA-AIKEN, GA-SC 1.3%
AUSTIN-SAN MARCOS, TX 9.8%
BALTIMORE, MD 1.9%
BATON ROUGE, LA 1.3%
BEAUMONT-PORT ARTHUR, TX 0.4%
BENTON HARBOR, MI 1.3%
BERGEN-PASSAIC, NJ 8.9%
BIRMINGHAM, AL 1.4%
BISMARCK, ND 1.1%
BLOOMINGTON, IN 6.7%
BLOOMINGTON-NORMAL, IL 5.3%
BOISE CITY, ID 2.6%
BOSTON-CAMBRIDGE-QUINCY, MA*
3.6%
BRAZORIA, TX 2.5%
BRYAN-COLLEGE STATION, TX 1.3%
BUFFALO-NIAGARA FALLS, NY 7.9%
CANTON-MASSILLON, OH 3.7%
CHARLESTON, WV 0.8%
CHARLESTON-NORTH CHARLESTON, SC
1.0%
CHARLOTTE-GASTONIA-ROCK HILL, NC-SC
3.0%
CHARLOTTESVILLE, VA 2.1%
CHATTANOOGA, TN-GA 1.4%
MSA
Percent of infants in all years in study with at least one parental vaccination refusal
CHICAGO, IL 3.6%
CINCINNATI, OH-KY-IN 2.9%
CLEVELAND-LORAIN-ELYRIA, OH 1.5%
COLORADO SPRINGS, CO 5.9%
COLUMBIA, SC 1.1%
COLUMBUS, GA-AL 0.7%
COLUMBUS, OH 3.3%
DALLAS, TX 3.1%
DAVENPORT-ROCK ISLAND-MOLINE, IA-IL
0.8%
DAYTON-SPRINGFIELD, OH 2.7%
DENVER, CO 6.0%
DETROIT, MI 9.3%
DOVER, DE 2.1%
DULUTH-SUPERIOR, MN-WI 1.2%
DUTCHESS COUNTY, NY 10.3%
EL PASO, TX 0.7%
ELKHART-GOSHEN, IN 1.1%
ERIE, PA 4.6%
EVANSVILLE-HENDERSON, IN-KY 0.8%
FARGO-MOORHEAD, ND-MN 1.0%
FAYETTEVILLE-SPRINGDALE-ROGERS, AR
3.0%
FLINT, MI 3.7%
FORT COLLINS-LOVELAND, CO 9.7%
FORT LAUDERDALE, FL 6.0%
FORT WAYNE, IN 1.0%
FORT WORTH-ARLINGTON, TX 3.2%
GALVESTON-TEXAS CITY, TX 3.2%
GARY, IN 2.1%
GLENS FALLS, NY 3.0%
GRAND FORKS, ND-MN 1.1%
GRAND RAPIDS-MUSKEGON-HOLLAND, MI
2.3%
* The Boston-Cambridge-Quincy MSA includes the counties of Middlesex, Essex, Suffolk, Norfolk and Plymouth, Massachusetts.

( 46 )Early Childhood Vaccination Trends in America
MSA
Percent of infants in all years in study with at least one parental vaccination refusal
GREELEY, CO 4.1%
GREENSBORO--WINSTON-SALEM--HIGH POINT, NC
3.3%
GREENVILLE-SPARTANBURG-ANDERSON, SC
1.5%
HAMILTON-MIDDLETOWN, OH 2.3%
HARRISBURG-LEBANON-CARLISLE, PA
2.8%
HOUMA, LA 0.1%
HOUSTON, TX 2.3%
HUNTINGTON-ASHLAND, WV-KY-OH
0.9%
HUNTSVILLE, AL 0.9%
INDIANAPOLIS, IN 1.6%
JACKSONVILLE, FL 5.6%
JERSEY CITY, NJ 6.5%
JOHNSON CITY-KINGSPORT-BRISTOL, TN-VA
4.0%
JOHNSTOWN, PA 0.8%
JONESBORO, AR 0.6%
JOPLIN, MO 4.3%
KALAMAZOO-BATTLE CREEK, MI 1.5%
KANKAKEE, IL 1.4%
KANSAS CITY, MO-KS 5.4%
KNOXVILLE, TN 0.8%
LAFAYETTE, IN 1.7%
LAFAYETTE, LA 0.7%
LAKE CHARLES, LA 0.1%
LAKELAND-WINTER HAVEN, FL 6.3%
LANCASTER, PA 4.0%
LANSING-EAST LANSING, MI 1.7%
LAREDO, TX 0.0%
LAS VEGAS, NV-AZ 2.1%
LEXINGTON, KY 1.8%
LINCOLN, NE 1.4%
LITTLE ROCK-NORTH LITTLE ROCK, AR
0.8%
MSA
Percent of infants in all years in study with at least one parental vaccination refusal
LOS ANGELES-LONG BEACH, CA 1.5%
LOUISVILLE, KY-IN 3.1%
LUBBOCK, TX 4.2%
LYNCHBURG, VA 3.8%
MADISON, WI 4.3%
MCALLEN-EDINBURG-MISSION, TX
0.8%
MEMPHIS, TN-AR-MS 1.1%
MIAMI, FL 3.8%
MIDDLESEX-SOMERSET-HUNTERDON, N
4.0%
MILWAUKEE-WAUKESHA, WI 2.6%
MINNEAPOLIS-ST. PAUL, MN-WI 3.5%
MONMOUTH-OCEAN, NJ 6.3%
MYRTLE BEACH, SC 0.6%
NASHVILLE, TN 3.9%
NASSAU-SUFFOLK, NY 14.2%
NEW ORLEANS, LA 1.1%
NEW YORK-NEWARK, NY-NJ-PA 10.1%
NEWARK, NJ 9.3%
NEWBURGH, NY-PA 5.3%
NORFOLK-VIRGINIA BEACH-NEWPORT NEWS, VA-NC
2.1%
OAKLAND, CA 1.7%
ODESSA-MIDLAND, TX 1.3%
OKLAHOMA CITY, OK 2.0%
OMAHA, NE-IA 2.0%
ORANGE COUNTY, CA 3.9%
ORLANDO, FL 4.7%
PEORIA-PEKIN, IL 5.0%
PHILADELPHIA, PA-NJ 3.8%
PHOENIX-MESA, AZ 7.5%
PITTSBURGH, PA 2.4%
PORTLAND-VANCOUVER,OR-WA 6.5%
RALEIGH-DURHAM-CHAPEL HILL, NC
4.2%
READING, PA 1.6%
Rate of Vaccine Refusal by MSA (continued)

( 47 )Early Childhood Vaccination Trends in America
MSA
Percent of infants in all years in study with at least one parental vaccination refusal
RENO, NV 2.3%
RICHLAND-KENNEWICK-PASCO, WA
2.7%
RICHMOND-PETERSBURG, VA 2.6%
RIVERSIDE-SAN BERNADINO, CA 2.1%
ROANOKE, VA 1.5%
ROCHESTER, NY 2.7%
ROCKFORD, IL 2.1%
SAGINAW-BAY CITY-MIDLAND, MI
0.8%
SALT LAKE CITY-OGDEN, UT 2.3%
SAN ANTONIO, TX 1.8%
SAN DIEGO, CA 4.9%
SAN FRANCISCO, CA 2.9%
SCRANTON-WILKES-BARRE-HAZLETON, PA
4.0%
SEATTLE-BELLEVUE-EVERETT, WA 7.9%
SHARON, PA 0.4%
SHREVEPORT-BOSSIER CITY, LA 0.3%
SIOUX FALLS, SD 1.5%
SOUTH BEND, IN 1.3%
MSA
Percent of infants in all years in study with at least one parental vaccination refusal
SPOKANE, WA 3.9%
SPRINGFIELD, IL 1.9%
SPRINGFIELD, MO 3.1%
ST. CLOUD, MN 2.2%
ST. LOUIS, MO-IL 2.3%
STATE COLLEGE, PA 4.7%
SYRACUSE, NY 2.7%
TACOMA, WA 7.5%
TAMPA-ST. PETERSBURG-CLEARWATER, FL
4.8%
TOLEDO, OH 0.4%
TOPEKA, KS 1.5%
TULSA, OK 2.4%
WASHINGTON, DC-MD-VA-WV 2.6%
WEST PALM BEACH-BOCA RATON, FL
4.0%
WICHITA, KS 1.5%
WILMINGTON-NEWARK, DE-MD 3.0%
YORK, PA 4.2%
YOUNGSTOWN-WARREN, OH 0.9%
National 3.3%
Rate of Vaccine Refusal by MSA (continued)

( 48 )Early Childhood Vaccination Trends in America
Appendix E-9: Rate of Vaccine Refusal by County
County State
Percent of infants in all years in study with at least one parental vaccination refusal
Jefferson AL 1.4%
Madison AL 0.9%
Benton AR 3.5%
Craighead AR 0.6%
Faulkner AR 0.5%
Pulaski AR 1.0%
Washington AR 2.1%
Maricopa AZ 7.6%
Los Angeles CA 1.6%
Orange CA 3.9%
Riverside CA 2.8%
San Diego CA 4.9%
Santa Clara CA 2.6%
Adams CO 6.9%
Arapahoe CO 4.9%
Boulder CO 4.1%
Denver CO 7.7%
Douglas CO 6.2%
El Paso CO 5.9%
Jefferson CO 5.4%
Larimer CO 9.7%
Weld CO 5.5%
Fairfield CT 3.5%
Hartford CT 0.9%
New Haven CT 0.7%
New London CT 1.0%
Kent DE 2.1%
New Castle DE 2.8%
Sussex DE 2.9%
Broward FL 6.0%
Duval FL 6.7%
Hillsborough FL 4.6%
Miami-Dade FL 3.8%
Orange FL 4.2%
County State
Percent of infants in all years in study with at least one parental vaccination refusal
Palm Beach FL 4.0%
Polk FL 6.3%
Cherokee GA 5.8%
Cobb GA 4.2%
DeKalb GA 2.5%
Forsyth GA 4.0%
Fulton GA 3.3%
Gwinnett GA 4.1%
Muscogee GA 0.7%
Ada ID 3.0%
Canyon ID 1.7%
Cook IL 3.3%
DeKalb IL 4.5%
DuPage IL 5.5%
Grundy IL 2.7%
Kane IL 4.3%
Kankakee IL 1.4%
Kendall IL 4.9%
Lake IL 2.6%
Madison IL 2.8%
McHenry IL 2.4%
McLean IL 5.3%
Sangamon IL 1.8%
Will IL 2.9%
Winnebago IL 2.1%
Allen IN 1.0%
Bartholomew IN 0.7%
Boone IN 1.7%
Elkhart IN 1.1%
Hamilton IN 2.0%
Hancock IN 0.6%
Hendricks IN 1.2%
Johnson IN 1.8%
Lake IN 1.9%

( 49 )Early Childhood Vaccination Trends in America
County State
Percent of infants in all years in study with at least one parental vaccination refusal
Marion IN 1.6%
Monroe IN 6.7%
Porter IN 2.6%
Tippecanoe IN 1.6%
Vanderburgh IN 0.7%
Johnson KS 7.7%
Sedgwick KS 1.2%
Shawnee KS 1.5%
Boone KY 2.5%
Fayette KY 2.0%
Jefferson KY 2.8%
Bristol MA 3.0%
Essex MA 4.0%
Hampden MA 3.7%
Middlesex MA 2.5%
Norfolk MA 3.5%
Plymouth MA 7.4%
Suffolk MA 2.2%
Worcester MA 3.6%
Anne Arundel MD 3.7%
Montgomery MD 1.1%
Cumberland ME 5.5%
York ME 1.8%
Berrien MI 1.3%
Calhoun MI 3.1%
Genesee MI 3.7%
Ingham MI 1.5%
Kalamazoo MI 0.8%
Kent MI 2.0%
Livingston MI 5.6%
Macomb MI 12.7%
Monroe MI 2.0%
Oakland MI 11.2%
Ottawa MI 1.7%
Saginaw MI 1.0%
Washtenaw MI 2.2%
County State
Percent of infants in all years in study with at least one parental vaccination refusal
Wayne MI 5.3%
Anoka MN 4.5%
Dakota MN 2.7%
Hennepin MN 4.0%
Ramsey MN 3.9%
Scott MN 1.9%
Stearns MN 1.0%
Washington MN 2.6%
Wright MN 4.8%
Clay MO 3.0%
Greene MO 2.8%
Jackson MO 4.2%
Jasper MO 5.2%
Jefferson MO 2.2%
Platte MO 5.3%
Guilford NC 4.2%
Mecklenburg NC 3.6%
Wake NC 4.7%
Burleigh ND 1.2%
Cass ND 1.2%
Grand Forks ND 1.3%
Ward ND 3.8%
Douglas NE 2.3%
Lancaster NE 1.4%
Sarpy NE 1.7%
Hillsborough NH 2.3%
Rockingham NH 2.2%
Bergen NJ 8.9%
Burlington NJ 7.5%
Camden NJ 2.3%
Essex NJ 9.3%
Gloucester NJ 2.6%
Hudson NJ 6.5%
Middlesex NJ 3.5%
Monmouth NJ 6.6%
Morris NJ 9.0%
Rate of Vaccine Refusal by County (continued)

( 50 )Early Childhood Vaccination Trends in America
County State
Percent of infants in all years in study with at least one parental vaccination refusal
Union NJ 8.6%
Bernalillo NM 4.6%
Clark NV 2.2%
Washoe NV 2.3%
Albany NY 0.6%
Bronx NY 5.7%
Dutchess NY 10.3%
Erie NY 8.3%
Kings NY 8.9%
Monroe NY 3.0%
Nassau NY 13.7%
New York NY 14.5%
Niagara NY 5.8%
Onondaga NY 2.3%
Orange NY 5.4%
Queens NY 9.8%
Richmond NY 25.6%
Rockland NY 8.2%
Saratoga NY 1.8%
Suffolk NY 14.6%
Westchester NY 5.9%
Butler OH 2.3%
Clermont OH 4.3%
Cuyahoga OH 1.5%
Delaware OH 3.6%
Franklin OH 3.1%
Greene OH 3.2%
Hamilton OH 2.7%
Lorain OH 2.2%
Lucas OH 0.4%
Mahoning OH 1.1%
Medina OH 2.3%
Miami OH 3.1%
Montgomery OH 2.5%
Stark OH 3.5%
Summit OH 1.5%
County State
Percent of infants in all years in study with at least one parental vaccination refusal
Trumbull OH 0.9%
Warren OH 2.2%
Cleveland OK 1.9%
Oklahoma OK 2.5%
Tulsa OK 2.4%
Multnomah OR 6.4%
Washington OR 6.6%
Allegheny PA 2.2%
Beaver PA 0.9%
Berks PA 1.6%
Blair PA 1.7%
Bucks PA 5.3%
Butler PA 2.9%
Cambria PA 0.6%
Centre PA 4.7%
Chester PA 4.9%
Cumberland PA 3.0%
Dauphin PA 2.5%
Delaware PA 5.2%
Erie PA 4.6%
Fayette PA 1.2%
Franklin PA 5.9%
Indiana PA 5.4%
Lancaster PA 4.0%
Lebanon PA 2.9%
Lehigh PA 4.7%
Montgomery PA 2.8%
Northampton PA 4.0%
Philadelphia PA 2.6%
Schuylkill PA 1.0%
Washington PA 2.0%
Westmoreland PA 3.1%
York PA 4.2%
Kent RI 1.6%
Providence RI 1.6%
Washington RI 4.7%
Rate of Vaccine Refusal by County (continued)

( 51 )Early Childhood Vaccination Trends in America
County State
Percent of infants in all years in study with at least one parental vaccination refusal
Berkeley SC 0.9%
Charleston SC 1.2%
Dorchester SC 0.8%
Greenville SC 1.9%
Horry SC 0.6%
Lexington SC 1.2%
Richland SC 1.0%
Spartanburg SC 1.1%
York SC 1.7%
Davidson TN 4.6%
Hamilton TN 1.5%
Knox TN 0.6%
Rutherford TN 2.9%
Shelby TN 1.2%
Sumner TN 2.4%
Williamson TN 3.3%
Bexar TX 1.8%
Brazoria TX 2.5%
Brazos TX 1.4%
Collin TX 3.4%
Dallas TX 2.5%
Denton TX 4.5%
El Paso TX 0.7%
Fort Bend TX 1.9%
Galveston TX 3.2%
Harris TX 2.5%
Hidalgo TX 0.8%
Lubbock TX 4.2%
Midland TX 1.6%
Montgomery TX 2.0%
Tarrant TX 3.4%
County State
Percent of infants in all years in study with at least one parental vaccination refusal
Travis TX 12.6%
Webb TX 0.0%
Williamson TX 6.1%
Davis UT 2.4%
Salt Lake UT 2.4%
Chesapeake City VA 1.8%
Chesterfield VA 2.3%
Fairfax VA 2.8%
Hampton City VA 1.4%
Hanover VA 3.0%
Henrico VA 3.2%
James City VA 2.6%
Loudoun VA 2.4%
Montgomery VA 2.1%
Newport News City VA 1.6%
Prince William VA 1.7%
Richmond City VA 2.7%
Spotsylvania VA 4.4%
Virginia Beach City VA 3.0%
Benton WA 2.8%
Clark WA 6.7%
King WA 7.4%
Pierce WA 7.5%
Snohomish WA 9.5%
Spokane WA 3.9%
Dane WI 4.3%
Milwaukee WI 3.1%
Outagamie WI 4.9%
Waukesha WI 2.1%
Kanawha WV 0.5%
National 3.3%
Rate of Vaccine Refusal by County (continued)