Embed Size (px)
Citation preview

Early Childhood “Pay-For-Success” Social Impact Finance: A PKSE Bond Example to
Increase School Readiness and Reduce Special Education Costs
A Report of the
Kauffman Foundation -- ReadyNation
Working Group on Early Childhood Finance Innovation
Robert Dugger
Board of Advisors Chairman ReadyNation
Washington DC
Robert Litan Senior Vice President for Research and Policy
Kauffman Foundation Kansas City, Missouri
March 2012
1
Contents
Page
Executive Summary
Acknowledgments
Kauffman-ReadyNation Working Group and Membership
Introduction -- Human Capital, Economic Growth and Early Child
Development
Chapter 1 -- Pay-for-Success Social Impact Finance and
Evidence-based Early Child Development
Chapter 2 – Special Education and the Evidence for Prekindergarten Impact on Public School Special Education Costs
Chapter 3 – A Social Impact Bond Example: PKSE (Peek-See)
Bonds to Pay for Pre-K to Reduce Special-Ed Costs
1
7
8
9
13
30
54

1
Early Childhood “Pay-For-Success” Social Impact Finance: A PKSE Bond Example to
Increase School Readiness and Reduce Special Education Costs
Executive Summary
State and federal budget spending cuts sweeping America are forcing reductions in resources for education resources at every age level. This is occurring at the same time the importance of an educated
workforce is clearer than ever. One solution to this challenge is social impact finance -- private
investment working with philanthropy to achieve state and national goals on a “pay-for-success” basis. How to do this has been the focus of the Kauffman ReadyNation working group on early education
finance.
This is a working group progress report. Final answers may be years away and will depend on regional
initiatives. This report is written for business people, philanthropists, investors, investment advisors, government officials, and early childhood service providers. It describes social impact finance, early
childhood programs and special education, and provides an example of how social impact bonds might be
used pay for early learning services for three and four year-old children to increase school readiness and reduce public school special education costs.
A. Science, Innovation and Entrepreneurship
Every parent in America wants the best for their children and knows education is the key. Every school
district is struggling to prepare students for a future that demands more education than ever before. And
the lesson in every classroom is clear – school success, and ultimately life success, depends most on how ready children are when they first arrive at school. But how can school readiness be increased? Science,
innovation and entrepreneurship provide answers.
Unemployment is high. Local economies are at risk. Government budgets are limited. History and the
most recent economic research show that human capital is the key to job-creating innovation, restoring growth and regaining fiscal strength. This research shows that investing in young children improves
parent and classroom productivity and increases local economic and per capita income growth. In fact,
the research shows that investing in the youngest children, investing in school-readiness, strengthens local economies more than any other development strategy. Strong local economies mean a strong
national economy.
But how can more school-readiness investment be paid for? Where will the money come from? Local and
state budgets are empty, and federal spending has to be cut. Where will the resources come from? One
answer is completely American – science, innovation and entrepreneurship combined with social impact finance.
Science tells us that social and emotional capacities and many cognitive skills necessary for school and life success are best developed before age five. From brain research it is clear that the first five years of a
child’s life, when 85% of human brain development occurs, are the most important in child development
and education. These are the years when crucial health, personality and cognitive traits needed for school readiness, workplace productivity, and life success are established. It is simply easier and much
cheaper to teach some things to children when they are three or four years old than when they are seven or eight. This is the essence of the “skill begets skill” insight of Nobel Prize winner James Heckman. It is
what is meant in human capital terms by business and engineering’s Six Sigma principle – quality depends most on what is done earliest. It is far cheaper to spend more on early engineering and design
than to try to fix problems later during manufacturing and assembly. Whether it is a jet plane or a three-
year old, the cost difference between doing things right early-on and doing repairs later are so great, the savings often more than cover the cost.
Economic science tells us that there is almost nothing a region can do to improve its growth and per capita income outlook more than investing in young children and their families to increase school
readiness. Investing in kids increases parent productivity and attracts strong families, which in turn

2
attracts good businesses and increases incomes and property values. Good early childhood programs also
generate public sector gains that reduce operating costs and increase revenues. These gains include lower special education assignments and improved classroom performance; lower grade retention, child
welfare costs, teen pregnancy, and adolescent crime; and higher high school graduation rates, employment, family formation, business investment attractiveness, economic growth and per capita
income.
Innovation involves linking previously separate ideas into workable new combinations. Experts have long believed that the economic returns on sound early childhood programs are so high it should be possible
to pay for them with “invest-in-kid bonds”. This idea combined with rapidly evolving concepts of social impact finance, looks particularly promising. Social impact transactions are taking many forms. They “pay
for success” in improving outcomes and take advantage of the overlap of for-profit and non-profit incentives.
Social Impact Bonds (SIBs) are one kind of social impact finance. They pay for specific intervention
services that reduce government costs or increase revenues. SIB earnings and repayment come from the government’s monetary benefits, according to the terms of the contracts among the SIB participants.
Entrepreneurship is business leaders combining these findings in new enterprises that can increase local school readiness and strengthen the local economy. Early learning capital partnerships are one example.
Such partnerships could sell early learning bonds to pay for the services at-risk children need for school
readiness. Bond interest and principle repayments would come from the cost savings from lower public school spending on special education, grade retention and English language training. Many names have
been suggested for such bonds – for example, ELSIE bonds (“early learning social impact”), ELLIE bonds (“early learning”), and PKSE (“peek see”) bonds (“pay for pre-k to reduce special-ed costs”). All of which
can be used to finance early health, parenting, and learning programs where benefit-to-cost ratios are high enough. This report refers to this class of social impact finance as PKSE bonds because the example
presented focuses on reducing special education costs through early learning.
B. Social Impact Finance and PKSE Bonds
SIB “pay for success” financing approaches build on the overlap of for-profit and non-profit incentives.
None Desired Early Childhood Effect High
No
ne
De
sire
d F
inan
cial
Ret
urn
H
igh
For-Profit InvestorSpace
Blended Incentives and Capital
Philanthropic Investor
Space
Financial Return Floor
Social R
eturn
Floo
r
Segments of Social Impact Investors
The three most important questions are: (1) Can research satisfactorily affirm that a particular early
childhood intervention with a clearly identified group of children yields government cost savings or revenue increases? (2) Can those cost savings or revenue increases be monetized via enforceable
contracts between a social impact bond (SIB) issuing institution, a few government agencies, and the providers of the intervention services? And (3) Can the cost savings or revenue gains be monetized within
timeframes and risk levels that investors find acceptable?

3
SIBs can be used to fund early childhood care and education programs if information uncertainties and
operational challenges are effectively addressed. Major challenges include these seven:
1. Unclear returns on the SIB investment project or intervention.
2. Long delays between the SIB intervention investment and the return. 3. Inability to link government cost reductions or revenue gains solely to the SIB investment
intervention.
4. Multiple government jurisdictions with mobile young families and irreconcilable differences. 5. Resistance to paying SIB investors from public cost savings or revenue gains.
6. Limited capacity to administer and evaluate SIB program performance. 7. Incentive inconsistencies among the parties to the SIB financing.
To address the major challenges to early childhood SIB establishment and operation, the following are required:
1. Strong business, philanthropic and government support to provide essential regional knowledge,
marshal the capital needed to conduct necessary statistical studies, pay SIB set-up costs, overcome jurisdictional and political differences, and in some instances take first-loss positions in
the SIB capital structure. 2. Strong local child care and education community support and high-quality programs in the local
area to provide expert guidance on child care and education economics, advocate for sector
reforms such as quality ratings, and marshal youth human capital sector voter power to overcome jurisdictional and political opposition.
3. Rigorous statistical studies to demonstrate net benefits and serve as a foundation element of SIB contracts
4. Sound legal foundations for SIB issuing organizations 5. Clear enforceable contracts among SIB participating entities
6. Familiar investor terms and other features of the bonds or other SIB assets
7. Good investor relationships with the investment underwriting, institutional and foundation investor sectors
C. PKSE Capital Partnership Example
To attract strong investor interest, PKSE programs will need to demonstrate strong local business and
philanthropic support. To provide this, in the example presented in this report, local philanthropy is given
full responsibility for setting up and covering all the operating expenses of the bond issuing organization. To give investors the strongest sense that their funds will invest in children, all PKSE bond proceeds are
allocated to fund pre-k scholarships for at-risk children. And to accommodate diverse kinds of pre-k providers and incentivize them to achieve higher quality, parents are permitted to use the PKSE
scholarships to pay for pre-k services from any provider so long as they can show their quality is as good
based on a rigorous quality rating and improvement system.
The example draws on the findings of the 2009 Pennsylvania Pre-K Counts evaluation, and is loosely
based on the Bethlehem Area School District in eastern Pennsylvania, the third largest school district in the Pre-K Counts (PKC) study.
The PKC evaluation study spanned a three year period from 2005-2008 and involved 21 school districts and 10,002 children. The study projected that if Pre-K Counts services were available to all at-risk
children it would reduce the rate of special-ed assignment from the 21 schools’ historical average of 18%,
to 2.4%. The evaluation raised the possibility that Pre-K Counts might generate special-ed cost savings for the county and state government but did not pursue the matter. The sample PKSE program assumes
non-prek children are assigned to special-ed at an 18% rate, but increases the assignment rate for Pre-K Counts children three-fold to 7.5%.
The cost of pre-k is the actual amount the state government pays each year for full-day Pre-K Counts
services. The cost of special-ed is estimated to be equal to 70% of the Bethlehem school district per child per year special-ed cost. In addition to these assumptions, the example limits the allows for 2% per year

4
out-migration of PKSE students, discounts future financial flows at a 5% discount rate, provides for
operations, mentoring and monitoring costs, and incorporates local philanthropic and national PRI-type contributions.
PKSE scholarships are paid for out of the proceeds of PKSE bond sales. The PKSE bonds are basic 10-year interest-bearing bonds. PKSE operations are paid for by regional business-leader philanthropists. And
future yearly rounds of PKSE financing are funded out of the net gains from the preceding round. The
example shows positive resource generation with reasonable interest rate and operating cost assumptions, and becomes sustainable in six years. However, there is point when cash flow goes
negative and more capital is needed because accumulated special-ed savings are not enough to pay off the bonds entirely. By introducing PRI financing to cover the capital shortage, the program becomes
sustainable in two financing rounds.
Investment returns to for-profit and non-profit investors
The returns to for-profit investors are simply the interest rate paid on the PKSE bonds and any intangible
sense that their capital is being allocated to sound economic activities. The returns to philanthropic investors are more complex. There are at least three bottom lines.
The first is economic -- the improvement in school readiness and all its implications for the life success of PKSE scholars – higher third-grade reading and math scores, higher graduation rates, lower involvement
in crime, fewer teen pregnancies, less drug use, higher rates of employment and future earnings,
improved parent productivity, and stronger regional economic and per capita income growth. These benefits cumulate at the local and regional levels and strengthen national aggregate growth and job
creation. To paraphrase Jim Heckman, “Benefits beget benefits.”
A second bottom line is financial -- the reduction in special education costs. Investor purchases of PKSE
bonds is just the way business leaders and philanthropists get outside for-profit capital to pay for what is needed to increase local and regional school readiness and cut special-ed costs. There are no bonds to
purchase unless there are institutions, preferably local ones, to issue the bonds. The present value of
regional business-leader philanthropic contributions to establish a small version of these institutions is $412 thousand. The financial return on that philanthropic investment is the amount of special-ed cost
savings. In the first round this is $1.9 million. Success in this is measured by the ratio of special-ed savings to local philanthropic investment. In this case, the present value of the first round return is
464%. There are returns from successive rounds also. Including them increases first-round returns
several times over.
The third is societal. The process of building PKSE organizations knits together local and national business
leaders and philanthropic institutions into networks of people locally and nationally who understand the importance of youth human capital development, have built effective investment frameworks that can
attract capital from many sources, and have the capacity to act at the levels of local, state and federal
policymaking. PKSEs and arrangements like them can overcome some of the market obstacles to effective youth human capital investment, but only state and federal policymaking can address the major
obstacles. One of the returns to philanthropic investment returns from establishing institutions like PKSEs is the creation of coalitions of hundreds of business leaders in every state that have the knowledge of
what works and doesn’t work in early child development and education. These are the people who can and ultimately will affect state and federal policy.
D. Action Items for Local and State Business and Philanthropic Leaders
To strengthen local and state economies despite limited budget resources, regional business and philanthropic leaders should –
1. Form local and state business leader early childhood investment councils.
2. Develop broad business sector support for quality prenatal through age five programs for
children and their families.

5
3. Work with national foundations that specialize helping business leaders establish regional and
state business coalitions and provide technical assistance in setting up SIB arrangements such as PKSEs.
4. Establish local “school readiness capital partnerships” to increase regional per capita income and economic growth through youth human capital investment.
5. Identify what early childhood programs the region needs most to reduce school special
education, grade retention and English language learner (ELL) costs.
6. If, for example, quality preschool is needed, carryout a study of the effect of preschool on
special-ed, grade retention and ELL costs.
7. If the study is promising, implement the PKSE program beginning with educating regional
business and philanthropic leaders on SIB financing and how PKSE bond programs work. Complete contract arrangements among PKSE participants. Sell regional PKSE bonds to banks,
investors and foundations. Closely monitor and evaluate progress and performance.
E. Action Items for National Philanthropy
To support and facilitate from-the-ground-up strategies for restoring economic growth and fiscal
sustainability, large regional and national foundations should --
1. Develop SIB design, technical assistance and implementation expertise.
2. Support non-profits that are dedicated to establishing local, state and federal business and
philanthropic early childhood investment councils and coalitions.
3. Fund local “effect-studies” to determine how much specific early childhood interventions actually
reduce local school costs.
4. Make Program-Related Investments in promising PKSE programs to finance periods when they
are cash-flow negative and to serve as a first-loss risk taker.
5. Provide background information to support business leaders in obtaining local and state statutory
or regulatory changes to recognize SIB finance approaches and where appropriate to define
criteria for state income tax exemption.
F. Action Items for State Governments
To encourage city and county officials and business leaders to make the best use of social impact finance to promote near-term school readiness and long-term workforce strength, state governments should --
1. Authorize, by statute and regulation, state agencies, school districts and other government
entities to enter into contracts with SIB capital partnerships.
2. Authorize state entities to rebate cost savings and/or revenue increases to SIB capital
partnerships as provided for in partnership contracts.
3. Establish criteria for SIB-issued debt to be income-tax exempt.
G. Action Items for the Federal Government
The federal government provides funding to states under federal law for many state-provided services such as special education. If a SIB capital partnership reduces state spending on special education, it also
reduces federal spending. To encourage local public-private arrangements like SIB capital partnerships, Congress should --
1. Authorize, by statute and regulation, federal agencies to enter into contracts with SIB capital partnerships in parallel with state entities.
6
2. Authorize federal agencies to rebate cost savings and/or revenue increases to SIB capital
partnerships as provided for in partnership contracts.
3. Amend federal laws and regulations such as the banking Community Reinvestment Act, which
encourage businesses to engage in socially-desired purposes, to include investment in early child development and education.

7
Acknowledgments
This is a working group progress report. Final answers may be years away and will depend on regional initiatives. This report is also a group effort. It reflects the input of many people but any errors are the
responsibility solely of the authors.
The authors warmly thank the members of the Kauffman-ReadyNation Early Childhood Finance
Innovation Working Group for their hard work and participation in conferences in Chicago and Boston in
2010 and 2011, several webinars, conference calls, and numerous one-on-one discussions.
For important analytical input and guidance, the authors particularly thank working group members Sara
Watson, executive director of ReadyNation; James Heckman, University of Chicago; Art Rolnick, co-director Human Capital Research Collaborative, University of Minnesota; Rob Grunewald, associate
economist Federal Reserve Bank of Minneapolis; Janis Dubno, Senior Policy Analyst, Voices for Utah Children; George Overholser, managing director Third Sector; Phillip Wm. Fisher, Founder, Mission
Throttle; Katherine Glazer, president, Virginia Early Childhood Foundation; September Jones, executive
director, Smart Beginnings Alexandria Arlington, and David Ahn, Hanover Investment Group. For expert insights and comments the authors thank Steven Barnett, director, National Institute for Early Education
Research; Clive Belfield, associate professor, Queens College, City University of New York; and Arthur Reynolds, Professor, Institute of Child Development, College of Education & Human Development,
University of Minnesota. The authors also thank Glory Olson, Kauffman Foundation, and Tiffany Eckert,
Hanover Investment Group, for organizing conferences and webinars; and Daniel Blitz and Peter Carota for financial modeling and research assistance.
The authors also thank members of the ReadyNation Invest-in-Kids Working Group, and members of the Financial Markets Network of the Human Capital and Economic Opportunity Task Force at the University
of Chicago sponsored by INET and the Becker Friedman Institute for helpful comments and guidance.
Special appreciation is also extended to Lawrence Wilder, special assistant, Office of Virginia Governor
Bob McDonald, executives and staff of the Virginia Department of Education, and Mort Sherman,
superintendent Alexandria School System for their active encouragement of this work.
Kauffman-ReadyNation Working Group
Kauffman-ReadyNation Working Group
Kauffman-ReadyNation Early Childhood Finance Innovation Working Group was organized in early 2010 is
to explore development of early child care and education social impact finance methods and, where
possible, assist in implementing demonstrations of their effectiveness. The working group’s goal is to facilitate creation of “invest-in-kid bonds” that can be underwritten individually or aggregated into asset
backed securities, which can be invested in by individuals and institutions worldwide.
This report incorporates the analysis and finding of its November 2010 report “Early Childhood Finance:
Meeting Notes and Initial Findings of a Conference Convened by the Kauffman Foundation and the
Partnership for America’s Economic Success”.1
Kauffman Foundation
The Kauffman Foundation in Kansas City is dedicated to strengthening American entrepreneurship and believes “education should lead students on a path to self-sufficiency, preparing them to hold good-
paying jobs, raise their families, and become productive citizens”, with particular emphasis on “advancing student achievement in science, technology, engineering and math (STEM).”2
ReadyNation
ReadyNation3 is an affiliate of America’s Promise Alliance4 and is dedicated to “amplifying the voice of business leaders in support of policies that strengthen our economy and workforce”5 ReadyNation is
formerly known as the Partnership for America’s Economic Success, a project of the Pew Charitable Trusts’ Center on the States.

8
Working Group Participants
Name Affliliation
Timothy Bartik W.E. Upjohn Institute for Employment Research
Duane Benson Minnesota Early Learning Foundation
Daniel Blitz Finance and Investment Consultant
Flavio Cunha University of Pennsylvania
Andy Davis Illinois Student Assistance Commission
Lindsay Dolce Early Learning Ventures
Janis Dubno Voices for Utah Children
Robert Dugger Hanover Investment Group
Daniel Epstein Learning Care Group
Phillip Wm. Fisher Mission Throttle
Mark Gross Family Central Inc
Robert Grunewald Federal Reserve Bank of Minneapolis
James Heckman University of Chicago, Department of Economics
Paul Hirschbiel Eden Capital
Randall Kroszner University of Chicago, Booth School of Business
Robert Krupicka ReadyNation
Jesse Leinfelder The Children's Trust
Jeffrey Liebman Harvard University
Robert Litan Ewing Marion Kauffman Foundation
Lance Lochner University of Western Ontario
Harriett Meyer Ounce of Prevention Fund
Miguel Palacios Vanderbilt University, Owen School of Management
George Overholser Nonprofit Finance Fund
Diana Rauner Ounce of Prevention Fund
Art Rolnick University of Minnesota, Humphrey Institute
Jeff Schoenberg Pritzker Family Foundation
Felipe Vergara Lumni Inc
Sara Watson ReadyNation
Elaine Weiss Economic Policy Institute

9
Introduction
A. Human capital, Economic Growth and Early Child Development
Many factors determine national growth and development, but human capital is indisputably the most
important. A population’s health, social capacities, and education are the foundations for a nation’s ability to provide for families, communities, vital creative markets, strong legal and political institutions,
economic competitiveness and national security.6
America’s workforce, our human capital, is our greatest national resource. Without it none of our other aspirations are possible. Among the many things we do privately and publicly to strengthen our
workforce, the most important is successfully raising and educating children to young adulthood. The young adults we need are healthy, caring, team-oriented, educated and on-track to become productive
citizens. They have high-school or comparable degrees, are physically fit, and have no criminal records. They have wide ranges of abilities and interests, and their diversity is an asset, especially in view of the
range of economic and environmental uncertainties we face.
Global Competitiveness
Like other mature economies, America is an aging society in a global economy. It must compete head-to-
head more intensively than ever with every other economy in the world. The usually mentioned competitive factors – entrepreneurship, innovation, rule of law, democracy, etc – all depend on human
capabilities. Aging and competition mean that more than anything else, to remain competitive America
needs young adults who are team-oriented, educated and fit.
America cannot be a competitive leader, and restore economic growth and fiscal sustainability if its young
adult population is weakened by preventable health and fitness problems, inadequate educations, and criminal activity. The Department of Defense finds that 75% of American young adults for these reasons
cannot qualify for employment in the armed services.7 American business may not have military level fitness requirements, but their standards for education and law-abidance are certainly as high.
High nationwide dropout rates, low reading and math test scores, and business survey results indicating
general lack of young adult workplace readiness attest to weaknesses in America’s prenatal to age-18 child-raising and education capabilities. If America cannot strengthen everything it does from conception
to age-18, we condemn millions of children to be under-performers and ourselves to worldwide second or third-tier competitiveness.
Early care and education “return on investment”
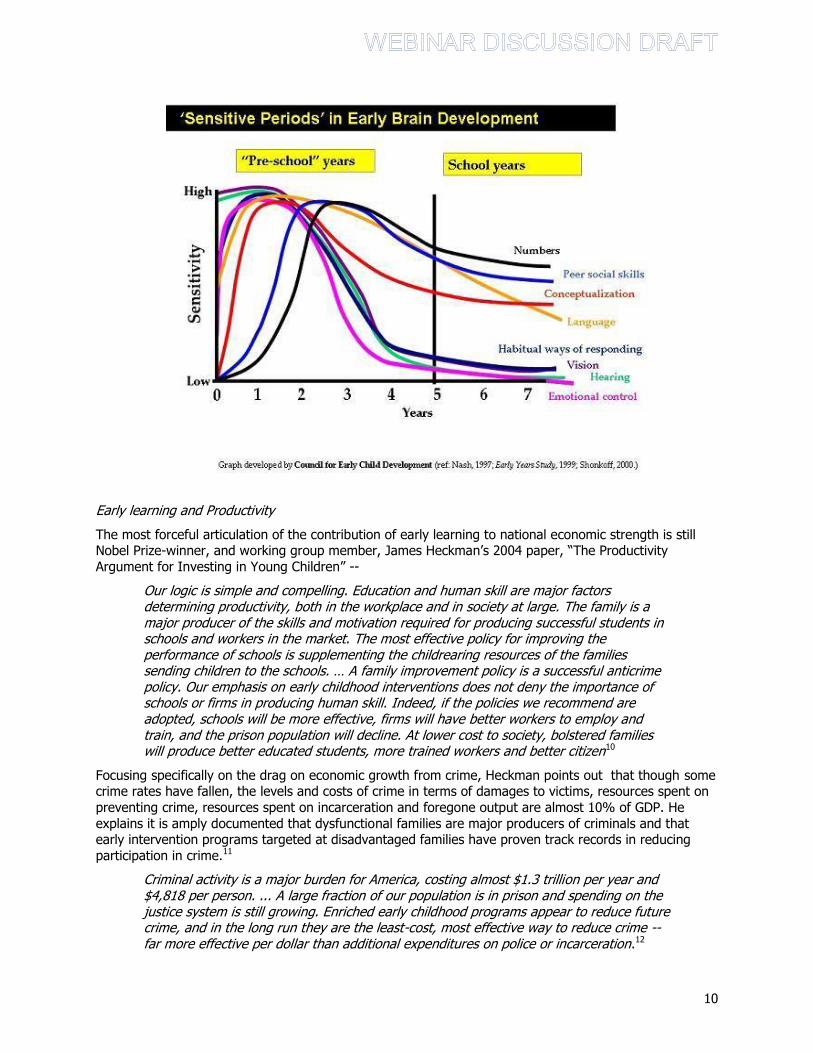
The first five years of a child’s life, when most of human brain development occurs, are the most important in raising and educating the young adults America needs. These are the years when crucial
health, personality and cognitive traits needed for school readiness, workplace productivity, and life success are established. 8, 9
Birth - 2 years 2 - 4 years 4 - 5 years
Vision Peer social skills Numbers
Hearing Language Language
Language Conceptualization Peer social skills
Emotional control Numbers Conceptualization
Conceptualization
10
Early learning and Productivity
The most forceful articulation of the contribution of early learning to national economic strength is still Nobel Prize-winner, and working group member, James Heckman’s 2004 paper, “The Productivity
Argument for Investing in Young Children” --
Our logic is simple and compelling. Education and human skill are major factors determining productivity, both in the workplace and in society at large. The family is a major producer of the skills and motivation required for producing successful students in schools and workers in the market. The most effective policy for improving the performance of schools is supplementing the childrearing resources of the families sending children to the schools. … A family improvement policy is a successful anticrime policy. Our emphasis on early childhood interventions does not deny the importance of schools or firms in producing human skill. Indeed, if the policies we recommend are adopted, schools will be more effective, firms will have better workers to employ and train, and the prison population will decline. At lower cost to society, bolstered families will produce better educated students, more trained workers and better citizen10
Focusing specifically on the drag on economic growth from crime, Heckman points out that though some crime rates have fallen, the levels and costs of crime in terms of damages to victims, resources spent on
preventing crime, resources spent on incarceration and foregone output are almost 10% of GDP. He
explains it is amply documented that dysfunctional families are major producers of criminals and that early intervention programs targeted at disadvantaged families have proven track records in reducing
participation in crime.11
Criminal activity is a major burden for America, costing almost $1.3 trillion per year and $4,818 per person. ... A large fraction of our population is in prison and spending on the justice system is still growing. Enriched early childhood programs appear to reduce future crime, and in the long run they are the least-cost, most effective way to reduce crime -- far more effective per dollar than additional expenditures on police or incarceration.12

11
Heckman concludes --
On productivity grounds alone, it appears to make sound business sense to invest in young children from disadvantaged environments. An accumulating body of evidence suggests that early childhood interventions are much more effective than remedies that attempt to compensate for early neglect later in life. Enriched pre-kindergarten programs available to disadvantaged children on a voluntary basis, coupled with home visitation programs, have a strong track record of promoting achievement for disadvantaged children, improving their labor market outcomes and reducing involvement with crime. Such programs are likely to generate substantial savings to society and to promote higher economic growth by improving the skills of the workforce.13
Early Learning and Economic Development
The most detailed documentation of early childhood investment on economic development and per capita
income growth is the book, Investing in Kids: Early Childhood Programs and Local Economic Development, written by another working group member, Timothy Bartik of the Upjohn Institute. Bartik exhaustively examines three early childhood programs – Abecedarian, Nurse Family Partnership, and
Perry Prekindergarten -- and finds that, even under quite conservative assumptions, all three are stronger investments than state business subsidies, when viewed from a long-term economic development and
national growth perspective. Bartik specifically shows --
From a state perspective, business subsidies can boost a state’s job growth, but that
ignores the costs to other states of using subsidies to lure jobs away;
While business subsidies provide a greater short-term boost to state job growth, early
childhood programs provide a greater long-term boost, as participants enter the
workforce;
From a national perspective, all three early childhood programs provide earnings effects
that are greater than their costs, with ratios of earnings effects to program costs ranging
from 2.5 (NFP) to 3.0 (Abecedarian) to 3.8 (pre-kindergarten for all), while business subsidies have a ratio of earnings effects to program costs of only 0.65;
If implemented at full scale, nationally, in an ongoing manner, by 2088 the three early
childhood programs could be expected to produce substantial numbers of new jobs: NFP
would produce just under half a million, pre-k for all would produce 3.3 million, and Abecedarian would produce 5.3 million; and
While Abecedarian has a moderate ratio of earnings effects to program costs because of
its high cost, it generates by far the most long-term earnings effects, because of the large investment associated with full-scale implementation of this program.14
B. Long-term versus Short-term Gains and the Role of Social Impact Finance
The results of the early milestone Perry, Abecedarian, and Nurse Family Partnership studies convinced policymakers beginning in the 1970s of the importance of early childhood investments. The documented
high economic returns are now well understood and accepted, and contributed to state and federal governments enacting a wide range of child nutrition, health, and education legislation, including Head
Start, Early Head Start, Special Supplemental Nutrition Program for Women, Infants, and Children (WIC), Temporary Assistance for Needy Families (TANF), and Individuals with Disabilities Education Act (IDEA),
and their state counterparts.
The gains these state and federal “macro” policies are attempting to capture, such as reductions in criminal justice costs, are long-term. Pre-k’s impact on teen crime, for example, takes ten or more years
to occur. Though the big gains are long-term, there are near-term “micro” gains that are important. Children with good social-emotional skills acquired in prekindergarten do better in elementary school.

12
Classrooms are more settled, and teachers are more productive. School operating costs are lower --
fewer children are assigned to special education and fewer have to repeat grades.
Though near-term gains have been referenced and understood for many years, they are not part of the
policy calculations that determine resource allocation. As a consequence, as a nation, we almost certainly under-invest in youth human capital in general and early education in particular. As a further
consequence, we have too many young adults who are not prepared for global competition and too few
who are. Quantifying the actual fiscal cost savings that result from investing in young, particularly at-risk, children will allow a more accurate “pricing” or valuation of early investment.
If we could find a way to capture near-term micro gains, we would invest more in youth human capital and overtime have a stronger workforce and more sustainable fiscal situation. It is here that social impact
finance may be able to serve a constructive role. Pay-for-success programs may be able to fund programs that can realize specific micro gains such as lower public school special education costs.
C. Organization of this Report
Chapter 1 reviews social impact finance and early childhood interventions with the highest scientific statistical quality. The famous milestone parent training, child abuse treatment, and prekindergarten
research studies make it clear that certain interventions do yield significant long-term government cost savings and revenue gain benefits. However, the benefits most cited are realized well beyond the time
horizon of most investors, and the benefits accrue to numerous local state and federal government
agencies, making it unlikely that enforceable contracts could be devised to monetize the gains. Moreover, in the years since the studies were done, interventions provided by government and private institutions
have proliferated. Children now are exposed directly and indirectly to the effects of several kinds of interventions. This makes it very difficult to separate the effects of one intervention from another and
answer the most basic question – exactly how much should an agency rebate to a SIB issuing institution for financing a specific intervention.
Chapter 2 provides a very basic overview of special education in the U.S. and reviews the findings of the
landmark primary studies of prekindergarten effects on special education assignment. It concludes that none of the major primary studies can serve as benchmarks for SIB programs. Each SIB program will
require a local benchmark study of pre-k costs and special-ed savings that documents the effects, captures distinct characteristics of the area served and can be used to calibrate contracts.
Chapter 3 presents a simplified example of a PKSE social impact bond arrangement intended to overcome
inefficiencies in market allocations of capital to youth human capital development. The example does not include grade retention or English language learning (ELL) service costs, though like special education
costs, research shows quality early learning can significantly reduce these costs also. To aid understanding, a specific sample program is presented based on the findings of the Pennsylvania Pre-K
Counts study and cost information from the Bethlehem Area School District in the Lehigh Valley of
Pennsylvania.

13
Chapter 1
Pay-for-Success Social Impact Finance and Evidence-based Early Child Development
In this chapter we summarize what is meant by social impact finance and review the landmark early
childhood program research that suggests social impact finance might be usable. The chapter lays out seven major obstacles to using social impact finance in child development and identifies ways to address
the obstacles.
Social impact finance can mitigate capital market inefficiencies that cause America to under-invest in human capital. As Lance Lochner and others document, credit and capital market constraints in education
are pervasive and have profound effects.15 These constraints in early youth investment are the result of a lack of understanding of the high returns on early childhood investment and the absence of developed
ways to capture those returns. Unlike college and graduate-level education, there are no developed private markets for assets that finance early learning or other early childhood interventions. This
financing gap can be partially filled with social impact assets.
Social Impact Bonds (SIBs) are one kind of social impact finance. They pay for specific intervention services that reduce government costs or increase revenues. SIB earnings and repayment come from the
government’s monetary benefits, according to the terms of the contracts among the SIB participants.
A. Review of “Pay for Success” Social Impact Finance
Over the past two decades philanthropic and profit-seeking investment to generate social and
environmental benefits has moved from the periphery of investing to become a mainstream financial activity that takes many forms. An important triggering component was the development and use of
equity-like income-contingent instruments to finance higher education. Miguel Palacios, a Kauffman-ReadyNation working group member, describes these efforts in Investing in Human Capital: A Capital Markets Approach to Student Financing.16 Income-contingent contracts and pay for success social impact finance have merged and now constitute one of the most promising ways for philanthropic and private
capital to improve the life circumstances of millions of people.
Philanthropic Investment
George Overholser, a working group member and cofounder of Third Sector Capital Partners, provides on
his firm’s website a thorough review of philanthropic pay for success finance. Third Sector is a leader in this area of investment. The five basic elements of social impact finance, as identified by Third Sector,
are:
1. Government contracts for social service programs to address a societal need.
2. Philanthropic funders provide the financial resources to pay for the program.
3. Government, service providers and philanthropic funders agree upon targeted social outcomes.
4. Independent evaluators monitor program performance.
5. Should the program achieve the agreed metrics, the government will be able to reimburse the initial funders for their "invested capital" and reinvest in the program. If the program fails to meet the targeted outcomes, the state agencies are not obligated to repay the investors.
Under the Pay for Success construct, performance risk is transferred to the philanthropic funders. An additional attraction is that often these programs drive fiscal savings along with improved outcomes for the targeted population.17
For-Profit Investment
Much of the expanded interest in social impact finance is an explicit recognition that philanthropy or government alone cannot solve the problems that confront modern society. Instead, combinations of
philanthropic and for-profit private capital are needed to scale-up solutions that work. Two reports,

14
Monitor Institute’s Investing for Social and Environmental Impact: A Design for Catalyzing an Emerging Industry,18 and Bridges Ventures and The Parthenon Group’s Investing for Impact: Case Studies Across Asset Classes,19 provide descriptions of a wide range of applications and finance structures.
Specific strategies for using philanthropic and for-profit social impact bonds (SIBs) to reduce government operating costs and improving productivity are described in Jeffrey Liebman’s Social Impact Bonds: A Promising New Financing Model to Accelerate Social Innovation and Improve Government Performance.20
The transactions described in all these reports range from simple straight bond financing to complex mixes of equity, debt, working capital lines of credit, and loan guarantees. The examples include
investments in microfinance, community development, and clean technology.21
Bridges Ventures and the Parthenon Group emphasize that --
Governments and charities do not have sufficient capital or the complete skills set required to solve the world’s pressing challenges. At the same time, the recent economic crisis has shaken established orthodoxies about the risk and return profiles of traditional investments. The Impact Investment sector is emerging as a partial answer to the twin challenges that these two realities present: Impact Investment unlocks substantial capital to build a more sustainable and equitable global economy while allowing for diversification across geographies and asset classes.22
As suggested in the chart below, adapted from the Monitor Institute’s report Investing for Social and Environmental Impact: A Design for Catalyzing an Emerging Industry23, philanthropic and for-profit capital combined in effective financing strategies.
None Desired Early Childhood Effect High
No
ne
Des
ired
Fin
anci
al R
etu
rn
Hig
h
For-Profit InvestorSpace
Blended Incentives and Capital
Philanthropic Investor
Space
Financial Return Floor Social Return Floor
Segments of Social Impact Investors
The Monitor Institute highlights an example of blended finance sources involving the New York City
Acquisition Fund for affordable housing construction. In this example, private foundations made $32 million in low-interest, subordinated loans, a city-based charitable trust invested $8 million on similar
terms, and commercial banks raised more than $160 million through placing commercially priced debt.24
The example shows how capital from socially-motivated sources and for-profit sources can be effectively blended in transactions where socially-motivated investors accept below-market risk-adjusted rates of
return to enable a transaction to offer returns that are attractive to profit-motivated investors. This symbiosis allows profit-motivated investors to obtain market rates of return and socially-motivated
individuals and institutions to leverage their capital to achieve significantly more social impact than they
could if investing on their own.
Where will the money come from? Monitor Institute lists these sources of social impact capital25 --
Family offices of wealthy individuals
15
Clients of private banks
Private foundations that partner with investment banks, development finance institutions, and
other foundations
Private equity funds that aim to provide growth capital profitably to businesses that generate
social and environmental returns
Mutual funds that have dedicated a portion of their assets to social impact finance
Pension funds and sovereign wealth funds
Corporations
Governments
B. Applying Social Impact Finance Concepts to Early Child Development
Historically, society has spent on child and family health, nutrition, safety and education because it contributed to increased growth and rising per capita income. Investing in human capital development
clearly makes economic sense, and as the Upjohn Institute’s Timothy Bartik documents in his book, Investing in Kids: Early Childhood Programs and Local Economic Development, doing so in the earliest
years of life makes especially good sense.26 When compared with other tax subsidized development
projects such as sports stadiums or office parks, Bartik’s analysis makes clear that investing in early childhood programs is as good or better than any other strategy to strengthen regional economic
development and per capita income growth.
Though frequently talked about as a very recent innovation, for-profit forms of social impact finance have
many similarities to a wide variety of public finance techniques used for centuries to pay for constructing
roads, bridges and other regional and national capital assets. Transportation infrastructure is part of a nation’s wealth, part of the capital stock on which future growth is built. The fitness, education and
teamwork skills of a population are also a form of national wealth, in fact, the most important form of national wealth.
Social Impact Bonds
Because of government’s significant involvement in human capital development, the perspective
examined by Jeffrey Liebman is particularly pertinent. Liebman is the Malcolm Wiener Professor of Public
Policy John F. Kennedy School of Government, Harvard University. In his report Social Impact Bonds: A Promising New Financing Model to Accelerate Social Innovation and Improve Government Performance,
Liebman focuses specifically on reducing government costs and increasing productivity and describes a generic “social impact bond” or SIB.27
SIBs are investment arrangements that pay for specific intervention services that result in government
monetary cost savings and/or revenue increases. The investment returns and repayment of capital are paid from the government’s monetary benefits, according to the terms of contracts among the parties
participating in the SIB arrangement.
In Liebman’s analysis, a standard SIB is characterized by:
1. Payment of return on invested capital to investors
2. Repayment of invested capital
3. Government cost savings or revenue increases cover the full cost of the projects or services
financed by the SIB
The reasons for using performance-contingent or “Pay for Success” funding include28
1. Improving performance and lowering costs.
2. Payment is based on achieving outcome targets.

16
3. Focuses government agencies and social service providers on achieving program objectives and
improving performance in a way that is transparent to taxpayers.
4. Accelerating adoption of new solutions.
5. Government pays only if program delivers on its promised impact.
6. Shifts risk of failure (and of wasting taxpayer dollars on programs that don’t work) to private
sector.
7. Can also break down the budget silos that hinder investment in prevention.
8. More rapid learning about what works and what doesn’t.
Schematically, standard SIB financing looks like this29:
Standard SIB arrangements require an agreement that establishes the SIB-issuing organization itself and
separate enforceable contracts between pairs of all four of the major participating parties.
the bond-issuing organization and the government
the bond-issuing organization and private investors, and
the bond-issuing organization and service providers
Section C: Uncertainties in applying Social Impact Bond ideas to early childhood investment
In discussing Leibman’s work and attempting to apply his framework to early childhood programs, working group members identified at least seven uncertainties or obstacles to the parties being willing or
able to participate in a standard SIB arrangement.
1. Unclear returns on the SIB investment project or intervention
2. Long delays between the SIB intervention investment and the return
3. Inability to link government cost reductions or revenue gains solely to the intervention being
financed by the SIB organization
4. Multiple government jurisdictions with mobile young families and irreconcilable political differences
5. Resistance to paying SIB investors from public cost savings or revenue gains
GovernmentBond-Issuing Organization
PrivateInvestors
Service Providers
3. Performance-based payments
1. Workingcapital
4. Repayment and ROI fromperformance-based
payments
2. Funding foroperating costs

17
6. Limited capacity to administer and evaluate SIB program performance
7. Incentive inconsistencies among the parties to the SIB financing
Using SIBs to pay for early childhood care and education requires addressing all the uncertainties listed.
Looking at each in detail, working group members made these observations --
Unclear returns Before a government entity like a school system can agree to turn over cost
savings resulting from an early childhood intervention, school officials have to be very certain the cost
reductions and/or revenue increases are actually going to occur. Benchmark studies are needed to project the amount of cost savings or revenue increases that can reasonably be expected. These
benchmark studies need to be scientifically rigorous, thorough, current and usable in court.
Benchmark projections must be statistically sound. They must be thorough in the sense that they cover
all the categories of children affected by the intervention, show that the intervention led to the cost reductions, and rule out possibilities that the cost reductions are the result of other interventions or
unrelated factors. They have to be based on current data and be revised as new data becomes available.
Moreover, because contracts have be judicable, the cost-saving projection studies on which the contracts are based have to be of a quality and nature to be admissible in court.
No benchmark study can be 100% accurate, and no school official will be willing to turn over 100% of projected cost savings. However, if a projection model meets thoroughness, timeliness and judicial tests,
uncertainty about the accuracy of its projections can possibly be handled by compromises. In one
compromise, school officials might agree to turn over only a portion of the projected savings to the bond-issuing organization in order to have a margin of error to be sure they do not cut spending below what is
justified by the intervention. A 10% margin may be enough. If so, officials will be comfortable committing to allocate 90% of the projected savings back to the SIB bond-issuing organization. If projected
investment returns are high enough, the bond-issuing organization and private investors may judge that 90% is acceptable. In another compromise, costs savings in one year are audited and confirmed in the
following year and are turned over to the SIB-issuing organization only after the savings have been
certified. Delays of six to nine months are possible. Combining the two compromises would involve immediate payment of a portion of projected savings, full payment of certified savings, and repayment if
the immediately paid portion proves to have exceeded actual savings.
Long delayed returns High-quality parent training, prenatal health, home visitation, dental care,
infant and toddler care and early education programs, all have been shown to have compellingly high
potential net benefits. Almost all the benefits, however, require several years to be realized. For these returns to be investible and subject to a contract, it must be possible to monetize them; that is, it must
be possible to see them expressed in lower operating costs or higher revenues and redirected from the government to the bond-issuing organization according to the terms of an SIB contract.
The longer it takes for economic benefits to be monetized, the more up-front capital is needed from
private investors to support delivery of the services. More capital over longer periods of time means investors and the bond-issuing organization have to put up more money and bear higher risks. More
money is needed because the services have to be operated for a longer period with no interest or capital repayments to investors. More risk is involved because there is no near-term confirmation to investors
that the services actually work in the ways projected.
It has long been known, for example, that high-quality preschool services for very low-income three and
four year-old children, significantly reduces the likelihood that they will become involved in crime in
adolescence. It has also been conclusively shown that the reductions in state and local criminal justice costs are substantial and represent very high net economic benefits.30 Furthermore, monetizing the cost
reductions appears to be feasible. The problem has been this: the decade between when the preschool services are provided and when the child would engage in teen crime has been too long for
organizational and investor uncertainties to be overcome.
A more feasible approach is to focus on benefits that can be monetized in shorter time periods. As we discuss at length below, it has long been known that high-quality preschool reduces the rate of

18
assignment to public school special education programs, of physically healthy, low-income children.
Because special education service costs are quite high relative to preschool costs, the benefits appear to be attractively large. They also appear to be monetizable within 36 to 48 months. In fact, the success of
a preschool program in reducing special education costs may be evident when the children take kindergarten school-readiness tests, only 12 to 25 months after preschool services begin. This
combination of factors may make SIB programs that provide funds for preschool in order to reduce
special education costs, attractive. This feasibility is the main focus of this report.
Inability to link This challenge is an aspect of the first two but is so important, it deserves a
separate discussion. The question is this: can the effects of several different intervention programs be separated? For example, lower special education costs, lower grade retention, higher third-grade reading
scores and higher high school graduation are all outcomes that have been documented to result from program services as diverse as Nurse Family Partnership home visiting, prekindergarten, Early Head
Start, Head Start, Part B and C Individualized Education Programs (IEPs) and Individual Service Plans
(IFSPs) and Response to Interventions (RTIs) provided under the Individuals with Disabilities Education Act (IDEA) and Section 504 of the Americans with Disabilities Act (ADA). If a population of children has
been exposed to some or all of these programs in one way or another in the early years of their lives, how can the effects of one program be separated from the others? Consider for example a SIB program
developed to finance home visiting for infants and toddlers and paid for by government cost savings or
revenue increases resulting from later higher high-school graduation rates. If the children in the program also receive dental screenings and preschool educations, can effects of home visiting be separated from
effects of other services with sufficient clarity to serve as a basis for a contract that funds only home visiting?
Multiple jurisdictions For SIB arrangements to work, those who receive services paid for by a SIB have to stay in the jurisdictions of the governments which are parties to the contract. For example, if
officials in County A sign a SIB contract with a bond-issuing organization to provide dental screening
services in the county, all goes well as long as all the children enter and attend the county’s schools. If any of the children move to County B, the benefits of the SIB’s dental services will accrue to county B’s
government. County B will enjoy cost savings and/or revenue increases from the SIB investment, but because it is not a party to the SIB contract, it will not redirect a portion of the gains to the bond-issuing
organization and the investors will receive lower than projected returns on their investments.
Persuading County B to sign the SIB dental screening contract may be complicated by the administrative costs of identifying and tracking the SIB children that move in from County A, possible differences in
views on the merits of the particular service or doubts about the projected benefits, competitive political considerations, and even incentives to free-ride on County A’s investments.
Resistance to paying SIB investors Most people have no objections to a county or state issuing
bridge or harbor construction bonds and paying interest and principle on the bonds. However, some people have strong initial negative reactions to the idea that investors will somehow profit from providing
early care and education services to young children. These reactions arise from the fact that the largest government benefits arise from services directed at the poorest children in a community, and helping
these children seems more like charity – something that prosperous people should want to do without being paid. For people who see things this way helping such children is philanthropy, and being paid to
help them is in some sense morally wrong. This sense of moral wrong might be reduced or eliminated if
more children are helped. As we explain below, there is ample room for “philanthropic investors” in SIB financing. By leveraging their capital with for-profit capital, philanthropic investors can help far more
children. In addition, because of the strongly local nature of early childhood programs, setting up early childhood SIBs may not be possible without strong local philanthropic support.
Limited capacity Poor communities would likely benefit most from SIB financing. However,
these communities have limited ability to set-up, administer and evaluate SIB performance. Remote rural areas, Native American reservations, many budget-strapped cities, migrant worker camps, etc. have little
or no capacity to establish and oversee SIB arrangements. Capacity may also be prohibitively limited in average small towns, cities and even middle-income counties.

19
Generally, the poorer and more at-risk the children are in a given jurisdiction, the greater the benefits are
for that jurisdiction’s government from helping those children. Accordingly, the need for philanthropic capital is even more critical in limited capacity communities. A combination of disciplined philanthropic
infrastructure funding and entrepreneurially provided technical assistance consulting might be ideal for successful and rapid establishment of SIBs generally, and especially in limited capacity regions.
Incentive inconsistencies In the best of all possible worlds, the goals of philanthropists,
investors, non-profit administrators, and governments would consistently be focused on maximizing human capital productivity. Children and their families would be the highest priority at every level of
society and government. But such planets have not been discovered yet. Instead, we have governments riven with election priorities and political polarization. We have non-profit administrators pressured by
fundraising needs and hampered by every kind of resource limitation. We have investors focused mainly on short-term profits and quarterly corporate reporting schedules, and philanthropists occasionally
distracted by “flavor-of-the-month” contributing but mainly trying to do what is best amid thousands of
pressing needs and very limited information.
Historically, this cacophony had one benefit. It provided multiple perspectives. These perspectives
revealed different ways to solve problems and provided incentives to act on the most promising. The same is true now. The art of successful investment, philanthropy and governance is making good use of
different perspectives and constructively harnessing the energy from conflicting incentives.
Conflicting incentives can be crippling however. County A’s and B’s elected leaders may be from competing political parties. Longer-term economic development considerations would guide County B’s
leaders to make a policy choice to co-sign a SIB contract with County A’s leaders. However, short-term political considerations may prevent this. Add to the incentives of competing political parties the latent
and always present incentive to free-ride on a neighbor’s good works, and the result is near-certainty in the short-term that County B will not cooperate with County A in an early childhood SIB arrangement.
D. Criteria for Social Impact Bond Success in Financing Early Childhood Services
Drawing together Jeffery Leibman’s analysis and working group discussions and findings, implementation of successful Social Impact Bond programs for early childhood care and education, require the following –
Strong state and local business, philanthropic and government support
Rigorous statistical demonstrations of projected benefits for a clearly defined group of children
Sound legal foundations for SIB issuing organizations
Clear enforceable contracts among SIB participating entities
Bonds or other SIB assets with terms familiar to investors
Good working relationships with the investment underwriting, institutional and foundation investor sectors
(1) Support of state and local leaders, including philanthropic, business and church leaders, early care
and education providers, and government officials --
Because of the strongly local nature of early child care and education and because the benefits of quality
early childhood programs accrue mainly to local and state governments, local and state support is essential. In fact, without it, no SIB program can be expected to be successful or attractive to potential
SIB investors.
Business
The starting point for setting up an early childhood SIB is business leadership. As we discussed earlier,
well-run early childhood programs increase regional growth, job creation and per capita incomes. If local and state business leaders do not see benefits to their sustained commercial success, SIB success is
impossible.

20
Earlier, we explained what it takes to overcome the seven main obstacles to SIB effectiveness. Of those,
community business leaders may be the only people who can reliably address four of the most serious. Business leadership is needed to overcome the political resistance from multiple government jurisdictions,
oversee SIB program establishment and administration, resolve conflicting incentives among SIB participants, and show simply that it is morally acceptable for investors to make money on investments in
programs that improve school readiness and third-grade reading and math scores; reduce grade
retention, adolescent crime and teen pregnancy; and increase high school graduation rates.
Business support for early childhood programs generally is increasing. ReadyNation works across the
country to mobilize business to advocate for early childhood. During the June 2010 to June 2011 budget period, non-partisan business leader contacts with decision makers resulted in crucial policy victories.
Business leaders in nine target ReadyNation states made more than 4,300 contacts with state and local policy makers this year, educating them on strategic investments in young children, including: 1,470 in-
person meetings, 2,209 letters, 195 calls, and 513 emails. 31
Examples of specific ReadyNation state initiatives during 2010 and 2011 include:
Alabama
A new statewide advisory committee was assembled, chaired by two business leaders, and charged with developing a plan for pre-k for all. The group’s policy recommendations will be finalized and presented to policy makers prior to the 2012 legislative session. The advisory committee is engaging the National Institute of Early Education Research, with support from the Business Council of Alabama, to conduct a cost analysis for fully funding pre-k in Alabama. Colorado Executives Partnering to Invest in Children (EPIC) was launched in January 2010, securing the participation of six convening organizations and eight CEOs to sit on EPIC’s CEO Roundtable. EPIC successfully led a lobbying effort to create a statute establishing the Early Childhood Leadership Commission, which is comprised of 35 members from across the state. The commission is charged with developing a statewide database to track investments made in children, prenatal to age five, and making legislative recommendations to improve systems and expenditures for young children. The group also developed and deployed an employer toolkit to provide low-cost/no-cost options for employers to participate in family-friendly policies, targeting children from birth to age five.
Pennsylvania
During the budget season many Early Learning Investment Commission (ELIC) members met with legislators and key staff to discuss the importance of investing in early learning. A difficult budget season resulted in many programs being dramatically impacted, but for the second year in a row the early childhood programs sustained only minimal cuts (3 percent). The legislative meetings were an effective strategy, the importance of which is reflected in the story of one ELIC member. This Commission member met with a high-ranking legislator to highlight the business community’s commitment to investments in early learning and explain that the programs should be protected because of the outcomes they achieve. Because of this timely meeting, the legislator protected early childhood programs from further cuts during the intense budget
New Mexico
In response to an effort initiated at the Partnership-funded Summit on Early Childhood Investment in November 2009, business leaders working with the state’s Early Childhood Development Partnership contributed to the enactment of the New Mexico Early

21
Childhood Care and Education Act, which created an Early Learning Council and secured funds for improving early education services.
Oregon
Business leaders met multiple times with legislators on both sides of the aisle, testified twice, appeared at a press conference with the governor, and had op-eds printed in two major papers. The state expanded its pre-k program and created a new Early Learning Council.
Tennessee
New governor Bill Haslam embraced pre-k as a strategy for reducing the achievement gap. As a down payment on his commitment to pre-k, the governor recommended (and the General Assembly approved) a small increase in pre-k funding for FY 2012.
Vermont
With the support of the Vermont Business Roundtable, the General Assembly passed legislation that lifts the state’s cap on pre-k enrollment. This major policy win will provide incentive for local Vermont towns to expand pre-k to reach all three- and four year-olds.
Virginia
Company lobbyists, including those for Capital One, Dominion Power, and the law firm Williams and Mullen, included pre-k in their list of issues to raise in meetings with state policy makers. When House Appropriations Committee members attempted to cut funding for home visiting, business leaders in 29 districts contacted their legislators. Ultimately, the program received a 25 percent increase over FY 2010.
National
National business organizations such as the Manufacturing Institute, an affiliate of the National Association of Manufacturers, the National Association of Workforce Boards, and the American Chamber of Commerce Executives, took specific positions supporting strong early childhood programs to strengthen U.S. workforce development and economic competitiveness. There were also new endorsements of early childhood initiatives from 23 state and local business organizations, including the Oregon Business Council, Associated Oregon Industries, the Oregon Business Association, Vermont Businesses for Social Responsibility, Lake Champlain Chamber, Greater Burlington Industrial Council, New River Valley Economic Development Alliance, Verizon of Roanoke, Virginia Business magazine, and the Virginia Chamber of Commerce.32
Philanthropy
At the level of cities and counties and also to a considerable degree states, business and philanthropy are
inextricably linked. For hundreds of years philanthropy has been used by business leaders to strengthen
their regions economically, steadily improving them socially and culturally, in an effort to persuade good families and businesses to locate in these regions.
Business leader support is essential for SIB success, and in the initial stages, this support takes the form of philanthropy, leavened with thorough knowledge of local conditions and hard business judgment. As
discussed earlier in this report, while there may be instances in which early childhood SIBs are entirely

22
feasible investments without philanthropic support, their attractiveness to for-profit investors, will require
involvement of philanthropic capital, at least in the early years of their development.
There are many roles philanthropic capital can play in developing SIB structures.
First, there is a need for funding to pay for the initial benchmark effect projection studies, SIB contract drafting, and up-front administration and performance evaluation set-up costs.
Second, there is a need for longer-term capital to fund the provision of services until government savings
occur. For services that require five to ten years before their effects are evident in government costs and revenues, the amounts of initial service-provision capital could be quite large. If regular performance
evaluation shows that the service is year-by-year achieving projected goals and for-profit investor confidence in the project is rising, it will be possible to fund more of the service with non-philanthropic
capital, in much the same way private equity investments are financed with capital calls based on success in meeting performance goals.
Third, philanthropic capital can be used to make SIBs more attractive to for-profit investors. Working in
tandem with for-profit institutional investors such as pension funds and university foundations, philanthropic capital can be invested at below-market rates to better assure that for-profit investors
obtain market rates, and take first-loss positions in the liability structure to de-risk SIB transactions and increase their attractiveness to for-profit investors. By blending the incentives and capital of philanthropic
investors with those of for-profit investors, philanthropists can increase impact of their resources many
times over.
And fourth, philanthropists can fund development of the state and national SIB infrastructure and
technical assistance towns, cities, counties and states will need. Until SIBs are well-understood and broadly used, even the most prosperous communities will find it difficult to set them up. Examples and
standards for benchmark effects-projection studies, contracts, and administration and evaluation procedures are needed. People will be needed who are able to travel and help governments and investor
groups set up and operate SIBs. The people who do this work ideally should be entrepreneurial in
outlook. If much of their compensation is performance based, their focus will be on successful SIB establishment and operation and eventually on financial market recognition and acceptance.
In whatever role philanthropic investors chose to play, they will receive from SIBs something they rarely get from other philanthropic efforts – concrete reports on the dollar-for-dollar return on their
investments.
Government
Investor and broader market acceptance of SIBs will depend on local and state acceptance. The due-
diligence research of investors and investment institutions will detect if regional leaders in business, banking, philanthropy, churches, provider groups, and government support the SIB project. If the
support is strong, investor interest will be strong.
Because money to pay interest on and ultimately redeem early childhood SIBs comes from state and local government institutions, such as public schools, acknowledgement of SIB liabilities under state law is
especially desirable. In fact, an essential element of statewide SIB infrastructure may prove to be state law that sets down basic principles and standards for early childhood SIBs established at the city and
county level.
(2) Strong statistical foundations for the claim that a particular intervention will result in monetizable
government cost reductions and/or revenue increases --
The first step in any SIB arrangement is showing statistically that the probability is very high that a specific intervention for a clearly defined group of children will cut costs or increase revenues. This study
benchmarks the entire arrangement. At the heart of an SIB arrangement is an agreement by a government entity to make a predetermined payment to the bond-issuing organization if a service
provider carries out an intervention in a precisely determined way. But how much exactly is the
government required to pay? This amount is determined by the benchmark statistical study. This study

23
projects the amount of cost savings or revenue increases that can be reliably expected from the
intervention. Randomized control trials are the best way to benchmark projected benefits, but other techniques including case projection and statistical projection trials may be acceptable. In any case,
nothing can happen until agreement is reached on how to conduct a reliable benchmark study if one is not already available.
(3) Sound legal foundation for the SIB-issuing Organization
SIB-issuing organizations can take many forms -- non-profit or for-profit corporations, 501c3s, limited partnerships, or trusts – and the form may change as the SIB program moves from one stage to the
next. At the outset, a SIB organization may consist of nothing more than an agreement among a group of business leader/philanthropists to conduct the needed benchmarking studies. If the studies indicate an
SIB project is feasible, the group may set up an initial 501c3 to prepare needed contracts and SIB organization arrangements. If the SIB government and provider participants are agreeable with the
contract terms, and a survey of possible investors reveals good interest, the group may proceed to set up
a permanent SIB-issuing organization in whatever form is best under state and federal law.
(4) Clear and enforceable contracts between SIB participants that lock in the responsibilities of the
bond-issuing organization, investors, government, and service providers –
SIB arrangements are structures of interlocking commitments and performance agreements. It is simple
to say, “A government entity commits to pay savings or revenues to a SIB issuer if a service provider
carries out an intervention in a precisely described way”. But in that sentence are thousands of questions and contingencies, multiple layers of administration and performance evaluation, and uncertainties. What
exactly is the intervention service provider expected to do? How will the SIB issuer or the government know whether what was expected, is actually done? Who evaluates the performance of the service
provider – the SIB issuer, the government entity, the investors, or someone else? And at the next level up, who is responsible for evaluating the service evaluator? What is done about failures to perform as
expected at the provider level or at the SIB issuer level?
What is done if new data shows that the intervention should be modified for greater effectiveness? Who decides? How much disclosure of SIB operations and performance is optimal for investors, researchers,
government officials and the public? What is done if a service provider ceases operations, or an investor is unable to meet investor requirements? What is done if the SIB issuer becomes illiquid or insolvent?
Who is responsible for accident, injury or damages arising from SIB issuer or provider activities or
misrepresentations?
All these and many other questions and contingencies need to be addressed in the inter-party contracts
in order for the SIBs to have the market credibility needed to be attractive to investors.
(5) Bond instruments with familiar terms comparable to those of other forms of debt and equity in the
marketplace –
Media coverage of markets often emphasizes novelty and newness. The reality is, more than anything else, markets want familiarity. For this reason, to assure market acceptance, SIB issues need to have
terms and conditions that are comparable to widely traded corporate and government liabilities.
Even with a “familiarity” requirement, the range of possible SIB issuance is very broad. SIBs can receive
capital in the form of outright gifts and loans, and in exchange for issuances of permanent common stock, dividend-paying preferred stock, and bonds of varying terms, maturity and seniority. And
depending on state law, interest on SIB bonds may be exempt from state and federal taxation.
(6) Strong financial relationships with investment bankers, wealth managers, and philanthropic leaders –
Ultimately, the success of a SIB project depends on performance – marketing to individual investors and
philanthropists, to investment institutions and foundations, and to domestic and foreign asset managers. Strong relationships with underwriting institutions and investor communities are vital. Those relationships
will be helped significantly if during the design and early implementation stages, underwriting and
investment advisory institutions are consulted regularly and involved in asset design. Also if small “proof

24
of concept” financings are done, as a way of demonstrating to local families, business leaders, and
government officials the effectiveness of an intervention in reducing government costs, it would be good to share the results of those projects with prospective financial partners.
Ideally SIBs should be scalable, enabling establishment of similar SIB programs in thousands of communities across the country. If scalability is evident, early childhood entrepreneurs, technical
assistance consultants, philanthropic leaders, investment bankers, and others will be persuaded to
allocate their time and energy to provide the human infrastructure necessary to establish a nationally and even globally attractive asset class. Scalability also assures diversification. Investors who like the idea and
returns on early childhood SIBs will naturally prefer to invest moderate amounts in a large number of SIBs rather than a large amount in a few.
C. Early Childhood Interventions That Might Be Paid For with Social Impact Bonds
Many early childhood interventions have high documented microeconomic returns. As discussed in
Chapter 1, whether they can be financed with SIBs depends on many things, but especially on whether
their returns are monetizable within investable time frames. This chapter reviews three of the most researched and promising interventions and for each discusses important promises and challenges to
social impact finance. The interventions include home visitation, child abuse and neglect prevention and treatment, and prekindergarten. Under the right circumstances, all of them could be financed with SIBs.
Home Visitation
Home visitation programs match parents, especially first-time low-income mothers, with trained professionals who help during the mother’s pregnancy and birth of the baby through age three. The
professionals provide information and assistance. They help parents learn how to care for their children and themselves. As a result of home visitation programs, families are better able to care for infants and
toddlers, and children are safer, healthier, better prepared to learn and more likely to become successful adults.33 Home visiting professionals partner with expectant mothers to encourage them to receive
regular prenatal care, stop smoking and drinking, and to eat balanced diets, in order to reduce the risks
premature and low-birthweight births.
The evidence on home visitation program outcomes shows that the programs improve child success
outlooks and reduce local and state health and criminal justice costs.34 Some of these cost savings occur within 45 months and could be monetized through contracts with state and federal agencies.
Every low birthweight or preterm birth, for example, costs states between $28,000 and $40,000 in
medical care and other related costs.35 Research on New York State’s Healthy Families home visiting program showed that mothers who received home visits were half as likely to deliver low birthweight
babies as mothers who were not enrolled.36 Because these cost savings are so specific and identifiable, monetizing them through carefully constructed SIB contracts should be possible. This would be especially
so if a contract with the federal government’s Medicaid program could be devised. Accordingly, it should
be possible to structure investor-attractive SIBs that finance home visiting to reduce state and federal low birthweight and premature birth costs.
As we discuss at greater length below, special education costs states on average between $5,000 and $15,000 per year. Research shows that home visiting programs strengthen toddler pre-literacy skills and
raise later achievement test scores. At age six, children, whose mothers participated in the Memphis Nurse Family Partnership home visiting program, had higher cognitive and vocabulary scores than those
in a control group, and at age nine, these children had higher grade point averages and achievement test
scores in reading and math in the first through third grades.37 It is quite possible that home visitation programs reduce public school special education costs. Documenting the effect of these programs will be
difficult because it may not be statistically possible to separate the effects of home visitation and other interventions, including a wide range of IDEA related disability interventions and Title I funded preschool,
to mention just the federal programs.

25
Child abuse and neglect prevention
Child abuse and neglect profoundly threaten child health and lifetime wellbeing and increase government costs in the short and long term. SIB arrangements based on reducing long-term costs probably cannot
meet the three tests of social impact finance feasibility: statistical proof, contract monetization, and investor time horizon. SIB programs based on short-term cost reduction, however, may be feasible.
In 2010, there were more than 450,000 substantiated or indicated victims of child abuse or neglect in the
United States, resulting in 1560 child deaths, of which nearly 80% were children less than four years old.38 Research findings indicate that abuse and neglect increase a child’s risk of negative consequences
across multiple domains of function and development, including psychiatric, social, behavioral, academic, and interpersonal functioning.39 In dealing with the results of child abuse and neglect, governments incur
significant near-term and long-term costs.
Long-term costs
Research based on documented histories of childhood abuse and/or neglect show that victims have lower
levels of education, employment, earnings, and fewer assets as adults, compared to matched control children. The cost to government and society in general is estimated to be in the billions of dollars. In
their 2010 study, Janet Currie, Department of Economics, Columbia University, and Cathy Widom, Department of Psychology, University of New York, found that adult incomes could be increased more
than $15 billion through effective abuse and neglect intervention:
There is a 14% gap between individuals with histories of abuse/neglect and controls in the probability of employment in middle age, controlling for background characteristics. Maltreatment appears to affect men and women differently, with larger effects for women than men. These new findings demonstrate that abused and neglected children experience large and enduring economic consequences. …The effects on education, employment, occupation, earnings, and assets are large and consequential. For example, the results presented here suggest that the experience of maltreatment reduces peak earnings capacity (these adults are measured close to this point in their life cycles) by about $5,000 per year. Cumulated over a lifetime, this is a large loss. These economic consequences are also large relative to the effects of physical health problems such as chronic conditions and activity limitations on employment that have been estimated in other studies (Currie & Madrian, 1999). Thus, in addition to their social and psychological costs, the approximately one million substantiated cases of child abuse and neglect per year have significant costs in terms of foregone adult economic productivity.
…the Nurse Family Partnership Program (Olds et al., 1999) has demonstrated that home visits by professional nurses that start in infancy and continue through age 2 can reduce the incidence of substantiated cases of maltreatment by 50%. At a cost of about $4,000 per child, the steady-state cost of providing this service to all children would be about $14 billion per year (assuming that there are roughly 3.5 million children born each year). Some might object to paying $4,000 for prevention, whereas the economic benefit would not be obtained until the children reached adulthood. However, based on our findings, if we assume that saving a child from abuse or neglect increases his or her earnings by $5,000 from ages 18 to 60, the present discounted value of these higher earnings in the year of birth would be $30,800. If we further assumed that the intervention would reduce the number of substantiated case of maltreatment from approximately 1 million to 500,000, then the value of the intervention in terms of increased earnings alone would be $15.4 billion, which would more than offset the cost of the intervention program. 40
Clearly abuse and neglect have long-term cost and revenue effects on governments. But can early
childhood programs reduce these costs or replace lost revenues? The answer is clearly yes, but the questions the working group asks are those that bear on the feasibility of social impact finance: is there
an early childhood intervention that can be statistically shown to be the source of government cost

26
savings or revenue increases; is the cost savings or revenue increase monetizable; and can the gains be
captured within standard investor time horizons?
The answer to these questions is probably no in each instance. First, there are no statistical
methodologies that can convincingly demonstrate in advance that the Nurse Family Partnership will be the sole source of Currie and Widom’s projected $15.4 billion of increased personal earnings. Second, the
cost and revenue gains to local, state and federal governments are so diffuse it is hard to imagine how
they could be monetized within a set of SIB contracts. And third, the gains arise well beyond the five to ten-year horizon of most investors. For these reasons, using social impact bond arrangements based on
long-term gains to pay for abuse and neglect interventions is not promising.
Short and Medium Term Costs
To assess near-term cost feasibility, the working group focused on the findings of the Coalition on for Evidence Based Policy. The Coalition is a nonprofit, nonpartisan organization that seeks to increase
government effectiveness through the use of rigorous evidence about what works.41 In the area of early
childhood, the Coalition identifies four programs as having strong evidence-based proof of effectiveness – the Nurse Family Partnership, the Triple P System and the Perry and Abecedarian preschool programs. All
are based on randomized control trial evidence, the highest statistical standard possible. The Coalition rated the Nurse Family Partnership and Triple P System as “top tier” and “near top tier” respectively.42
We will quickly review the NFP program and the Triple P System. In the next section of the report, we
will examine the Perry and Abecedarian preschool programs and focus specifically on the effects of preschool on subsequent public school special education costs.
Nurse Family Partnership
As described by on the Coalition website:
The Nurse-Family Partnership program provides nurse home visits to pregnant women with no previous live births, most of whom are (i) low-income, (ii) unmarried, and (iii) teenagers. The nurses visit the women approximately once per month during their pregnancy and the first two years of their children’s lives. The nurses teach (i) positive health related behaviors, (ii) competent care of children, and (iii) maternal personal development (family planning, educational achievement, and participation in the workforce). The program costs approximately $12,500 per woman over the three years of visits (in 2010 dollars).43
By the highest standards of statistical evidence, the NFP program reduces near-term government costs associated with incidences of child abuse and neglect.44 The evidence shows that the NFP program
results in:
39% fewer healthcare encounters for injuries or ingestions in the first two years of life among
children born to mothers with low psychological resources
56% reduction in emergency room visits for accidents and poisonings in the second year of the
child’s life 48% reduction in state-verified reports of child abuse and neglect by child age 15
50% reduction in language delays by child age 21 months
5 point increase in language scores on a test with a mean of 100 and standard deviation of 15
among 4-year-old children born to mothers with low psychological resources
67% reduction in behavioral and emotional problems at child age 6
9 percentile increase in math and reading achievement test scores in grades 1-3 among children
born to mothers with low psychological resources
All of these effects reduce near-term local, state and federal government costs, and are certainly strong enough statistically to underpin an SIB program. However, because the effects emerge within a wide
range of non-profit and for-profit institutions, and state and federal government health, welfare and

27
education agencies, monetizing the effects in SIB contracts would be challenging. If contracts could be
negotiated, achieving the cost savings would be well within the time horizons of most investors.
Triple P System
Quoting from the Coalition website:
The Triple P (Positive Parenting Program) System is a system of parenting interventions for families with children ages 0-8, which seeks to strengthen parenting skills and prevent dysfunctional parenting, so as to prevent child maltreatment and emotional, behavioral, and developmental problems. The System emphasizes five core principles of positive parenting: (i) ensuring a safe, engaging environment; (ii) promoting a positive learning environment; (iii) using assertive discipline; (iv) maintaining reasonable expectations; and (v) taking care of oneself as a parent.
…The trial randomly assigned 18 South Carolina counties to (i) a group that implemented the Triple P System county-wide for families with at least one child under eight years old; or (ii) a control group that provided usual county services without implementation of Triple P.
The counties were selected for the trial based on their population size (mid-sized, between 50,000 to 175,000 people). None had prior exposure to Triple P. All were rural or semi-urban, with an average African American population of 31% and poverty rate of 15%. The study estimated, based on a survey of service providers in the Triple P counties, that between 9,000 and 13,500 families in Triple P counties received Triple P services during the two-year study period.
…These are the county-level effects on all of the primary outcomes that the study measured at the two-year follow-up. All effects shown are statistically significant at the 0.05 level unless stated otherwise.
25% reduction in the rate of substantiated child maltreatment (11.6 cases of substantiated child maltreatment each year per 1,000 children age 0-8 in Triple P counties vs. 15.5 cases in control counties);
33% reduction in the rate of out-of-home placements – e.g., in foster homes (3.4 out-of-home placements each year per 1,000 children age 0-8 in Triple P counties vs. 5.1 in control counties);
35% reduction in the rate of hospitalizations or emergency room visits for child maltreatment injuries (1.3 each year per 1,000 children age 0-8 in Triple P counties vs. 2.0 in control counties). This effect was significant at the 0.10 level, but not the 0.05 level.45
Like the NFP program, financing Triple P services via a SIB arrangement has promising possibilities. The
evidence is strong. The time frame is acceptable. The key challenge is negotiating SIB contracts with the diverse institutions within which the cost savings emerge.
Prekindergarten
As described on the Coalition for Evidenced-Based Policy website:
The Abecedarian Project, initiated in 1972, provided educational child care and high-quality preschool from age 0-5 to children from very disadvantaged backgrounds (most raised by single mothers with less than a high school education, reporting no earned income, 98% of whom were African-American). The child care and preschool were provided on a full-day, year-round basis; had a low teacher-child ratio (ranging from 1:3 for infants to 1:6 for 5-year-olds); and used a systematic curriculum of “educational games” emphasizing language development and cognitive skills. The average annual cost of the intervention was about $13,900 per child (in 2002 dollars).

28
Some of the participating children also received a school-age treatment in grades 1-3, in which a home-school resource teacher served as a liaison between the child’s home and public school, and encouraged parents to work with their children each day on individualized curriculum packets. (As noted below, this school-age component was found to have only a marginal effect on most outcomes.) …
At age 21, the study found that educational and life outcomes for the children receiving the child care/preschool treatment (groups (i) and (ii)) were much superior to outcomes for the children not receiving the child care/preschool (groups (iii) and (iv)). The results are summarized below. By contrast, the school-age treatment alone had only a marginal impact (results not summarized here).
Impact of child care/preschool on reading and math achievement, and cognitive ability, at age 21:
An increase of 1.8 grade levels in reading achievement An increase of 1.3 grade levels in math achievement A modest increase in Full-Scale IQ (4.4 points), and in Verbal IQ (4.2 points).
Impact of child care/preschool on life outcomes at age 21: Completion of a half-year more of education Much higher percentage enrolled in school at age 21 (42 percent vs. 20 percent) Much higher percentage attended, or still attending, a 4-year college (36 percent
vs. 14 percent) Much higher percentage engaged in skilled jobs (47 percent vs. 27 percent) Much lower percentage of teen-aged parents (26 percent vs. 45 percent) The study also found suggestive evidence of a reduction in criminal activity, but
because of the small sample size, most of these effects were not statistically significant.46
Perry Preschool
As described by the Coalition:
The Perry Preschool Project, carried out from 1962 to 1967, provided high-quality preschool education to three- and four-year-old African-American children living in poverty and assessed to be at high risk of school failure. About 75 percent of the children participated for two school years (at ages 3 and 4); the remainder participated for one year (at age 4). The preschool was provided each weekday morning in 2.5-hour sessions taught by certified public school teachers with at least a bachelor’s degree. The average child-teacher ratio was 6:1. The curriculum emphasized active learning, in which the children engaged in activities that (i) involved decision making and problem solving, and (ii) were planned, carried out, and reviewed by the children themselves, with support from adults. The teachers also provided a weekly 1.5-hour home visit to each mother and child, designed to involve the mother in the educational process and help implement the preschool curriculum at home. The program’s cost was approximately $11,300 per child per school year (in 2007 dollars). …
Educational outcomes for preschool group (versus control group): At age 27 follow-up
Completed an average of almost 1 full year more of schooling (11.9 years vs. 11 years).
Spent an average of 1.3 fewer years in special education services — e.g., for mental, emotional, speech, or learning impairment (3.9 years vs. 5.2 years).
44 percent higher high school graduation rate (65 percent vs. 45 percent)
Pregnancy outcomes for preschool group (versus control group): At age 27 follow-up

29
Much lower proportion of out-of-wedlock births (57 percent vs. 83 percent). 50 percent fewer teen pregnancies on average (0.6 pregnancies/woman vs. 1.2
pregnancies/woman)
Lifetime criminal activity for preschool group (versus control group): At age 40 follow-up 46 percent less likely to have served time in jail or prison (28% vs. 52%). 33 percent lower arrest rate for violent crimes (32% vs. 48%)
Economic outcomes for preschool group (versus control group): At age 40 follow-up 42 percent higher median monthly income ($1,856 vs. $1,308). 26 percent less likely to have received government assistance (e.g. welfare, food
stamps) in the past ten years (59% vs. 80%)47
The long-term benefits of preschool pose the same problems for social impact financing as the long-term
effects home visitation and child abuse and neglect programs.
There are short-term effects, however, that offer important possibilities. In a 2000 study of 13 state prekindergarten program performance evaluations, Walter Gilliam and Edward Zigler found that the
programs resulted in significant child cognitive and social skills development, higher performance on achievement tests in the early grades and in some cases, reduced retention rates, producing substantial
cost savings for school systems.48
In studies spanning four decades, including analysis of the Abecedarian, Perry Preschool, and Chicago Child Parent programs, and state programs in Louisiana, Pennsylvania and Utah, repeatedly find that
quality prekindergarten can significantly reduce public school special education assignments. Because the costs of special education are quite high relative to prekindergarten and because the costs emerge within
one educational institution and any savings would begin to be realized within 24 months, it may be
possible to finance prekindergarten services with SIB arrangements that monetize public school special education costs.

30
Chapter 2
Prekindergarten and Public School Special Education Costs
Chapter 1 highlighted that the challenge for SIB organizers is not finding high-return interventions to
invest in. The challenge is getting a government agency to sign an agreement that commits the agency to give back a portion of the intervention gains. The question will always be, how much, in dollars
calculated to the penny, must the agency give back? How can the agency be sure it is not giving back
more than it should and uneconomically and unfairly reducing what is available for other programs? Answering these questions requires SIB organizers to answer these questions: (1) Can research
satisfactorily affirm that a particular early childhood intervention with a clearly identified group of children yields government cost savings or revenue increases? (2) Can those cost savings or revenue increases be
monetized via enforceable contracts between a social impact bond (SIB) issuing institution, a workably few government agencies, and the providers of the intervention services? And (3) Can the cost savings or
revenue gains be monetized within timeframes and risk levels that investors find acceptable?
Chapter 1 also clarified that the famous milestone parent training, child abuse treatment, and prekindergarten research studies document that certain interventions do yield significant long-term
government cost savings and revenue gain benefits but cannot be used as the basis for structuring a SIB financing. Separate up-to-date benchmark studies are needed for each SIB arrangement. Because in the
years since the studies were done, interventions provided by government and private institutions have
proliferated. Children now are exposed directly and indirectly to the effects of several kinds of interventions. This makes it very difficult to separate the effects of one intervention from another and
answer the most basic question – exactly how much should an agency rebate to a SIB issuing institution for financing a specific intervention.
This chapter provides a very basic overview of special education in the U.S. and reviews the findings of the landmark primary studies of prekindergarten effects on special education assignment done over the
past four decades. It concludes that none of the major primary studies can serve as benchmarks for SIB
programs. Every SIB program will require a local benchmark study of pre-k costs and special-ed savings that captures the distinct characteristics of the area served.
Since the publication in 1996 of Steven Barnett’s book Lives in the Balance49, and affirmed in 2000 in “Long Term Benefits of Participation in the Title I Chicago Child-Parent Centers” 50 by Arthur Reynolds and
others, it has been well known that pre-k’s largest near-term effect on school systems is reducing special
education costs. The idea that the cost reductions are enough pay for the pre-k that generated them was put in doubt by the Chicago Child-Parent Centers (CPC) studies culminating with the 2002 “Age 21 Cost-
Benefit Analysis of the Title I Chicago Child-Parent Centers”.51 These studies of children born in 1980 and in elementary school in the late 1980s formed the basis of a series of secondary studies in the early-
2000s that sought to estimate the benefits to states that would follow from funding pre-k programs.
These secondary studies to a considerable extent carried forward the CPC finding that the cost of pre-k for the Chicago children in the 1980s was greater than the present value of the special-ed cost savings
and strengthened a view that the ratio of pre-k cost to special-ed benefit is negative.
This view began to change when several state prekindergarten program evaluations, particularly
Pennsylvania’s Pre-K Counts study, revealed much larger effects on special-ed costs than indicated in the CPC research. The reasons for the larger effects include higher special-ed costs, better pre-k curricula,
and a variety of other institutional and statutory factors. This chapter explores these possibilities in
discussing the milestone and more recent studies in preparation for Chapter 3’s presentation of models for SIB financing of regional pre-k programs.
A. Brief Review of Special Education in the United States
In the 1960s a quiet revolution took place regarding how to teach children with disabilities. Reflecting the
emergent spirit of civil rights and the education research that led to experiments like the Abecedarian and
Perry Preschool projects, views shifted from placing children with disabilities in isolated classrooms away from “normal” children to seeing child disabilities as treatable and as consisting of components that can

31
be addressed with a variety of interventions. From the enactment of the Education for All Handicapped
Children Act in 1975, through the Individuals with Disabilities Education Act (IDEA) re-authorization in 2004, special education became a complex array of state and federal policy and law that now addresses
disabilities from birth through age 21 and focuses on child and student intervention responses.52 Special education in the United States is now best understood as a system of early identification of child needs,
interventions to address them, assessments of responses to these interventions, and further assessments
and interventions, all focused on bringing each child fully into the mainstream of education and society.
State and Federal Law
U.S. state and federal laws require special education services to be given to children birth to age 21, inclusive. The services are provided under state education laws and the federal 1990 Americans with
Disabilities Act (ADA) and the Individuals with Disabilities Education Act of 2004 (IDEA) and state laws that implement them. ADA is primarily a civil rights act and through section 504’s accessibility
requirements, it provides important education support for children with disabilities. IDEA is specifically an
education act and through its Part B and Part C provisions it provides education and developmental support from mainly age 3 through 21 (Part B)53 and mainly from birth to age 3 (Part C) for children and
adolescents with one or more of 13 categories of disability. These services are provided via an Individual Education Program (IEP) designed by school special education teachers working closely with parents and
others. IDEA Part C addresses the needs of children with disabilities, including child abuse and neglect,
from birth to age 3, and in some cases can be extended to age 5. These services are provided pursuant to an Individualized Family Service Plan (IFSP). Part C awards grants to states to provide early
intervention services to eligible children and to their families.
In addition, individual states have laws to provide special education for children with disabilities within
their borders. These laws vary greatly depending on the strength of education mandates in their constitutions and the education commitments of elected leaders. Over the past 20 years, state law for the
most part has been aligned with the requirements of federal law. These state and federal laws define
what we generally refer to as “special education”.
Population of Pupils Served
The population of students served under IDEA appears to have grown at nearly twice the rate of the general education population. According to the New America Foundation, the main driver of increased
cost was the addition of “developmental delays” an IDEA-eligible disability category in 1997.
During the twenty-five year period between 1980 and 2005, the IDEA population increased by 37 percent, while the general education population grew by only 20 percent. Moreover, students served under IDEA today account for about 14 percent of the total education population, up from about 10 percent in the 1980s. The sudden increase in the percentage of the student population served by IDEA can be attributed to multiple factors. A significant portion of the increase in special education enrollment can be attributed to greater identification of students with disabilities from birth to age five and these students’ participation in IDEA preschool and early intervention services. Another reason for the increase is that Congress widened the definition of "disabled" under IDEA in 1997 to include the population of "developmentally delayed" children age three to nine. 54
Under Part B and Part C, the term “developmental delay” means a delay in one or more of the following
areas: physical development; cognitive development; communication; social or emotional development; or behavioral development.55
National Special Education Spending
Our understanding of total national special education spending is hampered by the fact that the most
recent national survey is for the school year 1999-2000. Nevertheless, according to the New America
Foundation’s Federal Education Budget Project, special education spending has increased at a much faster rate than general elementary and secondary education spending.

32
During the 1999-2000 school year, the most recent available national information, the United States spent $50 billion on special education "support" services and an additional $27.3 billion on regular education for disabled students ($77.3 billion in total). Special education support costs accounted for 12.4 percent of the $404.4 billion total spending on elementary and secondary education. With regular education expenses included, students with disabilities accounted for 19.1 percent of total national elementary and secondary education spending in 1999-2000, an increase of 13 percent from the 1977-78 school year.56
Federal funding for special education under IDEA for school year 2011-2012, will be $12.64 billion, of which $11.58 billion is dedicated to IDEA Part B state grants.57
IDEA authorized the federal government to fund up to 40 percent of a state’s annual per pupil expenditure (APPE) to pay for special education. Amendments to IDEA in 1997 changed the funding rules
to include a state’s resident population and student poverty. In 1977-78, the federal allocation was 5.1
percent of the national APPE. By 2002-03, federal aid to states for special education was estimated by the U.S. Department of Education to equal 15.5 percent of the national APPE.58
Between 1994-95 and 1998-99, total special education enrollment increased by 11 percent and total state spending increased by 24 percent, adjusted for inflation. Per student spending on special-ed increased by
12 percent. As a percent of the total student population, special education students were 12 percent
1994-95, and 13 percent in 1998-99. Between 1994-95 and 1998-99, total special education enrollment increased by 11 percent and total state spending increased by 36 percent.59
There are large differences between state spending on regular and special education. In the 42 states which reported to the U.S. Department of Education in 1994-95, total regular education expenditures
ranged from $3,431 per student in Utah to $9,175 per student in New Jersey. The average total expenditure per student was $5,610. In 1998-99, total expenditures per student ranged from $3,732 in
Utah to $10,153 in New Jersey. The average expenditure per student across all of the included states
was $6,465.60
Per Pupil Special Education Spending
Special education appears to cost about twice as much per student on average as regular education. Analysis by Thomas Parrish at the American Institutes of Research concludes:
Special education is financed through a complex combination of federal, state, and local monies using a variety of formulas. Although the federal government does not systematically collect data on special education spending due to the wide range of accounting and reporting procedures used by individual states, there have been several federal-funded attempts to collect such data. Based on the most recent national information available, in the 1999-2000 school year, per pupil special education spending averaged $12,474, as compared to $6,556 for non-special education students. This is more than double (in constant dollars) the average special education expenditure from the late 1960s, when it was first calculated.61
The difference in the 1999-2000 school year between $12,474 per pupil special ed cost, and $6,556 per
pupil regular ed cost, was $5,918 -- the cost of special-ed alone. Rising enrollment, not rising per pupil costs, has been the primary driver of special education spending. It is true service costs associated with
some high-need disabilities have increased. However, the main expansion of the children with disabilities
population has been in the lower-cost developmental disability categories.
To get the current 2012 cost, we need to adjust it by inflation. Education inflation is a complex subject,
but adjusting costs by the Consumer Price Index, yields usable estimates and is sufficient for the purposes of this report.62 Assuming elementary and secondary education costs rose during the last 10
years at a rate equal to the Consumer Price Index, the annual per pupil cost of special-ed alone is
$8,162.

33
This $8,162 number includes spending for disabilities of all kinds, disabilities ranging from deafness,
blindness, and severe neurological disorders such as cerebral palsy, autism, to transient developmental delays in otherwise healthy children.
Decline in Special Education Assignment
Since 2004, the number of children and young adults in special education has declined somewhat.63
Because of limited state and federal data, there are no conclusive reasons for the decline. It may reflect
many factors – strong economic conditions through 2008, more prekindergarten and improved school readiness, effects of early childhood interventions of many kinds, reductions in special education
assignment standards, and improvements in special education teaching, to mention just a few.
Exhibit 3.1
Number of Children by Disability
The categories of disabilities that qualify a child to receive special education services under IDEA are:
Autism, Blindness, Deafness, Emotional Disturbance, Hearing Impairment, Mental Retardation, Multiple Disabilities, Orthopedic Impairment, Other Health Impairments, Specific Learning Disabilities, Speech or

34
Language Impairment, Traumatic Brain Injury, Visual Impairment and Developmental Delay.64 The
number of children in special education nationally by disability is shown below.
Exhibit 3.2a
IDEA Disability Category Number of Children
Nationally by Disability
1. Specific learning disabilities 2,604,234
2. Speech or language impairments 1,481,246
3. Mental retardation 473,101
4. Emotional disturbance 435,026
5. Multiple disabilities 127,978
6. Hearing impairments 78,220
7. Orthopedic impairments 65,527
8. Other health impairments 641,782
9. Visual impairments 28,911
10. Autism 289,383
11. Deaf-blindness 1,454
12. Traumatic brain injury 23,726
13. Developmental delay 358,450
All disabilities 6,609,038
Source: U.S. Department of Education,
Office of Special Education Programs, Data Analysis System (DANS),OMB #1820-0043: "Children with Disabilities Receiving Special Education Under Part B of IDEA, 2007, Data updated as of July 15, 2008.

35
The Pennsylvania Build Initiative’s 2005 report “The Cost Savings to Special Education from Pre-Schooling
in Pennsylvania” presents the number of Pennsylvania children in special-ed by disability type.65
Exhibit 3.2b
Children in Special-ed by Age
The number of children in special education by age is shown below in Exhibit 3.3. This is a very important
chart. Of the children receiving special-ed services by age-year in 2007 about 250,000 were under age 5. Through age 9, another 250,000 children received services, bringing the maximum number of children in
special-ed by age-year to about 500,000. In high-school, the number by age-year declines, probably significantly as a result of dropping out of school. These are static “net” numbers. Some 6 year-old
children who received services when they were 3 and 4 years old no longer needed them when they were 6 years old and do not appear in the data for 6 year olds. Others who were found to need services,
for example, when they were 7, continued to need the services, and appear in the data, for example, at
age 12.
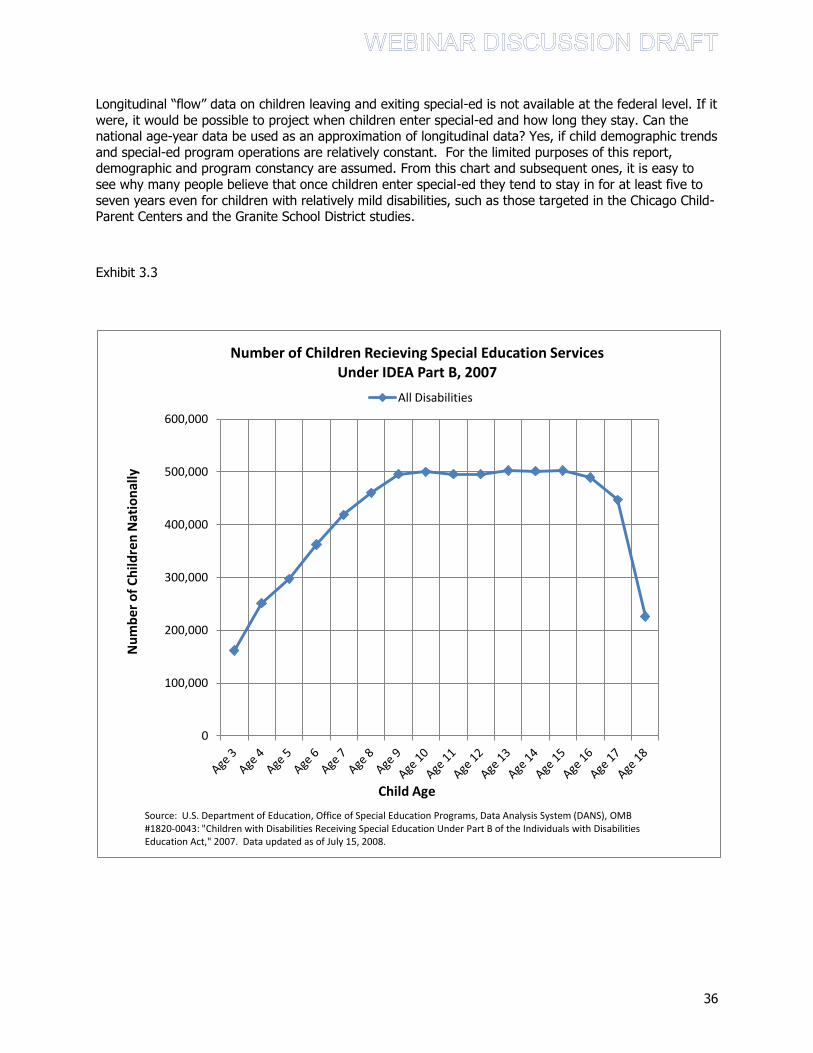
36
Longitudinal “flow” data on children leaving and exiting special-ed is not available at the federal level. If it
were, it would be possible to project when children enter special-ed and how long they stay. Can the national age-year data be used as an approximation of longitudinal data? Yes, if child demographic trends
and special-ed program operations are relatively constant. For the limited purposes of this report, demographic and program constancy are assumed. From this chart and subsequent ones, it is easy to
see why many people believe that once children enter special-ed they tend to stay in for at least five to
seven years even for children with relatively mild disabilities, such as those targeted in the Chicago Child-Parent Centers and the Granite School District studies.
Exhibit 3.3
0
100,000
200,000
300,000
400,000
500,000
600,000
Number of Children Recieving Special Education Services Under IDEA Part B, 2007
All Disabilities
Nu
mb
er o
f C
hild
ren
Nat
ion
ally
Source: U.S. Department of Education, Office of Special Education Programs, Data Analysis System (DANS), OMB #1820-0043: "Children with Disabilities Receiving Special Education Under Part B of the Individuals with Disabilities Education Act," 2007. Data updated as of July 15, 2008.
Child Age

37
Cost of Disabilities by Child
National data on the cost of special education broken down by type of disability is not available, and
availability at the state level appears to be very limited. It is well documented that children with serious
permanent disabilities require more special-ed services and cost more than developmentally delayed but otherwise healthy children.66 Using Pennsylvania data the Build Initiative’s 2005 study presented the
disability cost by child shown in Exhibit 3.4a Column 1 shows a ‘best estimate’ average and column 2 a lower bound estimate taking account of sampling error. 67
Exhibit 3.4a

38
Because of work underway within the Kauffman-ReadyNation working group that focuses on Northern
Virginia, and following the path shown by the Build Initiative report, data was gathered on costs per child by type of disability for Alexandria City, and Arlington, Fairfax, Prince William and Loudoun counties for
2010. As shown below the evidence tends to affirm that more severe disabilities cost more per child.
Exhibit 3.4b
IDEA Disability Category
Northern Virginia Average
County Cost Per Disability Per
Student Per Year
1. Specific learning disabilities $15,060
2. Speech or language impairments $12,627
3. Mental retardation $18,935
4. Emotional disturbance $17,122
5. Multiple disabilities $21,363
6. Hearing impairments $23,478
7. Orthopedic impairments $21,118
8. Other health impairments $11,152
9. Visual impairments $23,526
10. Autism $17,653
11. Deaf-blindness $22,843
12. Traumatic brain injury $15,009
13. Developmental delay $15,521
Source: Virginia Department of Education at
the request of the authors
Weighting the Northern Virginia cost data by the number of children nationally yields an estimate of the
percent distribution of special education costs by disability, as shown below.

39
Exhibit 3.5
IDEA Disability Category
Special-Ed Cost by Disability as a %
of Total Special-Ed Costs per Pupil
by Disability, Based on Northern VA Cost Data Weighted by National
Data on Number of Pupils by Disability
1. Specific learning disabilities 39.54%
2. Speech or language impairments 18.86%
3. Mental retardation 9.03%
4. Emotional disturbance 7.51%
5. Multiple disabilities 2.76%
6. Hearing impairments 1.85%
7. Orthopedic impairments 1.40%
8. Other health impairments 7.22%
9. Visual impairments 0.69%
10. Autism 5.15%
11. Deaf-blindness 0.03%
12. Traumatic brain injury 0.36%
13. Developmental delay 5.61%
Total cost for all disabilities 100%
Northern Virginia is a large, demographically complex region, with many nationalities and in some areas
very high percentages of low-income, at-risk children. The cost per disability data for the five regions that
make up Northern Virginia (Alexandria City and Arlington, Fairfax, Loudoun, and Prince William counties) can be usefully combined with national data on the number of children assessed as having each kind of
disability. The result, shown above, provides a preliminary indication of how much in aggregate various disabilities cost and an indication of the cost structure for other complex urban areas.
In the Chicago Child-Parent and the Granite School District studies, which will be discussed in greater
detail below, the disabilities that can be ameliorated by prekindergarten were identified. These disabilities are in bold type in the table above. Neither the Chicago Child-Parent nor the Granite School District
studies claim that pre-k can cure these disabilities. Pre-k can help children with these disabilities function
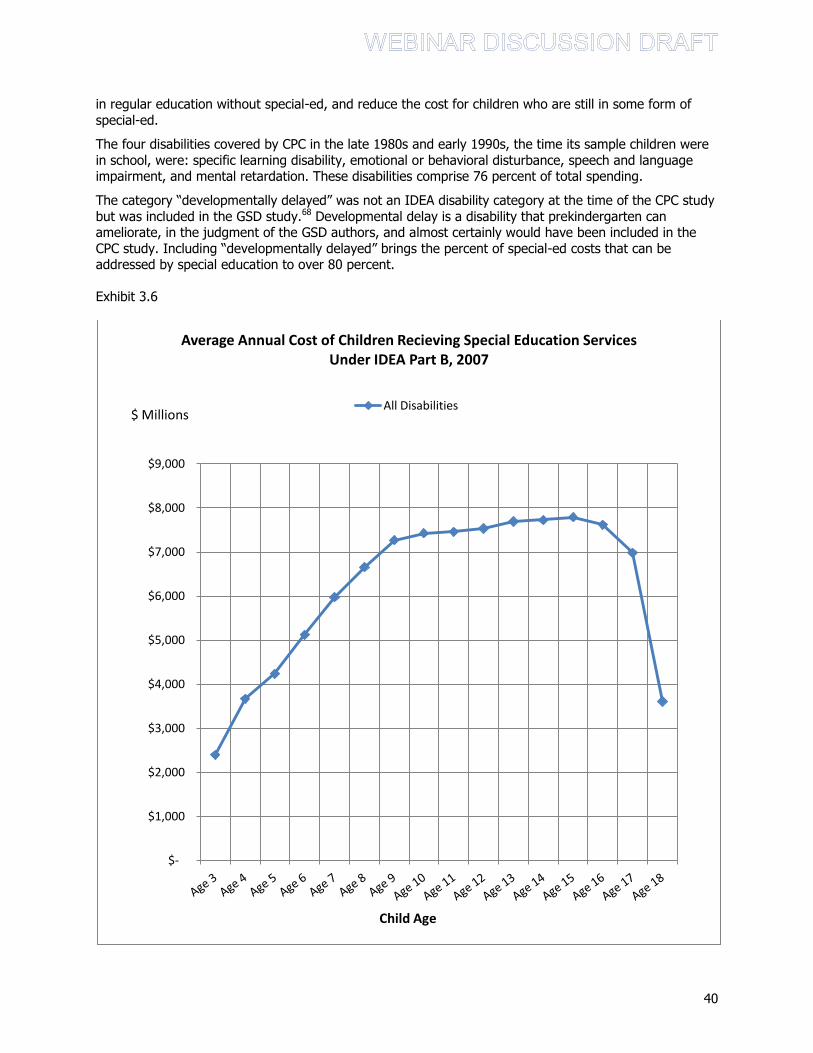
40
in regular education without special-ed, and reduce the cost for children who are still in some form of
special-ed.
The four disabilities covered by CPC in the late 1980s and early 1990s, the time its sample children were
in school, were: specific learning disability, emotional or behavioral disturbance, speech and language impairment, and mental retardation. These disabilities comprise 76 percent of total spending.
The category “developmentally delayed” was not an IDEA disability category at the time of the CPC study
but was included in the GSD study.68 Developmental delay is a disability that prekindergarten can ameliorate, in the judgment of the GSD authors, and almost certainly would have been included in the
CPC study. Including “developmentally delayed” brings the percent of special-ed costs that can be addressed by special education to over 80 percent.
Exhibit 3.6
$-
$1,000
$2,000
$3,000
$4,000
$5,000
$6,000
$7,000
$8,000
$9,000
Average Annual Cost of Children Recieving Special Education Services Under IDEA Part B, 2007
All Disabilities
Child Age
$ Millions

41
Exhibit 3.7
IDEA Scope and Processes
States are required by IDEA to identify, locate, and evaluate all children with disabilities within their
jurisdiction who may need special education and related services. To do this, states conduct "Child Find"
searches via medical, community, educational, church and other institution professionals in the state. Parents can also ask the “Child Find” system to evaluate their child.69
Evaluation and Eligibility
All areas related to a child's suspected disability are evaluated. The evaluation is used to determine the
child's eligibility for special education. A group of qualified professionals and the parents come together as an Eligibility team, and together determine if the child meets the qualifications under IDEA as a child
with a disability.70
$-
$1,000
$2,000
$3,000
$4,000
$5,000
$6,000
$7,000
$8,000
$9,000
All Disabilities
CPC and GSD covered disabilities
Child Age
Comparison of All IDEA Disabilities and Those Included in the CPC and GSD Studies
$ Millions

42
Individualized Education Program (IEP)71
Special education services for a child are specified in the child’s IEP. Within 30 calendar days after a child is determined eligible for special education services, the IEP team must meet to write an IEP for the child.
Parents are an integral part of the IEP team and are regarded as contributing members of the team.
Special Education Services
The public school provider of special education services carries out the child's IEP as written, including
accommodations, modifications, and supports that must be provided to the child.
Progress Measurement and Reporting
As a child's progress toward annual goals is measured, parents must be informed as often as children without disabilities.
IEP Review
The child's IEP is reviewed by the IEP team annually, and revised as needed. Parents can make
suggestions for changes and can agree or disagree with all aspects of the IEP. If necessary, additional
testing and an independent evaluation can be provided for at public expense.
Reevaluation
Children are reevaluated at least every three years to determine if the child continues to be a "child with a disability," as defined by IDEA, to determine if the child continues to require specially designed
instruction.
Section B: Effect of Quality Prekindergarten on Public School Special Education Costs
Five decades of research have found that quality prekindergarten significantly reduces public school
special education assignments. A similar span of research shows that nurse home visitation, parent mentoring, from pregnancy through age-three, and programs to prevent child abuse and neglect, also
have significant effects on special education service needs. Separating the effects of these different programs may have been readily feasible in decades past. In contemporary settings, however, especially
complex urban ones, separation will be difficult.
Three Main Methods for Effect Estimation
Researchers have developed what we can call “primary” estimates of early childhood program effects in
three general ways – randomized control trials, case control trials, and statistical projection trials. In each of these approaches a sample of children is identified and statistics about the characteristic of the
children in the sample and about the effects of the program are obtained.
Randomized Control Trial In RCTs, subjects are randomly selected from a population of people, and then from within the sample they are randomly selected to receive one or other of the
alternative treatments under study. The “treatment” group receives the treatment. The other, the “control” group, does not. After the trial, all the subjects are monitored in the same way, and the
result characteristics of the treated and untreated subjects are compared and analyzed. RCTs are
the statistical “gold standard”. They are used extensively in early stage medical and pharmaceutical research, and is the standard the Coalition for Evidence-Based Policy emphasizes.
Case Control Trial In CCTs subjects are identified who have very similar characteristics but fall naturally in the treatment “case” group or the non-treatment “control” group. After the trial, the
results characteristics of the two groups are compared and analyzed. CCTs are used in medical research when true experiments with random assignment are impractical or unethical. CCTs are
also known as “quasi-experimental cohort studies”.
Statistical Projection Trial In SPTs, factors such as income, health, and demographic characteristics, which reliably predict a result are identified. These factors are then used to

43
predict the likely result outcomes for a “treatment” group of subjects. After the trial, the
predicted results and actual results of the treatment are compared and analyzed.
Use of Program Effect Estimates
The results of these three kinds of studies have been extensively used in secondary studies to provide estimates of the costs and benefits of the program to children and to local, state and federal
governments. The Chicago Child-Parent Center case control trial results, for example, have been used to
estimate the costs and benefits of preschool in other states such as California or Arkansas. In these secondary studies, characteristics of the original sample such as child and family social and economic
conditions are compared with those of the secondary sample of children. Using the comparison results, the primary estimates are adjusted to fit the secondary sample.
Because these secondary studies constitute most of what is understood about contemporary program, especially prekindergarten, effects, it is extremely important to appreciate the degrees of separation from
the original research setting and the amounts of slippage that may be involved. Researchers are aware of
the statistical slippage, and to assure credibility and not overstate positive effects, they adopt numerous assumptions that have the effect of making their findings as “conservative” as possible. A risk in layering
conservative assumption on top of conservative assumption is mistakenly concluding that net benefits do not exist when they actually do. The answer to this problem is to conduct new research and determine
with contemporary data and analysis the existence or non-existence of net benefits.
Randomized Control Trial (Classic studies)
In early education research, the two most famous RCTs are the Perry Preschool and Abecedarian Early
Childhood program studies. As noted earlier, they are the only two that meet the evidence standards of the Coalition on Evidence-Based Policy. In both studies, quality prekindergarten reduced special
education assignments by about 50 percent.72
While the results are powerful because they come from randomized control trials and because the
outcomes are statistically significant despite relatively small sample sizes, they cannot serve as
foundations for SIB contracts because they were done almost half a century ago when the laws affecting special education costs and the prevalence of other early childhood programs were very different from
today.
Exhibit 3.8

44
Case Control Trial (Chicago and Louisiana)
Chicago Child-Parent Centers
Of the early learning research comparing the outcomes of program “case” and comparison “control” groups, the most important are those of the Chicago Child-Parent Centers (CPCs). CPC research provides
extensive cost-benefit analyses of an established, large-scale Title I early childhood intervention for
preschool children and their families and finds significant long-term net benefits. The studies use longitudinal data on the life-course development of 1,539 children born in 1980 from low-income families.
The age 21 follow-up was published in 2002.73 The CPC program provided high-quality early learning and “wrap-around” services including home visiting, family support, health screening, reduced class size and
nutrition services for children age 3 to 9.74
Title I refers to the first part of the Elementary and Secondary Education Act, first enacted in 1965 as President Johnson’s "War on Poverty". Title I distributes money to schools and school districts with a high
percentage of students from low-income families. To qualify for funding at least 40% of a school's students must be from families who are “low income” under the United States Census definition. In the
2006-2007 school year, Title I provided assistance to over 17 million students from kindergarten through
twelfth grade. 81% of the funds were given to students in kindergarten through eighth grade. 16% of \the funds went to students in high school. 3% went to children in preschool.75
Exhibit 3.876

45
The “case” and “control” groups in the CPC study match each other in age, eligibility for intervention, and
family socioeconomic status. In the preschool evaluations, the sample consists of 989 children who completed preschool and kindergarten in twenty Child-Parent Centers and 550 low-income children who
did not attend the program in preschool but did participate in a full-day kindergarten program in five randomly selected schools and in several schools affiliated with the Child-Parent Centers, and of these
comparison children, 23% attended Head Start.
The effect of the preschool program was estimated by comparing the performance of the preschool group against the comparison group. Specifically, the CPC study:
…assessed the impact of CPC program participation beginning at age 3 on later well-being above and beyond participation in the “treatment as usual” for low-income children in Chicago in the mid-1980s. The usual services included an enriched all-day kindergarten and, for the most part, no center-based preschool. The effect of the preschool program was estimated by comparing the performance of the preschool group against the comparison group. The effect of the school-age program was assessed by comparing children participating in the school-age program with those not participating in the school-age program regardless of their preschool participation. The effect of the extended intervention was assessed by comparing children with 4 to 6 years of participation beginning in preschool and children with 1 to 3 years of participation at any time.77
Estimates of Special-ed Assignment Rate and Number of Years in Special-ed
The 2002 study found that CPC preschool attendance was associated with a drop in special education assignment from 24.6% for the control group to 14.4% for the case treatment group, and a drop in
number of years through age 18 of special education from 1.43 to .73. In other words, the amount of time non-CPC children were projected to spend in special education from kindergarten through 12th grade
averaged a little over 17 months (1.43 years) and CPC children, a little over nine months (.73 years).
The CPC study’s innovative provision of number-of-years estimates has not been replicated by any of the more recent studies. This need not be a crippling failure if national or state level cost estimates use
actual distributions of the numbers of children in special-ed by year and by disability. Actual distributions such as those in Exhibits 3.3 through 3.7 achieve a similar result by a different means. None of the
studies did, however, and as a consequence would need to be revised to reflect actual distributions
before they could meet first-level SIB program evidence thresholds.
Impact Comparison of Pre-K Cost and Special-ed Cost
The average annual per student cost of two-year CPC preschool was reported to be $6,692.
The cost of special education was the weighted average annual cost per pupil reported by the Chicago
Public Schools in 1994 for four categories: specific learning disability, emotional or behavioral
disturbance, speech and language impairment, and mental retardation. These expenditures are above and beyond the cost of regular education and were calculated to have a present value of $5,971 per
child. And as noted earlier, these expenses probably account for more than 70% of total special education costs.
The special-ed cost savings from CPC, that is, the difference between what special education costs would have been in the 1985-1997 period without CPC preschool and what they actually were, was reported to
be $4,180 per child. This difference was obtained by multiplying the weighted average annual cost per
pupil ($5,971) by the projected amounts of time in special-ed of non-CPC graduates and CPC graduates (1.43 and .73) and subtracting one from the other.78 The critical comparison is between CPC preschool
cost, $6,692, and the resulting present value special-ed savings, $4,180. Clearly the cost of CPC preschool in 1983 and 1984 is not associated with enough present-value special education savings in
1985 to 1997 to justify SIB financing.

46
Several considerations weigh against this conclusion.
First consideration, Arthur Reynolds in a phone discussion and email exchanges explained that great care needs to be taken when using the 1.43 result for non-preschool children. Reynolds provides two reasons,
(1) “The cpc cost is for 1.5 years. It is a half day program. The costs of special ed have increased much more than cpc prek. This strengthens the argument for a sizable reduction in special ed.” And (2), the
1.43 number is the mean of one group of children when it ideally should be the mean of two groups –
non-preschool children who were assigned to special-ed and a very large number of non-preschool children who should have been assigned but were not and were instead held back a grade or received no
special-ed services at all.79 Because this second group is not reflected in the 1.43 average, the average does not represent the entire population of non-preschool children.
Would it make a difference to the present-value comparison if the average were higher, say, 2.5 years, rather than 1.43 years? Yes it does. If the time in special-ed for non-preschool children were 2.5 years,
the comparison would be between spending $6,692 for CPC preschool and present value special-ed
savings of $10,569, rather than only $4,180. This comparison would justify investing in CPC pre-k.
Second consideration, the present value comparison is between the CPC children who received a wide
range of “wrap-around” services in addition to pre-k, and the comparison group of children, 23% of whom attended Head Start, the federal government pre-k program. It is appropriate to ask what the
present value comparison would be if the costs of the “wrap-around” services and the effects of Head
Start services were netted out. The comparison would be more apples-to-apples if CPC pre-k alone were compared to no-pre-k.
Third, in the world of special education a lot has happened to special-ed costs structures in the three decades between now and when the CPC children were entering elementary school. As we can see from
the national distribution of children in special education by year, it is very unlikely that either the 1.43 or the .73 estimate of years in special-ed could be accurate now. If they were, it would mean that many
tens of thousands of children enter and leave special-ed in every year of elementary and secondary
school. The data and anecdotal commentary indicate the opposite. Numerical and anecdotal evidence indicates that the most children enter special-ed in the first three years of elementary school and
continue to receive special-ed services for six or more years.
The question now is would the conclusions be different today. Does CPC preschool reduce Chicago area
special education costs? Are the projected cost savings still only about two-thirds of CPC preschool cost?
Are non-preschool children still staying in special-ed just 1.43 years?
As Reynolds suggested, the research on special-ed treatment costs indicates costs have risen significantly
from the levels that prevailed in the late 1980s and early 1990s when the CPC children were in elementary and high school.80 Moreover, costs vary greatly from one region to another even within one
state. In an analysis for the State of Illinois published in 2010, Thomas Parrish concluded, “…the mean
special education expenditure per special education student across all districts in the State is reported as $10,840, with a standard deviation of $4,543.”81 Costs in the Chicago district are 53% higher than in the
rest of the state, and the city of Chicago’s costs are 133% higher – about $14,480.82
Special-ed costs are up. But are we comparing apples and oranges? Given the complexity of local, state
and federal funding sources and numerous changes in state and federal funding laws, is the $14,480 number today comparable to the $6,692 in the CPC study? With the limited information available, an
answer does not appear possible. But no doubt preschool costs have risen also, and the time spent in
special-ed by children with and without prekindergarten experiences may have gone up or down. Information on these questions needs to be in hand before social impact finance conclusions can be
reached. The Child-Parent Center 20-year follow-up study is simply not sufficient to reach firm conclusions about the usefulness of social impact funding for quality prekindergarten to reduce special
education costs.

47
CPC Results Used Widely in Secondary Studies
The CPC study of children born in 1980 is a source of a generally held view that prekindergarten does not generate enough special-ed cost reductions to underpin a successful social impact finance program. The
CPC results have been widely used to estimate the costs and benefits of prekindergarten in states across the country in secondary studies. Of these perhaps the two most important are the 2004 Washington
State Institute for Public Policy’s Benefits and Costs of Prevention and Early Intervention Programs for Youth83 prepared under the direction of Steven Aos, and the 2005 RAND study "The Economics of Investing in Universal Preschool Education in California" by Lynn A. Karoly and James H. Bigelow.84
Similar studies followed, for example, for Pennsylvania85 and Wisconsin in 200586 and for Arkansas87 and Texas88 in 2006. All adopt a conservative “real world” approach. In the statistical appendix to the
Washington State study, Aos et al describe the difference between “model” and “real world” programs this way:
Model ECE vs. real world ECE programs. As mentioned, some of the existing evaluations of ECE programs have been of pilot or “model” programs. That is, these model ECE programs offer an intensive preschool experience and employ a relatively expensive set of resources. Other program evaluations, on the other hand, are of “real world” programs such as Head Start. These programs have a less intense curriculum and generally cost less than the model programs. An example of a model program is the Perry Preschool Program, which was a focused demonstration program in the 1960s that, in 2003 dollars, would cost $15,270 per student for a two-year experience. An example of a real world program is the Chicago Title I Child-Parent Centers that costs an estimated $7,355 for a one-and-a-half year experience, in 2003 dollars. 89
Because they use CPC’s results on pre-k’s effect on special-ed placement, the Washington State, California, Wisconsin, Arkansas and Texas secondary studies reach similar conclusions about pre-
k’s impact on special-ed costs. Despite substantial changes in special-ed since the mid-1980s,
when the CPC children were in prekindergarten, the secondary studies done in the mid-2000s significantly shaped contemporary thinking on the feasibility of social impact finance.
Louisiana LA-4
The LA 4 case-comparison study suggests a different conclusion. The LA 4 prekindergarten program was
enacted by the Louisiana legislature in 2001. The program was designed to serve four-year-old children
not currently enrolled in publicly funded prekindergarten classes. LA 4 was launched in January 2002, following a successful 2001 pilot program, as part of a statewide strategy to close the achievement gap
between children from less economically advantaged families and their peers from more advantaged families. LA 4 built upon the findings of previous well-known studies and initiated a systematic scale-up
effort to bring high-quality early childhood education and related services to Louisiana’s four-year-olds.90
In 2006 an evaluation of the LA 4 program was done covering the 2001-2 through 2005-6 school years by Center for Child Development at the University of Louisiana at Lafayette. In the evaluation, a “case”
represents a participant in LA 4, and a “control” represents a child with similar characteristics who was not a participant in LA 4. In all, the case sample numbered 23,475 children in five successive annual
cohorts. The “control” sample numbered over 100,000 children who did not attend any prekindergarten program.
The LA 4 evaluation reported in summary:
…at the beginning of the school year, the average early language, literacy and math skills of pre-k children in the state fell within the lowest 20 percent of the national peer group. By year’s end, these children caught up to the national average. Based on data collected from 2002 to 2006, when compared to peers who did not participate in the program, children who attended LA 4:
were as much as 36 percent less likely to be held back in kindergarten; and

48
were as much as 49 percent less likely to be placed in special education through second grade91
Exhibit 3.9
The LA 4 study found significantly stronger effects pre-k on special-ed than the CPC study. However,
before the LA 4 study could be used to evaluate the comparative-cost effectiveness of an actual SIB program, LA 4 findings would need to be adjusted to at least reflect actual year by year data on the
number of children in special-ed. Ideally, it would be adjusted to reflect actual disability data also. This should be possible at state school district levels, if school districts provide accurate data to state
authorities.
Statistical Projection Trials
Statistical projection involves gathering data on the school-readiness of a sample of children, using it to
project the number of children in the sample who will be assigned to special-ed, and comparing the result to actual historical assignment rates of the population from which the sample was drawn. The challenge
in using statistical projections is the risk that researchers, despite every precaution, will be led by
unconscious choices in how data is selected and processed to produce a result that is “favorable”. This challenge has been researched exhaustively.92 Nevertheless, if a study is done with thorough
professionalism, it can provide important insights into possible cause and effect relationships.
Neither of the two studies reviewed below present pre-k special-ed effects that reflect actual state or
district number-of-children in special-ed by year or by disability distributions. They are of particular
interest because they are so contemporary and because they both raise the possibility of being able to pay for special-ed services out of public school special-ed cost savings. Neither of them, however, can be
used in their present form as foundations for SIB organizations for the reasons noted above and for one additional reason. Neither of them takes into consideration outward migration of families with young
children who receive SIB funded pre-k educations. If a SIB arrangement provides a child a quality pre-k

49
education and the child leaves the SIB service area, the special-ed savings the child would generate are
lost to the SIB organization. A statistically sound SIB study needs to include out-migration effects.
Pre-K Counts, Pennsylvania
The largest early education statistical projection trial is the 2006 Pennsylvania Pre-K Counts (PKC) study. It spanned a three year period from 2005-2008 and involved 21 school districts and 10,002 children. The
PKC study found that Pre-K Counts is associated with a decline in the rate of special-ed assignment from
the 21 school’s historical average of 18 percent, to 2.4 percent. The evaluation raised the possibility that Pre-K Counts might result in net government cost savings but went no further.
Pre-K Counts is a public-private partnership among philanthropies and state government departments managed through the Pennsylvania Office of Child Development and Early Learning. The goal of Pre-K
Counts (PKC) was to stimulate the development of an early care and education network which would expand quality options; infuse education into child care routines; set standards for quality, professional
development, and early learning; and serve as a catalyst to create and unify a “system” for prevention
and care for all young children.93
The Pre-K Counts (PKC) program evaluation sought to determine whether the following results, among
others, were achieved:
Acquisition of essential early school success competencies in the PA Early Learning Standards
(PAELS)
Attainment of educationally important “functional” benchmarks of measurable progress (e.g., reductions in grade retention and special education placements; movement from delay to non-
delay classifications; increases in social skills with reductions in challenging social behaviors; >80% attain PAELS; exceeding national normative and reference indicators)94
The evaluation found that 80% of PKC children met critical early school success competencies in the Pennsylvania Early Learning Standards (OCDEL, PAELS, 2005) at transition to kindergarten.
The evaluation also found that the gains of PKC children exceeded the kindergarten transition skills of
same-aged peers on the BSSI-3 national norms in spoken language, reading, math, classroom behavior, and daily living skills. The projected PKC special education placement rate was 2.4%, significantly lower
than the 18% historical spec-ed placement rate of the 21 PKC participating Pennsylvania school districts.95
Regarding pre-k effects on special education specifically, the report says:
One of the most powerful and persuasive “functional indicators” that PKC works is the comparison among the percentages of high-risk children in impoverished school districts who are historically placed in special education at kindergarten/first grade versus the percentage of PKC children who meet special education criteria. For those 21 school district-community partnerships who participated in PKC, the historical special education placement rate is 18.6% (i.e., based on PDE database analysis), specifically, nearly 1/5 of preschool children are placed in special education early in their school lives due to below average and problematic early learning skills and social behavior deficits. The strong result for PKC is that participation in PKC is associated with only a 2.4% special education placement rate.96
The report points out that this rate reduction is consistent with a 5-year longitudinal study done in 2002
of the Heinz Pennsylvania Early Childhood Initiatives (ECI).
From ECI child outcome data compiled in Allegheny County, and Lancaster, York, and Erie, the SPECS team analyzed the historical school district grade retention and special education placement rates. Similar to PKC, the historical rates were approximately 24% for grade retention (grade retention data were unavailable from PDE databases for PKC) and 21% for special education placement. Yet, for children participating in ECI programs,

50
less than 3% and 1% of ECI children, respectively, had poor outcomes at school entry. These comparative data from a decade earlier support the current PKC results.97
To measure pre-k quality and child progress the evaluation team used the following:
Keystone Stars Star Level, aligned with the Early Childhood Environment Rating Scale-Revised
(ECERS-R, Harms, Clifford, & Cryer, 1998) Classroom Assessment Scoring System (CLASS; Pianta, La Paro; & Hamre, 2008) — Modified
Pre-Kindergarten Program Partnership Rubric (SPECS Research Team, 2009)
SPECS Mentoring Monitor (Bagnato & Macy, 2007) 98
To measure school readiness and likely special-ed assignment, the team used:
Basic School Skills Inventory (BSSI-3) (Hammill, Leigh, Pearson, & Maddox, 1998)
BSSI-3 is used to locate children who are at high risk for school failure, who need more in-depth assessment, and who should be referred for additional study. The inventory consists of 137 items and is
based on teachers’ judgments of desirable school performance. Using a 4-point Likert-type scale that
ranges from does not perform to performance indicates mastery, the BSSI-3 provides a teacher rating scale of early abilities in the six areas listed below. Standard scores, percentiles, age and grade
equivalents are reported for each scale. Reliability coefficients are in the .90s for each scale. The BSSI3 provides a quick teacher rating scale of early abilities in six areas:
1. Daily Living Skills—basic knowledge and skills typically required for participation in day-to-day
activities in school 2. Spoken Language—ability to communicate orally
3. Reading—knowledge of print in the form of letters, words, sentences, and paragraphs 4. Writing—abilities and skills directly involved in writing letters, words, sentences, and paragraphs
5. Mathematics—knowledge of numerical concepts and arithmetic operations involved in beginning
mathematics 6. Classroom Behavior—attentiveness, cooperation, attitude, socialization, and work habits
7. Standard scores, percentiles, and age and grade equivalents are reported for each scale. Reliability coefficients are in the .90s for each scale.99
BSSI-3 is said to be an “authentic” measure of school-readiness. According to the report:
…the best way to assess children is through naturalistic observations of children on an on-going basis. Evidence of children’s developmental abilities comes from ongoing structured observations of naturally occurring behavior in natural, everyday settings and routines (home, preschool, community) by teachers and other caregivers (parents, psychologists, aides, and other team members). Structured observation schedules and ratings formats, as well as other teachable moments and informal interactions with the child, enable educators to capture real-life examples of each child’s problem-solving, language, literacy, math, motor, social, and self-skills. Measures which sample real-life behavior in real-life settings are called authentic assessment measures. These types of measures can examine the whole child in their natural learning environment.100
Overall, the Pre-K Counts evaluation found:
At the beginning of PKC, 12% of children from all ethnic groups were classified as at-risk.
At the end of PKC, only 6% of children were still at-risk.
At the beginning of PKC, 21% of children from all ethnic groups were classified as
developmentally delayed and qualifying for early intervention services from the county. At the end of PKC, only 8% of children were still delayed.
19% more children are performing in the typical range at the end of PKC.
Greater than 2 of every 3 children with developmental delays attained a low average to average
level of performance after participating in PKC.

51
Children with developmental delays and serious problems in social and self-control behaviors at
entry showed significant gains (p<.001) in acquiring expected skills for kindergarten at exit.101
Regarding kindergarten readiness, the evaluation found:
6971 children showed at least average age-expected early learning competencies in all skill
domains at transition and entry into kindergarten, and exceeded expected competencies in
spoken language, math, writing, and classroom behavior. Overall, 80% of PKC children met critical early school success competencies in the Pennsylvania
Early Learning Standards (OCDEL, PAELS, 2005) at transition to kindergarten.
The gains of PKC children exceeded the kindergarten transition skills of same-aged peers on the
BSSI-3 national norms in spoken language, reading, math, classroom behavior, and daily living skills.
The projected PKC special education placement rate is only 2.4%, which is dramatically lower
than the 18% historical special education placement rate of receiving school districts
(Pennsylvania Department of Education, Special Education Bureau, 2008).102
As we noted earlier with respect to the LA 4 study, the PKC study estimates alone cannot be used for SIB
cost impact assessments without augmenting them with number-of-years in special-ed, and ideally with disability data also. The sample SIB program presented in Chapter 3 uses Department of Education data
on the number of children in special-ed, as shown in Exhibit 3.3, to adjust the PKC study findings.
Comparable national year-by-year data on disabilities is not available. Such data is available at the state level, and in future research on the seven counties of Northern Virginia, state disability data will be added
to the mix to evaluate SIB financing effectiveness.
Granite School District, Salt Lake City, Utah
The most recent statistical projection study focused specifically on the effects of prekindergarten on special education. This study, done by the Voices for Utah Children (VUC) and Salt Lake City’s Granite
School District (GSD) Preschool Services, is a longitudinal study of the outcomes associated with three cohorts of 3 and 4 year-old children in 11 schools most impacted by poverty and who attended the GSD
Title I prekindergarten program beginning in the 2006-7 school year. In these school districts, 74% of students were eligible for Free and Reduced Lunch (FRL) in the 2007-8 school year. The total number of
children in these cohorts was 737.103 The study found that that GSD prekindergarten is associated with a
reduction in the projected rate of special-ed assignment from 34 percent to about 1 percent.
The Granite School District encompasses 257 square miles in Salt Lake County, Utah, and operates 62
elementary schools, 16 junior high schools, 9 high schools, as well as other special schools and programs. Granite is the second largest district in Utah. Granite is also one of Utah’s largest employers, with more
than 7,500 full and part-time employees.104 The Granite School District has about 70,000 students, of
which over 40% are non-white, about 5,400 students per grade level, and of these 10.9 percent are in special education – about 550 children.105
The GSD study tracked the children in the three cohorts who were deemed most likely to need special-ed services in the first four years of elementary school. The likelihood of special-ed assignment was based
on Peabody Picture Vocabulary Test (PPVT) results. The PPVT evaluates language and vocabulary skills. A PPVT score of 100 is average and a score of 70 is two standard deviations below the mean. Scores 1.5 to
2 standard deviations below the mean are commonly associated with language delays and would qualify
a child for special-ed services.106 The GSD study was feasible because all the children in the study had been systematically given PPV Tests when they were four years old as part of other research.
Over the three years, of the 737 children in the sample 238 (34%) had PPVT scores less than 70 and an average score of 52, fully 3 standard deviations below the mean. However, when in elementary school,
only 7 (1%) needed special-ed services through 3rd grade for the SY06-07 preschool cohort, through 2nd
grade for the SY07-08 preschool cohort, and through 1st grade for the Sy08-09 preschool cohort. In other words, 34% of the sample was projected to be assigned to special education (without any intervention

52
prior to school entry) when the children were assessed for eligibility in elementary school. However,
when actually assessed, only 7 children were found to need special-ed services.107
The GSD study is important because it is the first to actually determine that quality prekindergarten has
special-ed cost reduction effects large enough finance the prekindergarten services needed to generate the reductions.
Exhibit 3.10108
According to the GSD study, the Granite School District provides preschool services in their Title I schools
for a cost of $800 per year for a 3 year old (1/2 day classes, 2 days a week) and $1,500 per year for a 4 year old (1/2 day classes, 4 days a week). Note that these amounts are what the school district provides
in addition to what the federal government provides pursuant to Title I of the Elementary and Secondary Education Act. The amounts do not include Title I funds, grants, or parent co-pays, nor do they include
special education services provided to these children in preschool or any state funds -- Utah currently
does not fund preschool. Accordingly for two years, the cost of preschool per child that can be made part of a state and/or school district SIB contract is $2,300.109
Also, according to the study, the state appropriates an annual amount of $2,577 (in 2010) for non-severely disabled children for special education per child. The study assumes children tend to remain in
special education through high school – 13 years – a total expense of $33,501, which when discounted at
2% gives a present value cost of special education per child of $25,897.110 Note that this amount does not include the cost of severe disabilities which cannot be ameliorated by preschool. Children with severe
physical and mental disabilities were specifically not included in the sample.
Exhibit 3.11

53
The report’s authors use the cost benefit relationship -- paying $2,300 for two year preschool to obtain a
present value benefit of $25,897 -- to propose a “sustainable financing model”, in which the cost savings achieved through reduced special education use is reinvested back into the preschool program to serve
more at-risk children. If implemented, the model would shift resources from remediation to prevention
and scale-up high quality preschool programs for at-risk children.
According to the report, the results so far of the 238 children in the sample who most likely would have
been assigned to special education in elementary school, show that the Granite School District has already achieved over $1 million in cost savings in the three years of the study ($1.4 million over 4
years).111 Had the “sustainable financing model: been implemented in 2006 and the cost savings recycled back annually into preschool, an additional 696 children could have been served.
Setting up a “sustainable financing model” requires a lump-sum of initial capital to pay for the first round
of prekindergarten for a cohort of at-risk children. The authors of the GSD study have begun discussions with Utah state legislators about appropriating government funds to capture the gains from spending on
pre-k to reduce special-ed costs. Instead of government appropriations, it may be possible to use a combination of philanthropic and private capital in an operational PKSE SIB program along the lines
described in Chapter 3.
Quality will be critical to PKSE success. Quality prekindergarten evaluation is a well-researched topic -- see for example Assessing Readiness.112 Many states have child care and early education quality rating
and improvement systems (QRIS). However, as of May 2011, Utah did not appear to have one.113
Many questions can be raised about the GSD study, especially when its findings are compared with those
of the CPC and PKC studies. Of these, probably the most important is, how well does the Peabody Picture
Vocabulary Test predict special-ed assignment? Actual special-ed assignment is based on assessment of a wide range of observations ranging from motor skills to emotional maturity. How does it compare to the
BSSI-3 test used in PKC study and other special-ed assessment tools?
Moreover, before the GSD results could be used as a foundation for SIB issuance, they would need to be
adjusted by using actual number-of-years in special-ed data and disability data. And, if there is any meaningful outward migration of children from the GSD area, this too would need to be included in any
analysis of SIB effectiveness.
$25,897
$2,300 $4,186
$0 $5,000
$10,000 $15,000 $20,000 $25,000 $30,000
Present Value of Accumulated State
Funding (FY10) for Special Education for Non-Self
Contained Students K-2, 2% Discount Rate
Average Cost Per Pupil of 2 years of Granite Title I
Preschool Program (Regular Education), FY09
Average Cost Per Pupil of 2 years of Granite Title I
Preschool Program (assuming the same
average per pupil funding as K-12)
Comparison of Average Per Pupil Funding for Preschool and Special Education

54
Chapter 3
A Social Impact Bond Example: PKSE (Peek-See) Bonds to Pay for Pre-K to Reduce Special-Ed Costs
This chapter presents a simplified example of an early learning social impact bond arrangement intended to overcome inefficiencies in market allocations of capital to youth human capital development. It draws
on observations and findings in chapters 1 and 2 about social impact bonds (SIBs) and the effectiveness
of quality early learning in reducing school special education costs. This chapter has three parts: (A) a quick review of social impact bonds. (B) An example of early learning PKSE (“peek see”) bond mechanics.
And (C) closing thoughts on PKSE program private, social and philanthropic returns.
The example presented here will not include grade retention or English language learning (ELL) service
costs, though like special education costs, research shows quality early learning can significantly reduce these costs also. Most of what this chapter says about financing quality early learning with special
education cost savings can also be said about grade retention and ELL. Including them in a PKSE
program would increase its economic returns. It would increase the number of school-ready children and strengthen regional economic growth and per capita income.
The example reflects a “crawl, walk, run” approach to improving school readiness. It begins small, only 100 students in each financing round. If successful, the local business leaders who establish it can
increase the number of children served in future financing rounds.
The example is a “scholarship” program like that developed by the Minnesota Early Learning Foundation (MELF).114 It uses parent mentors, and maximizes parent choice and supply-side incentives for early
learning providers to increase quality and be quality-rated. And like the MELF program, to keep operating costs low, it relies heavily on city, county and school service capabilities already in place.
The example includes a mix of local and national philanthropy and for-profit investing. Local business-leader philanthropists establish the program. Non-local philanthropists provide project-related investment
(PRI) contributions to bridge negative cash flows and take first-loss positions, and for-profit investors buy
PKSE bonds and fund the provision of pre-k services. This mix reflects overlaps in the incentives of for-profit and non-profit investors.
Exhibit 4.1
None Desired Early Childhood Effect High
No
ne
D
esir
ed F
inan
cial
Ret
urn
H
igh
For-Profit InvestorSpace
Blended Incentives and Capital
Philanthropic Investor
Space
Financial Return Floor Social Return Floor
Segments of Social Impact Investors
To give the example concreteness, it draws on the findings of the 2009 Pennsylvania Pre-K Counts evaluation discussed in Chapter 2, and is loosely based on the Bethlehem Area School District in eastern
Pennsylvania, the third largest school district in the Pre-K Counts (PKC) study.

55
The Pre-K Counts study is a statistical projection analysis, and while it was done with thorough
professionalism, in the PKSE bond example the reduction in special-ed assignment is assumed to be from 18% to 7.5%, rather than to 2.4%. This is done for several reasons. First, the purpose of this chapter is
to present a PKSE bond example and not become embroiled in a debate over the accuracy of the PKC study’s projection. Second, using 7.5% provides an informationally richer example for discussion.
Expanding Pre-K Counts in the Bethlehem Region
Of the roughly 15,000 eligible three and four year-old children in Lehigh and Northampton counties in 2005-2008, only 527, or 3.3%, were in Pre-K Counts preschool.115 Judging from district data and the
PKC study, Pre-K Counts could be expanded many times over with strong school-readiness benefits and without incurring effect reductions due to reaching saturation points. Furthermore, increasing early
learning investment would strengthen per capita income growth and the Lehigh and Northampton county economy. In fact, as Tim Bartik documents in Investing in Kids: Early Childhood Programs and Local Economic Development, there is almost nothing Lehigh and Northampton officials and business leaders
could do that would have more positive effects on their regional economy.116
Would a Bethlehem area PKSE program be a way to address school budget problems? Should business
and philanthropic leaders establish what might be called, a “Bethlehem School Readiness Capital Partnership”, and fund increased Pre-K Counts preschool with PKSE bonds? Perhaps yes, but it is a close
call actually given the hurdles that must be cleared for market acceptance. For this reason, the example
begins small.
The example program is very simplified. Whatever is done actually would involve more complexity and
require considerable regional business and philanthropic commitment extending over at least ten years. Another early-learning special-ed impact study would need to be done to accurately benchmark expected
cost reductions and calibrate contracts, and the second study should be expanded to include grade retention and ELL costs. The study, however, would be just an early step in meeting the conditions
needed for market acceptance of Bethlehem PKSE bonds.
2009 Pre-K Counts Evaluation (PKC) Study
The authors of the 2004 Washington State Institute for Public Policy report Benefits and Costs of Prevention and Early Intervention Programs for Youth117 stress that policy should focus on “real world programs”:
An example of a model program is the Perry Preschool Program, which was a focused demonstration program in the 1960s that, in 2003 dollars, would cost $15,270 per student for a two-year experience. An example of a real world program is the Chicago Title I Child-Parent Centers that costs an estimated $7,355 for a one-and-a-half year experience, in 2003 dollars118.
Pre-K Counts is certainly a “real world program”. The PKC evaluation study spanned a three year period
from 2005-2008 and involved 21 school districts and 10,002 children. The study projected that Pre-K Counts likely reduces the rate of special-ed assignment from the 21 school’s historical average of 18
percent, to 2.4 percent.119 The evaluation raised the possibility that Pre-K Counts might generate special-ed cost savings for the county and state government but did not pursue the matter. Note again that in
the calculations that follow, the assignment rate for Pre-K Counts students is assumed to be, 7.5%, three times higher than the projected rate.
Bethlehem Area School District (BASD)
Whether spending on pre-k in the Bethlehem area can reduce Bethlehem school district special-ed costs enough to pay for the initial pre-k services depends on the cost of special-ed and pre-k per child. For this
chapter’s limited purpose, simple estimates based on information available on the internet will suffice.
Special-ed cost per student is estimated to be $9,713. This amount includes just the special-ed costs that
can be ameliorated by quality preschool. Here is how the estimate is obtained. The Bethlehem Area
School District (BASD) in 2010-11 had a total of 14,881 students, of which 2,396 students, or 16.1%,

56
were in special education.120 BASD’s total 2010-11 budget was $197,685,263, of which 73%
($85,350,275) was allocated to regular education and 27% ($52,468,525) to special education.121 The per student cost of regular education for all students was $9,758, and the per special-ed student cost of
special education was $21,899.
Because special-ed students are also in regular-ed, the convention is to subtract the cost of regular-ed
from special-ed to get the cost of special-ed only. The result is a simple estimate of per student BASD
special-ed cost per year -- $12,141. Chapter 2 explains that between 70% and 80% of the costs of special-ed disabilities can be treated by prekindergarten. The remaining 20 to 30% cannot. In the
example calculations the special-ed cost estimate downward by 30%.
The cost per student for Pre-K Counts preschool is accurately known. It is exactly what the state
government pays providers. The cost for full-day pre-k is $7,850.122
A. Social Impact Bond Review
Recall from Chapter 1 that a standard social impact bond (SIB) program is characterized by:
1. Payment of return on invested capital to investors 2. Repayment of invested capital
3. Government cost savings or revenue increases cover the full cost of the projects or services financed by the SIB
A standard program requires an agreement that establishes the SIB-issuing organization itself and
separate enforceable contracts between all of the major participating parties.
the bond-issuing organization and the government
the bond-issuing organization and private investors, the bond-issuing organization and service providers
Exhibit 4.2
SIB programs must address seven obstacles to the parties being willing or able to participate in a standard SIB arrangement.
1. Unclear returns on the SIB investment project or intervention
2. Long delays between the SIB intervention investment and the return 3. Inability to link government cost reductions or revenue gains solely to the SIB investment
intervention 4. Multiple government jurisdictions with irreconcilable differences and child migration among
jurisdictions 5. Resistance to paying SIB investors from public cost savings or revenue gains
6. Limited capacity to administer and evaluate SIB program performance
7. Incentive inconsistencies among the parties to the SIB financing
From the SIB investor standpoint, to be attractive SIB programs must to have:
GovernmentBond-Issuing Organization
PrivateInvestors
Service Providers
3. Performance-based payments
1. Workingcapital
4. Repayment and ROI fromperformance-based
payments
2. Funding foroperating costs

57
Strong state and local business, philanthropic and government support
Rigorous statistical demonstrations of projected benefits Sound legal foundations for SIB issuing organizations
Clear enforceable contracts among SIB participating entities Bonds or other SIB assets with terms familiar to investors
Good working relationships with the investment underwriting, institutional and foundation
investor sectors
To this list of contract participants and challenges, in the case of PKSE SIBs, parents are critically
important. The public support of parents and contracts with the parents whose children receive PKSE scholarships are needed.
Central Challenges
Recall in chapters 1 and 2, the working group concluded that the central challenges to SIB
implementation are (1) obtaining sound statistical research that firmly establishes an economic linkage
between an intervention and an early childhood benefit, (2) devising a contract between the SIB issuer and the government entity, which captures the benefit monetarily and which both parties are willing to
sign, and (3) monetizing the returns within a timeframe acceptable to investors.
Fifty years of research has shown strong near and long-term economic benefits from interventions
ranging from prenatal nutrition, to lead abatement and prekindergarten. This research has underpinned
establishment of scores of early childhood health, nutrition, safety and early learning state and federal laws and programs – all dedicated to capturing the broad range of documented near and long-term
benefits of investing in young children’s health and education and in strengthening their families. On the basis of this research tens of billions of dollars of state and federal resources now flow every year into
early childhood programs. Government can do this. In fact, this is the role of government.
The challenge for SIB organizers is not finding high-return interventions to invest in. The challenge is
getting a government agency to sign an agreement that commits the agency to give back a portion of the
intervention gains. The question will always be, how much, in dollars calculated to the penny, must the agency give back? How can the agency be sure it is not giving back more than it should and
uneconomically and unfairly reducing what is available for other programs? How can it be sure the savings are due solely to the intervention financed by the SIB?
B. A PKSE Bond Example Using Pennsylvania Pre-K Counts and Bethlehem Area School District Parameters
PKSE Organization
In this example, to demonstrate strong business and philanthropic support for the PKSE program to
potential investors, local philanthropy has full responsibility for setting up and covering all the operating
expenses of the SIB issuing organization. To give investors the strongest sense that their funds will invest in children and not bureaucracy, all PKSE bond proceeds are allocated to fund pre-k scholarships for at-
risk children. And to accommodate diverse kinds of pre-k providers and incentivize them to achieve higher quality, parents are permitted to use the PKSE scholarships to pay for pre-k services from any
provider so long as they can show their quality is as good, or better, than the PKC’s pre-k program for three and four year-olds based on the Keystone STARS system.123
The contracts essential for SIB success are between the PKSE issuing organization and the parents who
receive the scholarships on behalf of their children, the providers of pre-k services including the school district, and the school district to capture special-ed savings. When parents accept a scholarship on
behalf of their children, they sign an agreement to participate actively in their child’s pre-k success. Before a provider can accept a scholarship check, they must affirm the quality of their program. And
underlying all this is a master agreement between the PKSE issuing organization and the school district,
which agrees that it will rebate the special-ed savings surplus back to the PKSE organization.

58
All the basic elements for assembling a PKSE program exist in Pre-k Counts. PKC consists of established,
operating public-private partnerships among philanthropies and state government departments, overseen by the Pennsylvania Office of Child Development and Early Learning. PKC’s goal is entirely consistent with
PKSE funding – “…to stimulate the development of an early care and education network, which would expand quality options; infuse education into child care routines; set standards for quality, professional
development, and early learning; and serve as a catalyst to create and unify a ‘system’ for prevention and
care for all young children.”124
PKC partnerships are organized regionally around specific school districts. The Bethlehem Area School
District is a PKC partnership and was the third largest in PKC study. If Bethlehem area business leaders and philanthropies decided to use a PKSE program to increase BASD school readiness, the organization
would have the following cost coverage responsibilities and might look something like the diagram below:
Philanthropy Paying set-up, operations, mentoring and monitoring costs
Investors Funding pre-k scholarships
Government Statutory recognition, incentive funding, and PKSE bond tax exemption School District Rebating annual special-ed cost savings to the PKSE issuer
PKSE issuer Paying interest and principle due on PKSE bonds out of special-ed savings
Exhibit 4.3
BASD Special-Ed Cost Savings Are
Reinvested in More PKSE
Scholarships for PKC Quality Pre-K
Pennsylvania Recognizes and Grants
PKSE Bond Tax Exemption
PKC Quality Pre-K generates
Special Ed Savings
PKSE Scholarships for
BASD Region Children
Children attend Pre-k with PKC
or better Quality Rating
Bethlehem School-Readiness Capital
Partnership
Bethlehem Region
Business and Philanthropic
Leaders
Bethlehem Area School District PKSE Account
1
2
3 4
5
6
7
8
9
10
School-Readiness Capital Partnership – PKSE Resource Flow
PKSE Bond Investor Funds (4) and
Interest and Capital Repayment to PKSE Bond Holders (10)
11
Following the flow of the diagram --
1. Bethlehem Regional Business and Philanthropic Leaders Business leaders and philanthropists in
the Bethlehem area agree to establish a capital partnership to pay for setting up and paying the operating expenses of a PKSE social impact bond issuing organization to increase regional school-
readiness, reduce school operating costs, and strengthen the region’s future workforce. Partnerships
to establish PKSE bond programs can take any one of a number of forms, including a 501c3 created for this purpose, a donor advised fund in a community foundation or under the auspices of the United
Way

59
2. Bethlehem School Readiness Capital Partnership (Capital Partnership) The Bethlehem Capital
Partnership is the SIB issuing organization. It issues PKSE bonds to fund scholarships to pay for quality pre-k for cohorts of 3 and 4 year-old at-risk children in the Bethlehem Area School District. It
oversees all aspects of PKSE operations, scholar selection, pre-k provision, special-ed assignment and savings calculations, and compliance with Capital Partnership contracts, and it contracts with a third
party to evaluate program performance. It receives funds from the business and philanthropic
partnership, and from PKSE bond investors and pays interest and principle payments on the bonds when due. It operates through contracts with preschool service providers and the regional school
districts.
3. State of Pennsylvania Recognizing the impact of PKSE financing and wanting to encourage Pre-
K Counts expansion, state law specifically recognizes PKSE bonds and permits Pennsylvania PKSE issuers under certain circumstances to issue tax-exempt bonds if they choose. Also, under certain
circumstances, Pennsylvania may contribute funds to the Capital Partnership to enhance success --
for example, in the form of a limited match of investor funds, a small bonus percentage of special-ed costs savings, or contributions to provide mentoring for parents of children who receive PKSE
scholarships.
4. Bethlehem PKSE Bond Investors Private investors, asset management funds, foundations,
companies, and others purchase Bethlehem Capital Partnership PKSE bonds.
5. PKSE Funds Distributed to the BASD PKSE Account The Bethlehem Area School District receives PKSE bond funds from the Capital Partnership. A school district can receive the funds itself
or through a 501c3 established for this purpose.
6. PKSE Scholarships for At-Risk BASD Children Parents sign an agreement with the Capital
Partnership in order to receive PKSE scholarship funds that says they will positively and actively participation in their child’s education. The regional school districts provide pre-k scholarships to at-
risk children for their parents to use to pay for prekindergarten early education services.
7. Children Attend Pre-k Scholarships can be used to attend a regional school prekindergarten program or a church, non-profit, or for-profit prekindergarten, so long as the services are rated
Keystone Star 3 or 4 as required by the Pre-K Counts program.
8. Bethlehem Area School District Special Education Cost Savings When PKSE graduates move
into public school, special education assignments decline and special-ed spending falls. As the
graduates move grade by grade through elementary school, middle school and high school, special-ed cost savings accumulate.
9. Allocation of Special-Ed Cost Savings Projected cost savings are calculated each year as provided for in the PKSE contract between Capital Partnership and the school district. The imputed
cost savings are credited each year to the Bethlehem Area School District’s PKSE account
10. Cost savings distributed to Capital Partnership The Capital Partnership receives the imputed special-ed cost savings each year.
11. PKSE Bond Interest and Principle Payments The Capital Partnership makes interest and payments and repays PKSE bonds as they come due.
PKSE Program Education and Financial Performance
Putting operational muscle on the organizational skeleton requires making assumptions about a wide
range of features beyond just the special-ed assignment rates for pre-k and non-pre-k children. These additional assumptions include adjustments to accurately reflect migration of children out of the region,
child entry and exit from special-ed over time, limits on the special-ed costs that than can be ameliorated by pre-k, and state government participation such as a match for one-half the cost of Pre-K Counts
preschool for four year-olds along the lines of Virginia’s Preschool Initiative.125

60
Exhibit 4.4
A PKSE Bond Program to Expand Pre-k Counts by 100 Children Annually
A. Program Parameters
1. Special-ed assignment without Pre-K Counts preschool 18% (Equal to Pre-K Counts) 2. Special-ed assignment with Pre-K Counts preschool 7.5% (3 times Pre-K Counts)
3. Number of years in special-ed Based on national distribution*
4. Cost of prekindergarten per child per year $7,850 (Equal to Pre-K Counts) 5. Cost of special-ed per child per year $12,141 (Based on BASD data)
6. Percent of special-ed disabilities ameliorated by pre-k 70% 7. Special-ed cost adjusted by amelioration rate $8,499 (30% less than BASD data)
8. Program set-up and operating costs See below 9. Earnings on accumulating special-ed cost savings See below
10. Discount rate used to calculate present values 5%
11. Migration out of the school district per year 2%**
B. Scholarships
1. PKSE Program Round: Scholarships for 50 three year-old and 50 four year-old children
C. Operations
1. Program set-up and operating costs: $500,000 Paid by philanthropy (3 years)
2. PKSE student mentoring per child per year: $ 1000 Paid by philanthropy (3 years) 3. PKSE graduate monitoring per child per year: $ 100 Paid by philanthropy (ongoing)
D. Finance 1. Special-ed cost savings: School cost savings from difference between
special-ed costs with and without PKSE 2. Special-ed cost savings gain rate………………………3% Gains earned from investing special-ed
cost savings not used to pay PKSE bond interest or principle repayments
3. Regional business leader philanthropists: Pay for set-up and operating costs and are not repaid 4. PKSE bonds: Simple, straight bonds with 10-year maturity
5. PKSE bond annual interest rate………………………..3% Paid from special-ed cost savings gains 6. PKSE bonds pay-off at maturity in 10 years: Paid from accumulated special-ed savings gains
7. PRI philanthropists: Purchase PRI bonds to cover negative cash flow during PKSE bond
repayment, once program effectiveness is demonstrated and are repaid over 20 years from special-ed net savings gains from future PKSE financing rounds
8. PRI bonds: Straight bonds with 20-year maturity 9. PRI bond annual interest rate…………………………..3% Paid from special-ed cost savings gains
10. Length of PKSE Program Financing Round
a. 2 years of Pre-k for three year-old children and 1 year for four year-olds b. 13 years of Kindergarten through 12th grade public school education
c. Special-ed cost savings begin to accumulate in Kindergarten and continue to accumulate through 12th grade in line with national special-ed entry and exit data.
d. 12th grade is the 15th and final year of a PKSE program. This is the year in which the three year-old PKSE scholarship recipients graduate from high school.
* The distribution of students in special-ed described in U.S. Department of Education, Office of Special Education Programs, Data Analysis System (DANS), OMB #1820-0043: "Children with Disabilities Receiving Special Education Under Part B of the Individuals with Disabilities Education Act," 2007. Data updated as of July 15, 2008. ** No information was available of young child family outmigration from the BASD. 2% is an initial estimate of outmigration the seven county Northern Virginia area and is included in the SIB example because it needs to be included in any analysis of SIB effectiveness.

61
PKSE Program Operations
If – a group of Bethlehem area business and philanthropic leaders organize a capital partnership, attract foundation support, oversee a new benchmark study, obtain government and school support, obtain Pre-
K Counts early learning provider agreement to increase capacity to accept 100 additional students per year, totaling 1000 students over 10 years, get contracts signed, achieve market acceptance of their
PKSE bonds, and began operations…if they do all this, the projected results of their efforts year-by-year
would look like the exhibits below.
PKSE Program Sustainability
The exhibits below initially show one round of PKSE financing. They show an increase in Pre-K Counts services for 100 three and four year-old children. In a second round, services for another 100 children
would be provided. In a third round services for 100 more would be provided, and so on. This chapter’s PKSE program example runs for ten years.
The most important measure of program success is the amount of “funds for future financing rounds”.
Each financing round needs to generate a positive amount of money for re-investment in “scholarships” in the next round. This way, the amount of PKSE bond sales needed to fund the “scholarships” steadily
declines and eventually the program is financed entirely by special-ed savings and is sustainable. If a PKSE program can be projected to become sustainable in 3 or 4 years, it is a success. If it takes longer
than that, the outer limit of private investor horizons will be exceeded and selling the PKSE bonds will
become difficult.
PKSE Scholars in K-12
In the first year, 100 three and four year-old PKSE scholars enroll in new Pre-K Counts preschool spaces. In the second year, the four year-olds enter kindergarten and the three year-olds move up to the second
year of preschool. By the third year, all the first round PKSE scholars are now PKSE graduates in the K-12 system. One percent of them are assumed to migrate out of the region each year. This is why the line
below showing PKSE graduates in K-12 tilts downward before dropping off to zero when the original
three year-olds graduate in the 15th year of the program. Though not always readily evident in the exhibits, outward migration is contained in all the calculations and exhibits.
When the first group of four year-olds move into kindergarten and three year-olds move into the second year of the PKSE program, 50 spaces open up for a new group of three year-olds to enter. The entry of
this new group begins the second round of PKSE financing. The costs and gains of the second round are
not shown in the exhibits below. The results of the second and subsequent rounds are shown in the ten-year exhibits below when long-term sustainability is discussed.
Exhibit 4.5
0
20
40
60
80
100
120
1 2 3 4 5 6 7 8 9 10 11 12 13 14 15
PKSE graduates in k-12 grades
Children in PKSE program
PKSE Program Students and Graduates in K-12
PKSE Program Year
Nu
mb
er o
f C
hild
ren

62
Number of Children in Special-Ed With and Without PKSE Program
One measure of the success of a PKSE program is a reduction in the number of children assigned to special-ed. Of the 100 at-risk children in the PKSE program, the number assigned to special-ed is not the
black-square line, reflecting the PKC study’s 18% projection. Instead, it is the barely visible green-triangle line at the bottom corresponding the PKSE 7.5% assumption. The curved shape of the black-
square and blue-diamond lines reflects the pattern of national data on when children enter and exit
special-ed. As discussed in Chapter 2, entries usually occur in the first four years of elementary school, and exits in high school, frequently as a result of dropping out of school. This pattern is contained in all
calculations and exhibits.
Exhibit 4.6
(Based on adjusted PKC study projections)
Special-Ed Cost With and Without PKSE Program
Another important measure of PKSE program success is the reduction in special-ed cost for PKSE scholars. The red-square line shows special-ed cost for children without the benefit of Pre-K Counts
quality preschool. The green-triangle line is special-ed cost for PKSE scholars.
Exhibit 4.7
(Based on adjusted PKC study projections)
0
20
40
60
80
100
120
1 2 3 4 5 6 7 8 9 10 11 12 13 14 15
Total Number of Children in K-12
Number of Children in Spec-ed without PKSE
Number of Children in Spec-ed with PKSE
Comparison of Number of At-Risk Children in Special Education with and Without PKSE Program
PKSE Program Year
Nu
mb
er
of
Ch
ildre
n
$0
$20,000
$40,000
$60,000
$80,000
$100,000
$120,000
$140,000
$160,000
1 2 3 4 5 6 7 8 9 10 11 12 13 14 15
Special Education Cost Without PKSE Program
Special Education Cost With PKSE Program
Comparison of GSD Special Education Cost With and Without PKSE Program
PKSE Program Year

63
Sources of Funds
The financing costs of a PKSE program round are greatest in the first year when scholarship funds are needed for 50 three year-olds and 50 four year olds. In the second year, scholarship funds are needed
only for the 50 children who were three year olds in the first year. Thereafter, as PKSE graduates move through elementary, middle and high school, they generate special education savings.
In this example, regional business-leader philanthropists pay the set-up and operating costs including
mentoring and monitoring. Investor PKSE bond buyers pay the scholarship costs, and there is a state government match for the cost of pre-k for four year-olds.
For regional philanthropists, initial set-up, operating and parent mentoring costs are incurred in the first two years. Thereafter, monitoring costs are relatively low.
For the state, after the match of one-half the cost of pre-k for four year-olds in the first two years, there is no direct cost.
For PKSE bond investors, $1.4 million in 10-year bonds need to be placed in the first year, and $975
thousand in the second year to provide funds for “scholarships” to pay for Pre-K Counts quality preschool.
Exhibit 4.8
(Based on adjusted PKC study projections)
Negative Cash Flow and Sustainability
As noted earlier, the most important measure of a PKSE program’s success is the amount of “funds
available for future financing rounds”. This is amount of money one round of PKSE financing generates for re-investment in the next round of financing. A major problem with the PKSE example given the
operating assumptions is immediately evident.
In the exhibit below, the blue-diamond line shows the accumulation of special-ed savings gains (cost
savings plus gains from investment of the accumulated balance). The green-triangle line shows the crucially important amount of “funds available for future financing rounds”. The problem is clear. In the
tenth year when the PKSE bonds need to be repaid, there is not enough accumulated special education
savings to repay the principle due. The program goes cash flow negative, and a way has to be found to finance the gap.
Exhibit 4.9
$0
$100,000
$200,000
$300,000
$400,000
$500,000
$600,000
$700,000
1 2 3 4 5 6 7 8 9 10 11 12 13 14 15
Regional Philanthropy
State Government
PKSE Bond Investors
Sources of PKSE Program Funds With No PRI Investment
PKSE Program Year

64
(Based on adjusted PKC study projections)
If a way could be found to fund the repayment of PKSE bonds, longer-term sustainability looks reasonably good, though it is achieved beyond the investment comfort zones of most investors. As shown
in the exhibit below, sustainability is achieved in five or six years or rounds of financing.
This exhibit uses present value calculations to compare the amounts of various PKSE benefits and costs.
The first black vertical bar is present value of all-in cost savings from lower special education costs. The
medium gray second bar is the present value of all-in PKSE bond borrowing costs. The dark gray third bar is the difference between the first two bars. It shows the present value of the funds available for the
next PKSE financing round. The light gray fourth bar is the present value of what local business leaders and charities contribute to establish and operate the PKSE organization.
The exhibit shows a small positive first-round amount of funds available for investment in the second
round. This reduces the amount of PKSE bonds that have to be sold to fund the scholarships for another 100 children. Because the amount of PKSE borrowing is less, the amount of funds available for next-
round investment is larger. Each round the amount of funds available for reinvestment grows and the amount of needed PKSE bond borrowing declines. In the fifth round, PKSE bond borrowing is negligible,
and in the sixth and successive rounds the entire program is paid for by special-ed savings and the small
amount of earnings from investing the savings as they accumulate.
-$400,000
-$200,000
$0
$200,000
$400,000
$600,000
$800,000
$1,000,000
1 2 3 4 5 6 7 8 9 10 11 12 13 14 15
Cumulative PKSE special savings gains
PKSE bond repayment
Funds available for future financing rounds
Cumulative PKSE Cost Savings, Bond Repayment,and Funds Available for Future Rounds of PKSE Financing
PKSE Program Year

65
Exhibit 4.10
(Based on adjusted PKC study projections) Program- Related Investment (PRI) Contributions
One way to finance the gap is program-related investments (PRIs). PRIs are loans and equity investments, authorized under tax laws, which foundations can provide at favorable rates to support
activities that have direct charitable purposes. 126 GrantCraft.org explains that PRIs “expand the resources from foundations - and, in the right circumstances, can be even more effective than grants.”
127 The Gates Foundation and others are actively looking for PRI opportunities:
Through tools like low-interest loans, guaranties, and equity investments, the foundation will apply some of its resources to support companies, investment funds, financial institutions and other revenue-generating enterprises that further the foundation’s charitable purpose. Program-related investments (PRIs) can be important tools for the foundation to stimulate private-sector driven innovation, to encourage market-driven efficiencies, and to attract external capital to the foundation’s priority initiatives.128
In the exhibit below, PRIs are added to the PKSE sources of funds in amounts that exactly offset negative
cash flows.
$0
$100,000
$200,000
$300,000
$400,000
$500,000
$600,000
$700,000
$800,000
1 2 3 4 5 6 7 8 9 10
Present value of PKSE special education cost savings gains
Present value of PKSE bond interest and repayment
Present value of PKSE savings gains available for future rounds Present value of regional philanthropic contributions
Comparison of PKSE Spec-ed Savings Gains, Bond Interest and Principle Payments, Savings Gains Available for Future Financing Rounds, and Regional Philanthropic Contributions
PKSE Financing Round

66
Exhibit 4.11
(Based on adjusted PKC study projections)
The operating effect on first round performance of adding PRIs is clear. There are no instances of
negative cash flows and the funds available for next-round investment is over $200 thousand.
Exhibit 4.12
(Based on adjusted PKC study projections)
Adding PRIs enables sustainability to be achieved in three rounds of financings. This is well within the investment horizons of most investors. Moreover, a PKSE partnership that has PRI backing from
$0
$100,000
$200,000
$300,000
$400,000
$500,000
$600,000
$700,000
1 2 3 4 5 6 7 8 9 10 11 12 13 14 15
Regional Philanthropy
State Government
PKSE Bond Investors
Philanthropic PRIs
Sources of PKSE Program Funds With PRI Investment
PKSE Program Year
-$100,000
$0
$100,000
$200,000
$300,000
$400,000
$500,000
$600,000
$700,000
$800,000
$900,000
1 2 3 4 5 6 7 8 9 10 11 12 13 14 15
Cumulative PKSE special savings gains
PKSE bond repayment
Funds available for future financing rounds with PRI investment
Philanthropic PRIs
Cumulative PKSE Cost Savings, Bond Repayment, and Funds Available for Future Rounds of PKSE Financing with PRI Investment
PKSE Program Year

67
significant regional or national foundations will find it much easier to market their PKSE bonds. Once
sustainability is achieved, the PRIs can be amortized. Recall that each round of financing provides quality preschool services for children who will be in the k-12 for the next 15 years. Children in the tenth PKSE
financing round will not graduate from high school for another 15 years. Amortizing the PRIs over 20 years is very feasible.
Exhibit 4.13
(Based on adjusted PKC study projections)
$0
$100,000
$200,000
$300,000
$400,000
$500,000
$600,000
$700,000
$800,000
$900,000
1 2 3 4 5 6 7 8 9 10
Present value of PKSE special education cost savings gains
Present value of PKSE bond interest and repayment
Present value of PKSE savings gains available for future rounds
Present value of regional and PRI philanthropic contributions
Present value of PRI philanthropic contributions
Comparison of PKSE Spec-ed Savings Gains, Bond Interest and Principle Payments, Savings Gains Available to Future Financing Rounds, and Regional Philanthropic Contributions
With PRI Contributions
PKSE Financing Round

68
Program Sensitivity to Parameter Changes
PKSEs are sensitive to parameter values such as the special-ed assignment rate for PKSE graduates. As the exhibit below shows, the critical “funds available for future financing rounds” in this Bethlehem Area
School District example goes negative if the special-ed assignment rate for PKSE graduates is just 1 percent higher than the assumed 7.5% rate.
Exhibit 4.14
Exhibit 4.15
-$400,000
-$200,000
$0
$200,000
$400,000
$600,000
$800,000
1 2 3 4 5 6 7 8 9 10 11 12 13 14 15
Cumulative PKSE special savings gains PKSE bond repayment Funds available for future financing rounds
Cumulative PKSE Cost Savings, Bond Repayment,and Funds Available for Future Rounds of PKSE Financing ,
Assuming an 8.5% PKSE Student Special-Ed Assignment Rate
PKSE Program Year
-$10,000,000
-$8,000,000
-$6,000,000
-$4,000,000
-$2,000,000
$0
$2,000,000
$4,000,000
$6,000,000
$8,000,000
$10,000,000
1 2 3 4 5 6 7 8 9 10
Present value of PKSE special education cost savings gains
Present value of PKSE bond interest and repayment
Present value of PKSE savings gains available for future rounds
Comparison of PKSE Spec-ed Savings Gains, Bond Interest and Principle Payments, Savings Gains Available for Future Financing Rounds, and Regional Philanthropic Contributions,
Assuming an 8.5% PKSE Student Special-Ed Assignment Rate
PKSE Financing Round
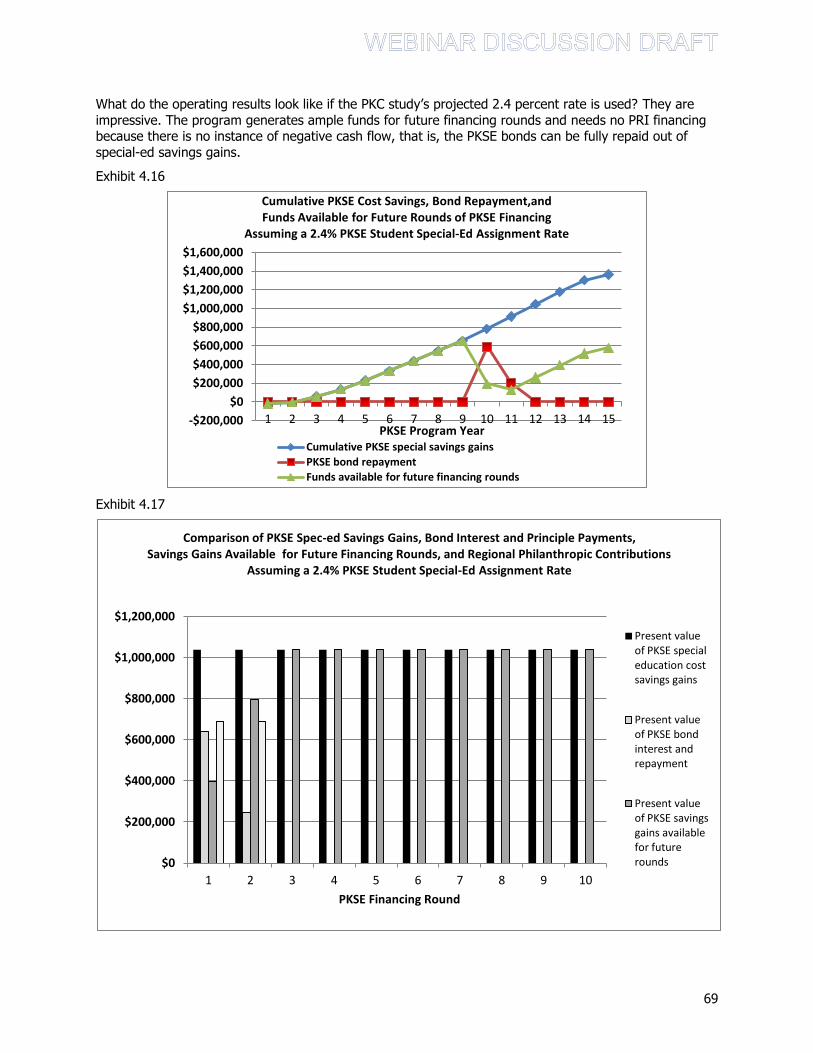
69
What do the operating results look like if the PKC study’s projected 2.4 percent rate is used? They are
impressive. The program generates ample funds for future financing rounds and needs no PRI financing because there is no instance of negative cash flow, that is, the PKSE bonds can be fully repaid out of
special-ed savings gains.
Exhibit 4.16
Exhibit 4.17
-$200,000
$0
$200,000
$400,000
$600,000
$800,000
$1,000,000
$1,200,000
$1,400,000
$1,600,000
1 2 3 4 5 6 7 8 9 10 11 12 13 14 15
Cumulative PKSE special savings gains
PKSE bond repayment
Funds available for future financing rounds
Cumulative PKSE Cost Savings, Bond Repayment,and Funds Available for Future Rounds of PKSE Financing
Assuming a 2.4% PKSE Student Special-Ed Assignment Rate
PKSE Program Year
$0
$200,000
$400,000
$600,000
$800,000
$1,000,000
$1,200,000
1 2 3 4 5 6 7 8 9 10
Present value of PKSE special education cost savings gains
Present value of PKSE bond interest and repayment
Present value of PKSE savings gains available for future rounds
Comparison of PKSE Spec-ed Savings Gains, Bond Interest and Principle Payments, Savings Gains Available for Future Financing Rounds, and Regional Philanthropic Contributions
Assuming a 2.4% PKSE Student Special-Ed Assignment Rate
PKSE Financing Round

70
C. Comments on Returns on For-Profit and Philanthropic Investments
The returns on PKSE investments take several forms. The return on PKSE bonds paid to investors is financial -- it is simply the interest payment. The fact that the interest is being paid at all means market
inefficiencies in allocating capital to high-return youth human capital investments are being overcome, and the economic gains from that allocation are being monetized.
The return on philanthropic capital is more complex. There are at least three bottom lines.
The first is economic -- the improvement in school readiness and all its implications for the life success of PKSE scholars – higher third-grade reading and math scores, higher graduation rates, lower involvement
in crime, fewer teen pregnancies, less drug use, higher rates of employment and future earnings, improved parent productivity, and stronger regional economic and per capita income growth. These are
the benefits documented by Steve Aos, Steve Barnett, Tim Bartik, Lynn Karoly, James Heckman, Arthur Reynolds, and many, many others. These benefits cumulate at the local and regional levels and
strengthen national aggregate growth and job creation. To paraphrase Jim Heckman, “Benefits beget
benefits.”
A second bottom line is financial -- the reduction in special education costs. Investor purchases of PKSE
bonds is just the way business leaders and philanthropists get outside for-profit capital to pay for what is needed to increase local and regional school readiness and cut special-ed costs. There are no bonds to
purchase unless there are institutions, preferably local ones, to issue the bonds. The present value of
regional business-leader philanthropic contributions to establish a small version of one these institutions is $412 thousand. The financial return on that philanthropic investment is the amount of special-ed cost
savings. In the first round this is $1.9 million. Success in this is measured by the ratio of special-ed savings to local philanthropic investment. In this case, the present value of the first round return is
464%. There are returns from successive rounds also. Including them increases first-round returns several times over.
The third is societal and brings us to where this paper began. The process of building PKSE organizations
knits together local and national business leaders and philanthropic institutions into networks of people locally and nationally who understand the importance of youth human capital development, have built
effective investment frameworks that can attract capital from many sources, and have the capacity to act at the levels of local, state and federal policymaking. PKSEs and arrangements like them can overcome
some of the market obstacles to effective youth human capital investment, but only state and federal
policymaking can address the major obstacles. One of the returns to philanthropic investment returns from establishing institutions like PKSEs is the creation of coalitions of hundreds of business leaders in
every state that have the knowledge of what works and doesn’t work in early child development and education. These are the people who can and ultimately will affect state and federal policy.
*****

71
Endnotes
1 “Early Childhood Finance: Meeting Notes and Initial Findings of a Conference Convened by the Kauffman Foundation and the Partnership for America’s Economic Success”, November 15, 2010,
http://www.partnershipforsuccess.org/uploads/20101124_KauffmanPAESConferenceReport10102FINAL.pdf
2 Kauffman Foundation, http://www.Kauffman.org/Section.aspx?id=Education
3 Ready Nation Partnership, http://www.ReadyNation.org
4 America’s Promise Alliance, http://www.AmericasPromise.org/
5 Partnership for America’s Economic Success, http://www.partnershipforsuccess.org/index.php?id=01
6 Timothy Bartik, Investing in Kids: Early Childhood Programs and Local Economic Development, Upjohn
Institute, 2011 http://www.upjohn.org/Publications/Titles/InvestinginKids
7 Mission Readiness, “Ready, Willing, and Unable to Serve: 75 Percent of Young Adults Cannot Join the
Military: Early Education Across America is Needed to Ensure National Security”,
http://www.missionreadiness.org/2009/ready_willing/
8 Jack P. Shonkoff and Deborah A. Phillips, Editors, Neurons to Neighborhoods, “The Developing Brian”,
Committee on Integrating the Science of Early Childhood Development, National Research Council and Institute of Medicine, 2000 pp 182-218 http://www.nap.edu/openbook.php?record_id=9824&page=R1
9 Knudsen, Eric I. Knudsen, “Sensitive Periods in the Development of the Brain and Behavior”, Journal of Cognitive Neuroscience, pp 1412-1425 http://faculty.washington.edu/losterho/knudson_critical_periods_jcn_2004.pdf
10 James J. Heckman and Dimitry V. Masterov, “The Productivity Argument for Investing in Young Children”, Working Paper 5, Invest in Kids Working Group, Committee for Economic Development
October 4, 2004, p 6 http://www.readynation.org/docs/ivk/report_ivk_heckman_2004.pdf
11 Heckman and Masterov, p 7
12 Heckman and Masterov, p 1
13 Heckman and Masterov, p 1
14 “Long-Term Economic Benefits of Investing in Early Childhood Programs: Proven Programs Boost
Economic Development and Benefit the Nation’s Fiscal Health”, Issue Brief #5, ReadyNation, p 3
http://www.readynation.org/docs/researchproject_dickens_bartik_200802_brief.pdf 15 See for example: Lance Lochner and Alexander Monge-Naranjo, “Credit Constraints in Education”,
NBER Working Paper 17435, September 2011 http://www.nber.org/papers/w17435 also available at http://www.pitt.edu/~ripoll/events/monge2.pdf
16 Miguel Palcios Lleras, Investing in Human Capital: A Capital Markets Approach to Student Financing, See especially: Chapter 2 ―Market failure in the financing of education, Chapter 9 ―Lessons from the
implementation of income contingent loans, Chapter 10 ―Government-driven implementation of human capital contracts
17 “What is Pay for Success”, Third Sector Capital Partners,
http://thirdsectorcap.org/pay_for_success.html
18 Monitor Institute, Investing for Social and Environmental Impact: A Design for Catalyzing and Emerging Industry, 2009, http://www.monitorinstitute.com/impactinvesting/documents/InvestingforSocialandEnvImpact_FullReport
_004.pdf

72
19 Bridges Ventures and The Parthenon Group, Investing for Impact: Case Studies Across Asset Classes, http://socialfinanceus.org/sites/default/files/Investing%20for%20Impact.pdf
20 Jeffrey Liebman, Social Impact Bonds: A Promising New Financing Model to Accelerate Social Innovation and Improve Government Performance, Center for American Progress, February 2011. http://www.americanprogress.org/issues/2011/02/social_impact_bonds.html
21 Monitor Institute, Investing for Social and Environmental Impact: A Design for Catalyzing and Emerging Industry, 2009, http://www.monitorinstitute.com/impactinvesting/documents/InvestingforSocialandEnvImpact_FullReport
_004.pdf
22 Bridges and Parthenon, p 4,
23 Monitor Institute, p 32
24 Monitor Institute, p. 3
25 Monitor Institute, p. 11-12.
26 Timothy Bartik, Investing in Kids: Early Childhood Programs and Local Economic Development, Upjohn Institute. 2011. http://www.upjohn.org/Publications/Titles/InvestinginKids
27 Jeffrey Liebman, Social Impact Bonds: A Promising New Financing Model to Accelerate Social Innovation and Improve Government Performance, Center for American Progress, February 2011.
http://www.americanprogress.org/issues/2011/02/social_impact_bonds.html
28 Liebman, p 7
29 Liebman, p 11
30 James J. Heckman and Dimitry V. Masterov, “The Productivity Argument for Investing in Young Children”, Working Paper 5, Invest in Kids Working Group, Committee for Economic Development
October 4, 2004, p 6 http://www.readynation.org/docs/ivk/report_ivk_heckman_2004.pdf
31 Partnership for America’s Economic Success – Progress Update: July 1, 2010 – July 31, 2011, Center on
the States, Pew Charitable Trusts, November 2011,
http://www.readynation.org/uploads/20111102_PAESProgressUpdate110211.pdf
32 Partnership Progress Update, pp 3-5
33 The Case for Home Visiting: Strong families start with a solid foundation, Issue Brief, Center on the States, Pew Charitable Trusts, May 2010
http://www.pewtrusts.org/uploadedFiles/wwwpewtrustsorg/Reports/State_policy/067_10_HOME%20Mo
ms%20Brief%20Final_web.pdf?n=9905
34 The Case for Home Visiting, p 1
http://www.pewtrusts.org/uploadedFiles/wwwpewtrustsorg/Reports/State_policy/067_10_HOME%20Moms%20Brief%20Final_web.pdf?n=9905
35 Partnership for America’s Economic Success, “Delivering Healthier Babies and Economic Returns,” December 2009
www.partnershipforsuccess.org/uploads/200912_00609PaesLongtermCostsBriefpressproof.pdf
36 E. Lee, et al., “Reducing Low Birth Weight Through Home Visitation: A Randomized Controlled Trial,” American Journal of Preventative Medicine 36 (2009): 154–160 http://www.ajpmonline.org/article/S0749-
3797(08)00845-3/abstract
37 The Case for Home Visiting, p 2
http://www.pewtrusts.org/uploadedFiles/wwwpewtrustsorg/Reports/State_policy/067_10_HOME%20Mo
ms%20Brief%20Final_web.pdf?n=9905

73
38 Child Maltreatment 2010, U.S. Department of Health and Human services, Administration for Children
and Families, Administration on Children, Youth and Families, Children’s Bureau, pp vii-x www.acf.hhs.gov/programs/cb/stats_research/index.htm#can
39 Janet Currie and Cathy Spatz Widom, “Long-Term Consequences of Child Abuse and Neglect on Adult Economic Well-Being”, Child Maltreatment, April, 2010, Russell Sage Foundation, p 111
http://cmx.sagepub.com/content/15/2/111.full.pdf+html
40 Currie and Widom, p 111, 117 http://cmx.sagepub.com/content/15/2/111.abstract
41 “Mission and Activities”, Coalition for Evidence-Based Policy http://coalition4evidence.org/wordpress/
42 “Social Programs That Work”, Early Childhood, Coalition for Evidence-Based Policy http://evidencebasedprograms.org/wordpress/?page_id=11
43 “Nurse-Family Partnership”, Early Childhood, Social Programs That Work, Coalition for Evidence-Based Policy http://evidencebasedprograms.org/wordpress/?page_id=57
44 The Case for Home Visiting: Strong families start with a solid foundation, Issue Brief, Center on the
States, Pew Charitable Trusts, May 2010, p 2 http://www.pewtrusts.org/uploadedFiles/wwwpewtrustsorg/Reports/State_policy/067_10_HOME%20Mo
ms%20Brief%20Final_web.pdf?n=9905
45 “Triple P System”, Early Childhood, Social Programs That Work, Coalition for Evidence-Based Policy
http://evidencebasedprograms.org/wordpress/?page_id=888
46 “Abecedarian Project”, Early Childhood, Social Programs That Work, Coalition for Evidence-Based Policy http://evidencebasedprograms.org/wordpress/?page_id=70
47 “Perry Preschool Project”, Early Childhood, Social Programs That Work, Coalition for Evidence-Based Policy http://evidencebasedprograms.org/wordpress/?page_id=65
48 Albert Wat, “The Case for Pre-K in Education Reform: A Summary of Program Evaluation Findings”, Pre K Now, Pew Center on the States, p 1
http://www.pewcenteronthestates.org/uploadedFiles/The_Case_for_PreK.pdf?n=6279
49 W. Steven Barnett, Lives in the Balance: Age-27 Benefit-Cost Analysis of the High/Scope Perry Preschool Program, Monographs of the High/Scope Educational Research Foundation, Number 11, Ypsilanti, Michigan: High/Scope Press, 1996
50 Arthur J Reynolds et al, “Long Term Benefits of Participation in the Title I Chicago Child-Parent Centers”, University of Wisconsin, 2000
51 Arthur J Reynolds, J.A. Temple, D.L. Robertson, and E.A. Mann, “Age 21 Cost-Benefit Analysis of the Title I Chicago Child-Parent Centers”, Educational Evaluation and Policy Analysis, 24 (2002) pp 267-303. http://epa.sagepub.com/content/24/4/267.abstract and http://www.irp.wisc.edu/publications/dps/pdfs/dp124502.pdf See also, Conyers, LM, Reynolds, AJ, and S-R Ou, “The effects of early childhood intervention and subsequent special education services: Findings from the Chicago Child-Parent Centers”, Educational Evaluation and Policy Analysis, 23 (2003) pp 75-95.
52 “What You Need to Know about IDEA 2004 Response to Intervention (RTI): New Ways to Identify Specific
Learning Disabilities”, WrightsLaw, http://www.wrightslaw.com/info/rti.index.htm and “Data-based Decision Making”, National Center on Response to Intervention, http://www.rti4success.org/categorycontents/data-based_decision_making
53 IDEA, Part B, Section 619, Special Education Preschool Grants. This program provides grants to states, the District of Columbia, and Puerto Rico to make special education and related services available to children with disabilities, ages 3 through 5 and, at a state's discretion, to 2-year-olds with disabilities who will turn 3 during the school year. At their discretion, states may include preschool-age children who are experiencing developmental delays, as defined by the state and measured by appropriate diagnostic instruments and procedures, who need special education and related services. http://www2.ed.gov/programs/oseppsg/index.html

74
54 “Individuals with Disabilities Education Act - Cost Impact on Local School Districts”, Federal Education Budget Project, New America Foundation http://febp.newamerica.net/background-analysis/individuals-disabilities-education-act-cost-impact-local-school-districts
55 “Categories of Disability Under IDEA”, National Dissemination Center for Children with Disabilities, April 2009, http://nichcy.org/disability/categories#dd “Developmental delay” means a disability affecting a child ages two by September 30 through six, inclusive: (34 CFR 300 .8(b); 34 CFR 300.306(b)) 1. (i) Who is experiencing developmental delays, as measured by appropriate diagnostic instruments and procedures, in one or more of the following areas: physical development, cognitive development, communication development, social or emotional development, or adaptive development, or (ii) who has an established physical or mental condition that has a high probability of resulting in developmental delay; 2. The delay(s) is not primarily a result of cultural factors, environmental or economic disadvantage, or limited English proficiency; and 3. The presence of one or more documented characteristics of the delay has an adverse affect on educational performance and makes it necessary for the student to have specially designed instruction to access and make progress in the general educational activities for this age group.
56 “Individuals with Disabilities Education Act – Funding Distribution”, Federal Education Budget Project, New America
Foundation http://febp.newamerica.net/background-analysis/individuals-disabilities-education-act-funding-distribution
57 “Individuals with Disabilities Education Act – Funding Distribution”, Federal Education Budget Project, New America Foundation http://febp.newamerica.net/background-analysis/individuals-disabilities-education-act-funding-distribution
58 Thomas Parrish, Jenifer Harr, Jean Wolman, Jennifer Anthony, Amy Merickel, and Phil Esra, State Special Education Finance Systems, 1999-2000 Part II: Special Education Revenues and Expenditures March 2004, The Center for Special Education Finance, American Institutes for Research, 2004, p 3 http://csef.air.org/publications/csef/state/statepart2.pdf
59 Parrish et al, p 8
60 Parrish et al, p 7-8
61 Jay Chambers, Thomas Parrish, Jamie Harr, What Are We Spending on Special Education Services in the United States, 1999-2000. Special Education Expenditures Project (SEEP), American Institutes for
Research, Center for Special Education Finance, 2002, p 6 et seq. http://www.isbe.net/spec-ed/pdfs/se_task_force_report.pdf See also, Thomas Parrish, “Policy Alternatives for Special Education Funding in
Illinois”, American Institutes for Research, San Mateo, California, June 2010, p 4. http://www.isbe.net/spec-ed/pdfs/se_task_force_report.pdf
62 National Center for Education Statistics, “Measuring Inflation in Public School Costs: Working Paper”, U.S. Department of Education, December 1997, http://nces.ed.gov/pubs97/9743.pdf
63 IDEA Money Watch, http://www.ideamoneywatch.com/images/IDEAchildcount04-09.png
64 A Guide to the Individualized Education Program, U.S. Department of Education, http://ed.gov/parents/needs/speced/iepguide/index.html
65 Clive Belfield, The Cost Savings to Special Education from Pre-Schooling in Pennsylvania, Pennsylvania Build
Initiative, Pennsylvania Department of Education, 2005, p 10 http://www.portal.state.pa.us/portal/server.pt/document/887637/021810_special_edpsavingsbelfield_10-05_pdf?qid=34109777&rank=3
66 Jay G. Chambers, Jamie Shkolnik and María Pérez, “Total Expenditures for Students with Disabilities, 1999-2000:
Spending Variation by Disability”, Report 5, June 2003, American Institutes for Research http://csef.air.org/publications/seep/national/final_seep_report_5.pdf
67 Bellfield, p 12
68 Developmental Delay – added in 1997 – is an optional category available to states only for children through age 9. It allows young children to be served under IDEA without being assigned a specific disability designation. Fifteen states don’t use the Developmental Delay category at all (AR, CA, CO, CT, FL, IN, IA, MT, NJ, NY, OH, OR, SD, TX, and WV).
69 Guide, DOE

75
70 Guide, DOE
71 Guide, DOE
72 Steven Barnett, “Cost-Benefit Analysis of Preschool Education”, PowerPoint presentation, 2004 http://nieer.org/resources/files/BarnettBenefits.ppt
73 Arthur J. Reynolds, Judy A. Temple, Dylan L. Robertson, Emily A. Mann, “Age 21 Cost-Benefit Analysis of the Title I Chicago Child-Parent Centers”, Discussion Paper no. 1245-02, Institute for Research on Poverty, February 2002 http://www.irp.wisc.edu/publications/dps/pdfs/dp124502.pdf
74 Reynolds et al, p 8
75 "Fast Facts", Institute of Education Sciences http://nces.ed.gov/fastfacts/display.asp?id=158.
76 Barnett, http://nieer.org/resources/files/BarnettBenefits.ppt
77 Reynolds et al, p 4
78 Reynolds et al, Table 5A
79 Email from Arthur Reynolds to Robert Dugger, March 26, 2011, and phone discussion between Arthur
Reynolds and Robert Dugger, March 23, 2012
80 Chambers et al, p 6 et seq
81 Thomas Parrish, Policy Alternatives for Special Education Funding in Illinois, American Institutes for Research, June 2010, p 20 http://www.isbe.net/spec-ed/pdfs/se_task_force_report.pdf
82 Parrish, Exhibit 5, p 14
83 Benefits and Costs of Prevention and Early Intervention Programs for Youth, Washington State Institute for Public Policy, September 2004 http://www.wsipp.wa.gov/rptfiles/04-07-3901.pdf
84 Lynn A. Karoly and James H. Bigelow, "The Economics of Investing in Universal Preschool Education in California", Rand, 2005 http://www.rand.org/pubs/monographs/2005/RAND_MG349.pdf
85 Clive Belfield, The Cost Savings to Special Education from Pre-Schooling in Pennsylvania, Pennsylvania Build Initiative, Pennsylvania Department of Education, 2005 http://www.portal.state.pa.us/portal/server.pt/document/887637/021810_special_edpsavingsbelfield_10-05_pdf?qid=34109777&rank=3
86 Clive Belfield and Dennis Winters, “An Economic Analysis of Four-Year-Old Kindergarten in Wisconsin: Returns to the Education System”, Pre-K Now, 2005 http://www.pewcenteronthestates.org/uploadedFiles/wwwpewcenteronthestatesorg/Initiatives/Pre-K_Education/PEW_PkN_WIEconImpactReport_Sept2005.pdf
87 Clive Belfield, “An Economic Analysis of Pre-K in Arkansas”, Pre-K Now, 2006 http://www.pewcenteronthestates.org/uploadedFiles/wwwpewcenteronthestatesorg/Initiatives/Pre-K_Education/PEW_PkN_AREconAnalysisReport_Nov2006.pdf
88 Elisa, Aguirre and Thomas Gleeson, et al, A Cost-Benefit Analysis of Universally Accessible Pre-Kindergarten Education in Texas, The Bush School of Government & Public Service, Texas A&M University, 2006. http://www.tecec.org/files/350_to_1_Full_report.pdf
89 Steve Aos, Roxanne Lieb, Jim Mayfield, Marna Miller, and Anne Pennucci, “Benefits and Costs of Prevention and
Early Intervention Programs for Youth: Technical Appendix”, Washington State Institute for Public Policy, September 2004 http://courses.washington.edu/pbaf513m/prevention%20tech%20appendix.pdf
90 LA 4 Longitudinal Report, Center for Child Development, University of Louisiana at Lafayette, http://www.louisianaschools.net/lde/uploads/11515.pdf p 1
91 LA 4, p 6
92 For an initial list of the sources of statistical bias, see Wikipedia article on “Statistical Bias”
http://en.wikipedia.org/wiki/Statistical_bias

76
93 S. Bagnato, J Salway, and H Suen, Pre-K Counts in Pennsylvania for Youngsters’ Early School Success: Authentic Outcomes for an Innovative Prevention and Promotion Initiative, Heinz Foundation and Early Childhood Partnerships. 2009, p 15 http://www.heinz.org/UserFiles/Library/SPECS%20for%20PKC%202009%20Final%20Research%20Report%20113009.pdf
94 Pre-K Counts, p 24
95 Pre-K Counts, p 38
96 Pre-K Counts, p 39
97 Pre-K Counts, p 40
98 Pre-K Counts, pp 21-22
99 Early Childhood Assessment from Children from Birth to Age 8 (Grade 3), Early Learning Standards Task Force and Kindergarten Assessment Work Group, Pennsylvania BUILD Initiative, Pennsylvania’s Departments of Education and Public Welfare, December 2005 http://www.pakeys.org/docs/EarlyChildhoodAssessment.pdf p 27
100 Early Childhood Assessment, p 10
101 Pre-K Counts, p 31
102 Pre-k Counts, p 38
103 J Dubno and L Dolce, A Sustainable Financing Model for High Quality Preschool for At-Risk Children, Voices for Utah Children & Early Learning Ventures, Presentation to the National Business Leader Summit on Early Childhood Investment, July 2011, Boston, MA, p 1 http://www.partnershipforsuccess.org/uploads/20110713_SustainableFinancingModelPresentationtoPAESNationalBusinessLeaderSummitBostonJuly222011.pdf
104 “Handy Facts”, Granite School District, http://www.graniteschools.org/depart/superintendent/communications/handyfacts/Pages/HandyFacts.aspx
105 Granite School District, Federal Education Budget Project, New America Foundation, http://febp.newamerica.net/k12/UT/4900360
106 A Sustainable Financing Model, p 8
107 A Sustainable Financing Model, p 7-8
108 A Sustainable Financing Model, p 10
109 A Sustainable Financing Model, p 5
110 Revised results provided by the authors.
111 The weighted average cost of serving these 238 children in preschool (40% 2 years, 60% had 1 year) was approx $433,000.
112 See for example: Samuel J. Meisels, Assessing Readiness, CIERA Report #3-002, University of Michigan http://www.ciera.org/library/reports/inquiry-3/3-002/3-002.pdf
113 “State-Level School Readiness Documents (last updated 5/2011)”, The National Center on Quality Teaching and Learning, Resource Guide 2 http://eclkc.ohs.acf.hhs.gov/hslc/tta-system/teaching/docs/Resource-Guide-2.pdf
114 Operating, scholarship, and mentoring cost parameters draw heavily on the Saint Paul Early Childhood Scholarship Program Pilot Manual (Annotated and edited for communities considering the scholarship model), Minnesota Early Learning Foundation, 2011, and calculation spreadsheets, provided by Rob Grunewald, Federal Reserve Bank of Minneapolis. See Saint Paul Early Childhood Scholarship Program Evaluation: Final Evaluation Report, 2008-2011, SRI Project 18280 http://www.melf.us/vertical/Sites/%7B3D4B6DDA-94F7-44A4-899D-3267CBEB798B%7D/uploads/FINAL_MELF_Report_122311wAppendices.pdf
115 Appendix B, Pre-K Counts: End of Year Report 2009-2010, Pennsylvania Department of Education, Office of Child Development and Early Learning http://www.portal.state.pa.us/portal/http;//www.portal.state.pa.us;80/portal/server.pt/gateway/PTARGS_0_251851_1058396_0_0_18/PA_Pre-K_Counts_2009-2010_End_of_Year_Report.pdf
77
116 Timothy Bartik, Investing in Kids: Early Childhood Programs and Local Economic Development, Upjohn Institute, 2011 http://www.upjohn.org/Publications/Titles/InvestinginKids
117 Benefits and Costs of Prevention and Early Intervention Programs for Youth, Washington State Institute for Public Policy, September 2004 http://www.wsipp.wa.gov/rptfiles/04-07-3901.pdf
118 Steve Aos, Roxanne Lieb, Jim Mayfield, Marna Miller, and Anne Pennucci, “Benefits and Costs of Prevention and Early Intervention Programs for Youth: Technical Appendix”, Washington State Institute for Public Policy, September 2004 http://courses.washington.edu/pbaf513m/prevention%20tech%20appendix.pdf
119 S. Bagnato, J Salway, and H Suen, Pre-K Counts in Pennsylvania for Youngsters’ Early School Success: Authentic Outcomes for an Innovative Prevention and Promotion Initiative, Heinz Foundation and Early Childhood Partnerships. 2009, p 15 http://www.heinz.org/UserFiles/Library/SPECS%20for%20PKC%202009%20Final%20Research%20Report%20113009.pdf
120 Bethlehem Area School District, Federal Education Budget Project, New America Foundation
http://febp.newamerica.net/k12/PA/4203570
121 Bethlehem Area School District 2012-13 Proposed Preliminary Budget, Bethlehem Area School District, Bethlehem PA, January 2012, p 3 For the purposes of this working group report, the spending on Gifted and Talented program was shifted out of the Special Education budget and put into the Regular Education budget. http://www.beth.k12.pa.us/business/budget/1213budget/BASD_1213_Preliminary_Budget.pdf
122 From discussions with Susan Mitchell, Chief, Division of Standards and Professional Development Office of Child Development and Early Learning, Departments of Public Welfare and Education, Harrisburg, PA
123 “Keystone Stars”, Early Childhood Programs, Pennsylvania Early Learning, http://www.pakeys.org/pages/get.aspx?page=Programs_STARS
124 S. Bagnato, J Salway, and H Suen, Pre-K Counts in Pennsylvania for Youngsters’ Early School Success: Authentic Outcomes for an Innovative Prevention and Promotion Initiative, Heinz Foundation and Early Childhood Partnerships. 2009, p 15 http://www.heinz.org/UserFiles/Library/SPECS%20for%20PKC%202009%20Final%20Research%20Report%20113009.pdf
125 Virginia Preschool Initiative, Early Childhood, Virginia Department of Education http://www.doe.virginia.gov/instruction/early_childhood/index.shtml#va_preschool_initiative
126 Program-Related Investments, Charities and Non- Profits, Internal Revenue Service http://www.irs.gov/charities/foundations/article/0,,id=137793,00.html Program-related investments are those in which:
1. The primary purpose is to accomplish one or more of the foundation's exempt purposes, 2. Production of income or appreciation of property is not a significant purpose, and 3. Influencing legislation or taking part in political campaigns on behalf of candidates is not a purpose.
In determining whether a significant purpose of an investment is the production of income or the appreciation of property, it is relevant whether investors who engage in investments only for profit would be likely to make the investment on the same terms as the private foundation. If an investment incidentally produces significant income or capital appreciation, this is not, in the absence of other factors, conclusive evidence that a significant purpose is the production of income or the appreciation of property. To be program-related, the investments must significantly further the foundation's exempt activities. They must be investments that would not have been made except for their relationship to the exempt purposes. The investments include those made in functionally related activities that are carried on within a larger combination of similar activities related to the exempt purposes.
The following are some typical examples of program-related investments: 1. Low-interest or interest-free loans to needy students, 2. High-risk investments in nonprofit low-income housing projects, 3. Low-interest loans to small businesses owned by members of economically disadvantaged groups, where commercial funds at reasonable interest rates are not readily available,

78
4. Investments in businesses in deteriorated urban areas under a plan to improve the economy of the area by providing employment or training for unemployed residents, and 5. Investments in nonprofit organizations combating community deterioration.
127 “Program-Related Investing: Skills and Strategies for New PRI Funders”, Grant Craft, http://www.grantcraft.org/index.cfm?fuseaction=Page.ViewPage&pageId=1294
128 “Program-Related Investments: Leveraging Our Resources to Catalyze Broader Support for Our Mission, About the Foundation, Bill & Melinda Gates Foundation http://www.gatesfoundation.org/about/Pages/program-related-investments-faq.aspx