Embed Size (px)
Citation preview
E.A. Belousova Æ W.L. Griffin
Suzanne Y. O’Reilly Æ N.I. Fisher
Igneous zircon: trace element composition as an indicatorof source rock type
Received: 10 January 2000 /Accepted: 18 March 2002 / Published online: 31 May 2002� Springer-Verlag 2002
Abstract Trace element abundances in igneous zircons,as determined by electron microprobe and laser-ablationmicroprobe ICPMS analysis, are shown to be sensitive tosource rock type and crystallisation environment. Theconcentrations of 26 trace elements have been deter-mined for zircons from a wide range of different rocktypes and reveal distinctive elemental abundances andchondrite-normalised trace element patterns for specificrock types. There is a general trend of increasing traceelement abundance in zircons from ultramafic throughmafic to granitic rocks. The average content of REE istypically less than 50 ppm in kimberlitic zircons, up to600–700 ppm in carbonatitic and lamproitic zircons and2,000 ppm in zircons from mafic rocks, and can reach percent levels in zircons from granitoids and pegmatites.Relatively flat chondrite-normalised REE patterns withchondrite-normalised Yb/Sm ratios from 3 to 30 cha-racterise zircons from kimberlites and carbonatites, butYb/Sm is commonly over 100 in zircons from pegmatites.Th/U ratios typically range from 0.1 to 1, but can be 100–1000 in zircons from some carbonatites and nephelinesyenite pegmatites. The geochemical signatures charac-teristic of zircon from some rock types can be recognisedin bivariate discriminant diagrams, but multivariatestatistical analysis is essential for the discriminationof zircons from most rock types. Classification trees
based on recursive partitioning techniques provide arapid means of relating parent rock type to zircon traceelement analysis; zircons from many rock types can bediscriminated at confidence levels of 75% or more. Thesetrees allow recognition of the provenance of detritalzircons from heavy mineral concentrates, and signifi-cantly enhance the usefulness of zircon in regional crustalstudies and as an indicator mineral in mineral explora-tion.
Introduction
Zircon is a remarkable mineral because of its ubiquitousoccurrence, ranging from crustal rocks to mantle xeno-liths, lunar rocks, meteorites and tektites (e.g. Speer1980). It is chemically resistant and refractory, and cansurvive both weathering and transport processes as wellas high temperature metamorphism and anatexis. It can,therefore, be found in many igneous, metamorphic andsedimentary rocks and is particularly common in plu-tonic rocks.
Zircon is generally present as small, early-formedcrystals, commonly enclosed in later-formed minerals,but may form large well-developed crystals in granitepegmatites and particularly in nepheline syenites (Deeret al. 1966) and carbonatites; large zircon megacrystsalso are common in kimberlites and alkali basalts.Watson (1979) showed experimentally that the zirconsaturation level in felsic liquids depends strongly on themolar (Na2O+K2O)/Al2O3 ratio of the melts, with re-markably little sensitivity to temperature, SiO2 contentor the Na2O/K2O ratio of the melt. For peraluminousmelts and those lying in the quartz–orthoclase–albitecompositional plane, less than 100 ppm Zr is requiredfor zircon saturation (Watson and Harrison 1983). Inperalkaline melts, however, zircon solubility showspronounced and apparently linear dependence on(Na2O+K2O)/Al2O3 with the amount of Zr in solutionranging up to 3.9 wt% at (Na2O+K2O)/Al2O3=2.0.
Contrib Mineral Petrol (2002) 143: 602–622DOI 10.1007/s00410-002-0364-7
E.A. Belousova (&) Æ W.L. Griffin Æ S.Y. O’Reilly Æ N.I. FisherGEMOC ARC National Key Centre,Department of Earth and Planetary Sciences,Macquarie University,NSW 2109, AustraliaE-mail: [email protected]
W.L. GriffinCSIRO Exploration and Mining,North Ryde, NSW 2113, Australia
N.I. FisherSchool of Mathematics and Statistics,University of Sydney,NSW 2006, Australia
Editorial responsibility: W. Collins

This low saturation level means that any felsic, non-peralkaline magma is likely to precipitate zircon.
The importance of this accessory mineral lies in thecombination of its tendency to incorporate traceelements (including radionuclides), its chemical andphysical durability and its remarkable resistance to high-temperature diffusive re-equilibration (Cherniak et al.1997a, 1997b; Watson and Cherniak 1997). Althoughzircon abundance is commonly low, it may stronglyaffect the behaviour of many trace elements during thecrystallisation of magma, and understanding its com-positional variation is thus important for petrologicalmodelling (e.g. Nagasawa 1970; Watson 1979; Muraliet al. 1983; Hoskin et al. 2000).
U–Pb dating of detrital zircons is already widely usedin sediment provenance studies. Hf isotopic data ob-tained from zircons provide a powerful tool for thestudy of crustal evolution (Griffin et al. 2002a, 2002b),by adding another dimension to the geochronology. Ifthe original rock parent type of detrital zircons in heavymineral concentrates can be recognised, it could addanother layer of information to such provenance studies,and greatly enhance their interpretability. One aim ofthis study has been to provide the basis for this enhancedinterpretation.
In addition to its dominant role in controlling zirco-nium and hafnium distribution, zircon can have a sig-nificant influence on the behaviour of rare earthelements, Y, Th, U, Nb and Ta. Their large ionic radiiand high charge make these elements incompatible inmany rock-forming silicate minerals and they generallybecome concentrated in the residual melts and are in-corporated in the late-crystallising zircon as the crystalstructure of zircon accommodates widely varying pro-portions of trace elements. The abundance and ratios ofthese trace elements are potentially useful in distin-guishing zircons from different sources (e.g. Chyi 1986;Heaman et al. 1990). Our approach, therefore, has beento analyse as wide a range of trace elements as possible,in zircons from a wide range of rock types, and toidentify discriminants that can distinguish among thesezircons.
Sampling
Zircon samples have been selected from a range ofigneous rock types (kimberlites, lamproites, basalts,carbonatites, dolerite, granitoids, syenitic rocks, syenitepegmatites and nepheline–syenite pegmatites) fromdifferent geographical localities as listed in Table 1. Theaim of this sampling was to collect zircons from a widerange of commonly occurring igneous rocks; samplesfrom less common lithologies then were added, to ex-tend the range of bulk compositions represented. Zir-con macrocrysts from kimberlites, alkali basalts andlamproites have been included specifically to test thedegree to which these xenocrysts represent distinct
populations, and to see if their ultimate source(s) canbe identified by comparison with zircons from otherrock types.
Zircons from kimberlites
Zircon is a widespread trace mineral in kimberlites, andis recognised as a member of the low-Cr suite of mantle-derived megacryst minerals (Moore et al. 1992). Despiteits low abundance in kimberlites, zircon is commonlyrecovered during diamond production because of itshigh density and X-ray fluorescence. Kimberlitic zirconsare characterised by the almost complete absence ofcrystal faces; they are usually rounded to subrounded,apparently by resorption in the kimberlitic magma(Belousova et al. 1998). The other distinctive morpho-logical feature of the kimberlite zircons is their large size(typically several millimetres), although Kresten et al.(1975) and Lyakhovich (1996) have reported smalleuhedral grains of zircon in kimberlites. Kimberliticzircons vary from colourless to reddish brown, withhoney-yellowish colours most common. Some grainshave a whitish coating previously identified as a mixtureof monoclinic (baddeleyite) and tetragonal zirconia andthought to be a result of reaction with the magma(Kresten et al. 1975).
Trace element compositions were analysed in 155zircon crystals from 35 kimberlite pipes of SouthernAfrica, Russia and Australia. Zircons from SouthAfrican kimberlites are the best represented group,with 67 grains from 13 different kimberlite pipes(Table 1) available for this study. Preliminary resultsfor these grains were reported by Belousova et al.(1998, 1999).
Yakutian kimberlitic zircons (Russia) are representedby 39 grains from 19 kimberlite pipes in eight kimberlitefields (Table 1). Chains of kimberlites stretching acrossthe NE part of the Siberian Craton extend across theArchaean Magan and Anabar Provinces, into the Pro-terozoic Olenek Province. The Malo-Botuobiya, Alakit,Kharamai and Upper Muna fields occur in the on-cra-ton areas with thick Archean lithosphere and the lowgeotherm required for high diamond prospectivity. TheChomurdakh, Merchimden, Kuoika and West Ukukitfields are in off-craton (Proterozoic) settings, and noneof these kimberlites is likely to be significantly diamon-diferous (Griffin et al. 1995, 1999).
Australian kimberlitic zircons are represented by 45grains from three small kimberlite bodies: Orroroo fromSouth Australia, Pteropus from the Kimberley Blockand Timber Creek from the Northern Territory. TheTimber Creek kimberlites (on the North AustralianCraton) have a diamond grade of 1 carat/tonne (Ber-ryman et al. 1999); the Orroroo kimberlite pipe (on theProterozoic Gawler craton) is known to contain rarediamonds, whereas Pteropus (possibly on an Archeancraton) is barren.
603

Zircons from lamproites
Lamproitic zircons are represented by 11 grains from theArgyle lamproite pipe in the East Kimberley region ofWestern Australia and by 14 grains from lamproiticrocks of the Kirovograd Block of the Ukraine Shield(Belousova et al. 1999).
Argyle zircons are large (up to 2 mm), clear to lightbrown euhedral to subhedral fragments that werebroken either during eruption or processing. Many ofthe surfaces are covered by iron oxides. SHRIMP ionprobe U–Pb dating defined two groups of zircons withmean ages of ca. 1,650 and ca. 1,750 Ma (R. Page andL. Jaques, unpublished data; L. Jaques personal com-munication 1999). Both of these ages are older thanthe accepted age for the lamproite intrusion (ca.1,180 Ma; Jaques et al. 1986), but younger than mostU–Pb ages of crustal rocks in the area (1,800–1,900 Ma).
Lamproitic zircons from the Kirovograd Block comefrom the Precambrian areas of the Ukrainian shield, atectonic environment similar to that of the KimberleyBlock of Western Australia (Yatsenko et al. personalcommunication 1999). In contrast to the Argyle lam-proite pipe, the lamproitic rocks of the Kirovograd
Block are not significantly diamondiferous (B. Panov,personal communication 1997). Kirovograd zircons varyfrom pink and orange to dark red and brown with grainsizes of 0.5–1 mm.
Zircon xenocrysts in basalt
Zircons of this type are represented by detrital zirconmegacrysts derived from alkali basalts in NSW, Aus-tralia, Thailand and Cambodia, and a zircon intergrownwith an anorthoclase xenocryst in basalt from Riley’sPeak, NSW.
Ten zircon grains that occur together with diamondsin the Dobe Lead palaeochannel, NSW, may be derivedfrom the surrounding basalts (Griffin et al. 1989). Theyare orange, orange pink and brown and from 0.5 to3.5 mm across. The brown and yellow zircons from In-verell, NSW are associated with detrital corundum(Griffin et al. 1989). Intergrowths of corundum + zirconand anorthoclase + zircon are known from the Inverellarea, and zircon is a common inclusion in corundumfrom this location (Guo et al. 1996). These zircons areapparently part of a xenocryst suite carried to the sur-face by the basaltic lavas and pyroclastics, and are
Table 1. Locations of host rocks for zircons of this study
Rock type Country Location Number of grains Number of analyses
Kimberlite Russia Kimberlite fields: Malo-Botuobiya,Alakit, Kharamai, Upper Muna,Chomurdakh, Merchimden, Kuoikaand West Ukukit
39 64
Southern Africa Kimberlite pipes: Monastery Mine,Dyke 170, Sekameng/Butha Buthe,Mothae, Kao 1, Lemphane, DeBeers Mine, Bultfontein, Wesselton,Noeniput, Kao Quarry, Leicesterand Orapa
71 165
Australia Kimberlite pipes: Timber Creek,Pteropus and Orroroo
45 61
Lamproite Australia Argyle 11 20Ukraine Kirovograd Block 14 14
Basalt Australia Dobe Lead, Inverell, Riley’s Peak (NSW) 20 21Thailand Chatabum 3 4Cambodia Schmach 2 2
Carbonatite Australia Mud Tank 2 Megacrysts 16Russia Kovdor 21 Grain fragments 21
Dolerite Ukraine Crimea Mountains 25 25Granitoids Australia New England Batholiths: Stanthorpe
aplitic granite, Gilgai leucogranite,Round Mount granite, Copetongranodiorite, Hillgrove granodiorite,Uralla granodiorite, Dundee rhyodacite.Lachlan Fold Belt: Kyemba adamellite,Berridale adamellite, Moruya tonalite,Kosciusko tonalite
77 149
Ukraine Granitic pebbles, Crimea Mountains 16 16Syenitic rocks Canada Kuehl lake syenite, Ontario 4 4
Norway Oslo Rift larvikite (sample A58 and A61) 32 36Syenite pegmatite Norway Risøya, Langesundsfjorden and
Fredricksvaern, Larvik6 Megacrysts 24
Nepheline-syenitepegmatites
Norway Stokø, Langesundsfjorden andTreschovs Fritzoe Quarry, Tvedalen
3 Megacrysts 20
604
considered to be genetically unrelated to the basalts(Griffin et al. 1989; Guo et al. 1996).
Zircon megacrysts several millimetres long fromThailand and Cambodia are also xenocrysts in alkalibasalts (P. Wathanakul, personal communication) thatare mined for sapphire. A 2-mm zircon megacryst in-tergrown with anorthoclase comes from the nephelinebasanite of Riley’s Peak in the Southern HighlandsBasalt Province, New South Wales (Wass 1980).Cathodoluminescence reveals internal zoning with a bluecore and yellow rim in this megacryst.
Zircon from carbonatites
Carbonatitic zircons are represented by megacrysts fromthe Mud Tank carbonatite complex, central Australiaand the Kovdor carbonatite complex, Kola peninsula,Russia. Mud Tank zircons are large brown euhedra 1–3 cm long parallel to the c-axis. Two megacrysts weresectioned for analytical work. Kovdor zircons availablefor this study were crushed fragments, 0.25–0.5 mm insize, of large megacrysts separated from the carbonatitesof the complex. They are light green and contain car-bonate inclusions visible under cathodoluminescence.
Zircon from dolerite
Twenty-five representative grains were selected from azircon concentrate separated from a Jurassic dolerite inthe Crimea Mountains, Ukraine. They are transparenteuhedral crystals with a grain size of 100–200 lm.
Zircon from granitoid rocks
Four to twelve representative zircon grains were selectedfrom each of 12 granitoid rock samples from the NewEngland Batholith and the Lachlan Fold Belt, Australia,and from granitic pebbles from the Crimea Mountains,Ukraine. The granitoids in this study represent a rangeof rock composition from rhyodacite, tonalite andgranodiorite (64–65 wt% SiO2) to felsic granite, leu-cogranite and aplitic granite (over 76 wt% SiO2).
The Palaeozoic New England Fold Belt underlies thenorth-eastern part of New South Wales and easternQueensland in eastern Australia. Most of the Fold Beltis composed of tholeiitic and calc-alkaline igneous rocks,sediments and subduction-accreted oceanic rocks(Leitch et al. 1988). The Palaeozoic Lachlan Fold Belt ofEastern Australia is characterised by Ordovician flyschdeposits into which I- and S-type granitoids (Chappelland White 1974, 1992) have intruded.
Granitic pebbles from the Upper Jurassic conglom-erates of the Crimea Mountains, and zircons from thesepebbles, have been studied previously by Andreev et al.(1993) to obtain information on their provenance and onthe geological history of the region. U–Pb dating of
these zircons yielded an age range of 1,000–1,500 Ma,with one sample giving an age of about 2,100 Ma(Andreev et al. 1993).
Most of the studied zircon crystals show complexinternal structures (e.g. oscillatory zoning, inheritedcores, resorption features, etc.) in backscattered-electronand cathodoluminescence images that are not visible intransmitted or reflected light under the petrographicmicroscope. The small size of the granitic zircons, rarelyover 100–150 lm, allowed only two analytical points bylaser ablation microprobe on each grain to obtain thetrace element data.
Zircon from syenitic rocks
Zircons from syenitic rocks are represented by fragmentsfrom a syenite (Ontario, Canada) and by grains fromlarvikites (monzonite-syenites) in the Oslo Rift, Norway.The Ontario sample (91500) consists of fragments (3–4 mm in size) of a larger crystal used as a geochemicalstandard for calibrating the U–(Th)–Pb geochronometerand Hf isotopic analyses (Wiedenbeck et al. 1995). Thelocation is the Kuehl Lake syenite, Ontario, Canada,where the predominant rock type is porphyroblasticsyenite gneiss, which is cross cut by sheets or sills ofsyenite pegmatite (Wiedenbeck et al. 1995).
The Oslo Rift is an intracontinental rift zone thatexperienced extensive magmatism in Permian time. Fel-sic rocks of intermediate (monzonitic) composition makeup about 40% of the exposed area (Neumann 1980). Themost common variety is ‘larvikite’, a feldspar-rich (sy-enitic) rock produced by fractional crystallisation ofmafic magmas. Most of the larvikites are slightly over-saturated to slightly undersaturated in silica. Larvikiticzircons, separated from samples (A-58 and A-61) pro-vided and described by Andersen (1981, 1984), arehoney-brown, transparent grains 0.25–0.5 mm in size.
Zircons from syenite and nepheline–syenitepegmatites
Large (0.3–0.8 cm) zircon crystals from syenite pegma-tites and nepheline–syenite pegmatites of the OsloPermian igneous suite, Norway, are transparent andrange from pale yellow to brownish in colour. They wereprepared as polished thick (100 lm) sections and fromthree to seven analyses were made across each sample.Differentiation of the larvikites (Neumann 1980) hasproduced a series of feldspar–nepheline–femic silicate–apatite cumulate rocks known as lardalites, whereas theresidual magmas form nepheline–syenite pegmatites. Aseries of nepheline-free ‘syenite pegmatites’ formed atearlier stages and represent volatile-rich portions of in-dividual magma chambers. The Risøya and Fred-ricksvaern zircons (Table 1) are from syenite pegmatites,whereas the Stokø and Tvedalen zircons are fromnepheline–syenite pegmatites.
605

Analytical techniques
Zircon grains were hand-picked under a binocular microscope andmounted in epoxy blocks for analysis. Large crystals were preparedas polished sections about 100 lm thick. Prior to analytical work,polished surfaces were examined for zoning using cathodolumi-nescence (CL) microscopy and back-scattered electron (BSE)/CLimages taken on the electron microprobe.
Cathodoluminescence microscopy
A cold cathode luminescence stage CITL, Model CCL 8200 mk3,mounted on a petrographic microscope was used to study the in-ternal structure of grains with sizes exceeding 1 mm. The sampleswere irradiated in a vacuum chamber with an electron beam of 10–15 kV produced by the electron gun supply. The operating vacuumwas in the range from 0.2 to 0.08 Torr and an operating current of400–500 lA was used during observation.
Cameca CAMEBAX SX50 electron microprobe
Hf contents of the zircons were determined by electron microprobeso that Hf could be used as the internal standard for trace elementdeterminations by laser ablation ICPMS. An accelerating voltageof 15 kV and a beam current of 20 nA were used for all analyses.The spatial resolution of the electron microprobe was about 2 lm.The detection limit for Hf was 0.12% with a precision of 2.5% rsdat 1.5% HfO2.
Combined BSE/CL observations were made using theCAMEBAX SX50 electron microprobe with operating conditionsof 15 kV accelerating voltage and 15–20 nA beam current. Theimages are a combination of BSE and CL phenomena obtained byoperating the BSE detector at high gain amplification; the BSEimage reflects differences in the mean atomic number of the zirconcomposition and CL is produced by the irradiation of the zirconwith the electron beam.
The relationships between chemistry and CL/BSE response inkimberlitic and lamproitic zircons have been discussed by Belous-ova et al. (1998, 1999). In many of the other samples studied here,the zoning revealed by these studies is on a scale finer than thelaser-microprobe spot size. A detailed discussion of the relation-ships between such zoning and the chemical and isotopic compo-sition of the zircon is outside the scope of this paper and will bepresented elsewhere. In this work, the main use of the CL/BSEimages was to avoid clearly altered areas of the crystals beinganalysed, and to distinguish magmatic zircons from possible lateovergrowths.
Laser ablation ICPMS microprobe
Trace elements have been analysed by a UV laser ablation mi-croprobe coupled to either a Perkin–Elmer ELAN 5100 ICPMS ora Perkin–Elmer ELAN 6000 ICPMS at GEMOC, MacquarieUniversity. Detailed descriptions of instrumentation and analyticaland calibration procedures are given by Norman et al. (1996, 1998).The laser-ablation system is a Continuum Surelite I-20 Q-switchedNd: YAG laser with a fundamental infrared (IR) wavelength at1,064 nm and a pulse width of 5–7 ns. Two frequency doublingcrystals provide second and fourth harmonics in the visible (VIS,532 nm) and ultraviolet (UV, 266 nm), respectively. The 266-nmbeam was used for the trace element analyses reported here. Mostof the analyses have been done with a pulse rate of 4 Hz (pulses persecond) and a beam energy of 1 mJ per pulse, producing a spatialresolution of 30–50 lm. Small grains (less than 100 lm across) wereanalysed using a pulse rate of 2 Hz and a beam energy of about0.5 mJ per pulse, achieving spatial resolution of about 30 lm.
The NIST 610 standard glass was used as the externalcalibration standard. Quantitative results for 26 elements were
obtained through calibration of relative element sensitivities usingthe NIST-610 standard glass, and normalisation of each analysis tothe electron-probe data for Hf as an internal standard. The refer-ence data for the NIST 610 calibration standard glass are given inNorman et al. (1996, 1998).
The NIST 610 standard glass was analysed as an unknown atleast once for each 15 mineral analyses to assess the data quality.The precision and accuracy of these NIST 610 analyses are 2–5%for REE, Y, Sr, Nb, Ta, Hf, Th and U at the ppm concentrationlevel, and from 8 to 10% for Mn, P, Fe, Ga, Sn and Pb.
Zircon 91500, from an Ontario syenite, has been analysed forHf, U and Th by several methods. Preliminary data on its REEcontents has been obtained by ion microprobe and INAA(Wiedenbeck et al. 1995). A comparison of our analyses with thepublished data is shown in Table 2. This zircon is reasonably ho-mogeneous, but different analytical techniques show a range in Hfcontent from 0.56 to 0.73%; our value lies in the middle of thisrange. Our values for the REE, U and Th also overlap the availabledata within analytical uncertainties, but tend to lie higher than themean of the ion probe and INAA data. More detailed comparisonswill be facilitated by the ongoing interlaboratory calibration of thisstandard for trace element analysis (Wiedenbeck, personal com-munication 2001).
Results
Analytical data are presented in Tables 3, 4, 5 and 6 asthe mean (±SD) and median values for zircons fromeach rock type. These data provide a summary of theabsolute levels of each element, the range of variation,and the degree of skewness of the data. Chondrite-nor-malised averaged trace element abundances for zirconsfrom each rock type are shown in Figs. 1 and 2. Theindividual data points for each rock type are shown inFigs. 3, 4 and 5.
Silica ranges from 30.9 to 33.3% SiO2 and ZrO2 from63.0 to 68.3% in non-metamict zircons. In contrast, thetrace element concentrations may vary over severalorders of magnitude (Tables 3, 4, 5 and 6, Fig. 1).
Table 2. Trace element data (ppm) for the 91500 zircon standardcompared with previously reported data (Wiedenbeck et al. 1995)
This work (n=4) Wiedenbeck et al. (1995)
Y 147±22La <0.08±0.05Ce 2.5±0.5 2.0±0.1 n=4, IPPr <0.05±0.05Nd <0.35±0.07 0.4 n=1, IPSm 0.41±0.2 0.3 n=1, IPEu 0.37±0.17 0.26±0.07 n=6, IP/NAAGd 2.1±0.35 1.93±0.10 n=4, IPDy 12±2.1 8.0±.14 n=4, IPHo 4.9±0.7Er 26±3.6 20.4±0.8 n=4, IPYb 66±7.3 57.4±16.7 n=6, IP/NAALu 14±1.9 12.4±0.9 n=2, NaATh 31±4.9 34.6±6.9 n=4, ID/NAAU 88±15 81.2±4.5 n=11, IDHf (wt%) 0.64±0.09 0.59±0.01 n=18, PMP
0.73±0.05 n=16, IP0.59±0.03 n=4, ID0.56±0.01 n=99, EMP
606

Table
3.
Tra
ceel
emen
tco
nte
nts
(ppm
)ofzi
rcons
from
ara
nge
ofro
ckty
pes
Rock
type
Kim
ber
lite
Lam
pro
ite
Carb
onatite
Quart
ile
Min
.1st
Quart
.M
edia
n3rd
Quart
.M
ax.
Min
.1st
Quart
.M
edia
n3rd
Quart
.M
ax
Min
1st
Quart
.M
edia
n3rd
Quart
.M
ax
P21
49
61
77
343
64
107
149
221
543
21
38
52
69
144
Ti
<1.9
12
18
24
779
<3.2
4.9
9.3
16
68
<3.6
––
–<
22
Mn
<0.0
6–
–<
1.4
17
<0.5
8–
–<
1.5
4.2
<0.3
7–
–<
0.9
84,6
Fe
<0.0
1–
–<
21.3
819
<42
––
<66
142
<22
––
<49
59
Ga
<0.0
6–
–<
0.8
111
<0.3
8–
<1.0
1.3
2.6
<0.3
8–
––
<1.9
3Sr
<0.0
20.0
80.1
30.2
5144
<0.1
2–
<0.3
90.5
72.1
<0.0
30.0
90.1
40,4
02,3
Y4.0
20
31
56
194
53
215
399
701
1.0
81
22
159
379
471
757
Nb
<0.4
42.2
2.9
4.1
23
0.1
60.8
71.3
1.6
5.2
0.7
03.0
10
42
116
Sn
<0.0
5–
<0.4
40.7
35.5
<0.2
2–
<0.8
81.1
2.3
<0.3
8–
<0.6
60,9
2,5
Ba
<0.0
2–
<0.1
50.2
912
<0.1
2–
<0.3
31.4
9.4
<0.0
7–
–<
0.2
43,5
La
<0.0
1–
<0.0
90.1
64.0
<0.0
6–
<0.2
0.3
2.3
<0.0
3<
0.0
60.1
70,6
12,9
Ce
0.1
60.6
30.8
71.2
6.7
2.3
5.6
7.9
12
30
0.3
41.1
4.5
8,3
20
Pr
<0.0
1–
<0.0
80.1
52.0
<0.0
50.0
90.1
50.2
81.1
<0.0
3<
0.0
50.5
41,7
4,7
Nd
<0.0
60.2
40.3
90.6
75.0
0.6
71.0
41.8
3.4
7.7
<0.2
30.6
06.2
17
37
Sm
<0.0
80.3
00.5
30.8
64.2
0.4
81.5
3.3
5.0
9.5
<0.0
51.4
6.6
12
25
Eu
<0.0
20.1
70.3
60.6
43.4
<0.0
60.2
80.5
00.7
73.3
<0.0
90.7
44.0
6,7
16
Gd
<0.0
60.8
71.4
83.1
10
3.3
7.3
15
21
33
<0.2
94.8
20
31
69
Dy
<0.1
32.4
64.1
47.7
25
6.9
29
37
68
106
3.1
18
56
69
128
Ho
0.1
30.7
31.2
82.1
7.7
1.5
7.4
14
24
36
0.8
6.1
15
19
34
Er
0.3
92.5
04.2
57.0
25
5.2
28
63
104
154
3.1
24
53
60
102
Yb
0.1
63.6
05.6
48.9
36
6.9
36
126
179
277
4.6
32
64
78
115
Lu
0.1
20.6
31.0
51.5
6.8
1.2
5.9
28
39
56
0.9
5.9
11
14
19
Hf
(wt%
)0.5
71.1
41.3
11.5
2.3
0.7
90.9
41.0
01.1
31.3
00.7
90.9
41.0
41,1
51,2
7Ta
0.1
01.8
92.3
83.0
13
0.0
70.2
50.4
50.7
42.1
1.1
3.1
6.1
8,6
26
Pb
<0.0
3<
0.1
70.2
90.5
718
<1.0
3.8
6.6
13
29
0.5
3.8
7.7
11
18
Th
0.8
42.0
3.6
5.0
48
12
34
64
126
188
2.9
30
212
462
845
U3.0
7.4
9.8
14
69
17
45
74
204
348
<0.0
3<
0.0
90.2
939
131
Num
ber
of
analy
ses
284
34
37
607

Table
4.
Tra
ceel
emen
tco
nte
nts
(ppm
)of
zirc
ons
from
ara
nge
ofro
ckty
pes
Rock
type
Basa
ltD
ole
rite
Gra
nitoid
Quart
ile
Min
1st
Quart
.M
edia
n3rd
Quart
.M
ax.
Min
.1st
Quart
.M
edia
n3rd
Quart
.M
ax.
Min
.1st
Quart
.M
edia
n3rd
Quart
.M
ax.
P29
49
58
113
238
195
233
260
317
396
110
414
763
1,4
97
12,7
48
Ti
<2.7
<4.9
6.0
9.7
17
<12
–<
22
26
140
<9.5
25
44
182
24,3
05
Mn
<2.4
––
<19
31
<1.6
–<
5.2
6.2
11
<1.6
<6.8
23
91
2,9
51
Fe
<83
––
<174
220
<93
––
<325
484
<91
<251
868
2,9
81
41,8
23
Ga
<0.2
3–
–<
1.2
44.3
<0.7
4–
-<
2.3
6.6
<1.4
–<
4.6
7.4
67
Sr
<0.0
6–
–<
0.3
51.1
<0.3
5–
<0.6
60.9
26
<0.2
3<
1.4
4.7
26
655
Y83
282
417
899
2,3
42
821
1,7
97
2,3
34
3,1
92
4,4
15
376
1,4
38
2,5
15
5,6
02
67,9
22
Nb
<0.2
21.4
3.8
5.2
76.0
<0.3
3–
<0.7
91.0
1.5
<0.4
82.4
4.3
39
3,4
60
Sn
<0.1
4<
0.9
61.2
1.6
5.4
<0.6
5–
–<
2.1
5.0
<0.8
9–
<3.7
7.3
2,2
22
Ba
<0.0
3–
–<
0.2
91.9
<0.3
3–
<0.5
90.9
13
<0.2
<1.2
5.1
28
1,8
33
La
<0.0
3–
–<
0.2
82.4
<0.2
1–
–<
0.5
71.3
<0.1
72.4
12.0
52
7,1
44
Ce
0.6
1.2
2.1
4.4
76
3.5
5.4
7.1
8.3
19
1.5
18.6
61.0
283
15,6
15
Pr
<0.0
2<
0.0
60.0
80.1
67.1
<0.1
8–
<0.2
50.3
1.1
<0.1
22.0
8.0
43
2,1
10
Nd
<0.1
3<
0.6
80.9
2.4
65
<1.3
–<
2.4
3.8
6.6
<0.6
610.1
44.7
198
8,4
56
Sm
<0.6
0.9
1.8
4.3
50
<1.0
3.8
5.3
7.6
21
<0.5
7.4
21.5
131
2,1
67
Eu
<0.2
0.7
1.6
2.8
22
<0.2
5<
0.4
70.9
1.3
2.6
<0.2
40.8
2.1
7497
Gd
<0.7
5.0
11
20
128
11
25
38
56
95
1.0
30
58
238
2,6
22
Dy
7.2
22
35
121
319
55
136
185
264
376
25
128
224
695
8,3
19
Ho
2.8
10
15
34
89
26
56
74
102
151
11
48
85
203
2,3
17
Er
15
46
65
142
330
131
271
352
481
671
60
214
378
781
8,9
06
Yb
31
101
118
230
610
305
558
659
862
1,1
49
173
459
769
1,6
94
17,8
60
Lu
5.1
22
25
42
117
73
118
153
179
235
34
86
150
299
2,4
70
Hf
(wt%
)0.5
30.5
80.6
10.6
90.8
30.8
70.9
30.9
50.9
81.0
30.6
51.0
81.2
81.4
33.0
7Ta
0.2
0.7
1.6
2.6
20
<0.1
9–
–<
0.4
70.9
<0.3
1.1
2.3
8.6
266
Pb
<0.1
3–
<0.7
81.1
34
<0.9
52.2
3.3
4.5
16
<0.2
64.1
8.8
32
2,8
06
Th
832
64
230
3,1
70
95
205
331
466
651
31
189
368
1,2
65
12,0
88
U17
53
106
239
1,4
47
141
200
274
344
534
76
429
764
1,8
32
12,3
81
Num
ber
of
analy
ses
38
25
154
608

Hafnium concentrations range from 0.5 to 3 wt% Hfwith a mean of 1.18 wt%. The lowest Hf values arefound in zircons from syenite 91500 (Wiedenbeck 1995;Table 2), the zircon megacryst from the Riley’s Peakbasalt, NSW, some alluvial zircons associated with thebasaltic megacryst suites and zircons from the Jwanengkimberlite, Botswana. The highest Hf values are foundin zircons from some granitoids and from nephelinesyenite pegmatites (Fig. 3a).
Most concentrations of yttrium fall in the range fromhundreds to thousands of ppm. The Y contents ofkimberlitic zircons rarely exceed tens of ppm, whereas incrustal zircons Y may reach percent-level concentra-tions. A plot of Hf versus Y (Fig. 3a) shows a decrease inHf/Y ratio from kimberlitic zircons (50 to over 1,000)towards zircons from granitoid rocks (1–15) and syenite(including larvikite) and nepheline–syenite pegmatites(0.8–4).
Phosphorus ranges from 20 to about 110 ppm forkimberlite zircons, but it varies from hundreds tothousands of ppm in zircons from granitoid rocks(Fig. 3b), and can reach levels of several percent inmetamict grains. Metamict grains, with high U and Th,typically also show high levels of REE substitution,which is balanced in part by substitution of P for Si. Thehigh P contents of metamict grains, therefore, are re-garded as a primary feature, and not an effect ofmetamictisation.
Titanium contents range from several ppm in zirconsfrom lamproites, kimberlites, dolerite and carbonatite to500–700 ppm in zircons from the granites of easternAustralia and the Canadian syenite (Tables 3, 4, 5 and6). However, Ti concentrations commonly are below thedetection limit (�6 ppm), especially in zircons fromkimberlites and mafic rocks.
Manganese concentrations in zircons are mostly be-low the detection limit (2–5 ppm). However, samplesfrom granitic rocks have significantly higher Mn con-tents, ranging from 10 to 700 ppm with a mean of148 ppm. Mn values reach 1,000 ppm in stronglymetamict grains or rims (e.g. the Kyemba Adamellite,NSW).
Iron concentrations are generally below the detectionlimit (�60 ppm); the LAM-ICPMS background is highbecause of ArO interference. In general, higher Fe con-tents are typical of zircons from the dolerite. Metamictzircons from granitoids have Fe concentrations up to 1–3%; these are considered to be related to secondary al-teration.
Gallium and strontium rarely show concentrationshigher than 1–2 ppm and often are below the detectionlimit (�1 and �0.5 ppm, respectively). Metamict zirconsfrom granitoids show the highest values, which are 7 and36 ppm for Ga and Sr, respectively.
Tantalum and niobium concentrations range from0.2 to 21 ppm Ta and from 0.4 to 120 ppm Nb; higher
Table 5. Trace element contents (ppm) of zircons from a range of rock types
Rock type Syenite Larvikite
Quartile Min. 1st Quart. Median 3rd Quart. Max. Min. 1st Quart. Median 3rd Quart. Max.
P n.a. 861 1,095 1,269 1,469 2,191Ti 659 659 659 674 719 106 168 204 226 531Mn n.a. <1.5 – <8.5 14 84Fe n.a. <18 <42 147 442 5,389Ga <0.45 – – – <0.74 <0.18 – <0.27 0.53 10Sr <0.07 – <0.08 0.11 0.15 0.46 0.61 0.70 1.1 11Y 120 136 148 159 171 3,075 4,941 5,702 7,069 11,326Nb 0.75 0.83 0.89 0.92 0.94 6.9 9.0 12.2 16.2 24.3Sn n.a. <0.92 1.3 1.5 1.9 9.0Ba <0.05 – – – <0.08 <0.31 0.4 0.6 1.3 47.0La <0.05 – – <0.09 0.16 0.13 0.85 0.98 1.2 3.1Ce 2.0 2.2 2.4 2.6 3.1 58 72 83 99 140Pr <0.03 – <0.03 0.05 0.12 0.7 3.1 3.8 4.2 5.1Nd 0.28 <0.30 0.33 0.38 0.45 11 39 47 55 104Sm <0.25 0.28 0.36 0.49 0.69 17 44 51 58 82Eu 0.19 0.28 0.34 0.43 0.60 2.6 6.4 7.8 9.2 14Gd 1.7 1.9 2.1 2.2 2.6 75 156 183 215 330Dy 8.6 11 12 13 14 301 530 603 727 1,130Ho 4.0 4.5 5.0 5.3 5.5 108 181 207 258 407Er 21 23 26 28 29 473 737 864 1,055 1,689Yb 56 63 67 70 73 985 1,372 1,678 1,959 3,013Lu 12 13 14 15 16 192 257 309 365 558Hf (wt%) 0.59 0.59 0.59 0.59 0.59 0.86 0.96 1.03 1.09 1.31Ta 0.4 0.4 0.4 0.4 0.5 3.8 5.3 6.9 9.1 15Pb 1.9 2.0 2.4 3.0 3.4 5.8 11 17 23 36Th 24 28 31 34 35 258 381 595 826 1,453U 71 78 88 98 104 304 399 662 908 1,450Number ofanalyses
4 36
n.a. Not analysed
609

contents are found only in metamict grains from theKyemba Adamellite, NSW. These elements show astrong positive correlation over the whole range of
concentration (Fig. 3c). The Nb/Ta ratio of zirconsvaries from 0.3 to 48 with an average of 3, and is broadlycorrelated with Y (and HREE) contents (Fig. 3d); the
Table 6. Trace element contents (ppm) of zircons from a range of rock types
Rock type Syenite pegmatite Nepheline–syenite pegmatite
Quartile Min. 1st Quart. Median 3rd Quart. Max. Min. 1st Quart. Median 3rd Quart. Max. MDLa
P 81 175 233 312 390 115 157 192 222 343 34Ti 6.2 20.5 64.3 94.5 228.6 <1.2 2.8 12 18 97 3.2Mn <0.7 – – <1.2 2.6 <0.7 – <1.3 2.0 9.6 0.5Fe <33 – – <54 80 <28 – – <59 255 21Ga <0.2 – – <0.5 0.8 <0.24 – – <0.5 0.6 0.3Sr <0.15 0.3 0.3 0.9 2.0 0.5 0.9 1.2 1.5 2.0 0.05Y 911 2,189 3,062 8,500 17,258 3,243 5,201 13,036 17,283 20,612 0.12Nb 7.9 9.9 16.8 27.9 73.4 20 36 48 56 107 0.09Sn <0.45 1.9 2.1 2.6 5.9 1.7 2.6 3.8 4.8 8.8 0.63Ba <0.05 <0.07 0.16 1.1 2.1 0.1 0.30 0.64 1.4 2.5 0.07La <0.04 <0.07 0.15 0.44 1.8 <0.03 <0.07 0.18 0.4 1.4 0.04Ce 15 26 34 313 638 46.3 111 175 465 730 0.04Pr <0.06 0.43 0.60 1.7 4.9 <0.08 0.35 0.71 0.88 1.4 0.02Nd 2.0 6.3 9.2 17 59 2.4 5.5 9.6 15 20 0.16Sm 3.3 13 14 24 69 5.3 10.4 23 48 60 0.22Eu <0.15 1.5 2.6 3.6 6.9 1.0 1.8 5.0 12 15 0.07Gd 18 53 73 101 233 30 65 117 257 341 0.20Dy 81 205 318 607 1,119 257 370 874 1,843 2,190 0.17Ho 30 76 110 258 522 113 160 396 729 854 0.04Er 146 347 482 1,463 2,948 539 912 2,231 3,476 4,196 0.15Yb 296 649 836 3,337 6,693 1,032 2,181 4,428 5,455 7,087 0.22Lu 61 128 164 610 1,226 217 442 723 814 1,226 0.04Hf (wt%) 0.68 0.81 0.95 1.02 1.92 1.16 1.33 1.46 1.63 2.79 –Ta 2.1 4.0 5.2 7.7 11 0.75 2.6 3.6 5.2 15.2 0.05Pb 1.9 5.3 11 24 43 11 26 47 100 210 0.22Th 119 299 647 1,253 2,518 629 1,348 2,497 5,567 11,084 0.05U 3.6 30 356 499 1,014 2.0 6.3 9.0 11 21 0.03Number ofanalyses
24 20
aTypical minimum detection limits for the Perkin–Elmer ELAN 6000 ICPMS
Fig. 1. Chondrite-normalisedaveraged trace element abun-dances of zircons from differentrock types. Data from Tables 3,4, 5 and 6. Chondrite values arefrom Taylor and McLennan(1985)
610

highest ratios are found in zircons from syenite andnepheline–syenite pegmatites and some granitoids.
Zircon does not contain significant amounts of tin orbarium. Their concentrations are typically at ppb levelsand thus below detection. Slightly higher concentrationsof Sn (2–8 ppm) are found in zircons from Norwegiansyenite and nepheline–syenite pegmatites and levels ofSn and Ba exceeding 10–100 ppm are found in somezircons from the granitic rocks of eastern Australia.
Previous studies have pointed out the large range ofuranium and thorium concentrations in zircon (Ahrenset al. 1967; Speer 1980; Heaman et al. 1990; Belousovaet al. 1998; Hoskin and Ireland 2000). The present studyshows ranges from 0.1 ppm to over 1% for U and from1 ppm to 1% for Th. Low values of 6–60 ppm U and 2–15 ppm Th are characteristic of kimberlitic zircon(Fig. 4a, b). In contrast, zircons from granitoid rocksand pegmatites have the highest contents of these ele-ments.
The Th/U ratio commonly ranges from 0.1 to 1.However, Th/U of 100–1,000 or more is found in zirconsfrom some Norwegian syenite and nepheline–syenitepegmatites, and zircons from the Kovdor carbonatitecomplex have Th/U of 103–104. Such high Th/U valuesreflect the unusually low concentrations of U in zircons
Fig. 2. Chondrite-normalised averaged REE patterns of zirconsfrom a range of rock types. Data from Tables 3, 4, 5 and 6
Fig. 3. Trace element composition of zircons from different rocktypes
611

from these rocks: less than 0.1 to 1.12 ppm for theKovdor carbonatite complex and from 2 to 36.7 ppm forNorwegian pegmatites (Fredricksvaern syenite pegma-tite, Tvedalen and Langesundsfjorden nepheline–syenitepegmatites), whereas Th concentrations are relativelyhigh.
Lead contents commonly range from 2 to 30 ppm,and are generally below the detection limit (1–2 ppm) inzircons from kimberlites and basalts. The presence of Pbin higher amounts reflects the radioactive decay of Uand Th, and high Pb concentrations (sometimes over100 ppm) are found only in metamict grains extremelyenriched in U and Th.
The average content of rare earth elements in zirconsstudied in this work is 1,800 ppm. However, there is arange of REE concentrations from tens to several tens ofthousand ppm in zircons of different origins (Tables 3, 4,5 and 6). Zircons from pegmatites and granitoid rockscontain the highest concentrations of REE. The highestvalues, over 4.2 wt%, have been found in the metamictrims of zircons from the Round Mount granite, Ebor,NSW. These high levels of REE are considered to be
primary, and to reflect the broad correlation betweenREE (Y), U and Th contents (Fig. 4a) rather than aneffect of metamictisation. However, relative enrichmentin the LREE appears to be especially correlated withmetamictisation, and may be a secondary feature.Slightly lower amounts of REE are typical for grainsfrom mafic rocks (basalts and dolerite), with concen-trations from several hundred to 1,000 ppm and rarelyover 2,000 ppm. The total REE content of carbonatiteand lamproite zircons seldom exceeds 600–700 ppm. Thelowest REE concentrations, commonly less than 50 ppm,are a characteristic feature of kimberlitic zircons(Belousova et al. 1998, 1999).
The typical chondrite-normalised REE patterns ofzircon rise rapidly from Sm to Lu (Fig. 2). The (Yb/Sm)N ratio can be used as a measure of the HREEenrichment of zircons. The average (Yb/Sm)N valuefor the zircons presented in this work is 44. The mostpronounced HREE enrichment is found in pegmatiticzircons (Fig. 4c, d), where (Yb/Sm)N is commonlyover 100–300. In contrast, relatively flat chondrite-normalised REE patterns [(Yb/Sm)N=3–30] are char-acteristic of zircons from kimberlites and carbonatites;some samples show no HREE enrichment with Yb/Sm�1.
Fig. 4. Trace element composition of zircons from different rocktypes
612

A positive Ce anomaly is typical of most of the zir-cons analysed in this study (Figs. 2 and 5). The size ofthe Ce anomaly is given by Ce/Ce*, where Ce is thechondrite-normalised Ce concentration and Ce* is theaverage of the chondrite-normalised La and Pr concen-trations. Zircons from syenitic pegmatites show the mostpronounced Ce anomalies (Ce/Ce* from 2 to over 300),whereas weak Ce anomalies (Ce/Ce* from 1 to 10) aretypical of zircons from kimberlites, carbonatites andgranitoids. Zircons from rocks other than granitoidsmay show a positive correlation between Ce/Ce* and Ycontents (Fig. 5a), but most zircons from granitoidshave Ce/Ce* within a restricted range from 1 to 3, andfall out of the main trend.
The Eu anomaly is calculated as Eu/Eu*, where Eu isthe chondrite-normalised Eu value and Eu* is the av-erage of the chondrite-normalised Sm and Gd concen-trations. The depth of the negative Eu anomaly shows abroad positive correlation with Y content (Fig. 5b). Themean kimberlitic and carbonatitic zircons show little orno Eu anomaly. It becomes more significant in zircons
from more felsic, fractionated rock types. The strongestEu anomalies are found in U, Th, REE-rich (metamict)zircons that crystallised from late magmas) from theGilgai Leucogranite, Inverell, NSW. There may be aweak positive correlation between the depth of Euanomalies and Nb/Ta (Fig. 5c), whereas no obviouscorrelation is observed between Eu and Ce anomalies(Fig. 5d).
Discussion
Element abundances and substitutions
Trace element analyses of zircons from different rocktypes show a wide range in the concentrations of mea-sured trace elements. Although each class shows a rangeof zircon compositions, the mean abundances of manytrace elements, and the shape and slope of chondrite-normalised trace element patterns, are distinctive forzircons of different origins (Tables 3, 4, 5 and 6, Fig. 1).The broadest trend observed is the general increase oftrace element concentrations from zircons of mantleorigin (e.g. kimberlitic) towards grains from mafic rock
Fig. 5. Trace element correlations for zircons from different rocktypes
613

types and further to those from evolved granitoids andpegmatites.
Many elements behave coherently because they par-ticipate in a coupled substitution in the zircon crystalstructure. For example, phosphorus concentrationsshow a positive correlation with Y and total REE con-
tent over a wide range of zircon composition from dif-ferent sources (Fig. 3b), reflecting the substitution:(REE, Y)3++P5+=Zr4++Si4+. Niobium and Tacorrelate positively with Y, SREE and Fe, indicating(REE, Y)3++(Nb, Ta)5+=>2Zr4+ and (REE,Fe)3++(Nb, Ta)5+=>2Zr4+ coupled substitutions.
Uranium and Th substitute directly for Zr; however,they both show a positive correlation with Y (Figs. 4a, band 6a), as well as with REE and P. This broadly reflectsthe trace element composition of the parental rocks,
Fig. 6. The fields of zircon compositions used as discriminants fordifferent rock types. ‘Granitoids’ include: 1 aplites and leucogra-nites; 2 granites; 3 granodiorites and tonalites
614

where the incompatible element concentrations tend tobe higher in the most evolved, fractionated rock types.The Th/U ratios commonly lie in a range from 0.1 to 1(Tables 3, 4, 5 and 6), whereas the crustal average isabout 4, showing that the zircon structure accepts Umore easily than Th. Ahrens et al. (1967) suggested thatU4+ is preferentially accepted into the zircon structure(relative to Th4+) because its ionic radius is closer tothat of Zr4+ (Shannon 1976). However, Th/U reachesalmost 1,000 in zircons from some Norwegian syeniteand nepheline–syenite pegmatites and 10,000 in theKovdor carbonatite complex. Such high Th/U values area result of the unusually low concentrations of U inzircons from these rocks (Fig. 4a), whereas Th concen-trations are moderate to relatively high. Such a rela-tionship reflects Th enrichment of the host rock; theNorwegian pegmatites commonly contain thorite(Neumann 1980).
As mentioned above, the coupled substitution ofREE and phosphorus into the zircon structure (Speer1980; Hinton and Upton 1991) results in high REEabundances in zircon (Tables 3, 4, 5 and 6). The largerange of REE concentrations, from tens of ppm toseveral per cent, distinguishes zircons of different origin.Zircons from pegmatites and granitoids contain thehighest concentrations of REE (SREE up to 1.5–2 wt%).Lower amounts of REE (SREE 90–480 ppm) are typicalfor zircons from mafic rocks, and the lowest SREE(typically less than 50 ppm) concentrations are a char-acteristic feature of kimberlitic zircons. This progressiononce again reflects the degree of whole rock fractiona-tion.
Because the ionic radii of the REE decrease fromLa3+ to Lu3+ (Shannon 1976), the substitution into thezircon lattice becomes progressively easier for the REEof higher atomic number (Nagasawa 1970; Watson1980; Fujimaki 1986; Heaman et al. 1990; Hinton andUpton 1991; Hanchar et al. 2001). Thus, the typicalchondrite-normalised REE zircon patterns increaserapidly from Sm to Lu (Fig. 2). In general, the Yb/Smratio shows a positive correlation with Y content, re-flecting the degree of host rock fractionation; the overallshape of the REE patterns reflects an interplay betweenmagma chemistry and the crystal chemistry of the zir-con. LREE enrichment in zircons has been reportedpreviously (Speer 1980; Krasnobayev 1986); some ofthese bulk analyses may have contained REE-rich in-clusions. The data presented here indicate that LREEenrichment is observed mainly in strongly metamictzircons, and it may not be a primary feature; the de-struction of the lattice during metamictisation wouldloosen the crystal–chemical constraints on LREE sub-stitution.
A positive Ce anomaly is typical of most of thestudied zircons. When Ce3+ is oxidised to Ce4+, it be-haves more like Zr or Hf, and thus is preferred by zirconover the LREE (Figs. 5a and 6c). Zircons from peg-matites show the most pronounced Ce anomalies. Incontrast, kimberlitic and carbonatitic zircons show al-
most no Ce anomalies, which may indicate a low oxi-dation state of the parental magma (Shnukov et al.1989). There is a general positive correlation between theamplitude of the Ce anomaly and the Y content (Fig. 6c),but samples from granitoids have weak Ce anomaliesand lie off the main trend. Furthermore, no correlationbetween zircon Ce anomalies and whole rock Fe2O3/FeO ratios has been found so far (Belousova 2000).These observations confirm the conclusions of Hintonand Upton (1991) and Guo et al. (1996) that the Ceanomaly is an ambiguous indicator of the oxidationstate of the environment.
The depth of the Eu anomaly is also correlated withY content (Fig. 5b). The kimberlitic zircons show es-sentially no Eu anomaly, but it becomes stronger in thesamples from more fractionated and evolved rock types.Eu2+ is less compatible in zircon than Eu3+, but theabsence of a negative Eu anomaly in some zircons, andits ubiquitous appearance in zircons from fractionatedand relatively oxidised rocks such as granitoids, wheremost Eu would be expected to be divalent, suggests thatthese anomalies largely reflect partitioning of Eu2+ intoplagioclase during magmatic evolution. There is a weakpositive correlation between the depth of the Euanomaly and the Nb/Ta ratio (Fig. 5c). However, nocorrelation has been observed between the Eu and Ceanomalies in zircon (Figs. 5d and 6d).
The Nb/Ta ratio of zircons analysed in this studyvaries from 0.3 to 48 with an average value of 3, whereasthe chondritic ratio is about 17 (Anders and Grevesse1989). The low Nb/Ta ratio in zircons can be explainedby the fact that Ta can oxidise more easily to 5+ valence,whereas some Nb remains in the 4+ valence state. In thiscase, the ionic radius of Ta would be smaller than that ofNb (Shannon 1976), and Ta would go preferentially intothe Zr (Hf) lattice site. There is a positive correlationbetween Nb/Ta and the Y content of zircon (Figs. 3cand 6e). The lowest Nb/Ta values are typical of kim-berlitic zircons and the highest values are found in zir-cons from the most fractionated rocks (granitoids andpegmatites).
Discriminant diagrams
The correlations between rock type and the trace ele-ment compositions of zircon from a wide range of ig-neous rocks can be illustrated with a series ofdiscriminant plots (Fig. 6). The fields for zircons somerock types, e.g. kimberlite, carbonatites and pegmatites,are very distinct in several plots, but those for grains ofother origins overlap to different degrees in most plots.A single plot is sufficient for the discrimination of zir-cons from rocks such as kimberlites and nepheline–sye-nite pegmatites, but comparison of several plots canidentify zircons from some other igneous rocks. Forexample, plots of Y versus U, Y versus Yb/Sm and Nbversus Ta (Fig. 6a, b, f) will allow the recognition ofdolerite zircons.
615

Statistical analysis (CART)
In a situation where several populations overlap to dif-ferent degrees in different bivariate spaces, multivariateanalysis can identify the combinations of characteristicsthat distinguish the different populations. For this pur-pose, we have used CART (classification and regressiontrees), a diagnostic statistical program (Breiman et al.1984) that was developed for classifying a set of objects,based on multivariate measurements of characteristics(in this case, the chemical analyses) of each of the objects(the mineral grains). This approach has been previouslyapplied to the classification of chromites in diamondexploration samples (Griffin et al. 1997).
The result of a CART analysis is a CART tree(Fig. 7). It resembles a botanical key, with binaryswitches defined by element concentrations or values ofratios, and thus is easy to use and interpret. An un-known sample (zircon grain) is run through the tree andends up in a terminal node, which has been assigned aclass label (rock type) defined by the majority ofthe grains in the node. The proportion of grains from thedefined class gives an approximate estimate of theprobability that an unknown grain falling into this nodehas been correctly classified. Although the initial devel-opment of the tree is computer intensive, the tree itselfconsists of easily understood variables and requires nofurther use of the CART program to classify new sam-ples.
The complete list of elements from the databasegenerated in this study was used to construct an initialCART classification tree (Fig. 7), and to calculate anestimate of its reliability as a predictor of the correctclassification of a future sample. In practice, a randomlychosen subset (25%) of the database is kept aside andnot used in setting up the tree; this subset then is used for
cross validation of the tree. This cross-validation ap-proach is essential to ensure that the tree has predictivepower, i.e. that it can be applied to data other than thoseused to generate it.
This first tree (Fig. 7) has nine binary splits, based onthe concentration of an element or the value of an ele-ment ratio. The element-switches selected by the CARTprogram in generating this tree are in good agreementwith the those already recognised as useful by inspectionof the discriminant plots (Fig. 6), where plots using Y(representing the HREE), U, Ta, Nb, Ce/Ce* and Eu/Eu* define fields characteristic of zircons from particularrock types.
Table 7 gives the error-rate matrix for the classifica-tion of zircons from different rock types, using this tree.In many cases it shows very high correlation betweentrue and predicted classes (e.g. kimberlite 89%, larvikite100%). Zircons from the one dolerite studied form avery distinctive group. The high success rate in recogn-ising zircons from some rock types (kimberlite, syenite,larvikite, syenite pegmatites) emphasises the distinctivetrace element composition of zircons from these par-ageneses, as represented in this database, and that thediscrimination shown in the plots (Fig. 6) is real.
Using this tree, it is possible to recognise a grain froma granitic rock type with a probability of correct pre-diction over 80%. However, the breakdown into classesbased on the SiO2 content of the host rock is moreambiguous, with probabilities varying from 13 to 68%;the correlation between predicted and true classes im-proves with increasing whole rock silica content.
Some ‘misclassification’ cases carry useful petroge-netic information. For instance, the partial overlap be-tween kimberlitic and carbonatitic zircons (Table 7)reflects the common spatial and inferred genetic rela-tionship between these two rock types. Similarly, the
Fig. 7. CART tree for therecognition of zircons fromdifferent rock types. Terminalnodes indicate predicted rocktype, estimated probability andnumber of observations. Errorrate matrix for this classifica-tion is in Table 7
616
large degree of misclassification of zircons from low-SiO2 granitoid rocks to the next higher-SiO2 class (e.g.for granitoids with <65% and 65–70% SiO2) suggeststhat most of these zircons crystallised from the late-stagemagmas, which had higher SiO2 than the bulk rock.
Some of the zircon xenocrysts in basalts are distinc-tive enough to classify separately, but a large degree ofmisclassification of indicates that the xenocrystic mega-cryst zircons in alkali basalts are not a coherent class, butare derived from a variety of crustal and/or mantle rocktypes. Similarly, the zircons from lamproites are not acoherent group, and classify as derived from a variety ofgranitoid and syenitic rock types; this suggests that theyare crustally derived xenocrysts, as was concluded byBelousova et al. (1999). These examples suggest the
usefulness of this classification for the recognition ofsource rocks for zircons of unknown origin.
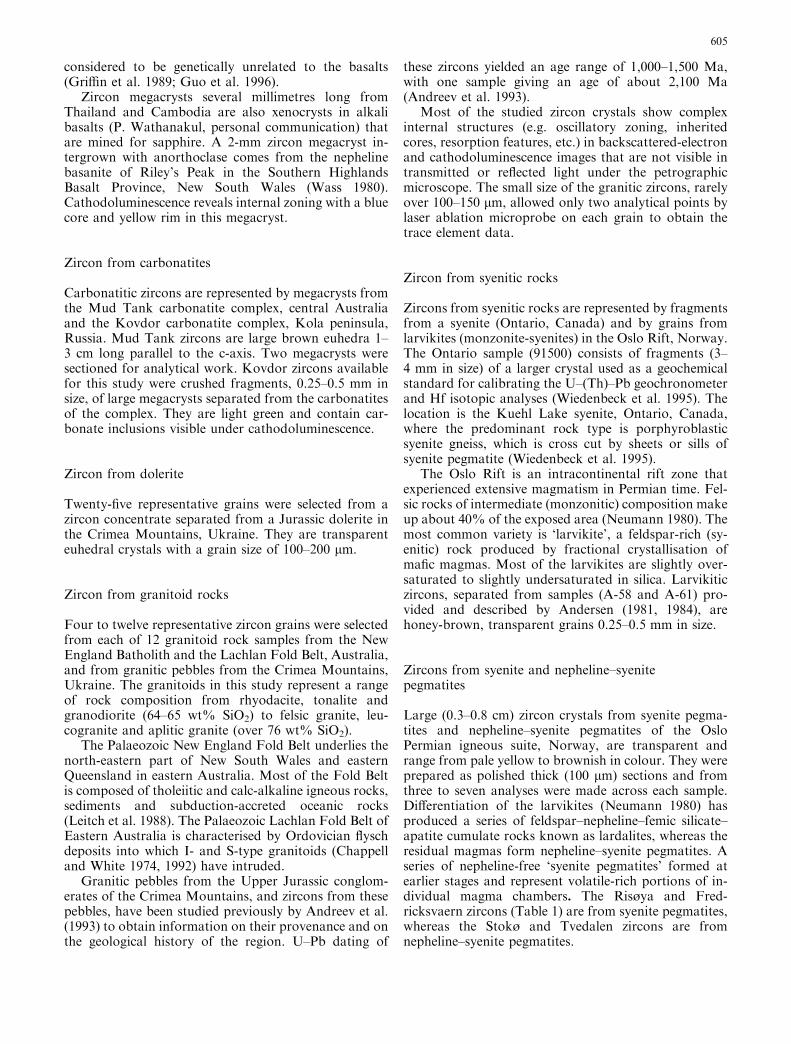
A second CART analysis was carried out, using ashort list of elements (U, Th, Y, Yb, Lu and Hf) that arecommonly reported in the literature, and which can becollected as part of an integrated U–Pb and Hf-isotopeanalysis (Griffin et al. 2002b). This ‘short tree’ is shownin Fig. 8 and its error-rate matrix in Table 8. The valuesfor each element switch in this tree are at levels wellabove the common detection limits for EMP analysis (Y,Hf) or LAM-ICPMS analysis (U, Lu, Yb). This tree alsodiscriminates zircons from several rock types with a highdegree of probability: zircons from kimberlites, car-bonatites, mafic rocks (diabase + basalt), syenitic rocks(syenites + larvikites) and Ne–syenite pegmatites are
Table 7. Error-rate matrix for the CART zircon classification
Predictedclass (%)
True class
Kimber-lite
Carbo-natite
Dole-rite
Sye-nite
Granitoid Ne-syeniteand
Basalt Larvi-kite
<65%SiO2
65–70%SiO2
70–75%SiO2
>75%SiO2
syenitepegmatites
Kimberlite 89 14 0 0 0 0 0 0 0 0 0Carbonatite 10 84 0 0 3 0 2 0 0 14 0Dolerite 0 0 84 0 16 6 5 3 0 0 0Syenite 1 3 0 100 0 0 0 0 0 11 0Granitoid <65% SiO2 0 0 0 0 13 20 2 0 0 3,5 0Granitoid 65–70% SiO2 0 0 4 0 45 51 7 13 0 7,5 0Granitoid 70–75% SiO2 0 0 0 0 10 11 58 3 0 0 0Granitoid >75% SiO2 0 0 0 0 3 11 16 68 0 0 0Ne-syenite and syenitepegmatites
0 0 0 0 0 0 0 0 93 0 0
Basalt 0 0 0 0 0 0 2 3 0 47 0Larvikite 0 0 12 0 10 0 7 11 7 18 100
Fig. 8. ‘Short’ CART tree forthe recognition of zirconsfrom different rock types. Errorrate matrix for this classifica-tion is in Table 8
617

recognised with a probability of correct classificationexceeding 80%. Zircons from granitoids (as a group) arerecognised with a probability of >75%, whereas thedivision of these into groups of different SiO2 content ismore ambiguous, as with the longer tree. Zircons fromgranitoids with 65–70% SiO2 consistently classify ascoming from rocks with either higher (40%) or lower(30%) SiO2 contents. For zircons from the other graniteclasses, the probability of correct classification by SiO2
group ranges from 49% for those with 70–75% SiO2, to63% for those with >75% SiO2. Despite this ambiguity,we find that this tree can provide useful information onthe broad composition of the source rocks contributingto a given detrital zircon sample.
It is important to note that a CART analysis and theresulting tree are specific to the database used as input(Griffin et al. 1997). Changes in the database can pro-duce a tree with different switches or with similarswitches in a different sequence. However, as long as thedatabase is well constructed, the resulting level of dis-crimination (the error rates) should be similar to thosereported above. This analysis, therefore, indicates thatzircons from different rock types can be recognised at ahigh level of probability. As further samples are addedto the database, and the CART analysis is run again, weexpect that this discrimination will improve, although afuture CART tree might have a different appearancealtogether.
Application to data from the literature
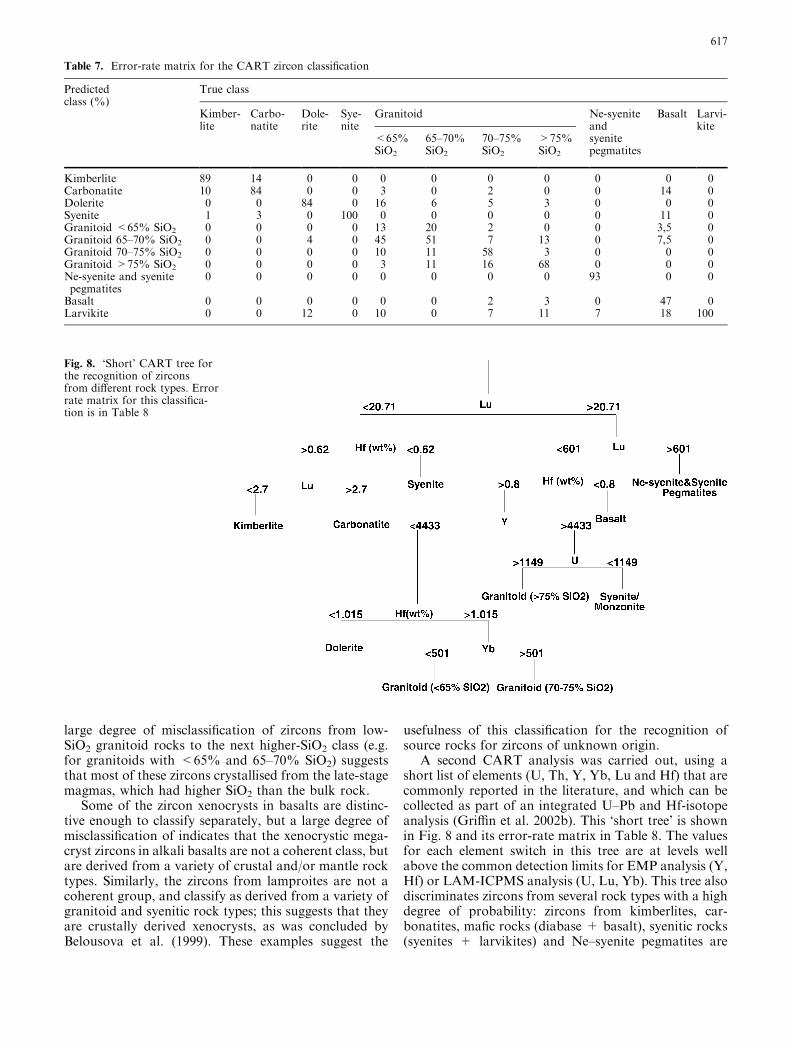
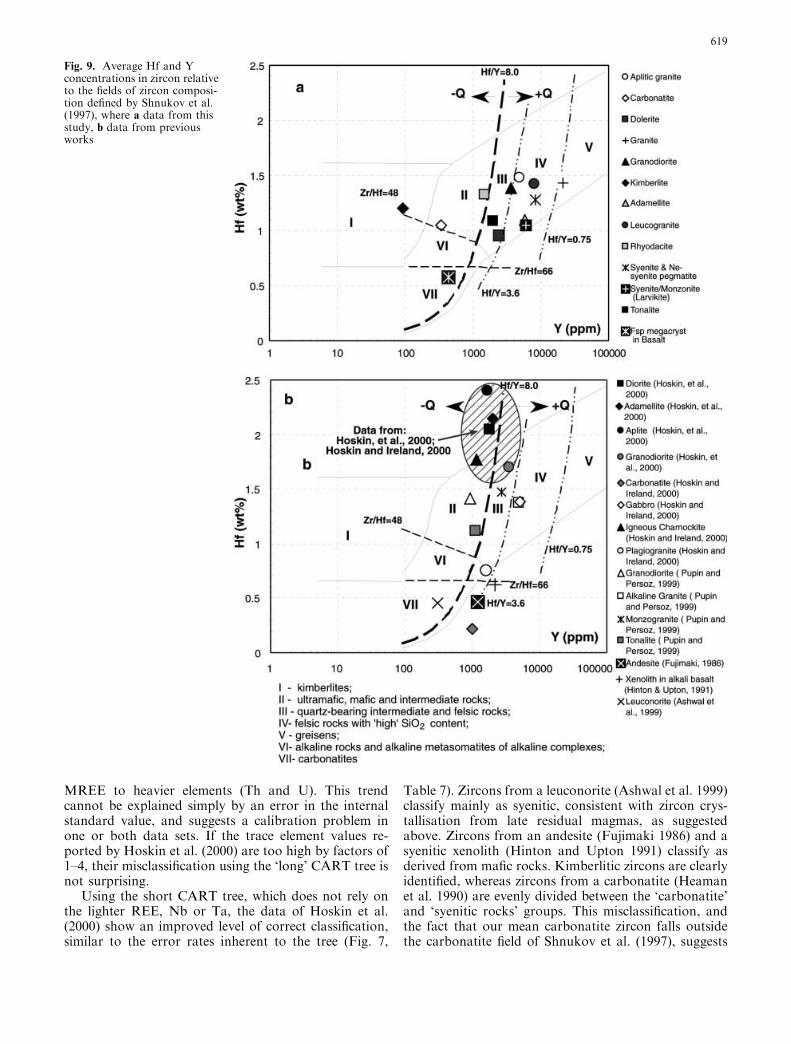
The data generated in this study can be compared withsome previously published analyses. In Fig. 9a, we showthe mean contents of Hf and Y for zircons from severalrock types (data from Tables 3, 4, 5 and 6), together withthe discriminant framework proposed by Shnukov et al.(1997). This scheme is in general agreement with thedata from this study, but there are several differences in
detail. For example, few of the larvikite samples arequartz-bearing, but the mean Hf–Y value for larvikitezircons falls in the high-Si field of Shnukov et al. (1997).Figure 9b shows other data from the literature; most ofthese show a similar distribution to the data reportedhere, and some of the same discrepancies with thescheme of Shnukov et al. (1997). The data of Hoskinet al. (2000) stand out because their Hf contents and Hf/Y are generally much higher than those reported byother studies.
The data of Hoskin et al. (2000) can be analysedusing the long CART tree (Fig. 7). Data reported inother published works (Nagasawa 1970; Murali et al.1983; Fujimaki 1986; Heaman et al. 1990; Hinton andUpton 1991; Barbey et al. 1995; Ashwal et al. 1999;Pupin and Persoz 1999; Hoskin and Ireland 2000) do nothave the full set of elements needed for the ‘long’ CARTanalysis. However, these data could be tested using the‘short’ CART tree (Fig. 8). The results of the CARTanalysis are shown in Table 9.
Using the long CART tree, the data of Hoskin et al.(2000) show a high degree of misclassification. This isdirectly related to the very high Hf values noted above.These high Hf contents were measured by SHRIMP ionmicroprobe, using a glass standard, and their anoma-lous nature suggests an analytical problem. Hoskin et al.(2000) present analyses of zircons from several rocks, inwhich the REE were analysed both by ion-probe and byLAM-ICPMS; the ion-probe value for Hf was used asthe internal standard for the LAM-ICPMS analysis. Acomparison of the two data sets (Table 10) shows thatthe mean LAM-ICPMS values for the REE are higherthan the mean ion-probe values for zircons from thesame rocks by factors from 1.7 to 3.9. This stronglysuggests that the ion-probe Hf values are overestimatedby two to three times, consistent with their anomalouspositions in Fig. 9b. The discrepancy between theLAM-ICPMS values and the ion-probe values inHoskin et al. (2000) diminishes from the LREE and
Table 8. Error-rate matrix for the ‘short’ CART zircon classification
Predicted class (%) True class
Kimb-erlite
Carbo-natite
Mafic rocks Syenitic rocks Granitoids Nesyenite/
Dolerite Basalt Syenite Monzon./syenite
<65%SiO2
65–70%SiO2
70–75%SiO2
>75%SiO2
pegmatite
Kimberlite 88 14Carbonatite 10 84 18 2 3Dolerite 80 14 3 23 17 16Basalt 50Syenite 2 7 100Monzonite/syenite 4 75 6 5 11 4Granitoid <65% SiO2 8 4 55 31 9 5Granitoid 65–70%SiO2
4 13 6 2 5
Granitoid 70–75%SiO2
4 8 10 26 49 13
Granitoid >75% SiO2 14 14 16 63Ne syenite/pegmatite 3 7 96
618
MREE to heavier elements (Th and U). This trendcannot be explained simply by an error in the internalstandard value, and suggests a calibration problem inone or both data sets. If the trace element values re-ported by Hoskin et al. (2000) are too high by factors of1–4, their misclassification using the ‘long’ CART tree isnot surprising.
Using the short CART tree, which does not rely onthe lighter REE, Nb or Ta, the data of Hoskin et al.(2000) show an improved level of correct classification,similar to the error rates inherent to the tree (Fig. 7,
Table 7). Zircons from a leuconorite (Ashwal et al. 1999)classify mainly as syenitic, consistent with zircon crys-tallisation from late residual magmas, as suggestedabove. Zircons from an andesite (Fujimaki 1986) and asyenitic xenolith (Hinton and Upton 1991) classify asderived from mafic rocks. Kimberlitic zircons are clearlyidentified, whereas zircons from a carbonatite (Heamanet al. 1990) are evenly divided between the ‘carbonatite’and ‘syenitic rocks’ groups. This misclassification, andthe fact that our mean carbonatite zircon falls outsidethe carbonatite field of Shnukov et al. (1997), suggests
Fig. 9. Average Hf and Yconcentrations in zircon relativeto the fields of zircon composi-tion defined by Shnukov et al.(1997), where a data from thisstudy, b data from previousworks
619

that discrimination of carbonatite zircons will be im-proved by a larger database.
Hoskin and Ireland (2000) studied the REE abun-dances of zircons from a several rock types and con-cluded that zircon composition is not generally useful asan indicator of the provenance of zircons in sediments orof inherited zircons in igneous rocks. However, the re-sults of the present study, which incorporates a widerrange of rock types and a larger number of trace ele-ments, demonstrate that the distribution of trace ele-ments in zircon reflects host rock composition andcrystallisation environment.
Conclusions
This study of zircon trace element signatures has shownthat elemental abundances and the shape and slope ofchondrite-normalised trace element patterns carry fea-tures characteristic for zircons of particular origins. Bytaking a multivariate statistical approach, and using a
range of trace elements including at least Hf, U, Th, Yand the HREE, the original rock type of individualzircon grains can be distinguished with a useful degree ofconfidence. This ability to recognise zircons from specificrock types, with a reasonable degree of confidence, isuseful in several situations where the origin of the zirconis not apparent from its geological context.
1. Inherited cores in the zircons of many felsic igneousor metamorphic rocks carry potential information onthe original source rock.
2. The parental rock for xenocrystic zircons, such asthose found in some alkali basalts or lamproites, canbe recognised. For example, Belousova et al. (1999)showed that zircon xenocrysts from lamproites werederived from a range of more felsic crustal rocks.
3. Detrital zircons in sedimentary rocks can be assignedto specific source lithologies; this adds information tothe information (U–Pb age, Hf isotope composition)commonly used to study the provenance of sedi-ments.
Table 9. The results of the CART analysis using data from the literature
True host rock type Long CART tree Short CART tree
Diorite (Hoskin et al. 2000) 57% Mafic/dolerite 71% Granitoid <65% SiO2
29% Granitoid 70–75% SiO2
Granodiorite (Hoskin et al. 2000) 89% Syenitic rocks 62.5% Granitoid 70–75%SiO2
11% Granitoid 65–70% SiO2 25% Syenitic rocks12.5% Granitoid <65% SiO2
Adamellite (Hoskin et al. 2000) 71% Syenitic rocks 100% Granitoid 70–75% SiO2
29% Insufficient parametersAplite (Hoskin et al. 2000) 100% Syenitic rocks 100% Granitoid <65% SiO2
Leuconorite (Ashwal et al. 1999) Insufficient parameters 92% Syenitic rocks8% Mafic rock
Andesite (Fujimaki 1986) Insufficient parameters 100% Mafic rockXenolith in alkali basalt(Hinton and Upton 1991)
Insufficient parameters 100% Mafic rock
Kimberlite (Heaman et al. 1990) Insufficient parameters 100% KimberliteCarbonatite (Heaman et al. 1990) Insufficient parameters 25% Carbonatite
25% Syenitic rocks50% insufficient parameters
Table 10. Comparison of zircon trace element data reported by Hoskin et al. (2000)
Ce Gd Er Lu Th U
BP39 (diorite)SIMS (n=7) 5.5 16.5 109 51 351 415LAM (n=7) 16.5 35 271 105 393 484
f (LAM/SIMS) 3.00 2.12 2.49 2.06 1.12 1.17BP7 (granodiorite)
SIMS (n=6) 18.4 34 235 109 516 504LAM (n=7) 46.7 81 535 188 845 758
f (LAM/SIMS) 2.54 2.38 2.28 1.72 1.64 1.50BP22 (adamellite)
SIMS (n=7) 15.7 15.4 95.9 47 118 156LAM (n=5) 31.4 48 278 109 237 281
f (LAM/SIMS) 2.00 3.12 3.9 2.31 2.01 1.80BP11 (adamellite)
SIMS (n=7) 15.1 13.1 89 52 121 (n=1) 170 (n=1)LAM (n=2) 53 45.5 347 144 322 447
f (LAM/SIMS) 3.51 3.47 3.90 2.76 2.66 2.63
620

4. Because zircon survives through weathering anderosion cycles, it is commonly found in heavy-mineralsamples collected from drainages and soil profilesduring geochemical exploration. Recognition of zir-cons related to mineralised rocks can provide a rapidand cost-effective way to find that mineralisation bymore detailed sampling. For example, the identifica-tion of kimberlitic zircons can be useful in diamondexploration.
5. The approach outlined here can be applied to detritalzircons collected from modern drainages, to enhancethe information obtained by in-situ U–Pb dating andHf-isotope analysis in large-scale studies of crustalevolution (Bodet and Scharer 2000; Griffin et al.2002b).
Acknowledgements We are grateful to Peter Kresten and RoryMoore for providing zircon samples from South African kimber-lites and to Dr I.P. Ilupin for supplying zircons from Yakutiankimberlites. We also are grateful to Prof Bruce Chappell (Mac-quarie University), Prof Tom Andersen (Mineralogisk-GeologiskMuseum, Oslo), Mr Torgeir Garmo (Lom, Norway) and Dr SergeyShnukov and Mr Sergey Savenok (Kiev State University) forprovision of other samples. The assistance of Norm Pearson andAshwini Sharma with electron microprobe and ICPMS analyses isvery much appreciated. The LAM-ICPMS was purchased from anARC RIEFP grant with contributing funds from MacquarieUniversity and industry. The laser microprobe used in this workwas constructed and installed by Dr Simon Jackson. The manu-script was improved by reviews from Bruce Watson and from PaulHoskin, who drew attention to the anomalous character of hisdata. E. Belousova has been partly supported by a Rio Tinto(formerly CRAE) postgraduate scholarship to GEMOC, an Aus-tralian Postgraduate Award, GEMOC funds and a MacquarieUniversity Postgraduate Research Grant. Funding for this studywas contributed from several sources including an AustralianResearch Council grant (WLG), internal Macquarie Universitygrants, ARC National Key Centre funding and industry support.This is publication number 269 from the ARC National KeyCentre for Geochemical Evolution and Metallogeny of Continents(www.es.mq.edu.au/GEMOC/).
References
Ahrens LH, Cherry RD, Erlank AJ (1967) Observation on the Th–U relationship in zircons from granitic rocks and from kim-berlites. Geochim Cosmochim Acta 31:2379–2387
Anders E, Grevesse N (1989) Abundances of the elements: mete-oritic and solar. Geochim Cosmochim Acta 53:197–214
Andersen T (1981) En geokjemisk-petrologisk undersøkelse av deintrusive bergartene i Sande Cauldron, Oslofeltet (in Norwe-gian). Cand Real Thesis, University of Oslo, Norway
Andersen T (1984) Hybridization between larvikite and nord-markite in the Oslo region, SE Norway: a case study from theSande Cauldron central pluton. Norsk Geol Tidsskr 64:221–233
Andreev AV, Shnyukova EE, Shnyukov SE, Cheburkin AK, Bel-ousova EA, Savenok SP (1993) Geochemical peculiarities andage of heterogeneous accessory zircon populations from gran-itic pebbles of Jurassic conglomerates from Crimea Mountainsregion. Geol J (Ukraine) 6:128–135
Ashwal LD, Tucker RD, Zinner EK (1999) Slow cooling of deepcrustal granulites and Pb-loss in zircon. Geochim CosmochimActa 63:2839–2851
Barbey P, Alle P, Brouand M, Albarede F (1995) Rare-earth pat-terns in zircons from the Manaslu granite and Tibetan Slabmigmatites (Himalaya):insights in the origin and evolution of acrustally-derived granite magma. Chem Geol 125:1–17
Belousova EA (2000) Trace elements in zircon and apatite: appli-cation to petrogenesis and mineral exploration. PhD Thesis,Macquarie University, Australia
Belousova EA, Griffin WL, Pearson NJ (1998) Trace elementcomposition and cathodoluminescence properties of southernAfrican kimberlitic zircons. Mineral Mag 62(3):355–366
Belousova EA, Griffin WL, O’Reilly SY (1999) Cathodolumines-cence and geochemical properties of kimberlitic and lamproiticzircons. The 7th International Kimberlite Conference Pro-ceedings, Cape Town, J.B. Dawson Volume, pp 23–29
Berryman AK, Steifenhofer J, Shee SR, Wyatt BA, Belousova EA(1999) The discovery and geology of the Timber Creek kim-berlites, Northern Territory, Australia. The 7th InternationalKimberlite Conference Proceedings, Cape Town, J.B. DawsonVolume, pp 30–39
Bodet F, Scharer U (2000) Evolution of the SE-Asian continentfrom U–Pb and Hf isotopes in single grains of zircon andbaddeleyite from large rivers. Geochim Cosmochim Acta64:2067–2091
Breiman L, Friedman JH, Olshen RA, Stone CJ (1984) Classifi-cation and regression trees. Wadsworth, Belmont, CA
Chappell BW, White AJR (1974) Two contrasting granite types.Pac Geol 8:173–174
Chappell BW, White AJR (1992) I- and S-type granites in theLachlan Fold Belt. Trans R Soc Edinb Earth Sci 83:1–26
Cherniak DJ, Hanchar JM, Watson EB (1997a) Diffusion oftetravalent cations in zircon. Contrib Mineral Petrol 127:383–390
Cherniak DJ, Hanchar JM, Watson EB (1997b) Rare-earth diffu-sion in zircon. Chem Geol 134:289–301
Chyi LL (1986) Characteristics and genesis of zirconium and haf-nium deposits. In: Mineral parageneses. Theophrastus Publi-cations SA, Athens, pp 387–408
Deer WA, Howie RA, Zussman J (1966) An introduction to therock-forming minerals. Longman Group Limited, London
Fujimaki H (1986) Partition coefficients of Hf, Zr, and REE be-tween zircon, apatite, and liquid. Contrib Mineral Petrol 94:42–45
Griffin W L, Suter GF, Ryan CG, Sie SH (1989) Proton microp-robe analysis of zircons from kimberlites and other sources(restricted report no 80R). CSIRO Australia, Division of Ex-ploration Geoscience
Griffin WL, Kaminsky FV, O’Reilly SY, Ryan CG, Sobolev NV(1995) Mapping the Siberian lithosphere with garnets and spi-nels. In Sixth International Kimberlite Conference Proceeding,Russia, pp 194–195
Griffin WL, Fisher NI, Friedman JH, Ryan CG (1997) Statisticaltechniques for the classification of chromites in diamond ex-ploration samples. J Geochem Explor 59:233–249
Griffin WL, Ryan CG, Kaminsky FV, O’Reilly SY, Natapov LM,Win TT, Kinny PD, Ilupin IP (1999) The Siberian lithospheretraverse: mantle terranes and the assembly of the SiberianCraton. Tectonophysics 310:1–35
Griffin WL, Wang X, Jackson SE, Pearson NJ, O’Reilly SY, Xu X,Zhou X (2002a) Zircon chemistry and magma genesis, SEChina: in-situ analysis of Hf isotopes, Tonglu and Pingtan Ig-neous Complexes. Lithos (in press)
Griffin WL, Belousova EA, Shee SR, Pearson NJ, O’Reilly SY(2002b) Archean crustal evolution in the northern YilgarnCraton: U–Pb and Hf-isotope evidence from detrital zircons.Precambrian Res (submitted)
Guo J, O’Reilly SY, Griffin WL (1996) Zircon inclusions in co-rundum megacrysts I: trace element geochemistry and clues tothe origin of corundum megacrysts in alkali basalts. GeochimCosmochim Acta 60:2347–2363
Hanchar JM, Finch RJ, Hoskin PWO, Watson EB, Cherniak DJ,Mariano AN (2001) Rare earth elements in synthetic zircon:part I. synthesis, and rare earth element and phosphorus dop-ing. Am Mineral 86:667–680
Heaman LM, Bowins R, Crocket J (1990) The chemical composi-tion of igneous zircon suites: implications for geochemicaltracer studies. Geochim Cosmochim Acta 54:1597–1607
621

Hinton RW, Upton BGJ (1991) The chemistry of zircon: variationswithin and between large crystals from syenite and alkali basaltxenoliths. Geochim Cosmochim Acta 55:3287–3302
Hoskin PWO, Ireland TR (2000) Rare earth element chemistry ofzircon and its use as a provenance indicator. Geology 28:627–630
Hoskin PWO, Kinny PD, Wyborn D, Chappell BW (2000) Iden-tifying accessory mineral saturation during differentiation ingranitoid magmas: an integrated approach. J Petrol 41:1365–1396
Jaques,AL, Lewis JD, Smith CB (1986) The kimberlitic and lam-proitic rocks of Western Australia. Geol Surv West Aust Bull132
Krasnobayev AA (1986) Zircon as indicator of geological processes(in Russian). Nauka, Moscow
Kresten P, Fels P, Berggren G (1975) Kimberlite zircons – a possibleaid in prospecting for kimberlites. Miner Deposita 10:47–56
Leitch EC, Iwasaki M, Watanabe T, Iizumi S, Ishiga H, KawachiY (1988) The structure of the southern part of the New EnglandFold Belt. In: Preliminary report on the geology of the NewEngland Fold Belt, Australia, vol 1. Co-operative ResearchGroup of Japan and Australia, pp 9–31
Lyakhovich VV (1996) Zircons in diamond-bearing rocks. Trans(Doklady) Russian Acad Sci/Earth Sci Sect 347(2):179–199
Moore RO, Griffin WL, Gurney JJ, Ryan CG, Cousens DR,Sie SH, Suter GF (1992) Trace element geochemistry of ilmenitemegacrysts from the Monastery kimberlite, South Africa.Lithos 29:1–18
Murali AV, Parthasarathy R, Mahadevan TM, Sankar Das M(1983) Trace element characteristics, REE patterns and parti-tion coefficients of zircons from different geological environ-ments – a case study on Indian zircons Geochim CosmochimActa 47:2047–2052
Nagasawa H (1970) Rare earth concentrations in zircon and apatiteand their host dacites and granites. Earth Planet Sci Lett 9:359–364
Neumann E-R (1980) Petrogenesis of the Oslo region larvikites andassociated rocks. J Petrol 21:499–531
Norman MD, Pearson NJ, Sharma A, Griffin WL (1996) Quanti-tative analysis of trace elements in geological materials by laserablation ICPMS: instrumental operating conditions and cali-bration values of NIST glasses. Geostand Newslett 20:247–261
Norman MD, Griffin WL, Pearson NJ, Garcia MO, O’Reilly SY(1998) Quantitative analysis of trace element abundances inglasses and minerals: a comparison of laser ablation ICPMS,solution ICPMS, proton microprobe, and electron microprobedata. J Anal Atomic Spectrosc 13:477–482
Pupin JP, Persoz F (1999) Magma mixing revealed by zircon studyof ferro-K subalkaline granite series. Earth Planet Sci 328:9–16
Shannon RD (1976) Revised effective ionic radii and systematicstudies of interatomic distances in halides and chalcogenides.Acta Crystallogr A32:751–767
Shnukov SE, Cheburkin AK, Andreev AV (1989) Geochemistry ofwide-spread coexisting accessory minerals and their role in in-vestigation of endogenetic and exogenetic processes (inRussian). Geol J 2:107–114
Shnukov SE, Andreev AV, Savenok SP (1997) Admixture ele-ments in zircons and apatites: a tool for provenance studies ofterrigenous sedimentary rocks. European Union of Geo-sciences (EUG 9), 23–24 March 1997, Strasbourg, Abstract 65/4P16:597
Speer JA (1980) Zircon. In: Ribbe PH (ed) Orthosilicates. Reviewsin mineralogy. Mineralogical Society of America, Washington,DC, pp 67–112
Taylor SR, McLennan SM (1985) The continental crust: its com-position and evolution. Blackwell, Oxford
Wass SY (1980) Geochemistry and origin of xenoliths-bearing andrelated alkali basaltic rocks from the southern highlands, NSW,Australia. Am J Sci A280:639–666
Watson EB (1979) Zircon saturation in felsic liquids: experimentalresults and applications to trace element geochemistry. ContribMineral Petrol 70:407–419
Watson EB (1980) Some experimentally determined zircon/liquidpartition coefficients for the rare earth elements. GeochimCosmochim Acta 44:895–897
Watson EB, Cherniak DJ (1997) Oxygen diffusion in zircon. EarthPlanet Sci Lett 148:527–544
Watson EB, Harrison TM (1983) Zircon saturation revisited:temperature and composition effects in a variety of crustalmagma types. Earth Planet Sci Lett 64:295–304
Wiedenbeck M, Alle P, Corfu F, Griffin WL, Meier M, Oberli F,Von Quart A, Roddick JC, Spiegel W (1995) Three naturalzircon standards for U–Th–Ph, Lu–Th, trace element and REEanalyses. Geostand Newslett 19(1):1–23
622