Embed Size (px)
Citation preview

© CY Lin, 2016 Columbia UniversityE6895 Advanced Big Data Analytics — Lecture 6
E6895 Advanced Big Data Analytics Lecture 6:
Social and Cognitive Analytics (II)
Ching-Yung Lin, Ph.D.
Adjunct Professor, Dept. of Electrical Engineering and Computer Science
IBM Chief Scientist, Graph Computing, Watson Research Center

© CY Lin, Columbia UniversityE6895 Advanced Big Data Analytics — Lecture 6 2
What keywords should I put in the search box to get the information I really want? Q.
Relational Term-Suggestion

© 2016 Columbia University
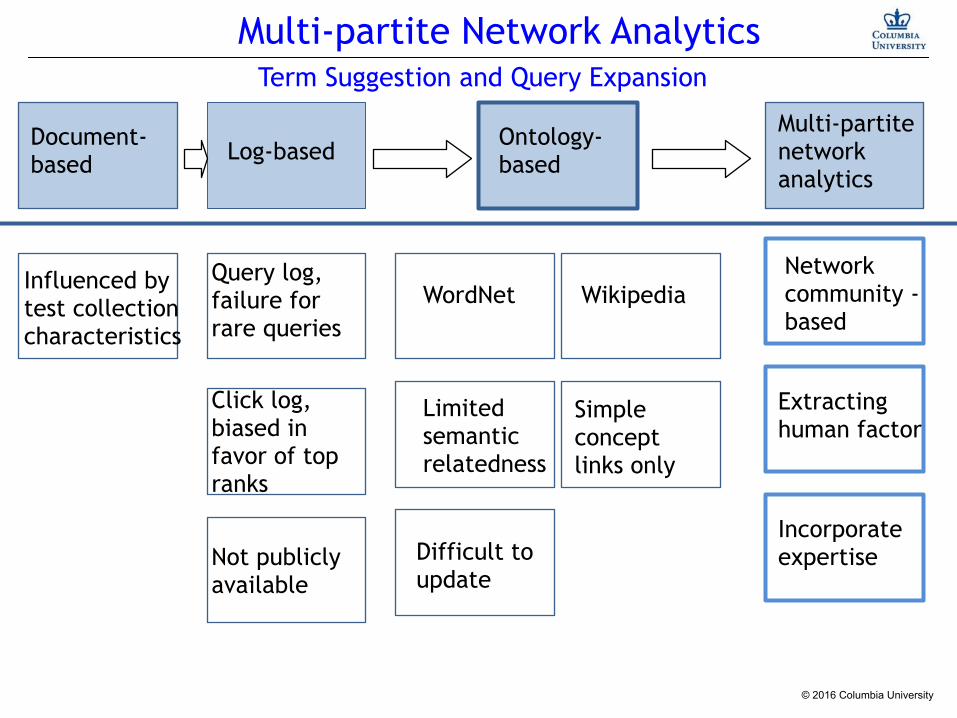
Term Suggestion and Query Expansion
Log-based
Multi-partite Network Analytics
WordNet WikipediaInfluenced by test collection characteristics
Simple concept links only
Limited semantic relatedness
Difficult to update
Extracting human factor
Incorporate expertise
Network community -based
Click log, biased in favor of top ranks
Query log, failure for rare queries
Document-based
Ontology-based
Multi-partite network analytics
Not publicly available

© 2016 Columbia University
■ Influenced by test collection characteristics ■ No consideration of key terms that are highly
semantically related but do not frequently co-occur.
■ Influenced
Document-based
apple juice apple tree
apple store apple TV
Kim, M. AND Choi, K. A. 1999. Comparison of collocation-based similarity measures in query expansion. Information Processing and Management 35 (1999), 19-30.

© 2016 Columbia University
Term Suggestion and Query Expansion
Log-based
Multi-partite Network Analytics
WordNet WikipediaInfluenced by test collection characteristics
Simple concept links only
Limited semantic relatedness
Difficult to update
Extracting human factor
Incorporate expertise
Network community -based
Click log, biased in favor of top ranks
Query log, failure for rare queries
Document-based
Ontology-based
Multi-partite network analytics
Not publicly available

© 2016 Columbia University
Log-based ■ Cluster queries with similar clicked URLs
■ Identifying the mapping between queries and clicked URLs
Pet food
Dog food
BAEZA-YATES, R., AND TIBERI, A. 2007. Extracting Semantic Relations from Query Logs. In Proceedings of the 13th ACM SIGKDD International Conference on Knowledge Discovery and Data Mining (KDD 2007), 76-85.
© 2016 Columbia University
Term Suggestion and Query Expansion
Log-based
Multi-partite Network Analytics
WordNet WikipediaInfluenced by test collection characteristics
Simple concept links only
Limited semantic relatedness
Difficult to update
Extracting human factor
Incorporate expertise
Network community -based
Click log, biased in favor of top ranks
Query log, failure for rare queries
Document-based
Ontology-based
Multi-partite network analytics
Not publicly available
© 2016 Columbia University
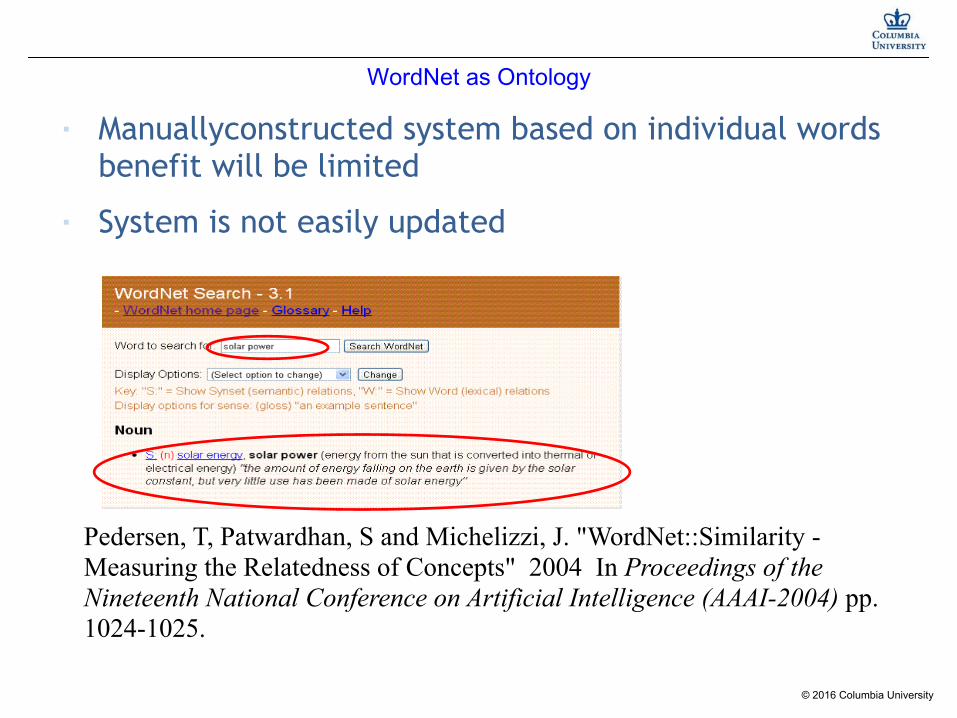
WordNet as Ontology
■ Manuallyconstructed system based on individual words benefit will be limited
■ System is not easily updated
Pedersen, T, Patwardhan, S and Michelizzi, J. "WordNet::Similarity - Measuring the Relatedness of Concepts" 2004 In Proceedings of the Nineteenth National Conference on Artificial Intelligence (AAAI-2004) pp. 1024-1025.

© 2016 Columbia University
Wikipedia as Ontology

© 2016 Columbia University
■ Wikipedia is a web-based free encyclopedia that anyone can edit.
■ The English Wikipedia edition
■ 2.4 million articles
■ 1 billion words.
■ Wikipedia relies on the power of collective intelligence
■ by peer-reviewed approaches rather than the authority of individual.
■ high quality,
■ almost noise free.
Wikipedia as Ontology

© 2016 Columbia University
Previous Approaches
■ Merely as an online dictionary and utilize it only as a structured knowledge database
■ Using associated hyperlinks
MILNE, D., WITTEN, I. H., AND NICHOLS, D. 2007. A Knowledge-Based Search Engine Powered by Wikipedia. In Proceedings of the 16th ACM Conference on Information and Knowledge Management (CIKM 2007), 445-454..
© 2016 Columbia University
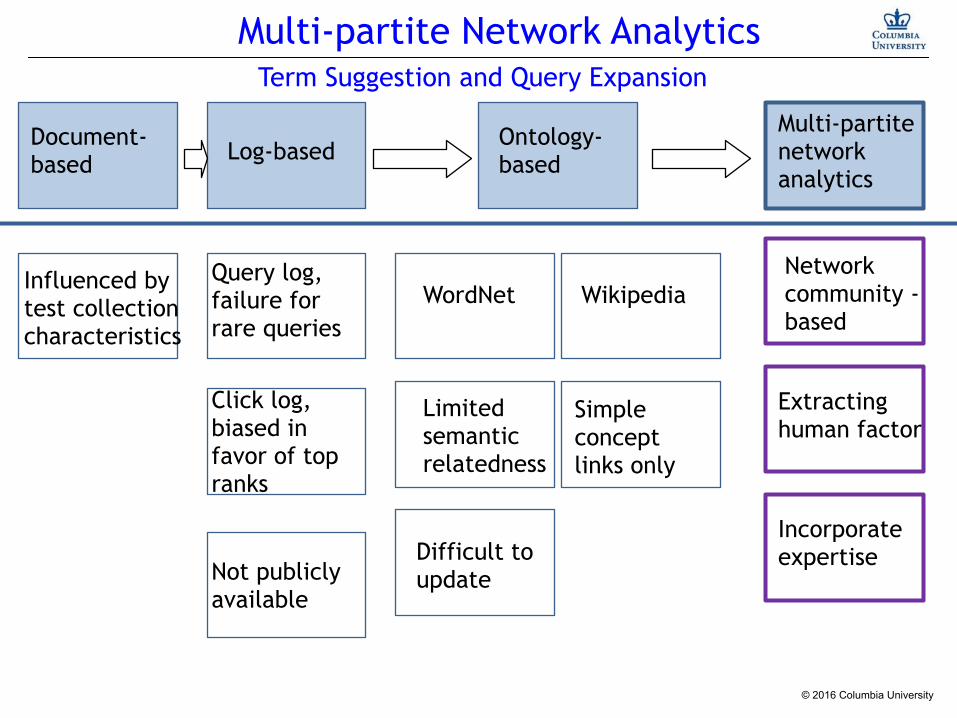
Term Suggestion and Query Expansion
Log-based
Multi-partite Network Analytics
WordNet WikipediaInfluenced by test collection characteristics
Simple concept links only
Limited semantic relatedness
Difficult to update
Extracting human factor
Incorporate expertise
Network community -based
Click log, biased in favor of top ranks
Query log, failure for rare queries
Document-based
Ontology-based
Multi-partite network analytics
W 2.0Not publicly available

© 2016 Columbia University
Log-based
WordNet WikipediaInfluenced by test collection characteristics
Simple concept links only
Limited semantic relatedness
Difficult to update
Click log, biased in favor of top ranks
Not publicly available
Query log, failure for rare queries
Ontology-based
Multi-partite network analytics
Crawling is resource-intensive
Human factor modeling
Semantic relatedness difficult to evaluate
Multi-partite Network AnalyticsTerm Suggestion and Query Expansion
Document-based
Our Challenge

© 2016 Columbia University6/3/12 15
Wikipedia as Ontology
© 2016 Columbia University
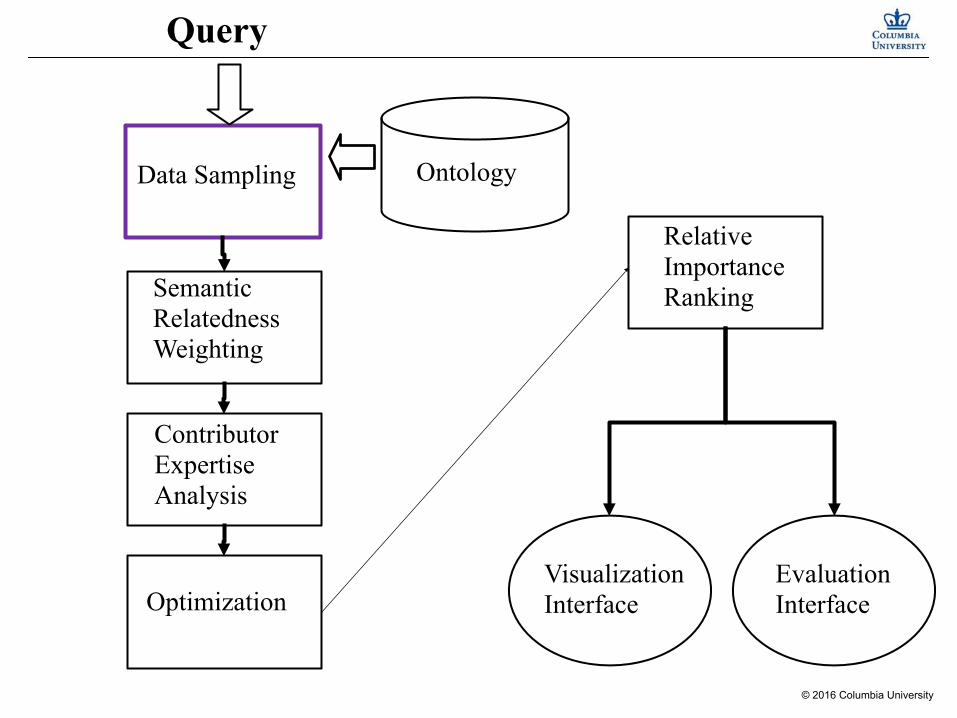
Query
Contributor Expertise Analysis
Optimization
Relative Importance Ranking
Visualization Interface
Evaluation Interface
Ontology Data Sampling
Semantic Relatedness Weighting

© 2016 Columbia University
C C
C:contributors T:Terms
T
T
C C
Key Term
T
C C
T
C C
L
L L
L
L:Categories
Layer by layer

© 2016 Columbia University
Query
Contributor Expertise Analysis
Optimization
Relative Importance Ranking
Visualization Interface
Evaluation Interface
Ontology Data Sampling
Semantic Relatedness Weighting

© 2016 Columbia University

© 2016 Columbia University
Query
Contributor Expertise Analysis
Optimization
Relative Importance Ranking
Visualization Interface
Evaluation Interface
Ontology Data Sampling
Semantic Relatedness Weighting
© 2016 Columbia University

© 2016 Columbia University
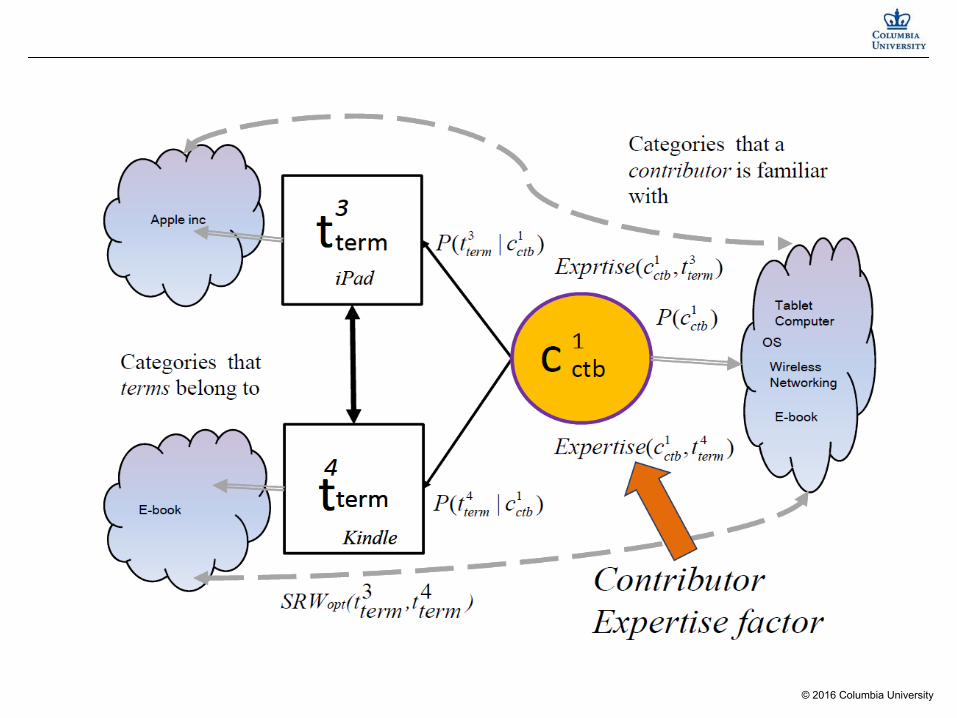
Contributor Expertise factor
Expertise inference
Expertise
Contributor to contributor
Contributor to categories
Term to categories
Term to Term

© 2016 Columbia University
Query
Contributor Expertise Analysis
Optimization
Relative Importance Ranking
Visualization Interface
Evaluation Interface
Ontology Data Sampling
Semantic Relatedness Weighting

© 2016 Columbia University
High Semantic Relatedness Term Suggestion from Our System

© 2016 Columbia University
Word-completion Term Suggestion

© 2016 Columbia University
P@1 P@5 S@5 S@20 MRR
Simple link 0.3736 0.3039 0.6017 0.6231 0.4023
+Contributor 0.6151 0.3917 0.8031 0.8116 0.4125
+Expertise 0.6693 0.4412 0.8297 0.9620 0.5919
Performance Comparison for Different Relationship Levels. Using BibSonomy Dataset
Experiment I

© 2016 Columbia University
Wordnet Bag of words Our algorithm
Literature 62.0% ± 5% 62.7% ± 4% 76.8% ± 6%
Natural science 60.7% ± 4% 65.6% ± 6% 73.3% ± 3%
Sociology 72.1% ± 5% 62.9% ± 5% 72.5% ± 7%
Business 60.4% ± 6% 58.5% ± 8% 67.1% ± 7%
Law 52.2% ± 9% 50.4% ± 8% 66.3% ± 6%
Engineering 54.0% ± 6% 68.3% ± 5% 66.2% ± 4%
Electrical & Computer Eng.
77.0% ± 4% 68.0% ± 3% 82.3% ± 3%
Life Science 73.1% ± 6% 70.9% ± 6% 81.4% ± 7%
Agriculture 72.6% ± 5% 65.1% ± 6% 72.3% ± 5%
Medical 63.0% ± 8% 65.6% ± 7% 61.6% ± 8%
ODP-based precision evaluation results increase 12.5% in average
Experiment II – Accuracy on different categories
© 2016 Columbia University
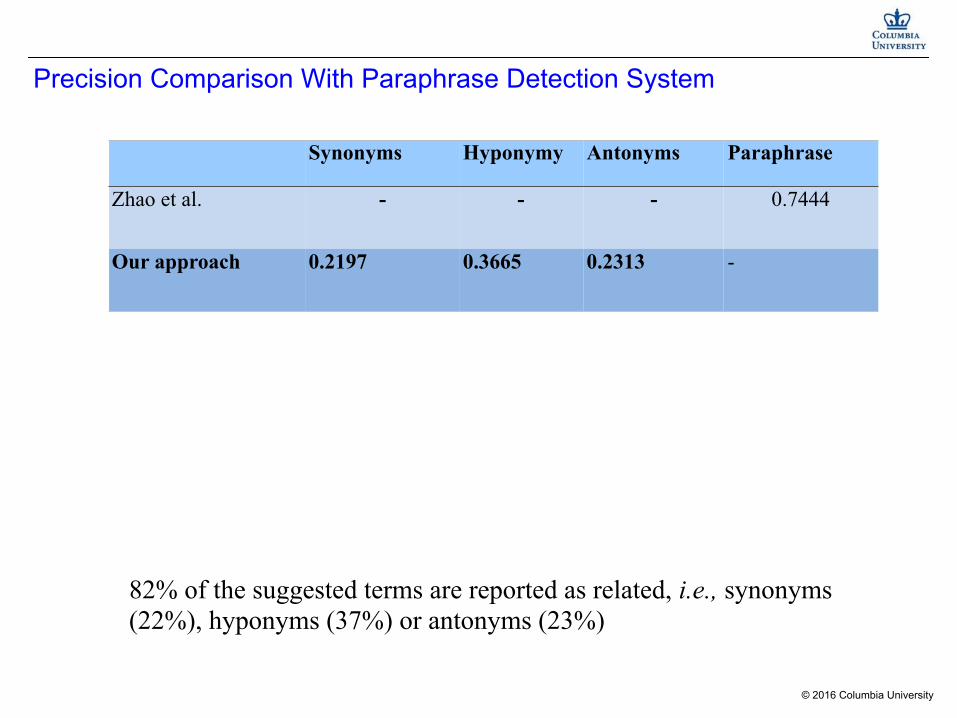
Synonyms Hyponymy Antonyms Paraphrase
Zhao et al. - - - 0.7444
Our approach 0.2197 0.3665 0.2313 -
Precision Comparison With Paraphrase Detection System
82% of the suggested terms are reported as related, i.e., synonyms (22%), hyponyms (37%) or antonyms (23%)

© CY Lin, Columbia UniversityE6895 Advanced Big Data Analytics — Lecture 6 28
References
Jyh-Ren Shieh, Ching-Yung Lin, Shun-Xuan Wang, Ja-Ling Wu, “Relational Term-Suggestion Graphs Incorporating Multi-Partite Concept and Expertise Networks,” ACM Transactions on Intelligent Systems and Technology (2012).
Jyh-Ren Shieh, Ching-Yung Lin, Shun-Xuan Wang, Ja-Ling Wu, “ Building Multi-Modal Relational Graphs for Multimedia Retrieval,” International Journal of Multimedia Data Engineering and Management (IJMDEM): pp. 19-41 (2011). Best paper award nomination.
Jyh-Ren Shieh, Yung-Huan Hsieh, Yang-Ting Yeh, Tse-Chung Su, Ching-Yung Lin, Ja-Ling Wu, “Building term suggestion relational graphs from collective intelligence,” World Wide Web Conference (WWW 2009) pp. 1091-1092 (2009).
Jyh-Ren Shieh, Yang-Ting Yeh, Chih-Hung Lin, Ching-Yung Lin and Ja-Ling Wu, “Using Semantic Graphs for Image Search,” IEEE International Conference on Multimedia & Expo (ICME 2008), pp. 105-108 (2008).
29
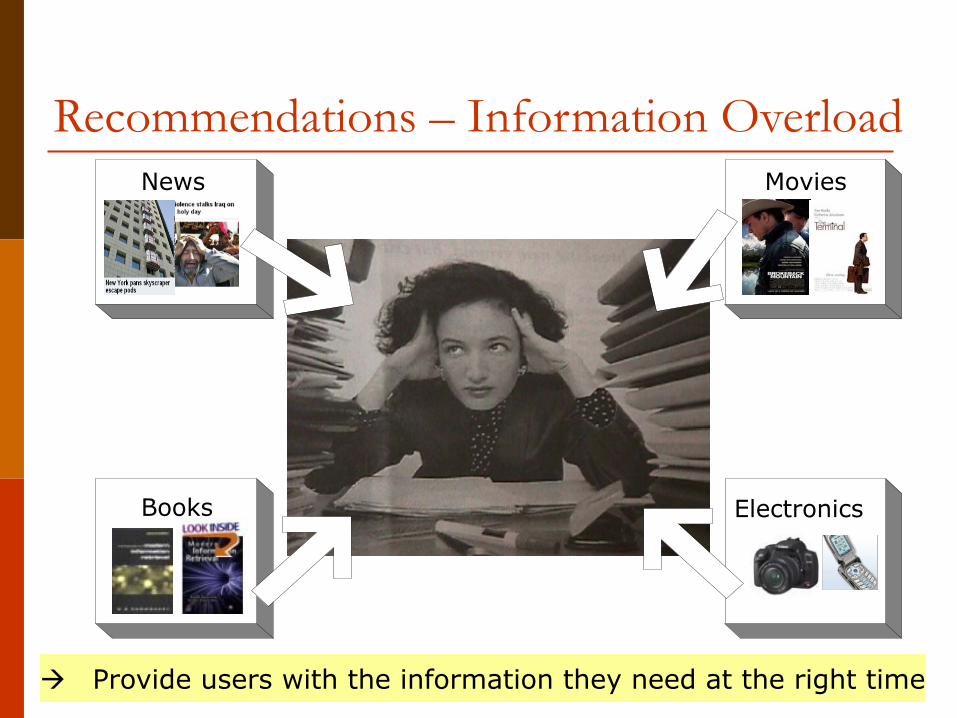
Recommendations – Information Overload
à Provide users with the information they need at the right time
Books, Journals,Research
papers
News
Books
Movies
Electronics

30
Outlinep Introduction and Background p Exploiting Dynamic Patterns for
Recommendation Systems ■ Community based Dynamic Recommendation ■ Personalized Recommendation Driven by
Information Flow p Other Related Work p Conclusions

31
Recommender Systems: General IdeaUser profile (info about the user)
Set of itemscomparison
Recommendation e.g. news articles, books, music, movies, products, …
Sample applications p E-commerce
Product recommender - Amazon p Enterprise Activity Intelligence
Domain expert finder, … p Digital Libraries
Pages/documents/books recommendation p Personal Assistance Museum guidance, …
Algorithms p Content-based Filtering p Collaborative Filtering p Hybrid Filtering (combination of the above two)
32
Preference: and
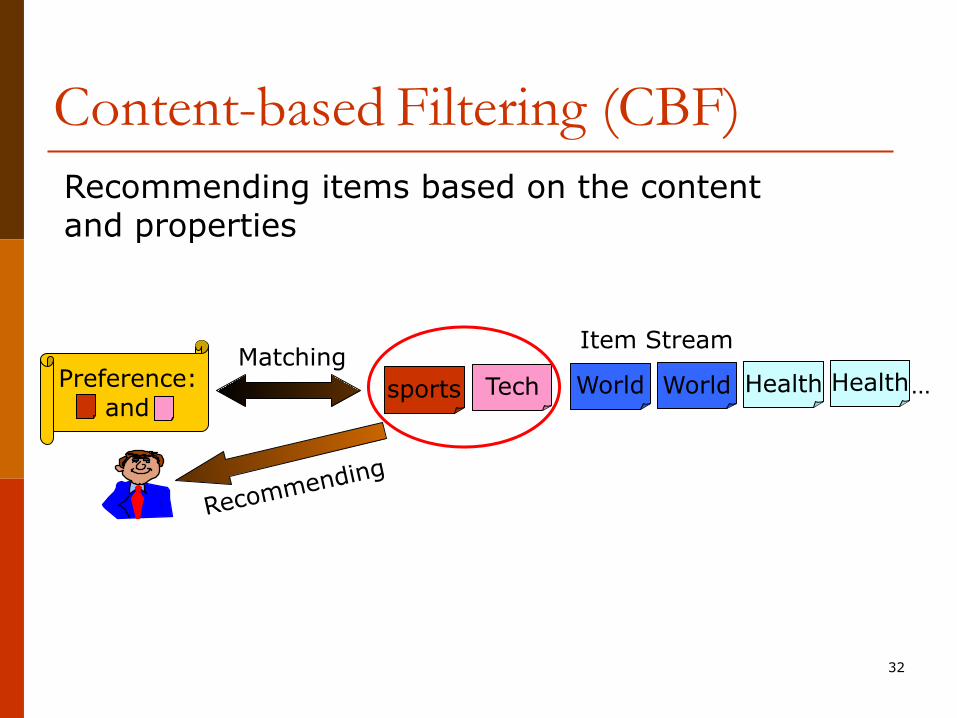
Content-based Filtering (CBF)Recommending items based on the content and properties
sports World HealthWorld Health…TechMatching
Item Stream
Recommending

33
Collaborative Filtering (CF)Leveraging opinions of like-minded users
People with similar tastes
Given
Reco
mm
end

34
Exploiting Dynamic Patterns for Recommender Systems
p Dynamic nature from both items and users ■ Items expire over time with types of
p Short-term p Long-term
■ Users’ intentions of p Updating breaking information p Looking for long-term items
■ Users’ interests evolve over time
p User adoption patterns ■ Some users are earlier adopters

35
Outlinep Introduction and Background p Exploiting Dynamic Patterns for
Recommendation Systems ■ Community based Dynamic Recommendation [Song
et al. SDM’06] ■ Personalized Recommendation Driven by
Information Flow [Song et al. SIGIR’06] p Other Related Work p Conclusions

36
Community based Dynamic Recommendationp Objective
■ Push personalized relevant information to users at the right time
p Challenges ■ Information should be personalized ■ Users’ needs are changing and evolving
p Our Novel Technology Solutions -- Adaptive User and Community Modeling ■ Content-Time-Community (CTC) model: a Bayesian
Network infrastructure for finding evolving communities and content topics
■ Time-Sensitive Adaboost model: a scheme to decide the relevance of information based on dynamic personal/community profiles

37
Scheme Overview
Dynamic recommendation is addressed by dynamic pattern analysis, content analysis and community construction
Dataset includes user log files and users’ and documents’ information
Community based
recommendation
Content analysis
Community construction
Dynamic pattern analysis
Dataset
New items
Recommendations
38
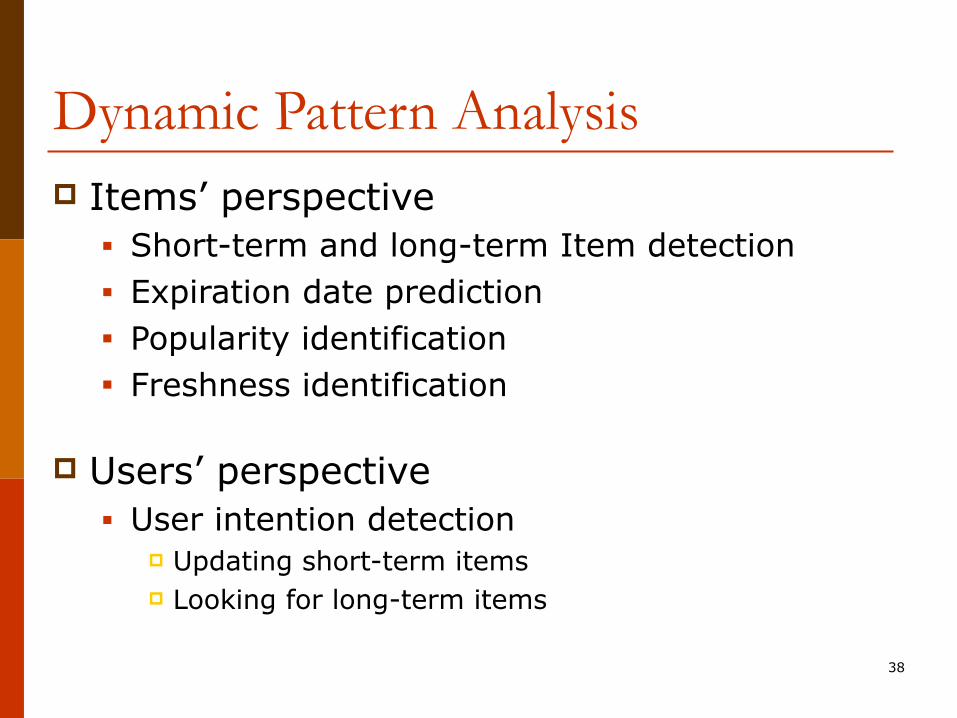
Dynamic Pattern Analysisp Items’ perspective
■ Short-term and long-term Item detection ■ Expiration date prediction ■ Popularity identification ■ Freshness identification
p Users’ perspective ■ User intention detection
p Updating short-term items p Looking for long-term items
39
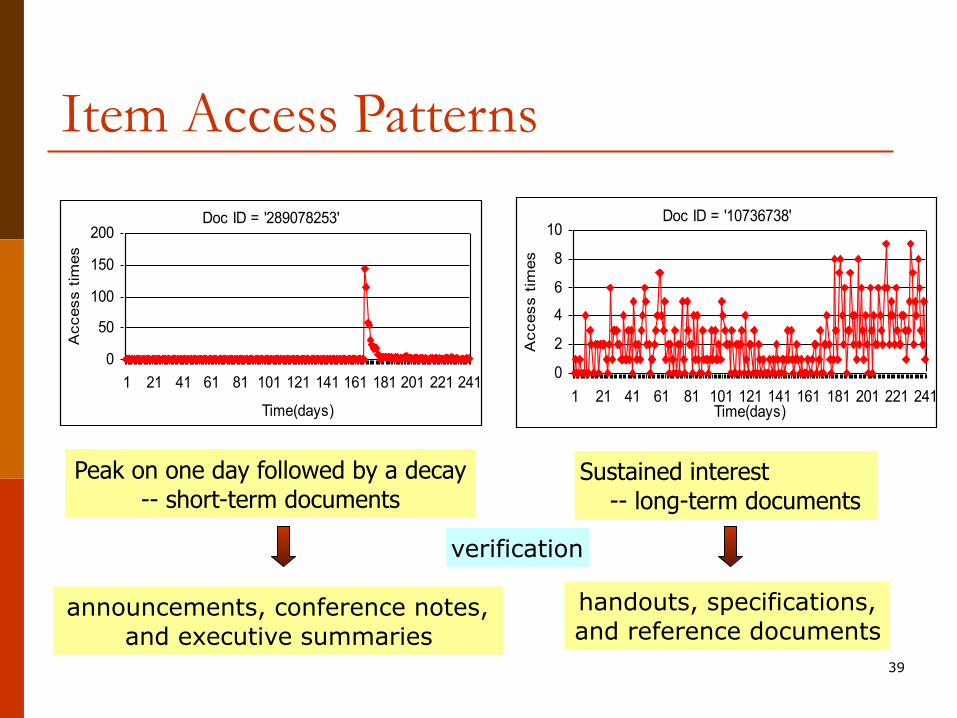
Item Access Patterns
Peak on one day followed by a decay -- short-term documents
Sustained interest -- long-term documents
Doc ID = '289078253'
0
50
100
150
200
1 21 41 61 81 101 121 141 161 181 201 221 241
Time(days)
Acc
ess
times
Doc ID = '10736738'
0
2
4
6
8
10
1 21 41 61 81 101 121 141 161 181 201 221 241Time(days)
Acc
ess
times
announcements, conference notes, and executive summaries
handouts, specifications, and reference documents
verification

40
More Item Dynamic Patternsp Expiration Date Prediction
■ Observations p The longer nobody downloads a document, the less
likely it will be downloaded in the future where
p Popularity identification ■ how many times one document was downloaded by
others during a time period
p Freshness identification ■ difference between user’s login time and the disclosure
time of the document
( )( ) 1 expP e tη= − − ! if 0 others
na t na tt thr t thrt
− >"= #$
!
41
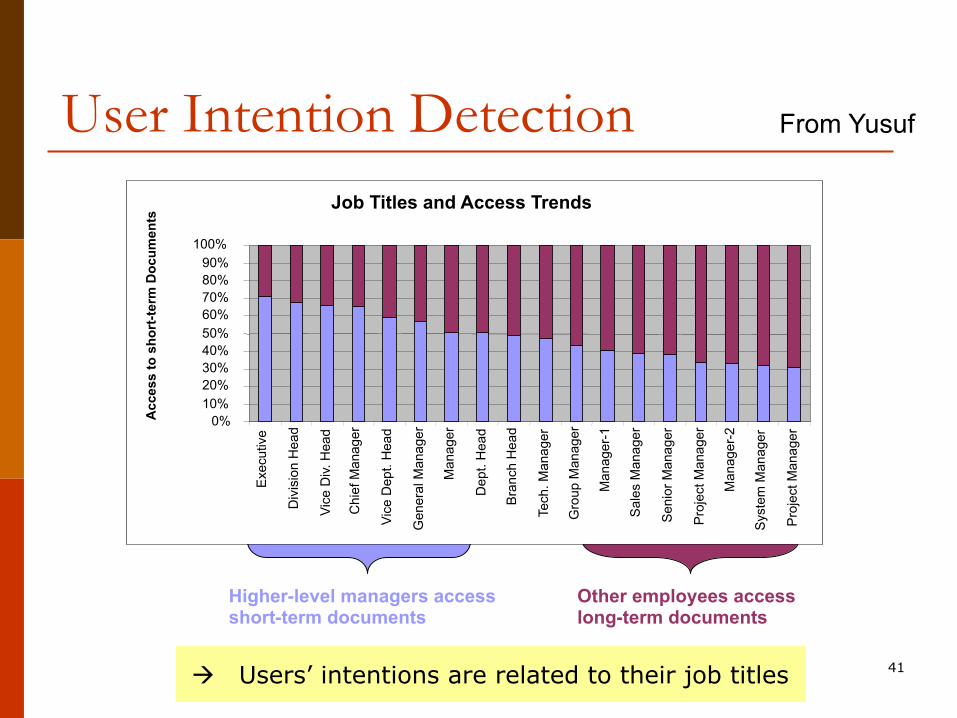
User Intention Detection
Higher-level managers access short-term documents
Other employees access long-term documents
From Yusuf
Job Titles and Access Trends
0%10%20%30%40%50%60%70%80%90%
100%E
xecu
tive
Div
isio
n H
ead
Vice
Div.
Hea
d
Chi
ef M
anag
er
Vice
Dep
t. H
ead
Gen
eral
Man
ager
Man
ager
Dep
t. H
ead
Bra
nch
Hea
d
Tech
. Man
ager
Gro
up M
anag
er
Man
ager
-1
Sal
es M
anag
er
Sen
ior M
anag
er
Pro
ject
Man
ager
Man
ager
-2
Sys
tem
Man
ager
Pro
ject
Man
ager
Acc
ess
to s
hort
-term
Doc
umen
ts
à Users’ intentions are related to their job titles

42The probability of the word
under the jth topicThe probability of choosing a word from
the jth topic in the current document
river
TOPIC 2
river
riverstreambank
bank
stream
loan
TOPIC 1
money
loanbank money
bank ba
nk
loan
DOCUMENT 2: loan1 river2 stream2 loan1 bank2 river2 bank2
bank1 stream2 river2 loan1 bank2 stream2 bank2 money1 loan1 river2 stream2 bank2 stream2 bank2 money1 river2
DOCUMENT 1: money1 bank1 bank1 loan1 river2 stream2 bank1
money1 river2 bank1 money1 bank1 loan1 money1 stream2 bank1 money1 loan1 river2 stream2 bank1 money1
0.3
0.8
0.2
Content Analysis - Latent Dirichlet Allocation (LDA) [Blei et al. 2003]
( )djθ
( )jwφ
0.7
Goal – categorize the documents into topics p Each document is a probability distribution over topics p Each topic is a probability distribution over words
( ) ( ) ( )1
|T
i i i ij
P w P w z j P z j=
= = =∑The probability of ith word in a given document
Mixture components
Mixture weights
iw

43
INPUT: ■ document-word counts
• D documents, W words
OUTPUT: ■ likely topics for a document
LDA (cont.)
( ) ( )( | ) |P z w P w z P z∝θ
wW
D
β
α
z
T
T: number of topics
φ
: Observations
Bayesian approach: use priors Mixture weights ~ Dirichlet( α ) Mixture components ~ Dirichlet( β )
p Parameters can be estimated by Gibbs Sampling
p Outperform Latent Semantic Analysis (LSA) and Probabilistic LSA in various experiments [Blei et al. 2003]

44
Traditional Content Clustering
fw2
fwj : the frequency of the word wj
in a document
fw1
fw3 Clustering: Partition the feature space into segments based on training documents. Each segment represents a topic / category. (ç Topic Detection)
Hard clustering: e.g., K-mean clustering
1 2{ , ,..., }
Nw w wd f f f z= →
w1
: observationsz1Topics
Words
z2 z3 z4 z5
w5w2 w3 w4 w6Another representation of clustering (w/o showing the deterministic part)
( | )P Z wW = f
Soft clustering: e.g., Fuzzy C-mean clustering
w1
: observationsz1Topics
Words
z2 z3 z4 z5
w5w2 w3 w4 w6
Another representation of clustering
d1Documents d5d2 d3 d4 d6

45
Traditional Content Clustering
fw2
fwj : the frequency of the word wj
in a document
fw1
fw3 Clustering: Partition the feature space into segments based on training documents. Each segment represents a topic / category. (ç Topic Detection)
Hard clustering: e.g., K-mean clustering
1 2{ , ,..., }
Nw w wd f f f z= →
w1
: observationsz1Topics
Words
z2 z3 z4 z5
w5w2 w3 w4 w6Another representation of clustering (w/o showing the deterministic part)
( | )P Z wW = f
Soft clustering: e.g., Fuzzy C-mean clustering

46
Content Clustering based on Bayesian Network
( | )P W Z
Bayesian Network: • Causality Network – models the causal relationship of attributes / nodes • Allows hidden / latent nodes
Hard clustering:
w1 : observations
z1Topics
Words
z2 z3 z4 z5
w5w2 w3 w4 w6
soft clustering
d1Documents d2 d3
( | ) ( )( | )( )
P Z W P WP W ZP Z
=
( | )P Z D
( ) argmax ( | )z
h D d P Z= = wW = f
( )h Dhard clustering
s. c.
<= MLE
<= Bayes Theorem
47
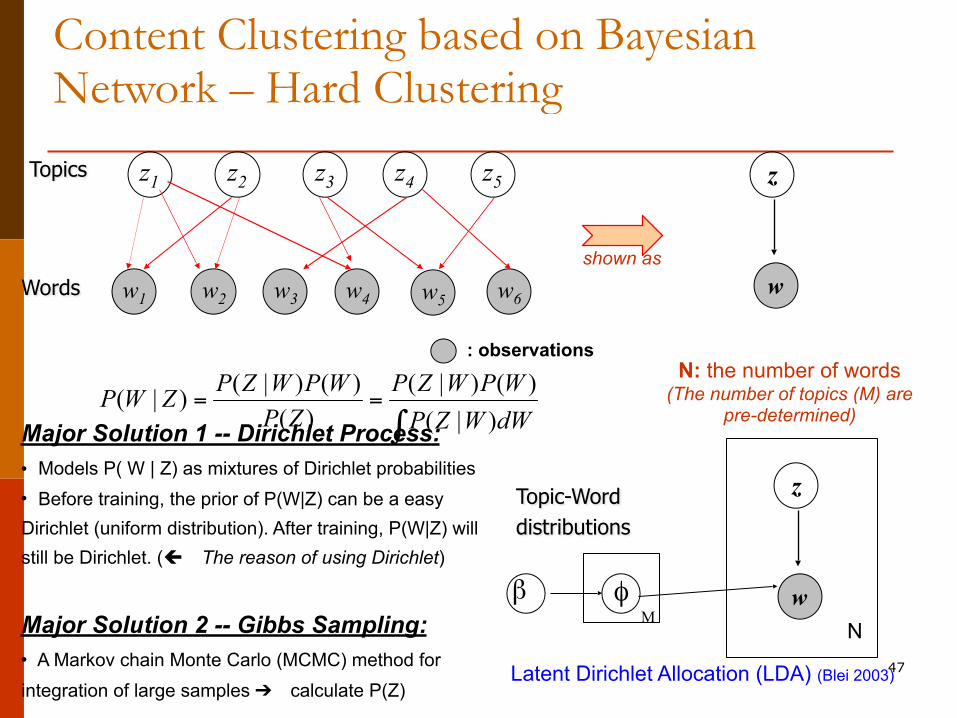
Content Clustering based on Bayesian Network – Hard Clustering
w1
: observations
z1Topics
Words
z2 z3 z4 z5
w5w2 w3 w4 w6
( | ) ( ) ( | ) ( )( | )( ) ( | )
P Z W P W P Z W P WP W ZP Z P Z W dW
= =∫
z
w
N: the number of words (The number of topics (M) are
pre-determined)Major Solution 1 -- Dirichlet Process: • Models P( W | Z) as mixtures of Dirichlet probabilities • Before training, the prior of P(W|Z) can be a easy Dirichlet (uniform distribution). After training, P(W|Z) will still be Dirichlet. (ç The reason of using Dirichlet)
Major Solution 2 -- Gibbs Sampling: • A Markov chain Monte Carlo (MCMC) method for integration of large samples ➔ calculate P(Z)
z
wN
βM
φ
Topic-Word distributions
Latent Dirichlet Allocation (LDA) (Blei 2003)
shown as

48
Content Clustering based on Bayesian Network – Soft Clustering
w1
: observations
z1Topics
Words
z2 z3 z4 z5
w5w2 w3 w4 w6
N: the number of words A: the number of docs
shown as
d1Documents d2 d3
w
d
z
LDA (Blei 2003)β
MφTopic-Word
distributions
α θ
wN
d
A
zA
Document-Topic distributions

49
Comparison of Dirichlet Distribution with Gaussian Mixture Models (1)p Dirichlet Distribution: 1 21 1 1
1 2 1 1 2 1 2
1
( )( , ,..., ; , ,..., ) ...( )
ra a ar r rr
kk
Nf f f a a a f f fa
ρ − − −−
=
Γ=
Γ∏0 1kf≤ ≤
1
1r
kkf
=
=∑
p Multivariate Gaussian:2 2 2( ) ( ) ( )1 1 2 2 1 1
2 2 21 2 1
1 2 1 1 1 2 2 1 1 11
1
1( , ,..., ; , , , ,..., , ) ...(2 )
f f fr r
rr r r r
rk
k
f f f e e eµ µ µ
σ σ σρ µ σ µ σ µ σπ σ
− − −− −
−
− − −
− − − −−
=
=
∏

50
Beyond Gaussian: Examples of Dirichlet Distribution

51
Use Dirichlet Distribution to model prior and posterior beliefs p Prior beliefs: p E.g.: *fair* coin?
■ Flipping a coin, what’s the probability of getting ‘head’.
( ) ( ; , )f beta f a bρ =
beta(1,1): No prior knowledge beta(3,3): prior knowledge -- this coin may be fair
52
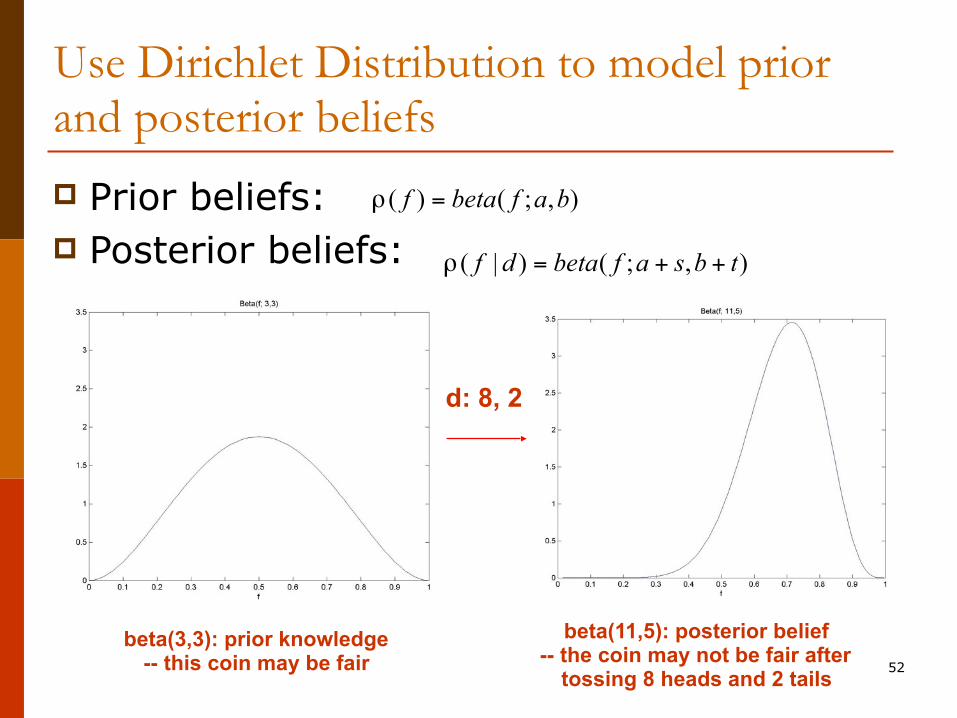
Use Dirichlet Distribution to model prior and posterior beliefs
p Prior beliefs: p Posterior beliefs:
( ) ( ; , )f beta f a bρ =
( | ) ( ; , )f d beta f a s b tρ = + +
d: 8, 2
beta(3,3): prior knowledge -- this coin may be fair
beta(11,5): posterior belief -- the coin may not be fair after
tossing 8 heads and 2 tails
53
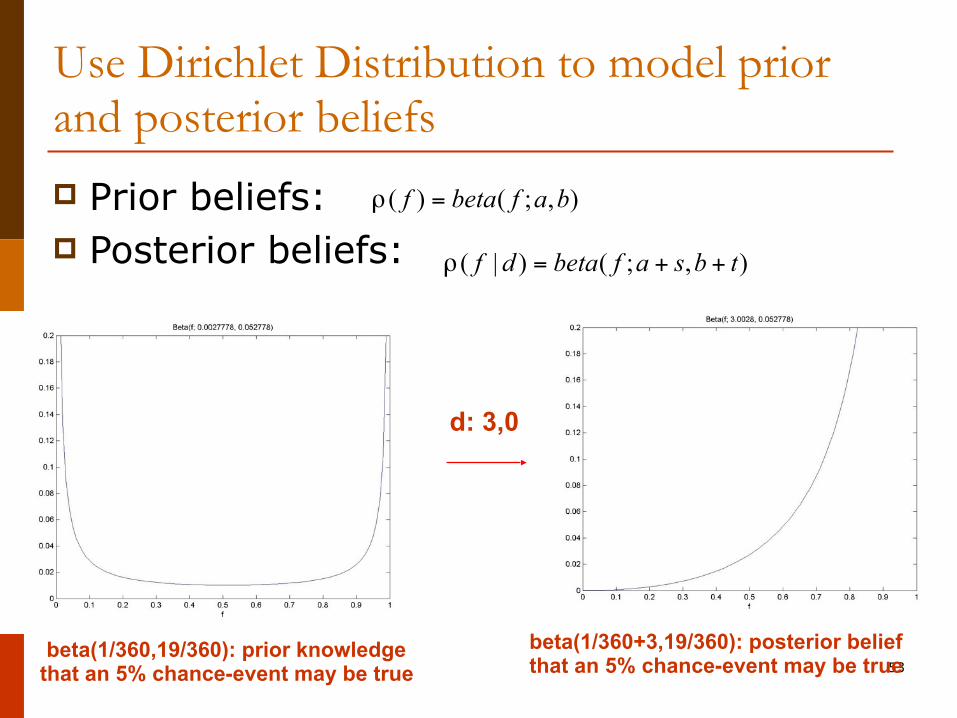
Use Dirichlet Distribution to model prior and posterior beliefs
p Prior beliefs: p Posterior beliefs:
( ) ( ; , )f beta f a bρ =
( | ) ( ; , )f d beta f a s b tρ = + +
d: 3,0
beta(1/360,19/360): prior knowledge that an 5% chance-event may be true
beta(1/360+3,19/360): posterior belief that an 5% chance-event may be true

54
Importance of Dirichlet Distributionp In 1982, Sandy Zabell proved that, if we
make certain assumptions about an individual’s beliefs, then that individual must use the Dirichlet density function to quantify any prior beliefs about a relative frequency.
55
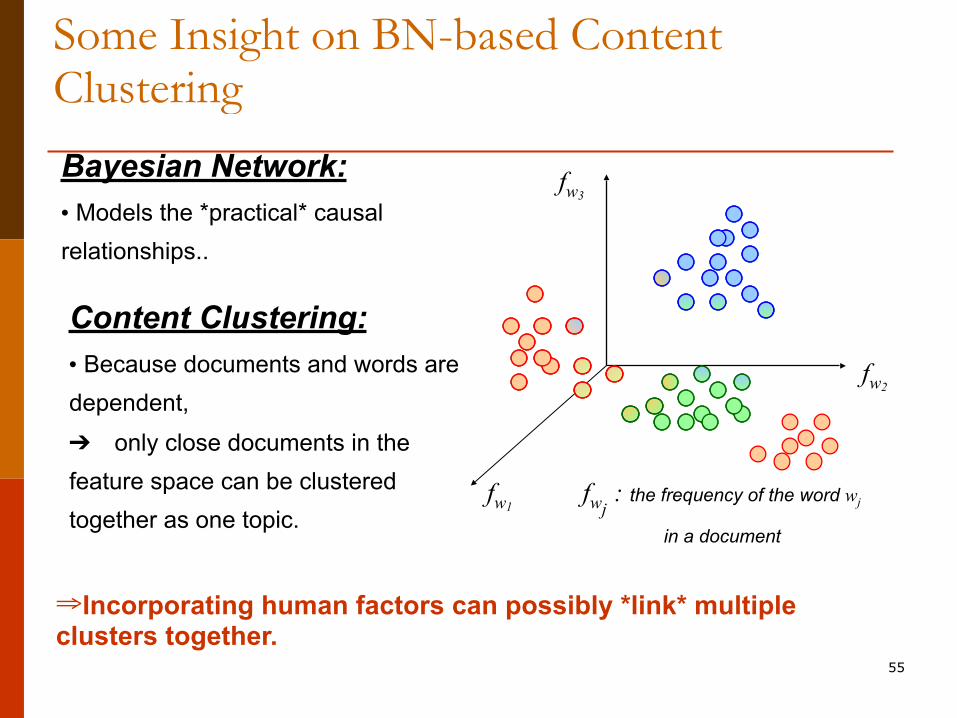
Some Insight on BN-based Content Clustering
Content Clustering: • Because documents and words are dependent,
➔ only close documents in the feature space can be clustered together as one topic.
fw2
fwj : the frequency of the word wj
in a document
fw1
fw3
⇒Incorporating human factors can possibly *link* multiple clusters together.
Bayesian Network: • Models the *practical* causal relationships..

56
Gibbs Samplingp Suppose that it is hard to sample p(x) but that it is
possible to “walk around” in X using local state transitions
p Insight: we can use a “random walk” to help us draw random samples from p(x)
p At each transition change the state of just on Xi p We can describe the transition probability as a stochastic
procedure: ■ Input: a state x1,…,xn ■ Choose i at random (using uniform probability) ■ Sample x’i from
P(Xi|x1, …, xi-1, xi+1 ,…, xn, e) ■ let x’j = xj for all j ≠ i ■ return x’1,…,x’n

57
Community Constructionp Community
■ Users with similar interests
p Formal Community Construction ■ From organization chart
p Informal Community Construction ■ Cluster people with similar evolving interests or
preferences – Content-Time-Community model

58
Goal – categorize the users into communities p Each user is a probability distribution over communities p Each community is a probability distribution over topics p Each topic is a probability distribution over words
Informal Community Construction –Content-Time-Community Model
( )ukϕ
( )kzθ
The probability of ith word accessed by a given user at tcr
The probability of the word under the jth topic
The probability of choosing the jth topic for the kth community
( ) ( ) ( ) ( )1 1
, | | , ,T C
i cr i i i j cr j crj k
P w t P w z j P z j c k t P c k t= =
= = = = =∑∑ ! !
The probability of belonging to the kth community for a user
à Incorporate the time and community into LDA model
( )jwφ

59
INPUT: ■ document-word counts
■ user-documents counts • D documents, W words, U users
■ time decay factor • tcr (current time) – t (disclose time for
each document)
Informal Community Construction –Content-Time-Community (CTC) Model
OUTPUT: ■ likely communities for a user
( ) ( ) ( )( | ) | |z
P g w P w z P z g P g∝∑: Observations
wW
D
φβ
z
T
θ αC
c
U
γU
ϕ
tcr-td
α, β, γ: hyper-parameters T: number of topics C: number of communities

60
User Modeling using Time-Sensitive Adaboostp Obtain simple classifier on each feature, e.g., setting threshold on
parameters, or binary inference on input parameters.
p The system classify whether a new document is interested by a person via Adaptive Boosting (Adaboost):
■ The final classifier is a linear weighted combination of single-feature classifiers.
■ Given the single-feature simple classifiers, assigning weights on the training samples based on whether a sample is correctly or mistakenly classified. à Boosting.
■ Classifiers are considered sequentially. The selected weights in previous considered classifiers will affect the weights to be selected in the remaining classifiers. à Adaptive.
■ According to the summed errors of each simple classifier, assign a weight to it. The final classifier is then the weighted linear combination of these simple classifiers.
p Our new Time-Sensitive Adaboost algorithm: ■ In the AdaBoost algorithm, all samples are regarded equally important at
the beginning of the learning process
■ We propose a time-adaptive AdaBoost algorithm that assigns larger weights to the latest training samples
People select apples according to their shapes, sizes, other people’s interest, etc.
Each attribute is a simple classifier used in Adaboost.

61
Community based recommendation (1)
( )final1
( )S
s ss
f sign h xα=
" #= $ %
& '∑x
The final classifier is a linear combination of the weak classifiers obtained at all iterations
- Start with a uniform distribution (“weights”) over training examples (The weights tell the weak learning algorithm which examples are important)
- Obtain a weak classifier from the weak learning algorithm, hjt:X→{-1,1}
- Increase the weights on the training examples that were misclassified
- (Repeat)
p Adaboost [Freund and Schapire 1996] ■ Constructing a “strong” learner as
a linear combination of weak learners

62
Community based recommendation (2) --Time-Sensitive AdaBoost Modeling
p In AdaBoost, the goal is to minimize the energy function:
■ All samples are regarded equally important at the beginning of the learning process
p Propose a time-adaptive AdaBoost algorithm that assigns larger weights to the latest documents to indicate their importance
p Weak learners ■ linear classifiers corresponding
to the content, community and dynamic patterns
( )1 1
expN S
i s s ii s
c h xα= =
" #−% &' (
∑ ∑
( )( ) ( )1 1
exp exp ,N S
i s i s ii s
c t t h x tα τ= =
# $− − ⋅ −' () *
∑ ∑
Algorithm: Time-Sensitive Adaboost Given: ( ) ( )1 1 1, , , , , ,N N Nx c t x c t! where ix ∈X , { }1,1ic ⊆ − , N is the size of samples in the training set; current time t, and τ For s = 1,…, S
Initialize ( ) ( )( )( )1 1 exp iD i N t tτ= ⋅ ⋅ − .
Set the weight sα of the current weak hypothesis
sh according to its weighted error rate sε
11 ln2
ss
s
εα
ε
( )−= * +
, -
where ( ) ( )1
N
s s s i ii
D i h x cε=
=∑ .
Update ( )( ) ( )( ) ( )( )
1
exp exps s i i s is
s
D i c t t h xD i
Z
α τ+
− − ⋅ −=
where sZ is a normalization term. End Find weak hypothesis by: arg min
js jh
h ε∈
=H
.
Output: the final hypothesis: ( ) ( )( )signH x F x=
where ( ) ( )1
S
s ss
F x h xα=
=∑ .

63
Experiments - Methodologyp Dataset
■ “EigyoRyoku”(Sales-Force) system (31,927 users, 26,631 documents)
■ Log files p Apr. 2004 to Mar. 2005
▪ Training data - Apr. 2004 to Feb. 2005 ▪ Test data – Mar. 2005
p Nine user actions ▪ "Login", "Register_Feedback", "Preview", "Abstract", "Document
Download", "Search", "Register", "Update", "Delete"
p Evaluation -- user satisfaction ■ How many people really downloaded the documents
among these five recommendations during the testing period
64
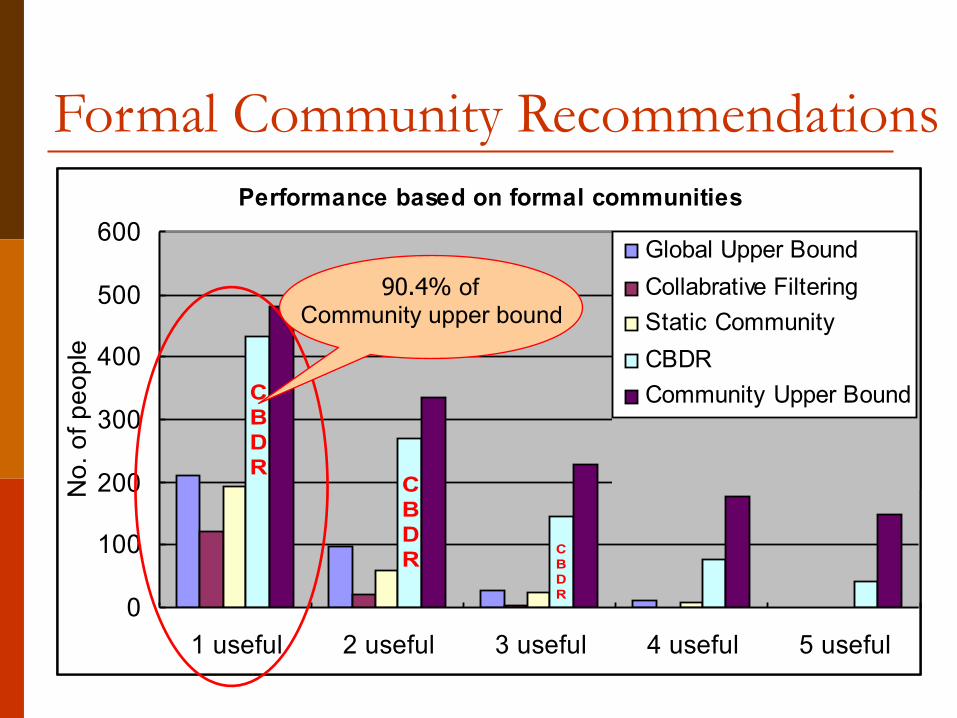
Formal Community RecommendationsPerformance based on formal communities
0
100
200
300
400
500
600
1 useful 2 useful 3 useful 4 useful 5 useful
No.
of p
eopl
e
Global Upper BoundCollabrative FilteringStatic CommunityCBDRCommunity Upper BoundC
BDR
CBDR
CBDR
Performance based on formal communities
0
100
200
300
400
500
600
1 useful 2 useful 3 useful 4 useful 5 useful
No.
of p
eopl
e
Global Upper BoundCollabrative FilteringStatic CommunityCBDRCommunity Upper BoundC
BDR
CBDR
CBDR
90.4% of Community upper bound
65
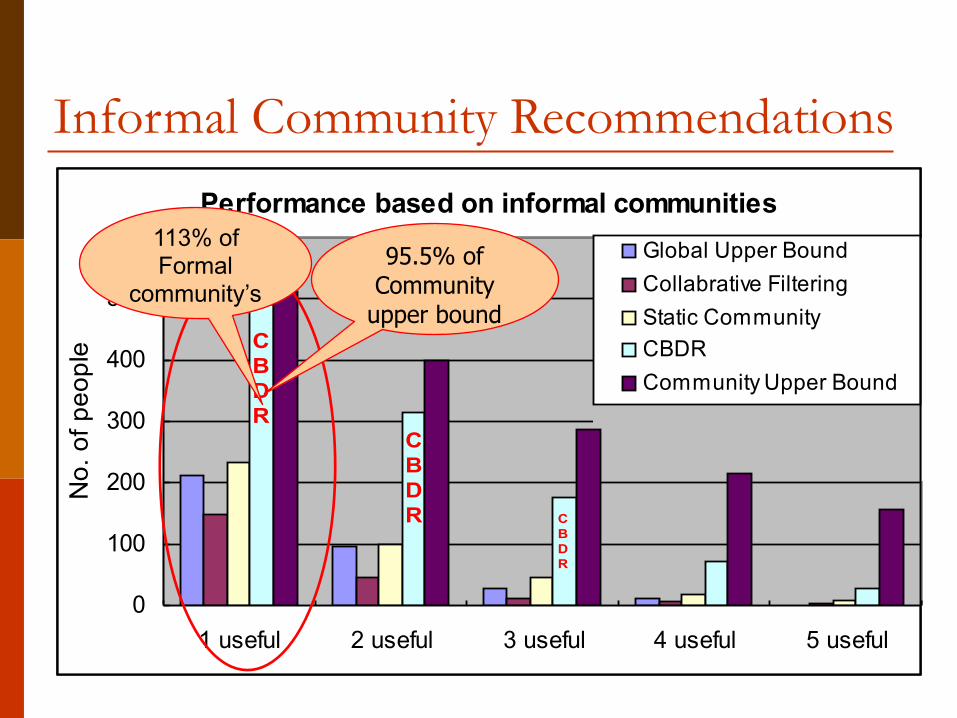
Performance based on informal communities
0
100
200
300
400
500
600
1 useful 2 useful 3 useful 4 useful 5 useful
No.
of p
eopl
e
Global Upper BoundCollabrative FilteringStatic CommunityCBDRCommunity Upper Bound
CBDR
CBDR C
BDR
Performance based on informal communities
0
100
200
300
400
500
600
1 useful 2 useful 3 useful 4 useful 5 useful
No.
of p
eopl
e
Global Upper BoundCollabrative FilteringStatic CommunityCBDRCommunity Upper Bound
CBDR
CBDR C
BDR
Informal Community Recommendations
113% of Formal
community’s95.5% of
Community upper bound
66
Outlinep Introduction and Background p Exploiting Dynamic Patterns for
Recommendation Systems ■ Community based Dynamic Recommendation
[Song et al. SDM’06] ■ Personalized Recommendation Driven by
Information Flow [Song et al. submitted to SIGIR’06]
p Other Related Work p Conclusions

67
In E-Commerce: Rogers’ Diffusion of Innovations Theory
0
10
20
30
40
Innovators Early adopters Early majority Late majority Laggards
16
3434
14
3
Users’ adoption patterns: Some users tend to adopt innovations earlier than others à Information virtually flows from early adopters to late adopters

68
Innovator
People with similar tastes
Early adopter
Early majorityLate majority
Laggard
Innovator
People with similar tastes
Early adopter
Early majorityLate majority
Laggard
Recommendation Driven by Information Flow
Influence is not symmetric!
adopt
adopt
?
adopt??
69
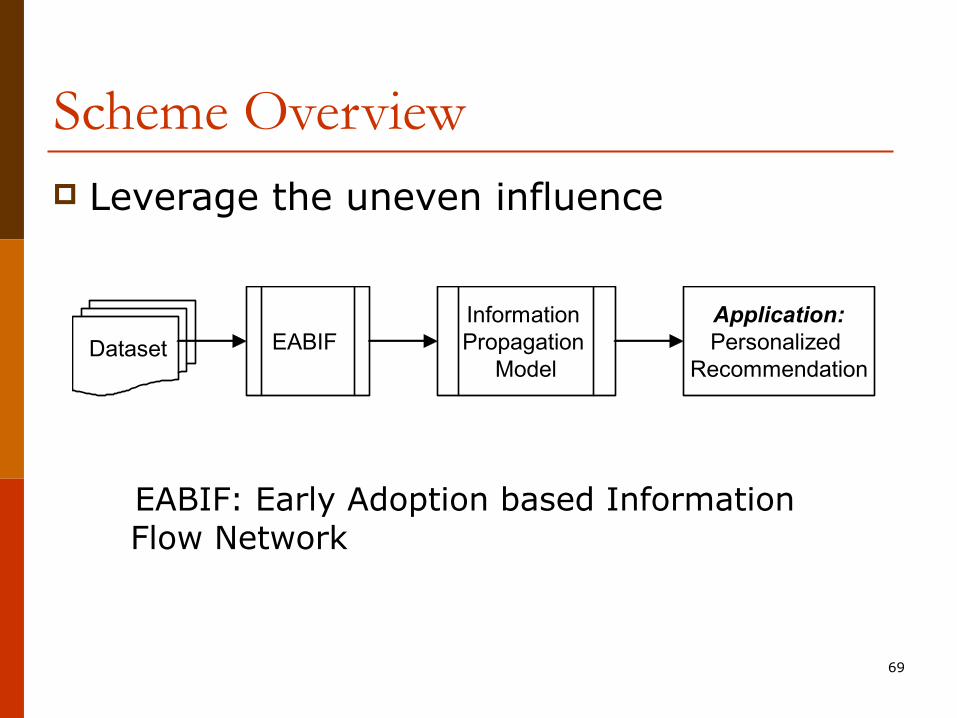
Scheme Overviewp Leverage the uneven influence
EABIF: Early Adoption based Information Flow Network
Dataset EABIF Information Propagation
Model
Application:Personalized
Recommendation

70
EABIF (1) -- Markov Chainp A Markov chain has two components
■ A network structure where each node is called a state ■ A transition probability of traversing a link given that the chain is
in a state (P: transition probability matrix) p A stationary distribution is a probability distribution q such
that q = qP à how likely you will stay at one node
p Application -- PageRank [Brin and Page ‘98] ■ Assumption: A link from page A to page B is a recommendation
of page B by the author of A à Quality of a page is related to
p Number of pages linking to it p The quality of pages linking to it
■ Assume the web is a Markov chain p PageRank = stationary distribution of this Markov chain
i jPij
C
A B

71
EABIF (2)p Early Adoption Matrix (EAB)
■ Count how many items one user accesses earlier than the other – pairwise comparison
p Markov Chain Model ■ Normalize EAB to a transition matrix F of a
Markov chain ■ Adjustment F to guarantee the existence of
stationary distribution of the Markov chain p Make the matrix stochastic p Make the Markov chain irreducible
1ijjF =∑
0, 1 ,ijF i j N≠ ≤ ≤

72
v u
r1
r2 r3…
v u
r1
r2 r3
v u
r1
r2 r3…
Information Propagation Models1. Summation of various
propagation steps
2. Direct summation
3. Exponential weighted summation
( ) ( ) ( ) ( )( )
( )2 1
(exp)1 1
exp2! 1 !
N
if Nβ β β β
−# $= + + + + ⋅ −& '& '−( )
F F F F! !
( )( )1( )
N
if d
−⋅ −=
−
F I FF
I F
( )( ) ( )( )2 m
if m m= + + +F F F F!
N: number of the nodes

73
Topic-Sensitive Early Adoption Based Information Flow (TEABIF) Network
p Adoption is typically category specific ■ An early adopter of fashion may not be an early adopter of
technology
TOPIC 1
TOPIC 3
TOPIC 2
LDA
TOPIC 1
TOPIC 3
TOPIC 2
Application: Personalized
Recommendation

74
Experimental Setupp ER dataset
■ 2004 Apr. to 2005 Apr. as training data ■ 2005 May to 2005 Jul. as test data
p 1033 users, 586 documents p Process
■ Construct information flow network based on the training data
■ Trigger earliest users to start the process ■ Predict who will be also interested in these
documents p Evaluation
■ Precision & Recall
75
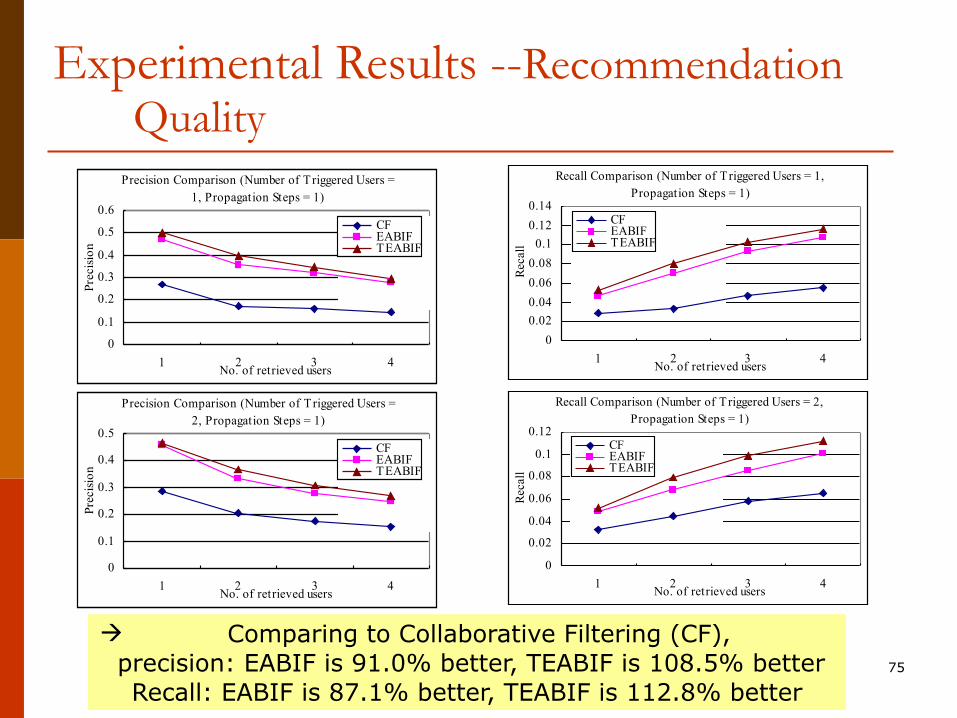
Experimental Results --Recommendation Quality
Precision Comparison (Number of Triggered Users =1, Propagation Steps = 1)
0
0.1
0.2
0.3
0.4
0.5
0.6
1 2 3 4No. of retrieved users
Prec
isio
n
CFEABIFTEABIF
Recall Comparison (Number of Triggered Users = 1,Propagation Steps = 1)
00.020.040.060.08
0.10.120.14
1 2 3 4No. of retrieved users
Rec
all
CFEABIFTEABIF
Precision Comparison (Number of Triggered Users =2, Propagation Steps = 1)
0
0.1
0.2
0.3
0.4
0.5
1 2 3 4No. of retrieved users
Prec
isio
n
CFEABIFTEABIF
Recall Comparison (Number of Triggered Users = 2,Propagation Steps = 1)
0
0.02
0.04
0.06
0.08
0.1
0.12
1 2 3 4No. of retrieved users
Rec
all
CFEABIFTEABIF
à Comparing to Collaborative Filtering (CF), precision: EABIF is 91.0% better, TEABIF is 108.5% better
Recall: EABIF is 87.1% better, TEABIF is 112.8% better

76
Experimental Results -- Propagation Performance
Precision Improvement Comparison (Number of triggeredusers = 1, Baseline: CF)
00.20.40.60.8
11.21.41.6
m =
1
m =
2
m =
3
m =
4
m =
5
sum
exp(β=
1)
exp(β=
1.5
)
exp(β=
2)
exp(β=
3)
exp(β=
4)
exp(β=
5)
exp(β=
8)
exp(β=
16)
Rat
io (
x100
%)
EABIFTEABIF
Recall Improvement Comparison (Number of triggeredusers = 1, Baseline: CF)
00.20.40.60.8
11.21.4
m =
1
m =
2
m =
3
m =
4
m =
5
sum
exp(β=
1)
exp(β=
1.5
)
exp(β=
2)
exp(β=
3)
exp(β=
4)
exp(β=
5)
exp(β=
8)
exp(β=
16)
Rat
io (
x100
%)
EABIFTEABIF
Precision Improvement Comparison (Number of triggeredusers = 2, Baseline: CF)
00.10.20.30.40.50.60.70.8
m =
1
m =
2
m =
3
m =
4
m =
5
sum
exp(β=
1)
exp(β=
1.5
)
exp(β=
2)
exp(β=
3)
exp(β=
4)
exp(β=
5)
exp(β=
8)
exp(β=
16)
Rat
io (
x100
%)
EABIFTEABIF
Recall Improvement Comparison (Number of triggered users= 2, Baseline: CF)
00.10.20.30.40.50.60.70.8
m =
1
m =
2
m =
3
m =
4
m =
5
sum
exp(β=
1)
exp(β=
1.5
)
exp(β=
2)
exp(β=
3)
exp(β=
4)
exp(β=
5)
exp(β=
8)
exp(β=
16)
Rat
io (
x100
%)
EABIFTEABIF
à TEABIF with exponential weighted summation ( ) achieves the best performance:
improves 108.5% on precision and 116.9% on recall comparing to CF
3β =
77
Summaryp Exploit dynamic patterns including
■ Leverage dynamic patterns from both documents and users’ perspective
p Analyzing documents accessing types p Predicting documents’ expiration date p Detecting users’ intentions p Identifying users interests evolving over time – CTC model p Ranking the documents adaptively – Time-sensitive Adaboost
■ Utilize users’ adoption patterns p Information virtually flows from early adopters to late adopters
p Experimental results demonstrate ■ Dynamic factors are important for recommendations

78
p X. Song, C.-Y. Lin, B. L. Tseng, and M.-T. Sun, “Modeling Evolutionary Behaviors for Community-based Dynamic Recommendation,” SIAM Conf. on Data Mining, Bethesda, MD, Apr. 2006.
p X. Song, C.-Y. Lin, B. L. Tseng, and M.-T. Sun, “Personalized Recommendation Driven by Information Flow,” ACM SIGIR, Aug. 2006.
p X. Song, C.-Y. Lin, B. L. Tseng and M.-T. Sun, “Modeling and Predicting Personal Information Dissemination Behavior,” ACM SIGKDD International Conference on Knowledge Discovery and Data Mining, Aug. 2005.
p X. Song, B. L. Tseng, C.-Y. Lin, and M.-T. Sun, "ExpertiseNet: Relational and Evolutionary Expert Modeling," International Conference on User Modeling, Edinburgh, UK, Jul. 24-30, 2005.
Selected Publications