Embed Size (px)
Citation preview
弘前大学大学院
地域社会研究科
年 報第 9号
Regional Studies
2012
Regional StudiesDoctoral Course
Graduate School of Hirosaki University
弘前大学大学院地域社会研究科
2012年12月
ISSN 1349-8282
執筆者紹介
編集委員会
児 玉 忠(委員長)森 樹 男黄 孝 春山 田 厳 子藤 田 昇 治大 坪 正 一
弘前大学大学院地域社会研究科年 報第9号
弘前大学大学院地域社会研究科
2012年12月
平成25年3月20日印刷平成25年3月28日発行
編集兼発行者
弘前市文京町3番地電話 0172-36-2111(大代表)
印刷所 やまと印刷株式会社住 所 弘前市神田4-4-5電 話 0172-34-4111
論 文
[在学者] 徐 小淑:弘前大学大学院地域社会研究科(後期博士課程)地域政策研究講座 在学中
[論文博士] 野崎 道哉:平成21年3月 博士(学術)取得(弘前大学大学院地域社会研究科) 公益財団法人中部圏社会経済研究所研究員
論 文
[在学者]
編集委員会
論文
地方大学における産学連携ポリシーの試み:地域イノベーション創出共同体形成事業の評価と展望
野 崎 道 哉 ………… 3
内生的な経済・産業発展を目指す地方地域-競争と協働の精神と公的大学の役割-
清 剛 治 ………… 15
先端科学技術を支える新しい技術職員/組織への期待-「技術職員の産学官連携とのかかわり」全国アンケート調査によせて-
清 剛 治 ………… 33
高齢者の介護予防活動のあり方の検討 -A県一地区の悉皆調査から- 福 岡 裕美子 ………… 55
機械設備の更新投資と生産性 嶋 恵 一 ………… 69
不確実性と設備投資 嶋 恵 一 ………… 83
戦後青森県産りんごにおける輸出構造の形成とその要因について 黄 孝 春/成 田 拓 未/Carpenter Victor Lee ………… 95
論文(縦書き)
世界遺産白神山地における森林資源の歴史的活用 -流木山を中心に- 長谷川 成 一 ………… 194
研究ノート
イザベラ・バードの生前に出版されたUnbeaten Tracks in Japanの4種の版における違い―― 思考・行動の変化を反映した改訂 ―― 高 畑 美代子 ………… 115
研究科日誌(2009年10月~2010年9月) ………… 149
弘前大学大学院地域社会研究科 年報投稿要領 ………… 155
弘前大学大学院地域社会研究科 年報執筆要領 ………… 156
目 次
論文
中国高等学校社会系教科『思想政治』における経済教育─社会主義市場経済下の経済認識と経済的価値観の統一的育成─ 徐 小 淑 ………… 3
The Analytical Survey and Empirical Study of Economic Impact of the Natural Disasters: Input-Output framework 野 崎 道 哉 ………… 23
研究科日誌(2011年10月~2012年9月) ………… 43
弘前大学大学院地域社会研究科 年報投稿要領 ………… 45
弘前大学大学院地域社会研究科 年報執筆要領 ………… 46

論 文
− 3 −
中国高等学校社会系教科『思想政治』における経済教育― 社会主義市場経済下の経済認識と経済的価値観の統一的育成 ―
徐 小 淑※
※ 弘前大学大学院地域社会研究科 地域政策研究講座
要旨:現代中国の高等学校社会系教科を分析することによって、中国経済教育の構成原理が社会主義市場
経済下での経済認識と経済的価値観の統一的育成を図ることにあることを論じた。具体的には、高等学校社会系教科『思想政治』を分析することによって、目標・内容・方法を明らかにした。経済教育に関連する 3 科目のうち、必修『経済生活』は、現在の社会生活に関連した市場経済に関する概念・理念の理解を図り、社会主義市場経済の課題を社会主義的理想で乗り越えようとする経済生活・理念理解学習である。選択科目『経済学常識』では、経済思想的、経済史的に古典派、マルクス、ケインズ経済学と社会主義市場経済に関連する理論の習得を図ることによって、社会主義市場経済の拡充発展を探究する課題解決的経済思想史学習である。さらに、選択『公民道徳と倫理常識』では、社会主義市場経済下での経済問題(格差、生命、環境)を扱うことによって、市場理念と中国独自の社会主義制度・理念の追求によって均衡ある道徳的主体の形成を図る経済理念追求学習である。以上の 3 科目を通した『思想政治』の構成原理は、市場経済の概念や理論を習得させる一方で、社会主義イデオロギーを通した倫理・道徳の教化を図る、知性と徳性の統一的育成にある。すなわち、経済認識と経済的価値観の統一的育成である。
キーワード:『思想政治』、経済認識、経済的価値観、社会主義市場経済、倫理・道徳
Economic education in social studies subject “Thoughts and Political science”for senior high school in China
Xiaoshu XU
Abstract:This study concluded a structural principle of Chinese economic education is integrated
developing of economic cognition and values under Socialist Market Economy in order to analyze modern Chinese social studies for senior high.
Students acquire economic concepts and theories with regard to market economy based on microeconomics and macroeconomics in compulsory subject “Economic Life”. Elective subject “Common Knowledge of Economics” aimed a formation of economic cognition through learning classical economics, Marxian economics, and market theories.
On the other hand, Elective subject “Moral Civics and Common Knowledge of Ethics” and compulsory subject “Economic Life” have ideologies that Chinese original socialism system will solve gaps between locals and urban area from limits and contradictions of market economy. Both
弘前大学大学院地域社会研究科年報 第 9 号
− 4 −
subjects have characteristics for integrated fostering of the intellect and virtue by dealing with ethics and moral relating market economy and socialism.
These are the relation of complement. Chinese economic education is inconsistent between Marxian economics and market economy, and Socialist Market Economy and modern economics.
Keywords: Chinese economic education, Socialist Market Economy, integrated developing of economic cognition and values
Ⅰ はじめに
本稿の目的は、中国の高等学校社会系教科を分析することによって中国経済教育の構成原理を導出し、その課題を明らかにすることである。
中国の経済教育を論じるにあたって、社会主義市場経済への移行と、それに対応した教育課程改革を確認しなくてはならない。
中国の社会主義市場経済は、社会主義と結合して、国のマクロ調整の下で市場に資源配分の基礎的役割を持たせる制度である 1。1978年以来の改革開放政策によってもたらされ、2001年の WTO加盟後、経済の規制緩和、経済構造の改革、グローバル化の進展によって、多様な商品とサービスがあふれ、価格は自由競争により柔軟に変動するようになった。個人は、それぞれの持つ資源(時間、資金、労働など)を有効に使い、職業を選択し、同時に消費者として様々な商品やサービスを選択できるようになった。
こうした時代の変化に応じて、教育課程も改革されてきた。1990年代から、児童・生徒の個性を伸ばし、特に「創造能力」と「実践能力」の育成に重点をおく「資質教育」2 の理念が提唱され、その理念に基づき、1992年以降、小学校 3-6 年に『社会』が新設され 3、2001年に教育部が制定した『基礎教育改革綱要(試用)』による教科再編、課程標準 4 の提示により、総合的教科としての社会系教科は質的に変容した。小学校 3-6 年に『品徳と社会』、中学校 1-3 年に『歴史と社会』と『思想品徳』、高等学校に『思想政治』を設定した。
これらの経緯、編成・内容原理などは、すでに蔡 5 をはじめとした研究がある。しかし、経済教育に関する分析は不十分であり、その目標・内容・方法に亘っての分析・位置付けが必要である。特に、高等学校に関しては管見の限り社会系教科はもちろんのこと、経済教育の分析すら確認できない。
もちろん、社会主義市場経済以降の中国経済教育では、全米経済教育協議会(NCEE)やジャンプ・スタート等のプログラムが紹介され、理論研究も始められている 6。しかし、それらは海外の経済教育分析であり、中国の経済教育の現状や原理の分析ではない。一方これまでの日本における中国社会科教育に関する研究は、先に挙げた蔡の先進的な分析を含め、教科書づくり、カリキュラム、教科の内容構成・分析・検討等 7 で成果をあげてきたが、社会主義市場経済に対応した経済教育に焦点をあてたものはない。
考察は、次の通りに進める。はじめに、中国の社会系教科の経済に関する全体像を概観する。次に、高等学校社会系教科『思想政治』の中の必修科目『経済生活』、選択科目『経済学常識』及び『公民道徳と倫理常識』を対象として経済教育の観点から分析し、さらに教科書の具体的な展開を示すことにより、経済教育の構成原理を導出する。
Ⅱ 中国の社会系教科における経済教育の全体像1 中国社会系教科の公民的資質と経済教育
現在の中国社会系教科は、2001年の『基礎教育課程改革綱要(試用)』8 によって基礎付けられた。
中国高等学校社会系教科『思想政治』における経済教育
− 5 −
小学校 1-2 学年の『品徳と生活』、3-6 学年の『品徳と社会』、中学校では『思想品徳』と『歴史と社会』、高等学校では『思想政治』、『歴史』、『地理』が設置されている。小、中学校は、道徳を含む総合的な教科であり、高等学校は分科課程を主として、必修科目と選択科目が設置されている。
主なねらいは、全国民の資質を高め、子どもの自主性、個性や創造精神と実践能力を育成し、生涯学習のための基礎を定めることである 9。このねらいに基づいて、急激な市場経済化の下で、社会生活に責任感を持って、自ら考え、行動しようとする公民を育成する公民教育(citizenship education)10
と公民的資質が目標として重視されている。中国の公民的資質を、蔡は次のように整理する11。すなわち、公民知識、公民能力、公民意識から
なり、「知識」は、民主的国家における責任感を持ったよき公民が身につけるべき基本概念や情報であり、「能力」は、国家や政府を理解し評価する能力、実践に必要な能力、社会の公共政策に参加する能力であり、「意識」は、民主的国家や社会を認識し、維持し、改善するのに必要な態度や価値観等である。この公民意識に、国家意識、法律意識、民主意識、公徳意識、環境意識が含まれているものの、経済との関連は不明である。そこで、中国の学習指導要領にあたる課程標準を分析することにより、その目標・内容に亘る関連を確認する。
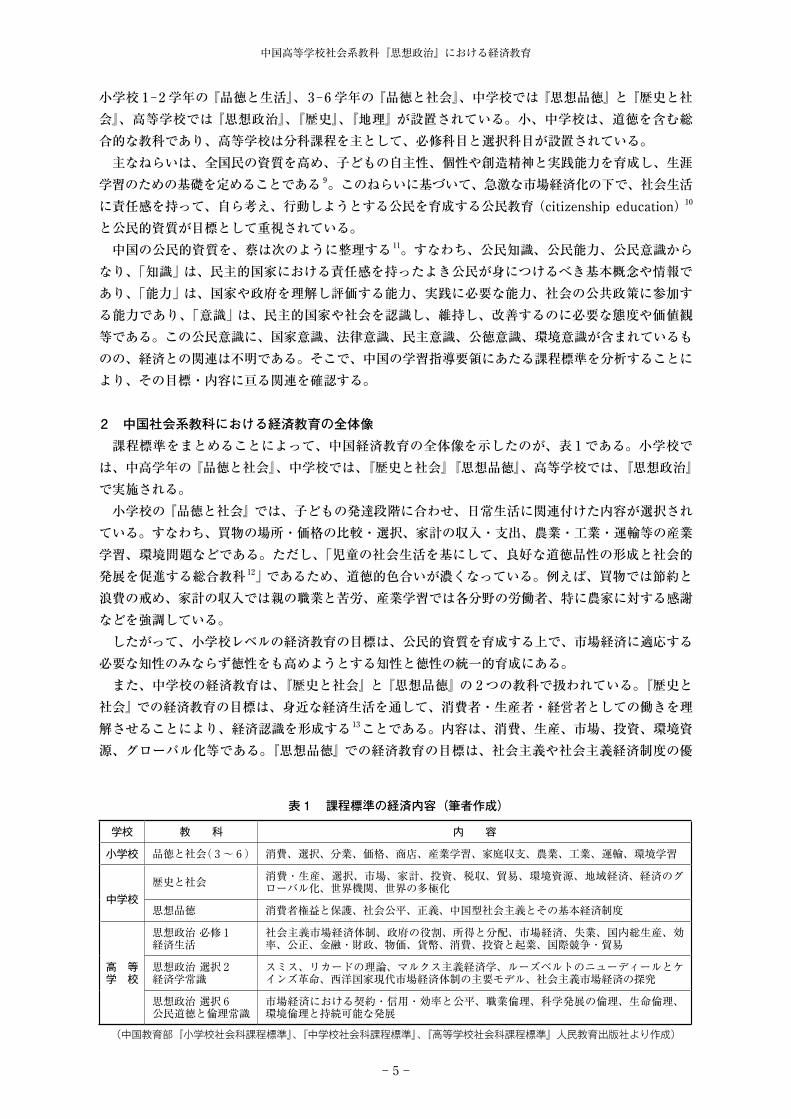
2 中国社会系教科における経済教育の全体像課程標準をまとめることによって、中国経済教育の全体像を示したのが、表 1 である。小学校で
は、中高学年の『品徳と社会』、中学校では、『歴史と社会』『思想品徳』、高等学校では、『思想政治』で実施される。
小学校の『品徳と社会』では、子どもの発達段階に合わせ、日常生活に関連付けた内容が選択されている。すなわち、買物の場所・価格の比較・選択、家計の収入・支出、農業・工業・運輸等の産業学習、環境問題などである。ただし、「児童の社会生活を基にして、良好な道徳品性の形成と社会的発展を促進する総合教科12」であるため、道徳的色合いが濃くなっている。例えば、買物では節約と浪費の戒め、家計の収入では親の職業と苦労、産業学習では各分野の労働者、特に農家に対する感謝などを強調している。
したがって、小学校レベルの経済教育の目標は、公民的資質を育成する上で、市場経済に適応する必要な知性のみならず徳性をも高めようとする知性と徳性の統一的育成にある。
また、中学校の経済教育は、『歴史と社会』と『思想品徳』の 2 つの教科で扱われている。『歴史と社会』での経済教育の目標は、身近な経済生活を通して、消費者・生産者・経営者としての働きを理解させることにより、経済認識を形成する13ことである。内容は、消費、生産、市場、投資、環境資源、グローバル化等である。『思想品徳』での経済教育の目標は、社会主義や社会主義経済制度の優
表 1 課程標準の経済内容(筆者作成)
学校 教 科 内 容
小学校 品徳と社会( 3~ 6) 消費、選択、分業、価格、商店、産業学習、家庭収支、農業、工業、運輸、環境学習
中学校歴史と社会 消費・生産、選択、市場、家計、投資、税収、貿易、環境資源、地域経済、経済のグ
ローバル化、世界機関、世界の多極化
思想品徳 消費者権益と保護、社会公平、正義、中国型社会主義とその基本経済制度
高 等学 校
思想政治必修 1経済生活
社会主義市場経済体制、政府の役割、所得と分配、市場経済、失業、国内総生産、効率、公正、金融・財政、物価、貨幣、消費、投資と起業、国際競争・貿易
思想政治選択 2経済学常識
スミス、リカードの理論、マルクス主義経済学、ルーズベルトのニューディールとケインズ革命、西洋国家現代市場経済体制の主要モデル、社会主義市場経済の探究
思想政治選択 6公民道徳と倫理常識
市場経済における契約・信用・効率と公平、職業倫理、科学発展の倫理、生命倫理、環境倫理と持続可能な発展
(中国教育部『小学校社会科課程標準』、『中学校社会科課程標準』、『高等学校社会科課程標準』人民教育出版社より作成)
弘前大学大学院地域社会研究科年報 第 9 号
− 6 −
越性を理解し、市場経済での格差等の矛盾に対して、正義や理想を求め乗り越える徳性と知性を育成することである。内容は、社会主義市場経済体制下の社会経済の変化や経済事象を関連付け、経済発展のための国策の意義、不均衡問題と解決策などである。
高等学校の経済教育は、『思想政治』で扱われ、必修科目の『経済生活』と選択科目の『経済学常識』『公民道徳と倫理常識』で展開される。経済教育の目標は、社会主義市場経済とその経済事象を認識し、必要な知識と技能を獲得するとともに、積極的なチャレンジ精神、科学的発展観を培うことである。経済教育内容は、必修科目『経済生活』では、社会主義市場経済体制とミクロ経済・マクロ経済の基本概念、国際経済とパーソナル・ファイナンスである。ただし、倫理的側面も強調され、
「金銭万能主義」、「勤倹節約の時代的意義」、「社会主義市場経済の優越性」、「所得分配に関する効率と公平の原則」等についての討論が組み込まれ、経済問題を通した倫理的課題が扱われている。また、選択科目の『経済学常識』では、古典派、マルクス、ケインズ、社会主義市場経済の理論が扱われている。同じく選択科目の『公民道徳と倫理常識』には、現代的課題、社会問題として、「契約・信用」、「効率と公平」、「環境問題下の経済倫理」、「生命倫理(遺伝子・試験管ベビー、臓器移植・売買等)」の内容も盛込まれている。したがって社会主義市場経済下での経済概念・経済知識・経済倫理を習得した上で、現代的社会経済問題を扱い、思想的・倫理的成長を促している。
以上の学校段階での全体像をまとめると、小学校段階では日常の経済生活に関する理解・適応と道徳的価値観形成、中学校段階では社会機能的な経済主体認識と社会問題への批判的・倫理的価値観形成、高等学校段階では社会主義市場経済に関連する科学的経済認識形成と社会主義イデオロギーの教化による思想的・倫理的価値観形成となっている。
3 中国社会系教科における経済教育の特質以上、社会系教科全体の経済教育目標・内容を概観した。その特質を 3 点にまとめる。第 1 に、経済教育の目標は、社会主義市場経済の経済学的知識の習得
と、矛盾を乗り越える徳性を兼ね備えた自立した公民を育成することである。第 2 に、内容は、日常の経済生活、社会機能的な経済主体、パーソナル・ファイナンス、ミクロ・マクロ経済、国際経済、環境経済等から構成され、かつ社会主義市場経済体制を強調する点に独自性がある。第 3 に、小、中、高に一貫して道徳的倫理的扱いがなされ、社会経済上の課題解決のために、知識のみならず、共同の理想、価値観と道徳規範を追求する能力と態度の統一的育成が図られている。
次章以降で、高等学校の社会系教科『思想政治』を分析することによって、高等学校レベルの経済教育の構成原理を明らかにする。
Ⅲ 『思想政治』における経済教育1 経済教育の目標
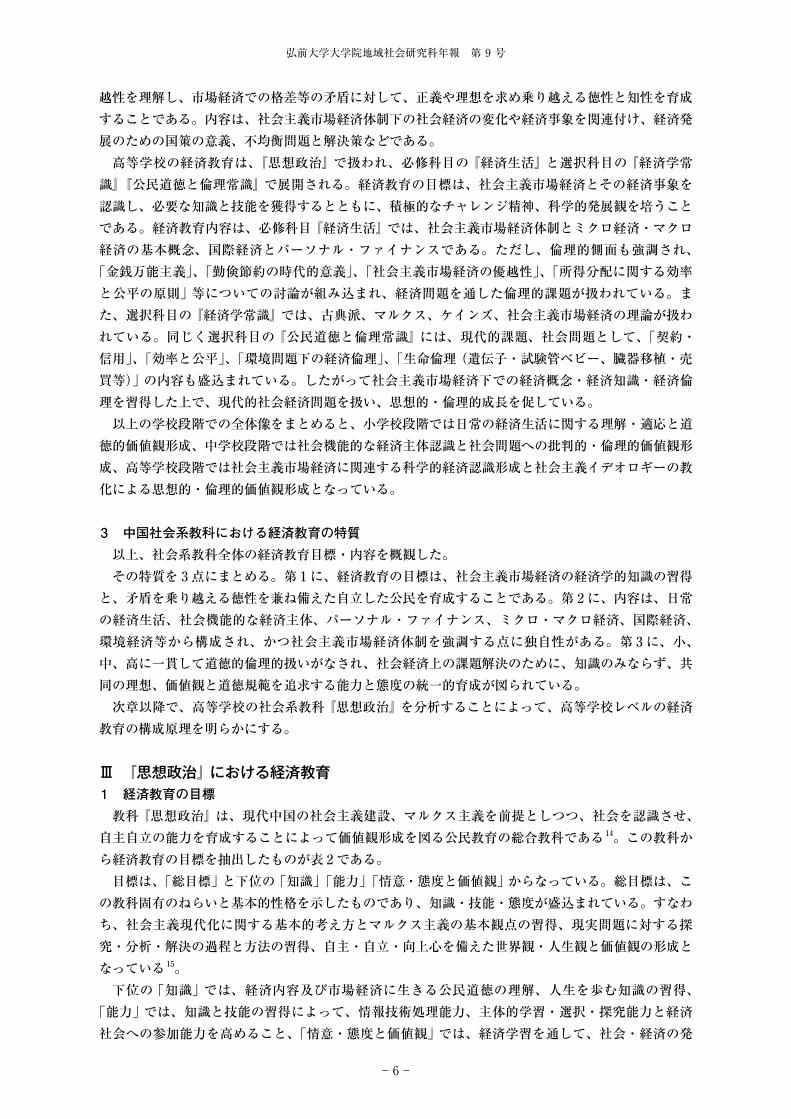
教科『思想政治』は、現代中国の社会主義建設、マルクス主義を前提としつつ、社会を認識させ、自主自立の能力を育成することによって価値観形成を図る公民教育の総合教科である14。この教科から経済教育の目標を抽出したものが表 2 である。
目標は、「総目標」と下位の「知識」「能力」「情意・態度と価値観」からなっている。総目標は、この教科固有のねらいと基本的性格を示したものであり、知識・技能・態度が盛込まれている。すなわち、社会主義現代化に関する基本的考え方とマルクス主義の基本観点の習得、現実問題に対する探究・分析・解決の過程と方法の習得、自主・自立・向上心を備えた世界観・人生観と価値観の形成となっている15。
下位の「知識」では、経済内容及び市場経済に生きる公民道徳の理解、人生を歩む知識の習得、「能力」では、知識と技能の習得によって、情報技術処理能力、主体的学習・選択・探究能力と経済社会への参加能力を高めること、「情意・態度と価値観」では、経済学習を通して、社会・経済の発
中国高等学校社会系教科『思想政治』における経済教育
− 7 −
表 2 『思想政治』の経済教育の目標(筆者作成)
総目標中国型社会主義近代化建設の基本的考え方を理解し、マルクス主義の基本観点と方法を用いて、問題を観察、分析、解決することを学び、現代の社会生活における自主、自立、向上心など能力と態度を備え、愛国主義・集団主義と社会主義思想を持ち、初歩的で正確な世界観、人生観と価値観を形成する。
分類目標
知識・社会主義市場経済、社会主義民主政治、社会主義先進文化を発展させる意義を理解する。・中国の公民道徳確立と法制確立の基本を理解する。・適切に人生発展の道を選択する知識を獲得する。
技能・主体的に経済、政治、文化生活に参加する能力を高める。・社会生活に競争と協力との関係を正確に扱う能力を高める。・将来のために、自主的学習、選択、探究能力を培う。・多様な方法、特に近代情報技術で、社会情報を収集、選別する能力を高める。
情 意態 度価値観
・社会発展に関心を持ち、積極的に社会実践に参加し、誠実・信用を守り、社会責任感と民主法制観念を強め、公民意識を育成する。・集団を愛し、社会奉仕、他人への思いやり、助け合い、団結友愛の精神を養う。・学習・科学を重んじ、真理を追求し、科学的態度と創造・革新の精神を備える。
展に関心を持ち、公徳心・民主意識等の公民意識、科学的態度と創造精神を形成することが、それぞれ目標となっている16。
したがって、目標レベルでは社会主義、マルクス主義を前提とした社会建設を遂行する公民教育であり、近代経済学による経済認識形成が謳われているわけではないことに注意しなくてはならない。
2 教科『思想政治』の科目構成『思想政治』は 4 つの必修科目と 6 つの選択科目からなっている。教科構成は図 1 の通りである。
必修の『経済生活』、『政治生活』、『文化生活』は生活に関連付け、経済、政治、文化の 3 つの主題を扱う。さらに、これらを認識するための世界観と方法論として、マルクス主義哲学常識を主要内容とする『生活と哲学』で 4 科目となる。それぞれ生活主題を基礎として、社会主義物質文明、政治文明、精神文明の調和的な発展に対応した社会主義市場経済、社会主義民主政治、社会主義先進文化の確立に関する基本的な内容が盛込まれている。主に高等学校 1 ~ 2 学年で実施される。また、選択科目として、『社会主義常識』、『経済学常識』、『法律常識』、『公民道徳と倫理常識』がある。
本稿では、経済教育を企図している必修 1 の『経済生活』、選択 2 の『経済学常識』と選択 6 の『公民道徳と倫理常識』を取り上げ、経済教育としての目標・内容・方法について考察する。
Ⅳ 必修1『経済生活』における経済教育1 目標
この科目の目標は、社会主義市場経済の特徴を理解させ、現代経済生活への参加技能を習得させることによって、積極的なチャレンジ精神、科学的発展観念を育成することである 17。したがって、こ
(中華人民共和国教育部『普通高等学校思想政治課程標準(実験)』人民教育出版社2004年、pp.3-4.)
図1 『思想政治』の教科構成(網掛けは経済教育の科目)
思想政治
必修
必修1経済生活
必修2政治生活
必修3文化生活
必修4生活と哲学
選択1科学社会主義常識
選択2経済学常識
選択3国家と国際組織常識
選択4科学思惟常識
選択5生活の中の法律常識
選択6公民道徳と倫理常識
選択
弘前大学大学院地域社会研究科年報 第 9 号
− 8 −
の目標では、現代経済学の市場概念と社会主義理解をベースに、自立した経済主体の形成が目指されているといえる。
教科の総括的目標では明示されていなかった「現代経済学の市場概念」理解が、社会主義市場経済理解のために提示されているのである。
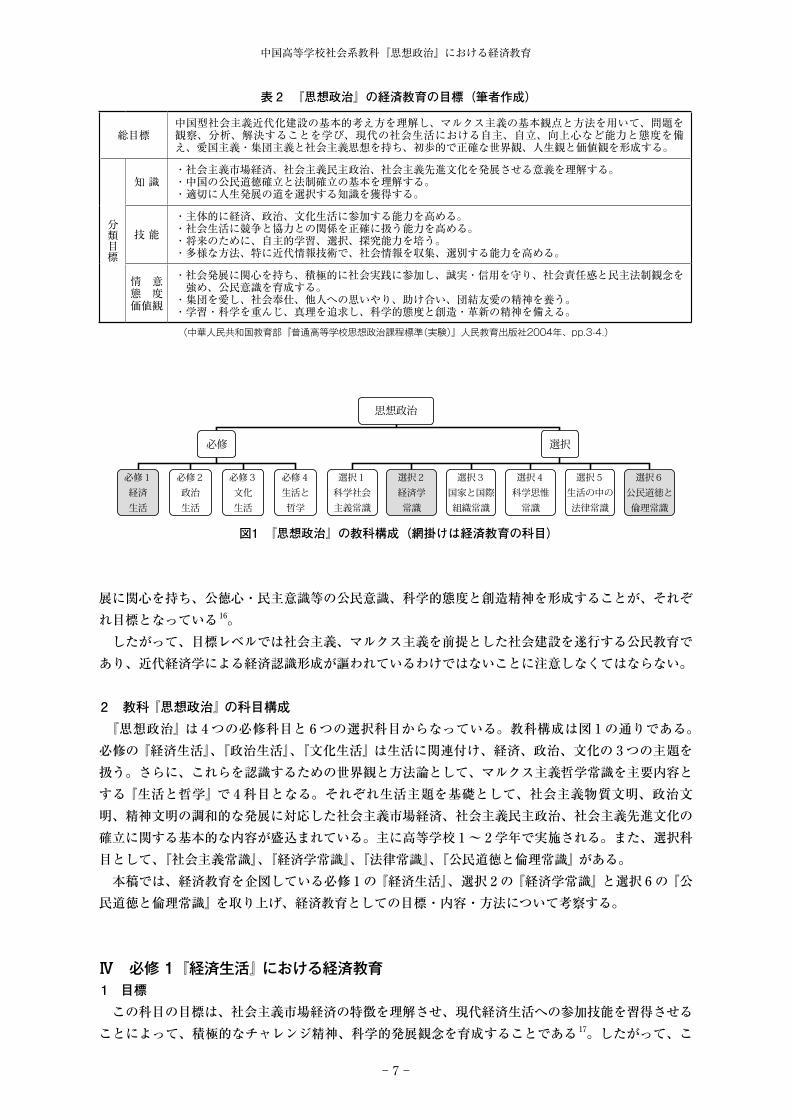
2 内容標準の経済教育内容経済教育に関する具体的な内容を「内容標準」から、表 3 にまとめる。
表 3 『経済生活』の内容標準と経済概念(筆者作成)
(中華人民共和国教育部『普通高等学校思想政治課程標準(実験)』人民教育出版社2004年、pp.5-8. 網掛けは筆者の構成)
項 目 内 容 標 準 分 野 経済概念・価値
生活と消費
貨幣の役割と基本機能
1.1 貨幣の役割と基本機能を習得し、信用決済の手段を説明できる、金銭の現代経済生活における意義を理解する。
基礎的な経済概念 交換、貨幣、金銭観
価格変動の原因と意義
1.2 商品価格を影響する原因を帰納し、価格変動の意義を理解し、商品やサービスの価格変動が私達の生活に対する意義を説明する。
ミクロ経済学
市場と価格、供給と需要、消費者の信頼、生産販売者の努力
消費心理と消費観 1.3 消費心理を知り、消費行為の差異を比較する。消費観念を弁別、分析して、適切な消費観を形成する。
ミクロ経済学
消費、選択、クレジット、消費観、理性
投資と企業
貯蓄と投資2.4 銀行の貯蓄・ローンを理解し、保険・債券・株券の異同を比較して、利潤・利息・株の配当金などリターンを解釈し、異なる投資行為を説明する。
個人金融貯蓄、ローン、債券、株券、投資、利潤、利息、配当金、リスク、リターン、増殖
会社と経営2.5 会社の種類を識別し、その経営と発展状況を説明して鋭意進取、誠実信用の現代経済生活における価値を述べる。
労働経済学会社、経営、破産、吸収合併、コスト、誠実信用、商業詐欺
労働と起業2.6 労働者の権益を守る事例を分析する。就職と起業の方法を列挙して、誠実な労働・法律に従う経営・積極的な起業の観念を形成する。
マクロ経済学
失業、起業、職業、労働者、資質
所得と分配
労働分配3.7 我が国の労働に応ずる分配を主体とし、多種分配を併存する分配制度を理解し、「効率優先、公平配慮」を解析する。
ミクロ、マクロ経済、経済倫理
所得分配、資本、生産要素、経済制度、効率、公平
財政の役割3.8 政府の財政で投資したプロジェクトを議論して、政府の財政支出が国民の生活、経済開発に対する影響と役割を説明する。
マクロ経済学
財政、政府の役割経済開発社会保障
租税と納税の義務3.9 個人の所得税と増値税18等重要な租税を分析し、税収が国の主要な財源であることを知り、納税が公民の基本義務であることを理解する。
マクロ経済学
租税、財政、義務、権利
市場経済に直面する
社会主義市場経済の意義
4.10 市場が資源配分の基礎であるのを説明し、法律と道徳による市場秩序の規範の重要性を分析して、社会主義市場経済を発展させる意義を理解する。
ミクロ経済学、倫理、道徳
市場、資源配分社会主義、市場経済、秩序・規則、信用
社会主義市場経済における政府のマクロ調整
4.11 政府が市場経済における役割を果たす典型的事例を分析し、社会主義市場経済の発展は国のマクロ調整がないと順調にできないことを説明する。
ミクロ経済学、マクロ経済学
市場の失敗、マクロ調整、政府の役割、環境保全
社会主義初級段階の基本経済制度
4.12 実例で公有制を主とする多種類の所有制経済の共同発展の基本的な経済制度が社会主義初級段階という国情に相応しいことを説明する。
社会主義、マルクス経済学
経済制度、公有制、社会主義初級段階
小康社会の目標4.13 小康社会経済確立の目標を描き、科学的発展観19の意味を理解する。全面的小康社会の確立は経済建設を中心とし、社会生産力を解放、発展させるのが最も根本的であることを説明する。
マルクス経済学、マクロ経済学、倫理
国民総生産、生産力、格差、調和、持続可能な発展、
経済のグローバル化と対外開放政策
4.14 WTOの規則を遵守する典型的事例で、経済のグローバル化進展を実感し、対外開放が中国の基本国策であることを理解する。
国際経済学経済グローバル化、多国籍企業、国際競争と協力
中国高等学校社会系教科『思想政治』における経済教育
− 9 −
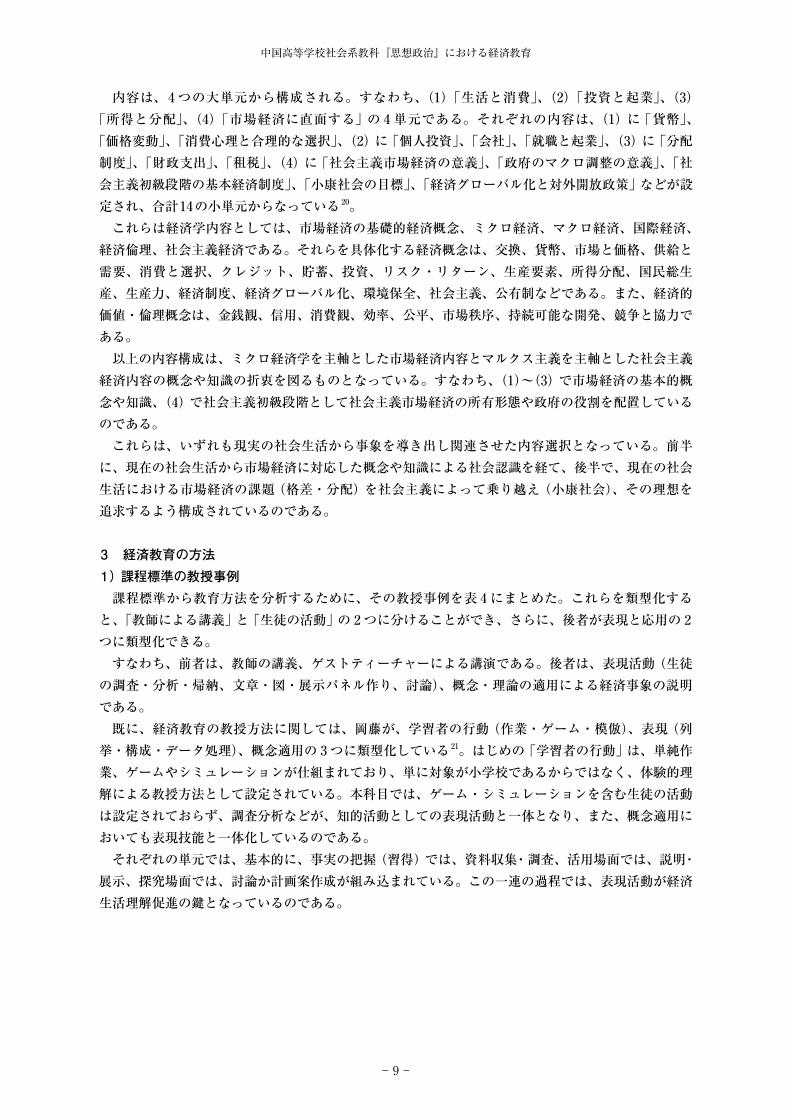
内容は、4 つの大単元から構成される。すなわち、(1)「生活と消費」、(2)「投資と起業」、(3)「所得と分配」、(4)「市場経済に直面する」の 4 単元である。それぞれの内容は、(1)に「貨幣」、「価格変動」、「消費心理と合理的な選択」、(2)に「個人投資」、「会社」、「就職と起業」、(3)に「分配制度」、「財政支出」、「租税」、(4)に「社会主義市場経済の意義」、「政府のマクロ調整の意義」、「社会主義初級段階の基本経済制度」、「小康社会の目標」、「経済グローバル化と対外開放政策」などが設定され、合計14の小単元からなっている20。
これらは経済学内容としては、市場経済の基礎的経済概念、ミクロ経済、マクロ経済、国際経済、経済倫理、社会主義経済である。それらを具体化する経済概念は、交換、貨幣、市場と価格、供給と需要、消費と選択、クレジット、貯蓄、投資、リスク・リターン、生産要素、所得分配、国民総生産、生産力、経済制度、経済グローバル化、環境保全、社会主義、公有制などである。また、経済的価値・倫理概念は、金銭観、信用、消費観、効率、公平、市場秩序、持続可能な開発、競争と協力である。
以上の内容構成は、ミクロ経済学を主軸とした市場経済内容とマルクス主義を主軸とした社会主義経済内容の概念や知識の折衷を図るものとなっている。すなわち、(1)~(3)で市場経済の基本的概念や知識、(4)で社会主義初級段階として社会主義市場経済の所有形態や政府の役割を配置しているのである。
これらは、いずれも現実の社会生活から事象を導き出し関連させた内容選択となっている。前半に、現在の社会生活から市場経済に対応した概念や知識による社会認識を経て、後半で、現在の社会生活における市場経済の課題(格差・分配)を社会主義によって乗り越え(小康社会)、その理想を追求するよう構成されているのである。
3 経済教育の方法1)課程標準の教授事例
課程標準から教育方法を分析するために、その教授事例を表 4 にまとめた。これらを類型化すると、「教師による講義」と「生徒の活動」の 2 つに分けることができ、さらに、後者が表現と応用の 2つに類型化できる。
すなわち、前者は、教師の講義、ゲストティーチャーによる講演である。後者は、表現活動(生徒の調査・分析・帰納、文章・図・展示パネル作り、討論)、概念・理論の適用による経済事象の説明である。
既に、経済教育の教授方法に関しては、岡藤が、学習者の行動(作業・ゲーム・模倣)、表現(列挙・構成・データ処理)、概念適用の 3 つに類型化している21。はじめの「学習者の行動」は、単純作業、ゲームやシミュレーションが仕組まれており、単に対象が小学校であるからではなく、体験的理解による教授方法として設定されている。本科目では、ゲーム・シミュレーションを含む生徒の活動は設定されておらず、調査分析などが、知的活動としての表現活動と一体となり、また、概念適用においても表現技能と一体化しているのである。
それぞれの単元では、基本的に、事実の把握(習得)では、資料収集・調査、活用場面では、説明・展示、探究場面では、討論か計画案作成が組み込まれている。この一連の過程では、表現活動が経済生活理解促進の鍵となっているのである。

弘前大学大学院地域社会研究科年報 第 9 号
− 10 −
表 4 『経済生活』の内容標準と教授活動(筆者作成)
内容標準 教 授 例 示 (網掛けは学習方法の例示)
生活と消費
1.1 貨幣の役割と基本機能
・商品交換に貨幣がないと困ることについて、分析し、貨幣の役割を説明する。・金銀、紙幣、帳簿などの決済を例にして、貨幣の基本機能を帰納する。・小切手、クレジットカード、外貨等の使用場面を示す。・「金銭は万能ですか」について、討論する。
1.2 価格変動の原因と意義
・供給と需要の変化が商品の価格に影響を与えるが、需給関係を影響する誘因は生産、地域、時間、文化などがある。・「街頭広告八面観」を題目に、文章を作る。・「正真正銘」「品物が良く値段が安い」「物は稀であるほど貴重だ」の意味を討論する。
1.3 消費心理と消費観念
・消費心理、例えば衆に従う心理、ブランド、ファッションを追う心理等、消費方式、例えばクレジット消費など。・消費観念の変化と衝突に対して「勤倹節約精神の時代意義」を討論する。・「収入に見合う支出、理性的選択、観念の改変」を主張する意義。
投資と企業
2.4 貯蓄と投資・銀行のローンと貯蓄の計算、保険・債券・株券のリターンとリスク、利潤・利息・株の配当金の発生。・異なる投資行為は価値の増殖を追求する目的であり、リスクも伴う。・模擬で、家庭投資或いはローンで投資経営する計画案を作る。
2.5 会社と経営・図解:株式有限会社と有限責任会社との異同。・会社を登録する基本条件、破産・吸収合併と連合などが会社の発展状況を反映する。・経営に関する表現、例えば管理・科研・開発の重視、コストの削減、銘柄の確立など、または偽造、商業詐欺など。
2.6 労働と起業・ある程度の失業は経済発展の中で、免れないことである。・職業の選択について討論する、「芸は道によって賢し」という考えを理解する。・講演:新型労働者と起業者に備えるべき資質・活動:就職情報を収集し、市場需要を調査して、様々な就職と起業の方式を知る。
所得と分配
3.7 労働分配・労働・資本・技術と管理など生産要素がそれぞれの貢献による分配参与の原則。・どんな要素でも分配に参与すれば、等量の報酬を得るべきかどうかについて討論する。・模擬:ある会社に合理的な分配案を作る。
3.8 政府の役割・政府の財政支出の項目、例えば、文化教育、公共施設、治安、社会保障、重大な基礎施設とプロジェクト、突発の災害への対応など。・国家の経済発展に影響を与える大型建設プロジェクト、或いは国民の日常生活に影響する公共施設について、討論する。
3.9 租税と納税の意義
・個人所得税の所得調節に対する役割。・税収は強制性、無償性と固定性がある。脱税、申告漏れなどは違法行為である。・公民の納税意識は権利の行使と義務の履行という両方の意義がある。
市場経済に直面する
4.10 社会主義市場経済の意義
・市場は何を、どれだけ、いかに生産するかを指示できる。・経済生活における規則の制定と遵守の意義、及び信用の意義について、討論する。・社会主義市場経済は社会主義基本制度と結合して、市場経済の長所も発揮できれば、社会主義制度の優位性も発揮できる。
4.11 社会主義市場経済における政府のマグロ調整の意義
・市場の調節機能は万能ではなく、政府は適切な手段でその欠陥を修正する必要がある。・市場経済は政府の政策による調整、管理、監督が必要である。・グループで、地元の経済発展を主題に、政府の役割、市場開発、環境保全、資源利用、住民生活等を総合的に考えて、合理的発展計画を考案する。
4.12 社会主義初級段階の基本経済制度
・事例を集め、各種類の所有制経済の輪郭と特徴をまとめ、それぞれの役割と特色を討論する。・資料で、我が国は社会主義初級段階、特に小康22社会の発展段階にあるという国情を示す。・展示パネルを設計して、現在経済建設の実例と資料等で、公有制経済の主体的地位を展示する。
4.13 小康社会の目標
・例えば、 1 人当たりの GDPの向上、経済体制・社会保障制度の更なる拡充、都市と農村の格差、地域間の格差などの格差是正を理解する。・全面・調和・持続可能な発展観について、討論する。・工業化・情報化・都市化が人々の生活、行動様式に対する影響を理解する。・図で、情報技術・生物工学技術・航空宇宙技術など現代産業の興起と発展を示す。
4.14 経 済のグローバル化と対外開放政策
・生活に世界各地からの商品や多国籍企業の製品があることによって、市場のグローバル化を実感する。・「引進来、走出去23」の典型的事例をめぐって、いかに積極的に国際競争と協力に参与するかについて、討論する。・正・反両方から、WTOの規則を用いる典型的事例を討論する。
(中華人民共和国教育部『普通高等学校思想政治課程標準(実験)』人民教育出版社2004年、pp.5-8. 網掛けは筆者の構成)
中国高等学校社会系教科『思想政治』における経済教育
− 11 −
2)教科書例示による展開授業レベルで経済教育の教授方法を検討するために、人民教育出版社教科書『経済生活』に基づい
てまとめる。この教科書において教育方法が特徴的に確認できるのは、「総合的探究」の単元である。そもそも、
教科書の構成は、課程標準の 4 つの大単元から構成される。それぞれに「総合的探究」の単元が加えられている。その教授方法を表 5 にまとめた。
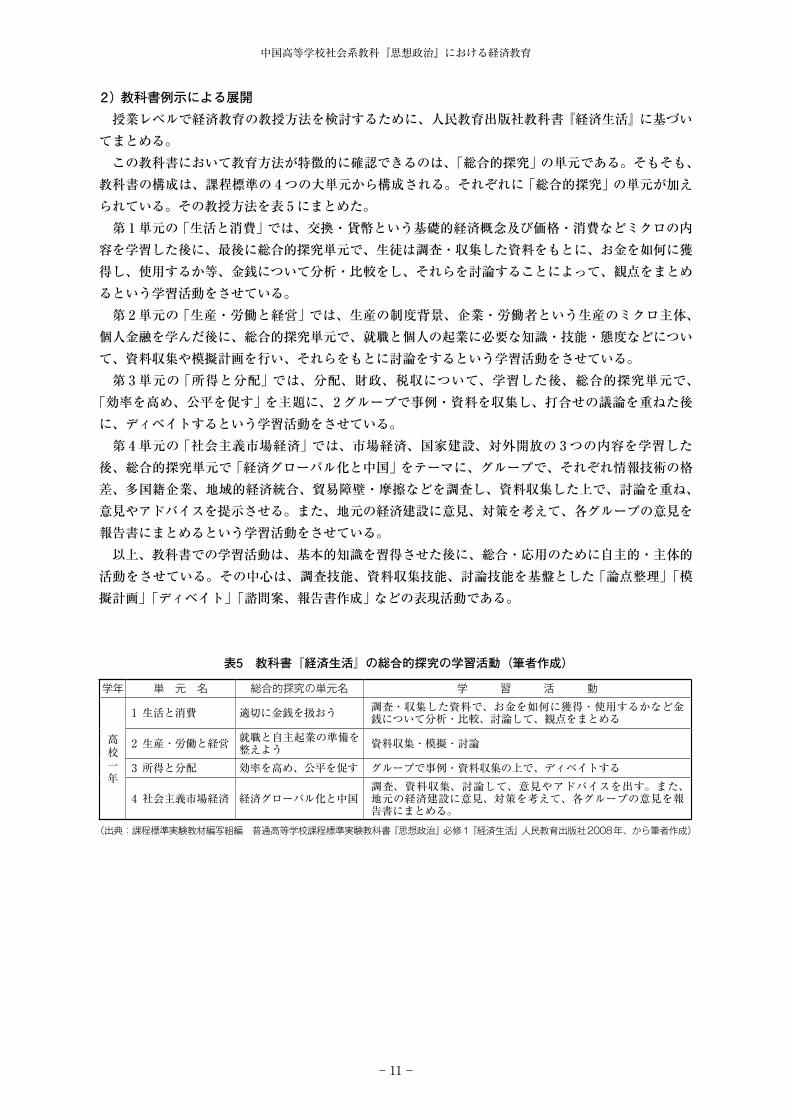
第 1 単元の「生活と消費」では、交換・貨幣という基礎的経済概念及び価格・消費などミクロの内容を学習した後に、最後に総合的探究単元で、生徒は調査・収集した資料をもとに、お金を如何に獲得し、使用するか等、金銭について分析・比較をし、それらを討論することによって、観点をまとめるという学習活動をさせている。
第 2 単元の「生産・労働と経営」では、生産の制度背景、企業・労働者という生産のミクロ主体、個人金融を学んだ後に、総合的探究単元で、就職と個人の起業に必要な知識・技能・態度などについて、資料収集や模擬計画を行い、それらをもとに討論をするという学習活動をさせている。
第 3 単元の「所得と分配」では、分配、財政、税収について、学習した後、総合的探究単元で、「効率を高め、公平を促す」を主題に、2 グループで事例・資料を収集し、打合せの議論を重ねた後に、ディベイトするという学習活動をさせている。
第 4 単元の「社会主義市場経済」では、市場経済、国家建設、対外開放の 3 つの内容を学習した後、総合的探究単元で「経済グローバル化と中国」をテーマに、グループで、それぞれ情報技術の格差、多国籍企業、地域的経済統合、貿易障壁・摩擦などを調査し、資料収集した上で、討論を重ね、意見やアドバイスを提示させる。また、地元の経済建設に意見、対策を考えて、各グループの意見を報告書にまとめるという学習活動をさせている。
以上、教科書での学習活動は、基本的知識を習得させた後に、総合・応用のために自主的・主体的活動をさせている。その中心は、調査技能、資料収集技能、討論技能を基盤とした「論点整理」「模擬計画」「ディベイト」「諮問案、報告書作成」などの表現活動である。
表5 教科書『経済生活』の総合的探究の学習活動(筆者作成)
(出典:課程標準実験教材編写組編 普通高等学校課程標準実験教科書『思想政治』必修1『経済生活』 人民教育出版社2008年、から筆者作成)
学年 単 元 名 総合的探究の単元名 学 習 活 動
高校一年
1 生活と消費 適切に金銭を扱おう 調査・収集した資料で、お金を如何に獲得・使用するかなど金銭について分析・比較、討論して、観点をまとめる
2 生産・労働と経営 就職と自主起業の準備を整えよう 資料収集・模擬・討論
3 所得と分配 効率を高め、公平を促す グループで事例・資料収集の上で、ディベイトする
4 社会主義市場経済 経済グローバル化と中国調査、資料収集、討論して、意見やアドバイスを出す。また、地元の経済建設に意見、対策を考えて、各グループの意見を報告書にまとめる。

弘前大学大学院地域社会研究科年報 第 9 号
− 12 −
3)授業構成―授業展開の方法教師用書をもとに、第 3 単元「所得と分配」の小単元「所得分配と社会公平」をまとめたものが表
6 である。
表 6 「所得分配と社会公平」の授業展開(筆者作成)
(普通高等学校思想政治課課程標準実験教材編写組編著『経済生活教師用書』人民教育出版社2009年より筆者作成)
段階 教師の働きかけ(発問・指示) 生徒の活動、習得させたい知識 資料
導入
ネット上の業界別、職業別、地域別の収入サーチを示す。Q1 ネット上で溢れている収入サーチや議論は、国民の何の関心事を反映しますか。所得の格差をどう考えればいいのか。合理的な所得分配―「オリーブ型」図を見せて、また「我国のジニ係数変化」の表を見せて、説明する。Q2 所得格差が大きいのは何を意味しますか。
○考える
○分配が不公平。
資:①収入サーチの印刷 物 ② 図「合理的収入分配格局-『オリーブ 型』」③表「我が国ジニ係数変化」
資:1996~2009年財政、企業、労働者それぞれの一次分配の割合増加データと説明表:1997年、2007年一次分配の財政、企業、労働者のGDPの占める割合表
図:「 小 故事、大道理」
資:日本の国民所得倍増計画
展開
教科書 p60公平に対する2つの観点を読ませる。Q3 みなさんは公平をどう理解しますか。
本当の公平の導出
Q4 所得分配の公平とは何ですか。 教科書の p60を読ませる。まとめ所得分配の相対的公平、分配公平は平均主義ではない
Q5 なぜ所得分配の公平は必要なのか。まとめ
社会の調和、経済の発展のため
Q6 どう所得分配の公平を実現しますか。改革開放以来の分配制度の変化、所得増加のデータを見せる。まとめ
制度の保障、政策の制定、一次分配と再配分の概念
1996~2009年財政収入、企業所得と国民所得はそれぞれ一次分配を占める割合データを見せるQ7 表から見ると、社会公平を実現する重要な対策は何ですか。まとめ
2つの合理的な割合
教科書 pp61-62を読ませるQ8 では、所得分配の公平のためにどんな政策が実施されていますか
図を読ませる何が増えていますか、何が減っていますか、どんな経済事象を反映しましたか。
効率概念の導出
教科書 p62を読ませる、ケーキの写真を見せるQ9 効率と公平はどんな関係ですか。ケーキを大きくする(効率向上)のが分ける前提です。ケーキを合理的に分ける(公平な分配)のは生産者の積極性とかかわる。効率を基にしない公平は平均主義と貧困をもたらす。まとめ
効率と公平は一致性がある
Q10しかし、効率と公平は異なる側面を強調するので、矛盾もあります、それは何ですか。まとめ
効率と公平は対立性もある
Q11社会主義市場経済下で、なぜ公平と効率の関係を正確に対処するのを特に強調しますか。
Q12如何に効率と公平を対処しますか。教科書 p62を読ませる。まとめ
効率を高めると共に公平を促進する
読む、考える、討論する○格差を否認する絶対な平均も格差が激しいのも公平ではない。格差があり、そしてそれが合理的な範囲であるのは公平です。
○社会メンバーの間の格差が大きすぎてはならない、国民の基本生活需要を保障しなくてはならない。
○所得の格差を完全になくすのではなく、それを合理的な範囲に収める。
○公平の所得分配は社会主義分配原則の体現であり、人の間の経済利益関係を協調するのに役立ちます。
○社会主義分配制度○金を生産者(企業)は製品の再生産や税金、労働者の賃金に回すのが一次分配であり、市場機制によって形成し、税収と法律法規によって調節、規範する。
再分配は租税制度や社会保障制度、公共事業などを通じて所得を移転させることです。
データを読む、考える、答える○国民所得が GDPの占める合理的割合と、労働者の報酬が初次配分の占める合理的な割合を保障する。
○低所得層の所得増加、最低時給レベルアップ、農業税の廃止、農村最低生活保障制度の制定、税収と社会保障制度の拡充、独占禁止法の制定など
図を読む、考える○効率は経済活動で、産出と投入の比率であり、資源の有効的な利用の程度を示す。
読む、答える○効率は公平の物質的前提です。一方公平は経済効率向上の保障です。
○市場経済では、効率を重視すると、格差が生じて、公平が犠牲になる。公平を実現すると、効率が犠牲になる。ある時期に、効率優先の政策をとって経済成長を果たす。
○我が国は人口が多く、一人当たりの資源が乏しい、効率を高めなければならない、一方所得格差が合理的な範囲に収め、労働の質を高めて、発展を果たす。
○一次分配も再分配も効率と公平に配慮する。完全平等主義に反対すると同時に大きな格差防止する。分配政策を貫くと共に、奉仕精神、CSR、思いやりを提唱する。
①本時の目標 ・公平と公平な所得分配の意味、それを実現するための国の取り組みを理解する。 ・効率の意味・公平と効率の関係及び国の対策などを理解する。 ・効率と公平の関係を正確に把握する弁証法的思惟能力を育成する。 ・効率意識、公平精神を培う。②本時の展開
中国高等学校社会系教科『思想政治』における経済教育
− 13 −
学習過程は資料に示された矛盾から学習課題を作り、一連の発問と答え、教師の示した資料の生徒による確認や生徒の話し合いで探究を進め、課題解決を導くものとなっている。
導入では、国民が関心を寄せる所得格差問題、合理的な所得分配、ジニ係数などの資料を比べさせることによって、分配の不公平に問題意識を持たせる。展開部分で、所得分配に関する歴史的データや制度の変化などを教科書記述、資料から説明し、個々の発問をしながら、「効率と公平」の概念を引きだしている。さらに、財政・企業・労働者への分配に関する表とデータを与えて、比較させ、分配の公平を実現する対策を考えさせる。最後にまとめとして、社会主義市場経済下での国情と関連させ、如何に効率と公平を合理的に対処するか、概念を適用させて、均衡を導くと同時に、「奉仕精神、CSR、思いやり」の倫理的結論に収斂させている。
以上から、学習過程は発問と資料(図表や、現在の話題を構成した資料)を教師の説明によって、経済概念と理念の理解を目指す学習過程となっている。
4 小括―その構成原理と特質以上、『経済生活』の経済教育について、目標・内容・方法を分析した。目標は、経済生活を理解するために生活に関連させた経済知識・経済概念の習得を通して、現代社
会に参加する能力を高め、中国型社会主義市場経済を建設する共同理想を培うことである。内容構成は、ミクロ経済、マクロ経済、国際経済、パーソナル・ファイナンスなどのいわゆる近代経済学概念や理論とマルクス経済学と中国型社会主義市場経済の内容から構成されている。現状の経済生活に参加する上での必要な市場経済知識と技能を育成すると共に、格差や分配の課題を社会主義制度の優位性によって乗り越えることが可能となることを理解させることである。方法は、経済概念・理念の習得とそれらによる探究を可能にする様々な表現活動と一体化した学習活動である。
特質は、経済生活の理解・適応と同時に、社会主義市場経済での生活課題を社会主義的理想で乗り越えようとする経済生活・理念理解学習である。
Ⅴ 選択2『経済学常識』における経済教育1 経済教育の目標
本科目は、選択科目であり、必修科目では十分に展開できなかった専門的経済学理論をさらに深めようとするものである。
経済教育の目標は、市場経済の理論を理解し、それらが当時の経済、社会に対して及ぼした影響を分析、評価すると同時に、初歩的経済認識を形成し、マルクス主義経済学理論の本質を把握する一方で、社会主義市場経済の進展過程を理解することを通して、中国型社会主義を建設する理想・信念を培うことである24。
必修科目『経済生活』に比して、さらに専門的な経済学理論を、古典派経済学から毛沢東思想に至るまで経済思想史的に理解させることによって、社会主義市場経済の理解と社会主義の理想を追求させる目標となっている。
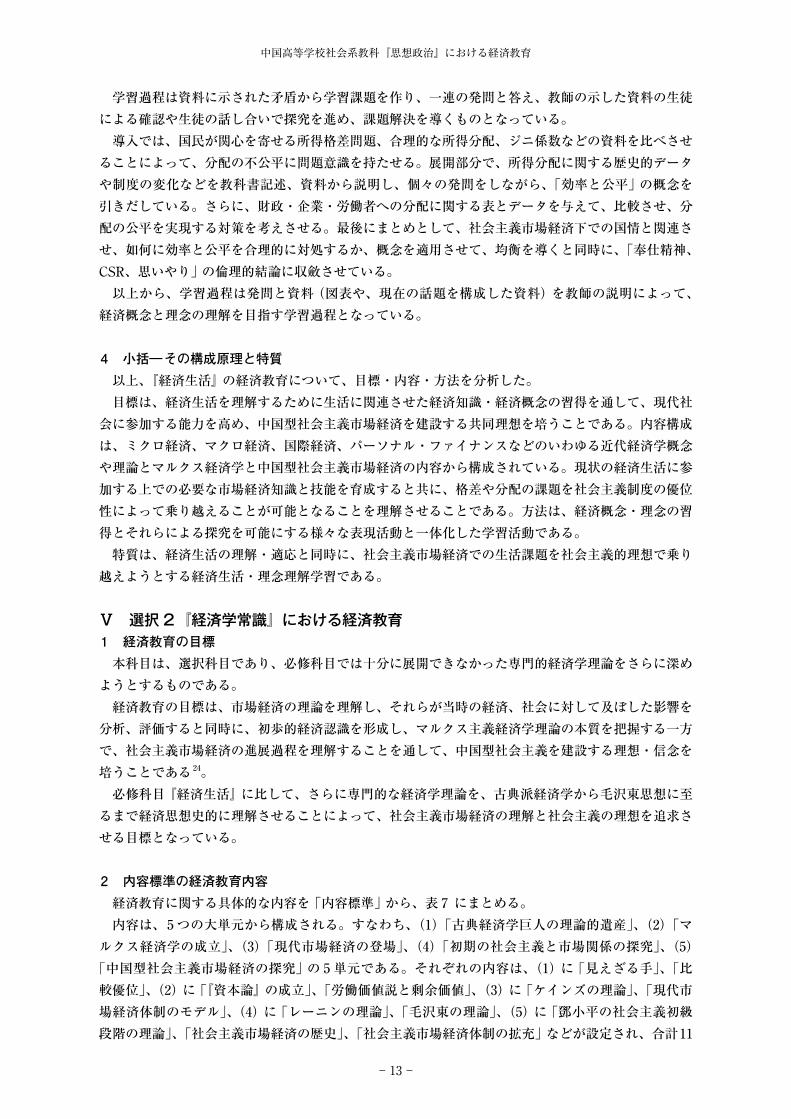
2 内容標準の経済教育内容経済教育に関する具体的な内容を「内容標準」から、表 7 にまとめる。内容は、5 つの大単元から構成される。すなわち、(1)「古典経済学巨人の理論的遺産」、(2)「マ
ルクス経済学の成立」、(3)「現代市場経済の登場」、(4)「初期の社会主義と市場関係の探究」、(5)「中国型社会主義市場経済の探究」の 5 単元である。それぞれの内容は、(1)に「見えざる手」、「比較優位」、 (2)に「『資本論』の成立」、「労働価値説と剰余価値」、(3)に「ケインズの理論」、「現代市場経済体制のモデル」、 (4)に「レーニンの理論」、「毛沢東の理論」、(5)に「鄧小平の社会主義初級段階の理論」、「社会主義市場経済の歴史」、「社会主義市場経済体制の拡充」などが設定され、合計11

弘前大学大学院地域社会研究科年報 第 9 号
− 14 −
の小単元となっている25。これらは経済学内容としては、代表的な経済学者の理論的核心、当時と現代経済社会に与えた影響
を、事例と共に説明している。また、社会主義理論と市場の関係を探究させる過程、中国社会主義経済体制改革の歩みを整理することにより社会主義市場経済の発展を扱っている。マルクス・レーニン・毛沢東思想という社会主義思想と近代経済学思想のそれぞれ異なる理論背景を認めつつも、それらが併存する社会主義市場経済の整合的説明を図ろうとしている。
ただし、市場経済とはいえ、新古典派理論は十分には扱われていないことであり、マルクスが継承した意味での古典派経済学が扱われ、大恐慌対策としてのケインズ理論が位置づけられていることは注意しなくてはならない。
以上の内容構成は、古典派とケインズの経済学を主軸とした市場経済理論内容とマルクス主義を主軸とした社会主義経済内容の概念や知識の折衷を図ることによって、社会主義市場経済を理解させ、正当化するものとなっている。すなわち、(1)、(3)で市場経済の概念・理論や知識、(2)でマルクス主義政治経済学、(4)でレーニンと毛沢東思想との市場の評価関連と(5)で鄧小平理論以降の社会主義市場経済を社会主義初級段階と位置付ける構成である。
これは、前半に、現状の市場経済に対応した概念や理論知識による社会認識を経て、後半で、社会主義思想という理念を目標としつつも、社会主義市場経済の現実を理解するよう構成されているのである。
3 経済教育の方法1)課程標準の教授事例
課程標準から教育方法を分析するために、その教授事例を表 8 にまとめた。「講義」と「生徒の活動」は同様であるが、後者が表現と応用の 2 つに類型化できる。すなわち、前者は、教師の講義、ゲストティーチャ―による講演である。後者は、表現活動(生徒の
調査・分析・帰納、文章・図・展示パネル作り、討論)、概念・理論の適用による経済事象の説明である。
表 7 『経済学常識』の内容標準と経済概念(筆者作成)
(中華人民共和国教育部『普通高等学校思想政治課程標準(実験)』人民教育出版社2004年、pp19-20 網掛けは筆者の構成)
項 目 内 容 基 準 分 野 経済概念・価値
古典経済学巨人の理論的遺産
スミスの理論 1.1 スミスがいた時代の市場経済の特徴を知り、「見えざる手」の役割を理解する。 古典派経済学 市場と価格、絶
対優位
リカードの理論 1.2 リカードの国際貿易に関する「比較優位」理論を理解する。 古典派経済学 自由貿易、比較
優位
マルクス経済学の成立
マルクスの『資本論』 2.3 マルクスの『資本論』の成立過程を知り、政治経済学の成立の意義を理解する。 マルクス経済学 資本論
マルクスの理論 2.4 マルクスの労働価値説と「剰余価値」理論の意義を理解する。 マルクス経済学 労働価値説
剰余価値
現代市場経済の登場
ケインズ革命 3.5 「ルーズべルトのニューディール政策」を実例として、「ケインズ革命」の意味を解釈する。
ケインズ経済学、マクロ経済学
財政政策、金融政策、失業、
現代市場経済体制のモデル
3.6 西洋国家の現代市場経済体制の主要なモデルを理解する。 比較経済 経済体制、
初期の社会主義と市場関係の探究
レーニンの「新経済政策」
4.7 レーニンの「新経済政策」を理解し、その社会主義と市場関係に関する論述を説明する。
マルクスレーニン主義
社会主義、経済政策
毛沢東の「十大関係論」
4.8 中国社会主義建設初期の実践と関連させ、毛沢東の「十大関係論」の主要な観点を理解する。毛沢東理論 ―
中国型社会主義市場経済の探究
鄧小平の社会主義市場経済理論
5.9 鄧小平の社会主義市場経済に関する理論とその意義を理解する。 鄧小平理論 市場経済、社会
主義社会主義市場経済の歴史
5.10 我が国社会主義市場経済発展の歴史を理解する。 社会主義市場経済 ―
社会主義市場経済体制の拡充
5.11 社会主義市場経済体制をさらに拡充させる意義を理解する 社会主義市場経済 社会主義経済体
制
中国高等学校社会系教科『思想政治』における経済教育
− 15 −
2)教科書例示による展開授業レベルで経済教育の教授方法を検討するために、人民教育出版社教科書『経済学常識』に基づ
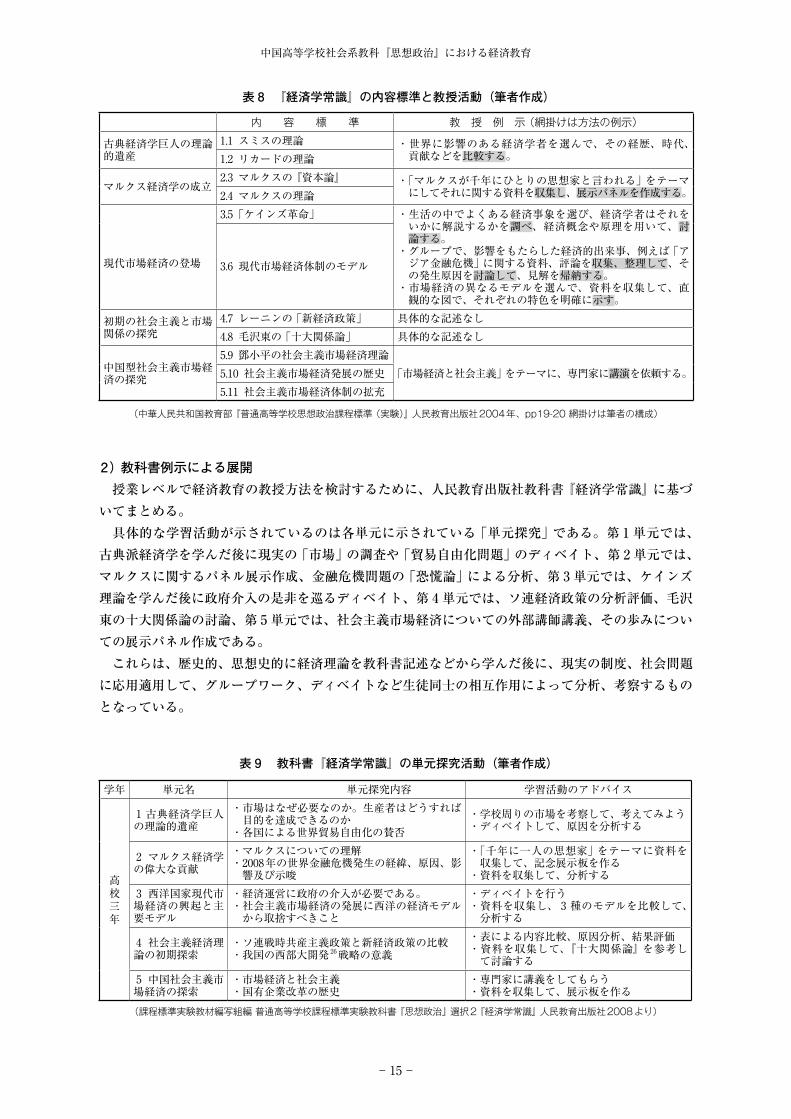
いてまとめる。具体的な学習活動が示されているのは各単元に示されている「単元探究」である。第 1 単元では、
古典派経済学を学んだ後に現実の「市場」の調査や「貿易自由化問題」のディベイト、第 2 単元では、マルクスに関するパネル展示作成、金融危機問題の「恐慌論」による分析、第 3 単元では、ケインズ理論を学んだ後に政府介入の是非を巡るディベイト、第 4 単元では、ソ連経済政策の分析評価、毛沢東の十大関係論の討論、第 5 単元では、社会主義市場経済についての外部講師講義、その歩みについての展示パネル作成である。
これらは、歴史的、思想史的に経済理論を教科書記述などから学んだ後に、現実の制度、社会問題に応用適用して、グループワーク、ディベイトなど生徒同士の相互作用によって分析、考察するものとなっている。
表 8 『経済学常識』の内容標準と教授活動(筆者作成)
(中華人民共和国教育部『普通高等学校思想政治課程標準(実験)』人民教育出版社2004年、pp19-20 網掛けは筆者の構成)
内 容 標 準 教 授 例 示(網掛けは方法の例示)
古典経済学巨人の理論的遺産
1.1 スミスの理論 ・世界に影響のある経済学者を選んで、その経歴、時代、貢献などを比較する。1.2 リカードの理論
マルクス経済学の成立2.3 マルクスの『資本論』 ・「マルクスが千年にひとりの思想家と言われる」をテーマ
にしてそれに関する資料を収集し、展示パネルを作成する。2.4 マルクスの理論
現代市場経済の登場
3.5 「ケインズ革命」 ・生活の中でよくある経済事象を選び、経済学者はそれをいかに解説するかを調べ、経済概念や原理を用いて、討論する。・グループで、影響をもたらした経済的出来事、例えば「アジア金融危機」に関する資料、評論を収集、整理して、その発生原因を討論して、見解を帰納する。・市場経済の異なるモデルを選んで、資料を収集して、直観的な図で、それぞれの特色を明確に示す。
3.6 現代市場経済体制のモデル
初期の社会主義と市場関係の探究
4.7 レーニンの「新経済政策」 具体的な記述なし4.8 毛沢東の「十大関係論」 具体的な記述なし
中国型社会主義市場経済の探究
5.9 鄧小平の社会主義市場経済理論「市場経済と社会主義」をテーマに、専門家に講演を依頼する。5.10 社会主義市場経済発展の歴史
5.11 社会主義市場経済体制の拡充
学年 単元名 単元探究内容 学習活動のアドバイス
高校三年
1 古典経済学巨人の理論的遺産
・市場はなぜ必要なのか。生産者はどうすれば目的を達成できるのか・各国による世界貿易自由化の賛否
・学校周りの市場を考察して、考えてみよう・ディベイトして、原因を分析する
2 マルクス経済学の偉大な貢献
・マルクスについての理解・2008年の世界金融危機発生の経緯、原因、影響及び示唆
・「千年に一人の思想家」をテーマに資料を収集して、記念展示板を作る・資料を収集して、分析する
3 西洋国家現代市場経済の興起と主要モデル
・経済運営に政府の介入が必要である。・社会主義市場経済の発展に西洋の経済モデルから取捨すべきこと
・ディベイトを行う・資料を収集し、 3 種のモデルを比較して、分析する
4 社会主義経済理論の初期探索
・ソ連戦時共産主義政策と新経済政策の比較・我国の西部大開発26戦略の意義
・表による内容比較、原因分析、結果評価・資料を収集して、『十大関係論』を参考して討論する
5 中国社会主義市場経済の探索
・市場経済と社会主義・国有企業改革の歴史
・専門家に講義をしてもらう・資料を収集して、展示板を作る
表 9 教科書『経済学常識』の単元探究活動(筆者作成)
(課程標準実験教材編写組編 普通高等学校課程標準実験教科書『思想政治』選択2『経済学常識』人民教育出版社2008より)
弘前大学大学院地域社会研究科年報 第 9 号
− 16 −
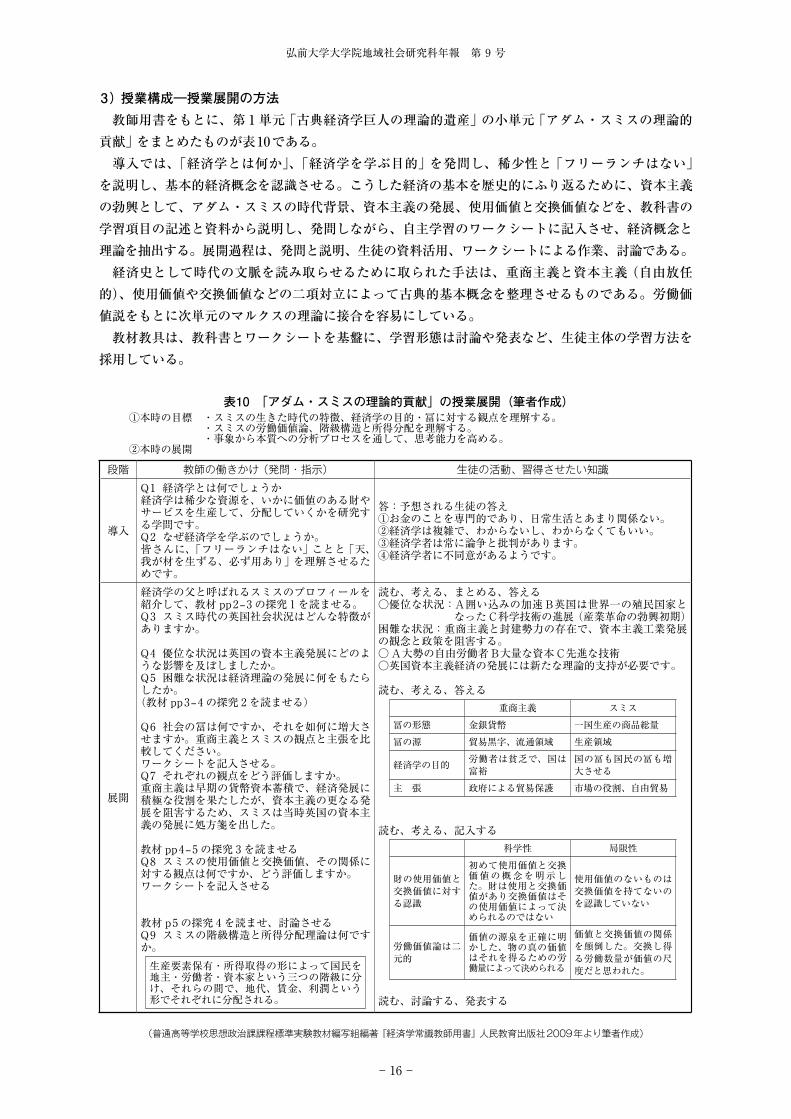
3)授業構成―授業展開の方法教師用書をもとに、第 1 単元「古典経済学巨人の理論的遺産」の小単元「アダム・スミスの理論的
貢献」をまとめたものが表10である。導入では、「経済学とは何か」、「経済学を学ぶ目的」を発問し、稀少性と「フリーランチはない」
を説明し、基本的経済概念を認識させる。こうした経済の基本を歴史的にふり返るために、資本主義の勃興として、アダム・スミスの時代背景、資本主義の発展、使用価値と交換価値などを、教科書の学習項目の記述と資料から説明し、発問しながら、自主学習のワークシートに記入させ、経済概念と理論を抽出する。展開過程は、発問と説明、生徒の資料活用、ワークシートによる作業、討論である。
経済史として時代の文脈を読み取らせるために取られた手法は、重商主義と資本主義(自由放任的)、使用価値や交換価値などの二項対立によって古典的基本概念を整理させるものである。労働価値説をもとに次単元のマルクスの理論に接合を容易にしている。
教材教具は、教科書とワークシートを基盤に、学習形態は討論や発表など、生徒主体の学習方法を採用している。
段階 教師の働きかけ(発問・指示) 生徒の活動、習得させたい知識
導入
Q1 経済学とは何でしょうか経済学は稀少な資源を、いかに価値のある財やサービスを生産して、分配していくかを研究する学問です。Q2 なぜ経済学を学ぶのでしょうか。皆さんに、「フリーランチはない」ことと「天、我が材を生ずる、必ず用あり」を理解させるためです。
答:予想される生徒の答え①お金のことを専門的であり、日常生活とあまり関係ない。②経済学は複雑で、わからないし、わからなくてもいい。③経済学者は常に論争と批判があります。④経済学者に不同意があるようです。
展開
経済学の父と呼ばれるスミスのプロフィールを紹介して、教材 pp2‒3 の探究 1を読ませる。Q3 スミス時代の英国社会状況はどんな特徴がありますか。
Q4 優位な状況は英国の資本主義発展にどのような影響を及ぼしましたか。Q5 困難な状況は経済理論の発展に何をもたらしたか。(教材 pp3‒4 の探究 2を読ませる)
Q6 社会の冨は何ですか、それを如何に増大させますか。重商主義とスミスの観点と主張を比較してください。ワークシートを記入させる。Q7 それぞれの観点をどう評価しますか。重商主義は早期の貨幣資本蓄積で、経済発展に積極な役割を果たしたが、資本主義の更なる発展を阻害するため、スミスは当時英国の資本主義の発展に処方箋を出した。
教材 pp4‒5 の探究 3を読ませるQ8 スミスの使用価値と交換価値、その関係に対する観点は何ですか、どう評価しますか。ワークシートを記入させる
教材 p5 の探究 4を読ませ、討論させるQ9 スミスの階級構造と所得分配理論は何ですか。生産要素保有・所得取得の形によって国民を地主・労働者・資本家という三つの階級に分け、それらの間で、地代、賃金、利潤という形でそれぞれに分配される。
読む、考える、まとめる、答える○優位な状況:A囲い込みの加速 B英国は世界一の殖民国家と
なったC科学技術の進展(産業革命の勃興初期)困難な状況:重商主義と封建勢力の存在で、資本主義工業発展の観念と政策を阻害する。○A大勢の自由労働者B大量な資本C先進な技術○英国資本主義経済の発展には新たな理論的支持が必要です。
読む、考える、答える重商主義 スミス
冨の形態 金銀貨幣 一国生産の商品総量冨の源 貿易黒字、流通領域 生産領域
経済学の目的 労働者は貧乏で、国は富裕
国の冨も国民の冨も増大させる
主 張 政府による貿易保護 市場の役割、自由貿易
読む、考える、記入する科学性 局限性
財の使用価値と交換価値に対する認識
初めて使用価値と交換価値の概念を明示した。財は使用と交換価値があり交換価値はその使用価値によって決められるのではない
使用価値のないものは交換価値を持てないのを認識していない
労働価値論は二元的
価値の源泉を正確に明かした、物の真の価値はそれを得るための労働量によって決められる
価値と交換価値の関係を顛倒した。交換し得る労働数量が価値の尺度だと思われた。
読む、討論する、発表する
(普通高等学校思想政治課課程標準実験教材編写組編著『経済学常識教師用書』人民教育出版社2009年より筆者作成)
①本時の目標 ・スミスの生きた時代の特徴、経済学の目的・冨に対する観点を理解する。 ・スミスの労働価値論、階級構造と所得分配を理解する。 ・事象から本質への分析プロセスを通して、思考能力を高める。②本時の展開
表10 「アダム・スミスの理論的貢献」の授業展開(筆者作成)
中国高等学校社会系教科『思想政治』における経済教育
− 17 −
4 小括―経済教育の構成原理と特質以上、『経済学常識』について、目標・内容及び授業構成を分析した。目標は、古典派経済学から毛沢東思想に至るまでの経済学理論を経済思想史的に理解させることに
よって、社会主義市場経済の理解と社会主義の理想を追求させる目標となっている。内容は、経済思想史として古典派、マルクス、ケインズの経済学を主とした理論、レーニンや毛沢東の社会主義と市場の位置付け、鄧小平以降の中国型社会主義市場経済の理論から構成されている。近代経済学理論の発展、社会主義市場経済の探究の順で配置され、それらの理論を中国で活用する中国型社会主義市場経済の教育が企図されている。方法は、歴史的経済の出来事、経済思想史を、講義によって習得させると同時に、生徒相互の学習活動で探究させ、社会主義と市場経済の現状には外部講師講義を素材とした討論などの主体的学習活動を促している。
この科目の特質は、経済思想史から経済学理論習得を図ることによって、社会主義市場経済の現実を理解し、その課題を社会主義的理想によって解決しようとする問題解決的経済思想史学習であるといえよう。
Ⅵ 選択6『公民道徳と倫理常識』における経済教育1 目標『公民道徳と倫理常識』の目標は、現代科学技術と市場経済の進展にともない現れた経済、科学、
環境などの新たな倫理問題を理解し、社会主義市場経済に相応しい思想道徳体系の構築、道徳素養を高めて、協調、持続可能な発展観念を培うことである27。
文字通り道徳と倫理を扱うので、倫理科目であると推察できるが、市場経済の進展に伴う経済に関連する倫理問題である点で、経済教育の経済倫理的側面を担う科目としてその目標を捉えることができる。
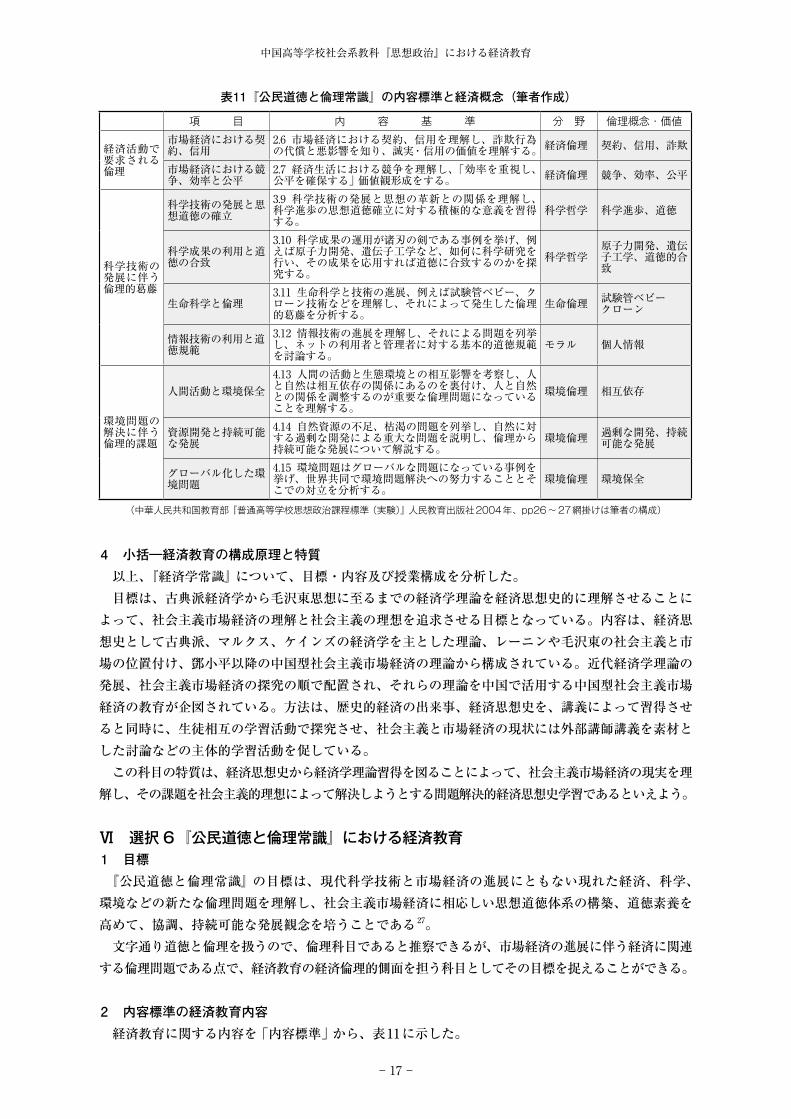
2 内容標準の経済教育内容経済教育に関する内容を「内容標準」から、表11に示した。
(中華人民共和国教育部『普通高等学校思想政治課程標準(実験)』人民教育出版社2004年、pp26~27網掛けは筆者の構成)
表11『公民道徳と倫理常識』の内容標準と経済概念(筆者作成)
項 目 内 容 基 準 分 野 倫理概念・価値
経済活動で要求される倫理
市場経済における契約、信用
2.6 市場経済における契約、信用を理解し、詐欺行為の代償と悪影響を知り、誠実・信用の価値を理解する。経済倫理 契約、信用、詐欺
市場経済における競争、効率と公平
2.7 経済生活における競争を理解し、「効率を重視し、公平を確保する」価値観形成をする。 経済倫理 競争、効率、公平
科学技術の発展に伴う倫理的葛藤
科学技術の発展と思想道徳の確立
3.9 科学技術の発展と思想の革新との関係を理解し、科学進歩の思想道徳確立に対する積極的な意義を習得する。
科学哲学 科学進歩、道徳
科学成果の利用と道徳の合致
3.10 科学成果の運用が诸刃の剣である事例を挙げ、例えば原子力開発、遺伝子工学など、如何に科学研究を行い、その成果を応用すれば道徳に合致するのかを探究する。
科学哲学原子力開発、遺伝子工学、道徳的合致
生命科学と倫理3.11 生命科学と技術の進展、例えば試験管ベビー、クローン技術などを理解し、それによって発生した倫理的葛藤を分析する。
生命倫理 試験管ベビークローン
情報技術の利用と道徳規範
3.12 情報技術の進展を理解し、それによる問題を列挙し、ネットの利用者と管理者に対する基本的道徳規範を討論する。
モラル 個人情報
環境問題の解決に伴う倫理的課題
人間活動と環境保全4.13 人間の活動と生態環境との相互影響を考察し、人と自然は相互依存の関係にあるのを裏付け、人と自然との関係を調整するのが重要な倫理問題になっていることを理解する。
環境倫理 相互依存
資源開発と持続可能な発展
4.14 自然資源の不足、枯渇の問題を列挙し、自然に対する過剰な開発による重大な問題を説明し、倫理から持続可能な発展について解説する。
環境倫理 過剰な開発、持続可能な発展
グローバル化した環境問題
4.15 環境問題はグローバルな問題になっている事例を挙げ、世界共同で環境問題解決への努力することとそこでの対立を分析する。
環境倫理 環境保全
弘前大学大学院地域社会研究科年報 第 9 号
− 18 −
経済教育の内容は、3 つの大単元からなっている。すなわち(1)「経済活動で要求される倫理」、(2)「科学技術の発展に伴う倫理的葛藤」、(3)「環境問題解決に伴う倫理的課題」である。それらには小単元が 9 つある。すなわち、(1)には「市場経済における契約・信用」「競争・効率・公平」、(2)には「科学技術の発展と思想道徳の確立」「科学成果の利用と道徳の合致」「生命科学と倫理」「情報技術の利用と道徳規範」、(3)には「人間活動と環境保全」「資源開発と持続可能な発展」「グローバル化した環境問題」である。
それらは、経済倫理、科学哲学、生命倫理、環境倫理から構成され、いわゆる経済学理論を直接的に構成しているわけではない。しかし、市場経済を基礎付ける契約、信用、効率、公平等の概念が扱われており、相互依存、持続可能な開発、環境保全等も扱うことによって、「効率的な市場の倫理的基礎付け」を教化する一方で、「市場経済の限界」を扱おうとしている。しかし、本来経済学で扱うべき「外部性」「外部不経済」としての環境問題の扱いはなされておらず、倫理的道徳的アプローチをとるものとなっている。
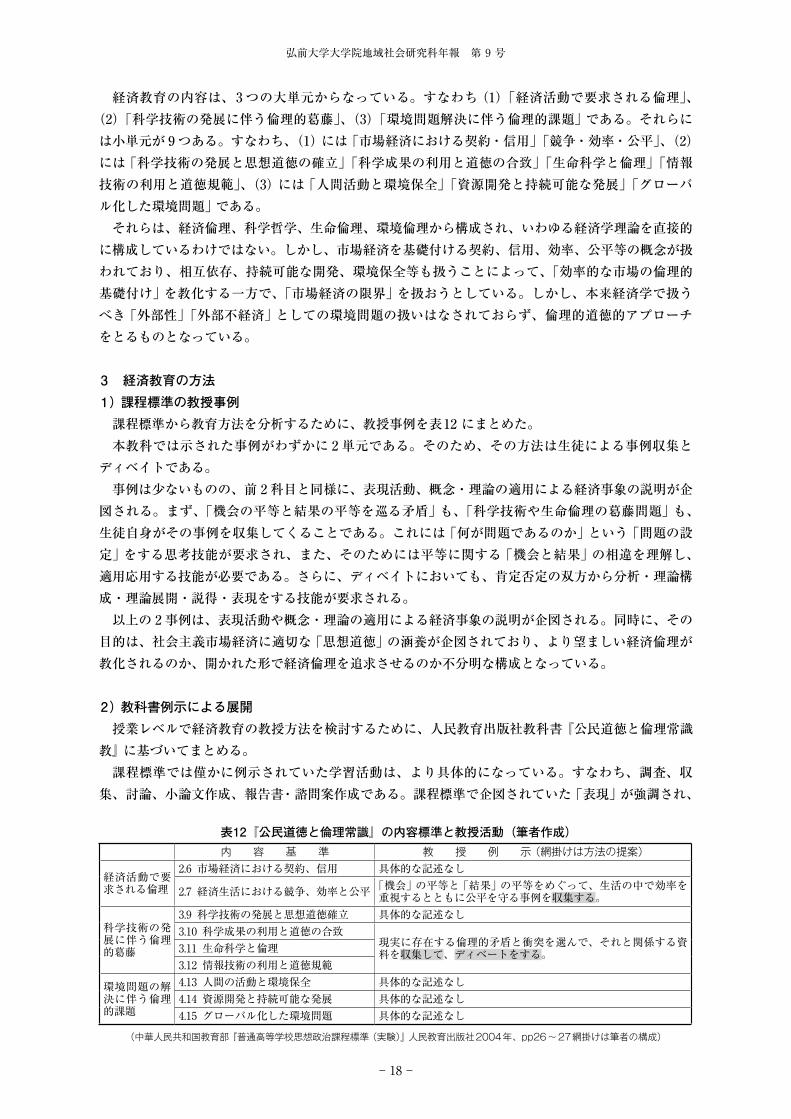
3 経済教育の方法1)課程標準の教授事例
課程標準から教育方法を分析するために、教授事例を表12 にまとめた。本教科では示された事例がわずかに 2 単元である。そのため、その方法は生徒による事例収集と
ディベイトである。事例は少ないものの、前 2 科目と同様に、表現活動、概念・理論の適用による経済事象の説明が企
図される。まず、「機会の平等と結果の平等を巡る矛盾」も、「科学技術や生命倫理の葛藤問題」も、生徒自身がその事例を収集してくることである。これには「何が問題であるのか」という「問題の設定」をする思考技能が要求され、また、そのためには平等に関する「機会と結果」の相違を理解し、適用応用する技能が必要である。さらに、ディベイトにおいても、肯定否定の双方から分析・理論構成・理論展開・説得・表現をする技能が要求される。
以上の 2 事例は、表現活動や概念・理論の適用による経済事象の説明が企図される。同時に、その目的は、社会主義市場経済に適切な「思想道徳」の涵養が企図されており、より望ましい経済倫理が教化されるのか、開かれた形で経済倫理を追求させるのか不分明な構成となっている。
2)教科書例示による展開授業レベルで経済教育の教授方法を検討するために、人民教育出版社教科書『公民道徳と倫理常識
教』に基づいてまとめる。課程標準では僅かに例示されていた学習活動は、より具体的になっている。すなわち、調査、収
集、討論、小論文作成、報告書・諮問案作成である。課程標準で企図されていた「表現」が強調され、
内 容 基 準 教 授 例 示(網掛けは方法の提案)
経済活動で要求される倫理
2.6 市場経済における契約、信用 具体的な記述なし
2.7 経済生活における競争、効率と公平「機会」の平等と「結果」の平等をめぐって、生活の中で効率を重視するとともに公平を守る事例を収集する。
科学技術の発展に伴う倫理的葛藤
3.9 科学技術の発展と思想道徳確立 具体的な記述なし3.10 科学成果の利用と道徳の合致
現実に存在する倫理的矛盾と衝突を選んで、それと関係する資料を収集して、ディベートをする。3.11 生命科学と倫理
3.12 情報技術の利用と道徳規範
環境問題の解決に伴う倫理的課題
4.13 人間の活動と環境保全 具体的な記述なし4.14 資源開発と持続可能な発展 具体的な記述なし4.15 グローバル化した環境問題 具体的な記述なし
(中華人民共和国教育部『普通高等学校思想政治課程標準(実験)』人民教育出版社2004年、pp26~27網掛けは筆者の構成)
表12『公民道徳と倫理常識』の内容標準と教授活動(筆者作成)
中国高等学校社会系教科『思想政治』における経済教育
− 19 −
概念の適用部分は最後の単元での諮問案(手紙)作成である。倫理的道徳的解決の糸口を見出すための学習活動を保障しており、単一の結論に収斂される構成となっているわけではない。
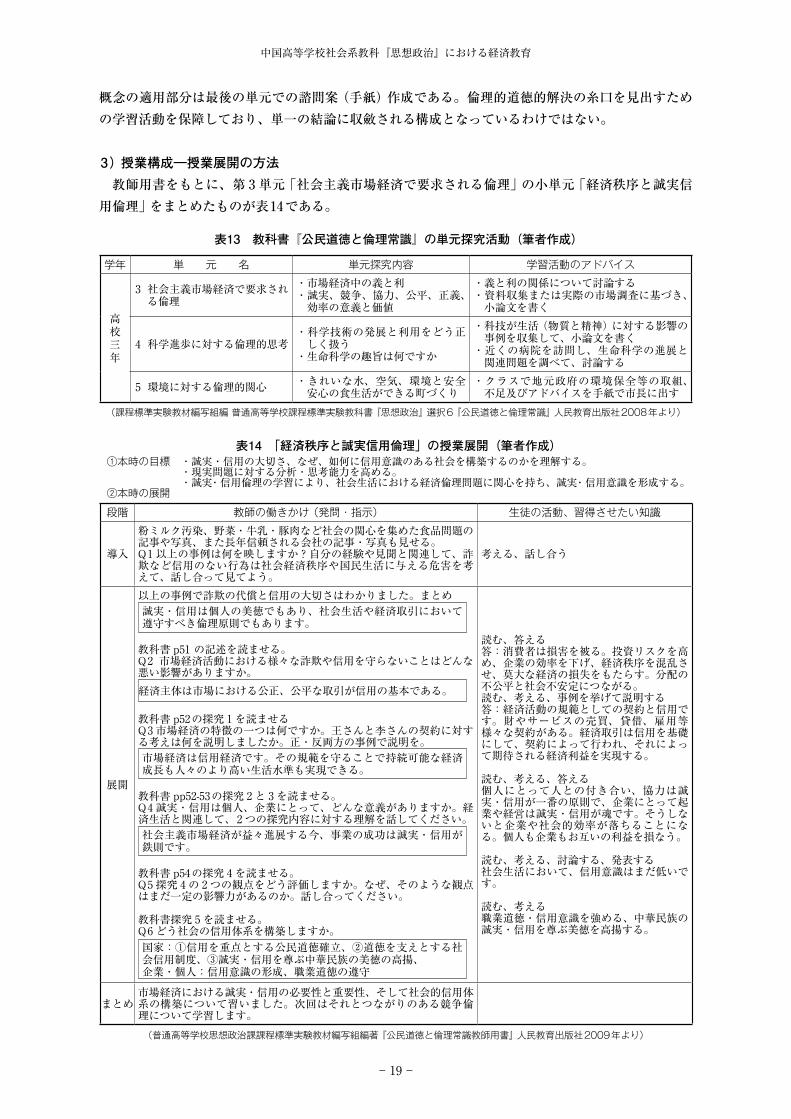
3)授業構成―授業展開の方法教師用書をもとに、第 3 単元「社会主義市場経済で要求される倫理」の小単元「経済秩序と誠実信
用倫理」をまとめたものが表14である。
(課程標準実験教材編写組編 普通高等学校課程標準実験教科書『思想政治』選択6『公民道徳と倫理常識』人民教育出版社2008年より)
表13 教科書『公民道徳と倫理常識』の単元探究活動(筆者作成)
学年 単 元 名 単元探究内容 学習活動のアドバイス
高校三年
3 社会主義市場経済で要求される倫理
・市場経済中の義と利・誠実、競争、協力、公平、正義、効率の意義と価値
・義と利の関係について討論する・資料収集または実際の市場調査に基づき、小論文を書く
4 科学進歩に対する倫理的思考
・科学技術の発展と利用をどう正しく扱う・生命科学の趣旨は何ですか
・科技が生活(物質と精神)に対する影響の事例を収集して、小論文を書く・近くの病院を訪問し、生命科学の進展と関連問題を調べて、討論する
5 環境に対する倫理的関心 ・きれいな水、空気、環境と安全安心の食生活ができる町づくり
・クラスで地元政府の環境保全等の取組、不足及びアドバイスを手紙で市長に出す
段階 教師の働きかけ(発問・指示) 生徒の活動、習得させたい知識
導入
粉ミルク汚染、野菜・牛乳・豚肉など社会の関心を集めた食品問題の記事や写真、また長年信頼される会社の記事・写真も見せる。Q1以上の事例は何を映しますか?自分の経験や見聞と関連して、詐欺など信用のない行為は社会経済秩序や国民生活に与える危害を考えて、話し合って見てよう。
考える、話し合う
展開
以上の事例で詐欺の代償と信用の大切さはわかりました。まとめ誠実・信用は個人の美徳でもあり、社会生活や経済取引において遵守すべき倫理原則でもあります。
教科書 p51の記述を読ませる。Q2市場経済活動における様々な詐欺や信用を守らないことはどんな悪い影響がありますか。経済主体は市場における公正、公平な取引が信用の基本である。
教科書 p52の探究 1を読ませるQ3市場経済の特徴の一つは何ですか。王さんと李さんの契約に対する考えは何を説明しましたか。正・反両方の事例で説明を。市場経済は信用経済です。その規範を守ることで持続可能な経済成長も人々のより高い生活水準も実現できる。
教科書 pp52-53の探究 2と 3を読ませる。Q4誠実・信用は個人、企業にとって、どんな意義がありますか。経済生活と関連して、2つの探究内容に対する理解を話してください。社会主義市場経済が益々進展する今、事業の成功は誠実・信用が鉄則です。
教科書 p54の探究 4を読ませる。Q5探究 4の 2つの観点をどう評価しますか。なぜ、そのような観点はまだ一定の影響力があるのか。話し合ってください。
教科書探究 5を読ませる。Q6どう社会の信用体系を構築しますか。国家:①信用を重点とする公民道徳確立、②道徳を支えとする社会信用制度、③誠実・信用を尊ぶ中華民族の美徳の高揚、企業・個人:信用意識の形成、職業道徳の遵守
読む、答える答:消費者は損害を被る。投資リスクを高め、企業の効率を下げ、経済秩序を混乱させ、莫大な経済の損失をもたらす。分配の不公平と社会不安定につながる。読む、考える、事例を挙げて説明する答:経済活動の規範としての契約と信用です。財やサービスの売買、貸借、雇用等様々な契約がある。経済取引は信用を基礎にして、契約によって行われ、それによって期待される経済利益を実現する。
読む、考える、答える個人にとって人との付き合い、協力は誠実・信用が一番の原則で、企業にとって起業や経営は誠実・信用が魂です。そうしないと企業や社会的効率が落ちることになる。個人も企業もお互いの利益を損なう。
読む、考える、討論する、発表する社会生活において、信用意識はまだ低いです。
読む、考える職業道徳・信用意識を強める、中華民族の誠実・信用を尊ぶ美徳を高揚する。
まとめ市場経済における誠実・信用の必要性と重要性、そして社会的信用体系の構築について習いました。次回はそれとつながりのある競争倫理について学習します。(普通高等学校思想政治課課程標準実験教材編写組編著『公民道徳と倫理常識教師用書』人民教育出版社2009年より)
①本時の目標 ・誠実・信用の大切さ、なぜ、如何に信用意識のある社会を構築するのかを理解する。 ・現実問題に対する分析・思考能力を高める。 ・誠実・信用倫理の学習により、社会生活における経済倫理問題に関心を持ち、誠実・信用意識を形成する。②本時の展開
表14 「経済秩序と誠実信用倫理」の授業展開(筆者作成)
弘前大学大学院地域社会研究科年報 第 9 号
− 20 −
導入では、身近な食品問題を生徒の経験や見聞と関連させ、問題意識を持たせ、信用は美徳でもあり、倫理原則でもあることを理解させる。さらに、教科書の記述、探究資料をもとに、相反する二つの事例を用いて、説明させ、市場経済の規範である契約・信用とその大切さを理解させる。一方、信用と誠実に関する「損得」と「相互性」の 2 つの観点を比較・討論させ、社会全体は信用に対する意識がまだ低いという現実の問題を認識させ、中国のことわざ・古典の教えなどと関連させ、理解を深めさせている。その教授=学習活動を通して、社会生活における経済倫理問題に関心を持ち、職業道徳、誠実・信用意識を形成させようとする。
以上の授業過程は、導入部分を除き、ほぼ全て、教科書の記述をもとに、展開され、探究説明・資料を生かしつつ、生徒自身に、読解、考察、説明、発表、討論をさせている。発問と説明による教師の講義を主軸に、生徒の主体的な取り組みを確保しているのである。
4 小括―経済教育の構成原理と特質以上、『公民道徳と倫理常識』の経済教育について、目標・内容及び授業構成を分析した。目標は、経済生活における倫理問題の探究を通して、急激な経済・社会の変化によってもたらされ
た倫理問題・倫理的葛藤を理性的に認識して、道徳素養を高めて、協調、持続可能な発展観念を培うことである。内容は、市場経済を基礎付ける契約、信用、効率、公平等の経済倫理を内容として、科学進歩に伴う新たな倫理的な論争問題からの構成となっている。現状の倫理・道徳問題の認識から、誠実・信用を基にした社会的モラルの向上、社会主義市場経済における倫理追求による問題解決を図っている。方法は、教科書を主軸とした教師の講義と生徒主体的経済問題設定によって社会主義理念を生徒自身が追求する表現活動や概念・理論の適用による学習方法が提示されている。
特質は、論争的経済問題の探究・解決を通して、市場経済の基本的な倫理や理念、中国独自の社会主義理念の追求を図る経済理念追求学習である。
Ⅶ むすびにかえて─中国における経済教育の構成原理と課題
以上、中国の経済教育を概観し、高等学校社会系教科『思想政治』の『経済生活』(必修 1)と『経済学常識』(選択 2)及び『公民道徳と倫理常識』(選択 6)を課程標準と教科書から分析して、経済教育の目標・内容・方法を明らかにし、構成原理を導出した。
改めてまとめると、『思想政治』は、社会主義市場経済下での経済認識と経済的価値観を統一的に育成する構成原理をもっている。個々の科目では、『経済生活』は、社会主義市場経済を理解するために、生活を通したミクロ・マクロ経済を中心とした市場経済に関する概念とその課題を克服するための社会主義理念を、生徒の主体的活動によって学ぶ経済社会と理念の理解学習原理をもつ。また
『経済学常識』では、古典派の市場経済に関する理論からマルクス経済学などの社会主義理論を通した経済学概念間の関係を、生徒同士の相互作用によって学ぶ経済思想史からの課題解決学習原理をもつ。さらに、『公民道徳と倫理常識』では、教師の講義や教科書を中心としながら、倫理・道徳を市場経済、社会主義と関連させ、経済問題の倫理的克服を目指した経済理念の追求学習の原理をもつ。
これら 3 つの科目は、社会主義市場経済下での経済認識と経済的価値観形成を図るために、現実社会を理解するための経済知識概念・経済理念の重要性、社会主義市場経済の課題を解決するための経済思想・経済理念の「科学性」、現代の経済社会問題の均衡ある解決のための倫理道徳教育の理想性というそれぞれの前提を保有しているのである。
残された課題は、現実の教育現場での実践との関係性である。第 1 に、必修科目と選択科目の関係性は、その狙い通りに果たされるのか否かという課題である。

中国高等学校社会系教科『思想政治』における経済教育
− 21 −
中国の高等学校で大学進学する生徒は、受験勉強のため必修科目のみを履修し、進学しない生徒は、社会に出るために選択科目も含めて履修する傾向が強いという日本とは異なる現状がある。大学進学しない者のみが 3 科目履修する可能性があることを勘案すれば、課程標準の理想は歪められる可能性はないのだろうか。大学での教科課程で、拡充発展するとしても。
第 2 に、社会主義市場経済についてのカリキュラムと実際の授業実態の調査である。流動し進展する中国社会主義市場経済を、カリキュラム上は、社会主義の過渡的形態として位置づけることによってマルクス経済学と近代経済学や現行市場経済との整合性を図っている。これらの接合・整合性は、現実の授業では破綻無く行われているのだろうか。理念的に優位にある社会主義制度は遠くにあり、いま現在は、その初級段階であるという位置づけでも、この熾烈な格差問題の前に、資本主義社会とどの程度認識を異にできるのか、生徒や教師の実態と共に調査することが課題となる。
脚注1 日本の高等学校政治思想にあたる教科書『思想政治』には、次のように記述されている。すなわち、「市場経済の
長所も社会主義の優越性も発揮できるのであり、基本的特徴は 3 つある。①公有制の主体的地位を堅持する②共同富裕を根本的目標とする③強力なマクロ調整が実行できる」というものである。課程教材研究所編『思想政治』必修 1『経済生活』人民教育出版社 2008 年、pp.83‒84.
2 中国では「素質教育」ともいう。基礎教育課程改革を進める基本的な考え方である。児童・生徒の個性を伸ばし、全面的資質を高めることをねらいとする。「資質教育」の中で特に「創造能力」と「実践能力」の育成を重点としている。ここでの「創造」とは、知識、制度、考え方、理論、方法等を含めた広い意味での「新しさ」を
「創る」ことである。蔡秋英「中国における中学校新教科『思想品徳』の内容編成─『公民意識』の育成を視点として─」『中国四国教育学会 教育学研究ジャーナル』第 5 号 2008 年、p.20 参照。
3 趙亜夫『学会行動-社会科課程公民教育的理論和実践』高等教育出版社 2008. 3、p.91.4 2001 年に、従来の「教学大綱」を「課程標準」に改称した。5 蔡秋英「中国における中学校新教科『思想品徳』の内容編成─『公民意識』の育成を視点として─」『中国四国教
育学会 教育学研究ジャーナル』第 5 号 2008 年 蔡秋英「中国における初等教科『品徳と社会』の内容構成原理─『公民意識』の育成を中心に─」『広島大学大学院教育学研究科紀要』第二部第 56 号 2007 年 蔡秋英「中国における新教科『歴史と社会』の授業原理:単元の分析を通して」『社会科研究』(69)41‒50 2008 年 蔡秋英
「中国における公民教育の内容編成─人民教育出版社版教科書『歴史と社会』の分析」『教育学研究紀要』53(1)2007 年
6 例えば、銭煥「国外中小学校の経済教育」『教学と管理』山西省教育学院 2001. 4、舒健、沈暁敏「我国初等教育段階の経済学教育─全米課準と主流教材の分析に基づく」『比較教育研究』北京師範大学 2009. 2、王常萍「米国少児経済教育概況」『教学と管理』山西省教育学院 2002. 5、高佳「米国中小学ファイナンシャル・リテラシー教育研究」『華東師範大学』2007. 5(修士論文)、郭青青「米国中小学経済教育研究」『華東師範大学』2011. 5(修士論文)、葉菊艶「英国 5 ~ 18 歳児童学校理財教育実践とその啓示」『外国中小学教育』上海師範大学 2007. 2
7 例えば、許芳「1990 年代から中国における社会科教科書づくりとその展望-授業づくりの観点から─」『早稲田大学大学院教育学研究科紀要』別冊 15 号- 1 2007 年 9 月、沈暁敏「中国の道徳・社会科の再編成における『公民意識』『公共意識』の形成─『品徳と社会』教科書を中心に─」『東京大学大学院教育学研究科紀要』45 2006年、木全清博「中国における小学社会科の設置と社会科教科書─中国の社会科教育(1)─」『滋賀大学教育学部紀要』48 1998 年、木全清博「中国における中学社会科カリキュラムと社会科教科書─中国の社会科教育(3)─」
『滋賀大学教育学部紀要』51 2002 年8 中国教育部『基礎教育課程改革綱要(試行)』2001 年9 中国教育部『基礎教育課程改革綱要(試行)』2001 年、p.1.10 citizenship educationは「市民性教育」、「シチズンシップ・エデュケーション」などと訳されているが、中国で
は「市民」は都市部の住民の意味だけであり、「公民教育」という訳語が広く使われている、そこで本稿でも「公民教育」とする。
11 蔡秋英「中国における初等教科『品徳と社会』の内容構成原理─『公民意識』の育成を中心に─」『広島大学大学院教育学研究科紀要』第二部第 56 号 2007 年、p.75.
12 中華人民共和国教育部『全日制義務教育品徳と社会課程標準(実験版)』北京師範大学出版社 2002 年、p.1.13 中華人民共和国教育部『全日制義務教育歴史と社会課程標準(二)』人民教育出版社 2003 年、p.5.14 思想政治課程標準研制組編『普通高等学校思想政治課程標準(実験)解読』人民教育出版社 2011 年、p.14.15 中華人民共和国教育部『普通高等学校思想政治課程標準(実験)』人民教育出版社 2004 年、p.3.

弘前大学大学院地域社会研究科年報 第 9 号
− 22 −
16 同上、p.4.17 同上、p.5.18 中国には、商品売買や役務提供の取引高に応じて納税する流転税という種類の税金があります。増値税(ぞうち
ぜい)は、営業税、消費税とともに流転税の一つに数えられます。19 科学的発展観とは中国の経済発展を遂行するに当たって、人を基本とすることを堅持し、全面的で均衡のとれた
持続可能な発展観である。2007 年 10 月の中国共産党第 17 回全国代表大会における胡錦涛の報告書に「科学的発展観は、党の三世代に亘る中央指導グループの発展に関する重要な思想を継承、発展させたものであり、マルクス主義の発展に関する世界観と方法論を集中的に具現するものであり、マルクス・レーニン主義、毛沢東思想、鄧小平理論の重要な思想と一脈相通じるものであり、時代と共に進む科学的理論である。」と書いてある。
20 上掲 16、pp.5‒8.21 岡藤吉英「小学校・中学校における経済学概念の教授方法 : アメリカ合衆国JCEEプロジェクトの場合」『社会科
研究』1986、pp.94‒107.22 小康とは、人間にとって最低限の衣食住、教育、保健等を満たした上で、ある程度の文化と余暇を保てるような
生活水準とややゆとりある生活が出来る状態をいう。23 「引進来」 は外資導入のことであり、「引進来」 とは 「引っ張ってくる」 という意味である。「走出去」は海外進出
のことであり、「走出去」とは 「出て行く」 という意味である。24 同上、p.19.25 上掲 16、pp.5‒8.26 西部大開発は中国において東部沿海地区の経済発展から取り残された内陸西部地区を経済成長軌道に乗せるため
に中華人民共和国国務院が実施している開発政策及びその結果としての経済動向を指す。27 上掲 16、p.25.
※ 二名の査読者には本稿の内容について深いご理解を賜り、また適切かつ有益なコメントをいただきました。ここに深く感謝申し上げます。

− 23 −
The Analytical Survey and Empirical Study of Economic Impact of the Natural Disasters: Input-Output framework
野 崎 道 哉※
※ Researcher,ChubuRegionInstituteforSocialandEconomicResearch,NittochiNagoyaBLD.15F,1-1Sakae2,Naka-ku,Nagoya,Aichi,Japan,460-0008.E-mail:[email protected]
要旨: 本論文の目的は予期せざる自然災害の経済的インパクトに関する分析的アプローチをサーベイし、中部圏地域間産業連関表を用いたケーススタディにより、東日本大震災における東北地域の経済被害が他地域に与えるインパクトを評価することである。
キーワード:自然災害、地域間産業連関表、経済被害
The Analytical Survey and Empirical Study of Economic Impact of the Natural Disasters: Input-Output framework
Michiya NOZAKI※
Abstract:The aim of this paper is to survey the analytical approaches about the economic impacts on
unscheduled natural disasters, and then to estimate the economic damages of the Great East Japan Earthquake on March 11, 2011 by means of Interregional Input-Output table for Chubu region and the Rest of Japan, as an example, the economic damage repercussion to other regions, especially for Chubu Region.Key Words: Natural disasters, Interregional Input-Output table, Economic damages.
I.Introduction
The damages and losses from unscheduled events, such as earthquakes, flood, and other major natural disasters, have significant and intense impacts on a region’s economy. The demand for the estimation of the economic impacts of recovery and reconstruction as well as of damages per se may become immediate after such events. Most analytical models of urban and regional economies, however, cannot confront these unscheduled and significant changes, since, at best, they assume incremental changes in system over time. The consequences associated with the event, moreover, will have many aspects including damages on demand and supply sides, for example, since the event may affect a wide range of regional activities in different ways. The difficulties with impact analysis of unscheduled events are, therefore, 1)disentangling the consequences stemming directly and indirectly from the event; 2)deriving possibly different assessments at each spatial level, and 3)evaluating the reaction of households which are poorly
弘前大学大学院地域社会研究科年報 第 9 号
− 24 −
understood (Okuyama, Sonis, and Hewings,1999, p.113).In the standard Input-Output analysis given by Leontief, consumption demand is treated as
an exogenous variable for household sectors as it is transferred to the processing sectors, and being regarded as an industry whose output is labor and whose input is consumption goods. This analysis considers various economic sectors as a series of inputs of raw materials in the form of services and outputs of semi-finished and finished goods that are also in the form of services. In other words, the output of one industry is the input of another.
Immediately following the tragic earthquake and tsunami on March 11 in the Tohoku region, we are still in the middle of this large effort to support the Japanese people through its government and the Japanese Joint Task Force, but some of us participating in the relief operations are already accumulating lessons learned and thinking about the future.
This catastrophe, which involved a magnitude-9.0 earthquake (and thousands of aftershocks), a massive tsunami, and problems with nuclear reactors, has shown more than ever that devastation knows no administrative borders. Hundreds of communities in almost ten prefectures have been affected. Many different layers of the bureaucracy--at the local, prefectural, and national level--are involved, and because of the time necessary to navigate and coordinate the various jurisdictions, quick responses are often not possible(The Daily Yomiuri, April 20, 2011).
In this present study, the impacts from this event have spilled over from the damaged region to other regions, and the impacts have influenced the national economy as a whole. Okuyama, Sonis and Hewings (1999) analyzed the Great Hanshin Earthquake by utilizing the interregional input-output table provided by Ministry of International Trade and Industry of Japan(1990). Miyazawa
(1976) formulated a matrix multiplier that combines Leontief’s propagation process with the Keynesian propagation process in the form of the Leontief inverse multiplied by the subjoined inverse matrix.
Moreover, Miyazawa’s internal and external multipliers derived to analyze interregional linkages.
Okuyama, Sonis and Hewings (1999) presented their analytical methodology employing the Miyazawa’s framework and some extensions.
The aim of this paper is to survey the analytical approaches about the economic impacts on unscheduled natural disasters, and then to estimate the economic damages of the Great East Japan Earthquake on March 11, 2011 by means of Interregional Input-Output table for Chubu region and the Rest of Japan, as an example, the economic damage repercussion to other regions, especially for Chubu Region.1.
II. Miyazawa’s Analytical Framework: Internal and External Multipliers
According to the Miyazawa’s analysis (1976), in the usual input-output analysis, the n × n inverse matrix shows the ultimate total effects of inter-industrial propagation, but it cannot show us any information on the disjointed effects. Separating the effects involves formulating partitioned matrix multipliers, thus showing the relationship among two or three regions that might be structurally different.
Miyazawa’s study is an attempt to clarify the following two problems: the existence of an interdependent model of the goods-producing and service sectors, and an interregional repercussion model of the Japanese economy.
The Analytical Survey and Empirical Study of Economic Impact of the Natural Disasters: Input-Output framework
− 25 −
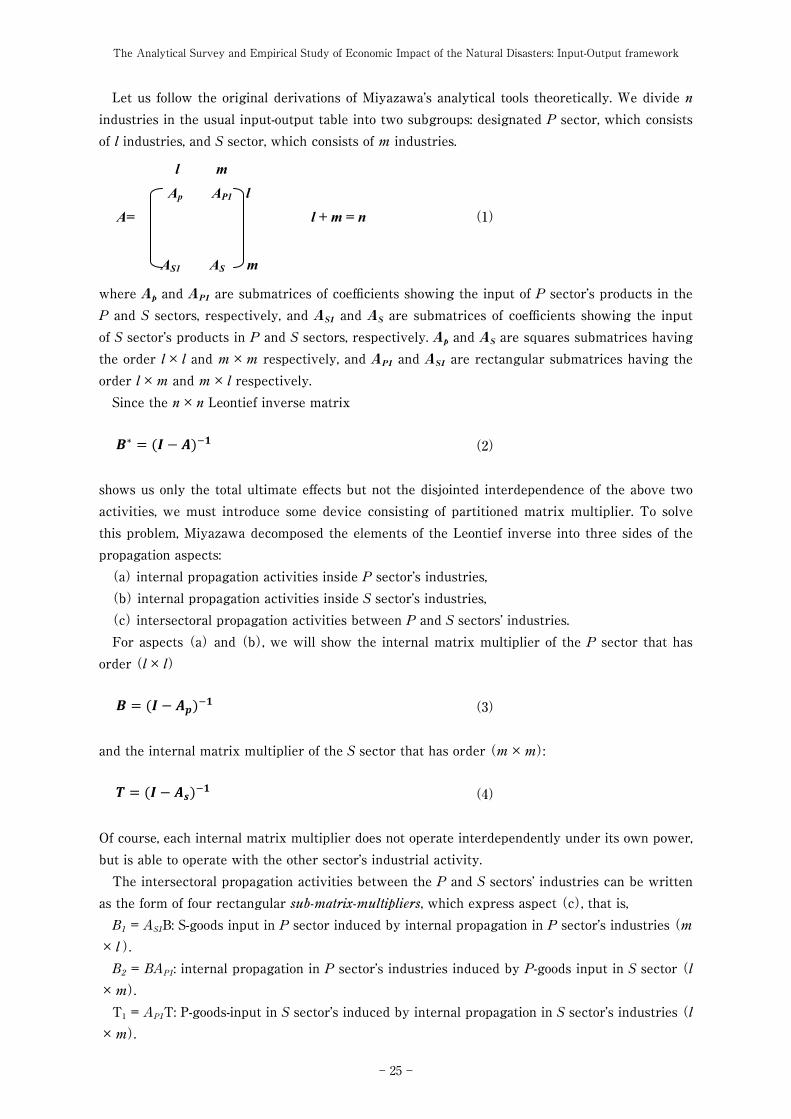
Let us follow the original derivations of Miyazawa’s analytical tools theoretically. We divide n industries in the usual input-output table into two subgroups: designated P sector, which consists of l industries, and S sector, which consists of m industries.
4
subjoined inverse matrix. Moreover, Miyazawa’s internal and external multipliers derived to analyze interregional
linkages. Okuyama, Sonis and Hewings(1999) presented their analytical methodology employing the Miyazawa’s framework and some extensions. The aim of this paper is to survey the analytical approaches about the economic impacts on unscheduled natural disasters, and then to estimate the economic damages of the Great East Japan Earthquake on March 11, 2011 by means of Interregional Input-Output table for Chubu region and the Rest of Japan, as an example, the economic damage repercussion to other regions, especially for Chubu Region.1. II. Miyazawa’s Analytical Framework: Internal and External Multipliers According to the Miyazawa’s analysis (1976), in the usual input-output analysis, the n × n inverse matrix shows the ultimate total effects of inter-industrial propagation, but it cannot show us any information on the disjointed effects. Separating the effects involves formulating partitioned matrix multipliers, thus showing the relationship among two or three regions that might be structurally different.
Miyazawa’s study is an attempt to clarify the following two problems: the existence of an interdependent model of the goods-producing and service sectors, and an interregional repercussion model of the Japanese economy.
Let us follow the original derivations of Miyazawa’s analytical tools theoretically. We divide n industries in the usual input-output table into two subgroups: designated P sector, which consists of l industries, and S sector, which consists of m industries.
l m Ap AP1 l A= l + m = n (1) AS1 AS m
where Ap and AP1 are submatrices of coefficients showing the input of P sector’s products in the P and S sectors, respectively, and AS1 and AS are submatrices of coefficients showing the input of S sector’s products in P and S sectors, respectively. Ap and AS are squares submatrices having the order l × l and m × m respectively, and AP1 and AS1 are rectangular submatrices having the order l × m and m × l respectively.
Since the n × n Leontief inverse matrix
(1)
where Ap and AP1 are submatrices of coefficients showing the input of P sector’s products in the P and S sectors, respectively, and AS1 and AS are submatrices of coefficients showing the input of S sector’s products in P and S sectors, respectively. Ap and AS are squares submatrices having the order l×l and m×m respectively, and AP1 and AS1 are rectangular submatrices having the order l×m and m×l respectively.
Since the n×n Leontief inverse matrix
5
�∗ � �� � ���� (2) shows us only the total ultimate effects but not the disjointed interdependence of the above two activities, we must introduce some device consisting of partitioned matrix multiplier. To solve this problem, Miyazawa decomposed the elements of the Leontief inverse into three sides of the propagation aspects:
(a) internal propagation activities inside P sector’s industries, (b) internal propagation activities inside S sector’s industries, (c) intersectoral propagation activities between P and S sectors’ industries.
For aspects (a) and (b), we will show the internal matrix multiplier of the P sector that has order (l × l) � � �� � ����� (3)
and the internal matrix multiplier of the S sector that has order (m × m):
� � �� � ����� (4) Of course, each internal matrix multiplier does not operate interdependently under its own power, but is able to operate with the other sector’s industrial activity.
The intersectoral propagation activities between the P and S sectors’ industries can be written as the form of four rectangular sub-matrix-multipliers, which express aspect (c), that is, B1 = AS1B: S-goods input in P sector induced by internal propagation in P sector’s industries (m × l). B2 = BAP1: internal propagation in P sector’s industries induced by P-goods input in S sector (l × m). T1 = AP1T: P-goods-input in S sector’s induced by internal propagation in S sector’s industries (l × m). T2 = TAS1: internal propagation in S sector’s industries induced by S-goods input in P sector (m × l). Such a repercussion process due to these induced effects naturally leads to the intersectoral multiplier between the P and S sectors. If we selected the coefficients of the induced effect on production (i.e., B2 and T2) as the base of this intersectoral multiplier, then it will take the form
� � �� � ������� (5)
(2)
shows us only the total ultimate effects but not the disjointed interdependence of the above two activities, we must introduce some device consisting of partitioned matrix multiplier. To solve this problem, Miyazawa decomposed the elements of the Leontief inverse into three sides of the propagation aspects:(a) internal propagation activities inside P sector’s industries,(b) internal propagation activities inside S sector’s industries,(c) intersectoral propagation activities between P and S sectors’ industries.For aspects (a) and (b), we will show the internal matrix multiplier of the P sector that has
order (l×l)
5
�∗ � �� � ���� (2) shows us only the total ultimate effects but not the disjointed interdependence of the above two activities, we must introduce some device consisting of partitioned matrix multiplier. To solve this problem, Miyazawa decomposed the elements of the Leontief inverse into three sides of the propagation aspects:
(a) internal propagation activities inside P sector’s industries, (b) internal propagation activities inside S sector’s industries, (c) intersectoral propagation activities between P and S sectors’ industries.
For aspects (a) and (b), we will show the internal matrix multiplier of the P sector that has order (l × l) � � �� � ����� (3)
and the internal matrix multiplier of the S sector that has order (m × m):
� � �� � ����� (4) Of course, each internal matrix multiplier does not operate interdependently under its own power, but is able to operate with the other sector’s industrial activity.
The intersectoral propagation activities between the P and S sectors’ industries can be written as the form of four rectangular sub-matrix-multipliers, which express aspect (c), that is, B1 = AS1B: S-goods input in P sector induced by internal propagation in P sector’s industries (m × l). B2 = BAP1: internal propagation in P sector’s industries induced by P-goods input in S sector (l × m). T1 = AP1T: P-goods-input in S sector’s induced by internal propagation in S sector’s industries (l × m). T2 = TAS1: internal propagation in S sector’s industries induced by S-goods input in P sector (m × l). Such a repercussion process due to these induced effects naturally leads to the intersectoral multiplier between the P and S sectors. If we selected the coefficients of the induced effect on production (i.e., B2 and T2) as the base of this intersectoral multiplier, then it will take the form
� � �� � ������� (5)
(3)
and the internal matrix multiplier of the S sector that has order (m×m):
5
�∗ � �� � ���� (2) shows us only the total ultimate effects but not the disjointed interdependence of the above two activities, we must introduce some device consisting of partitioned matrix multiplier. To solve this problem, Miyazawa decomposed the elements of the Leontief inverse into three sides of the propagation aspects:
(a) internal propagation activities inside P sector’s industries, (b) internal propagation activities inside S sector’s industries, (c) intersectoral propagation activities between P and S sectors’ industries.
For aspects (a) and (b), we will show the internal matrix multiplier of the P sector that has order (l × l) � � �� � ����� (3)
and the internal matrix multiplier of the S sector that has order (m × m):
� � �� � ����� (4) Of course, each internal matrix multiplier does not operate interdependently under its own power, but is able to operate with the other sector’s industrial activity.
The intersectoral propagation activities between the P and S sectors’ industries can be written as the form of four rectangular sub-matrix-multipliers, which express aspect (c), that is, B1 = AS1B: S-goods input in P sector induced by internal propagation in P sector’s industries (m × l). B2 = BAP1: internal propagation in P sector’s industries induced by P-goods input in S sector (l × m). T1 = AP1T: P-goods-input in S sector’s induced by internal propagation in S sector’s industries (l × m). T2 = TAS1: internal propagation in S sector’s industries induced by S-goods input in P sector (m × l). Such a repercussion process due to these induced effects naturally leads to the intersectoral multiplier between the P and S sectors. If we selected the coefficients of the induced effect on production (i.e., B2 and T2) as the base of this intersectoral multiplier, then it will take the form
� � �� � ������� (5)
(4)
Of course, each internal matrix multiplier does not operate interdependently under its own power, but is able to operate with the other sector’s industrial activity.
The intersectoral propagation activities between the P and S sectors’ industries can be written as the form of four rectangular sub-matrix-multipliers, which express aspect (c), that is,
B1 = AS1B: S-goods input in P sector induced by internal propagation in P sector’s industries (m ×l ).
B2 = BAP1: internal propagation in P sector’s industries induced by P-goods input in S sector (l ×m).
T1 = AP1T: P-goods-input in S sector’s induced by internal propagation in S sector’s industries (l ×m).
弘前大学大学院地域社会研究科年報 第 9 号
− 26 −
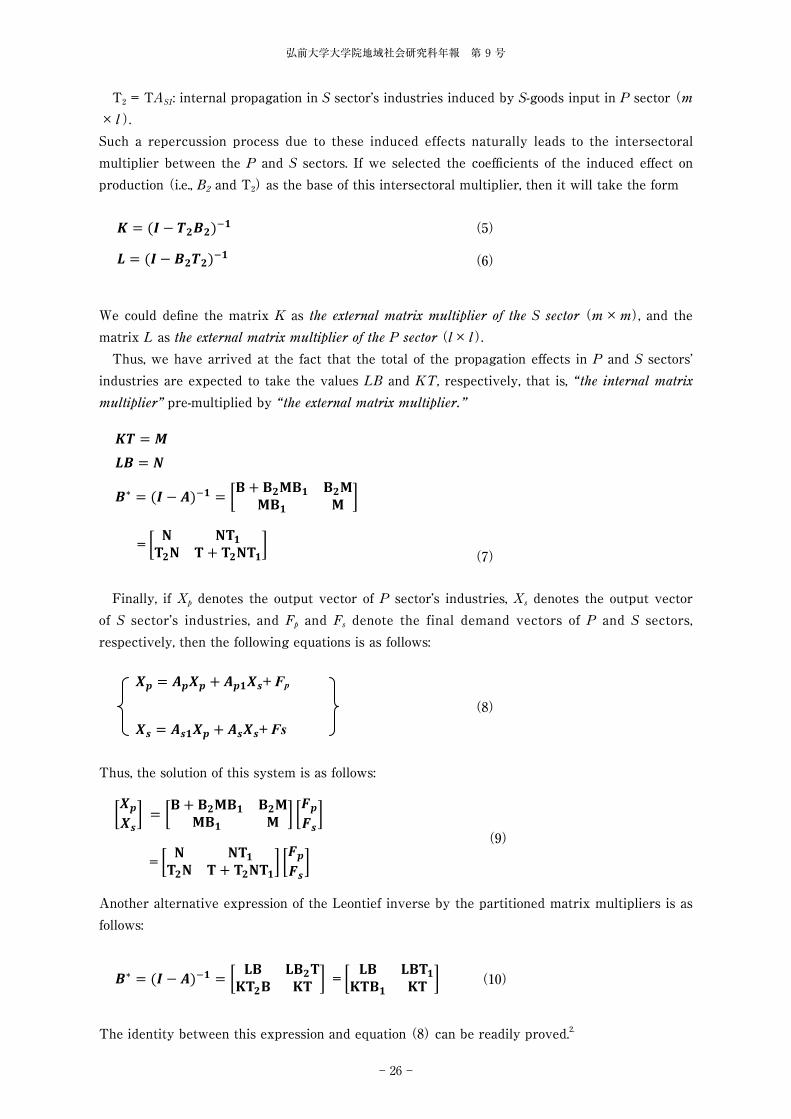
T2 = TAS1: internal propagation in S sector’s industries induced by S-goods input in P sector (m ×l ).Such a repercussion process due to these induced effects naturally leads to the intersectoral multiplier between the P and S sectors. If we selected the coefficients of the induced effect on production (i.e., B2 and T2) as the base of this intersectoral multiplier, then it will take the form
5
�∗ � �� � ���� (2) shows us only the total ultimate effects but not the disjointed interdependence of the above two activities, we must introduce some device consisting of partitioned matrix multiplier. To solve this problem, Miyazawa decomposed the elements of the Leontief inverse into three sides of the propagation aspects:
(a) internal propagation activities inside P sector’s industries, (b) internal propagation activities inside S sector’s industries, (c) intersectoral propagation activities between P and S sectors’ industries.
For aspects (a) and (b), we will show the internal matrix multiplier of the P sector that has order (l × l) � � �� � ����� (3)
and the internal matrix multiplier of the S sector that has order (m × m):
� � �� � ����� (4) Of course, each internal matrix multiplier does not operate interdependently under its own power, but is able to operate with the other sector’s industrial activity.
The intersectoral propagation activities between the P and S sectors’ industries can be written as the form of four rectangular sub-matrix-multipliers, which express aspect (c), that is, B1 = AS1B: S-goods input in P sector induced by internal propagation in P sector’s industries (m × l). B2 = BAP1: internal propagation in P sector’s industries induced by P-goods input in S sector (l × m). T1 = AP1T: P-goods-input in S sector’s induced by internal propagation in S sector’s industries (l × m). T2 = TAS1: internal propagation in S sector’s industries induced by S-goods input in P sector (m × l). Such a repercussion process due to these induced effects naturally leads to the intersectoral multiplier between the P and S sectors. If we selected the coefficients of the induced effect on production (i.e., B2 and T2) as the base of this intersectoral multiplier, then it will take the form
� � �� � ������� (5) (5)
6
� � �� � ������� (6) We could define the matrix K as the external matrix multiplier of the S sector (m × m), and the matrix L as the external matrix multiplier of the P sector (l × l).
Thus, we have arrived at the fact that the total of the propagation effects in P and S sectors’ industries are expected to take the values LB and KT, respectively, that is, “the internal matrix multiplier” pre-multiplied by “the external matrix multiplier.”
�� � � �� � �
�∗ � �� � ���� � �� � ����� ������ � �
=� � ������ � � ������ (7)
Finally, if Xp denotes the output vector of P sector’s industries, Xs denotes the output vector
of S sector’s industries, and Fp and Fs denote the final demand vectors of P and S sectors, respectively, then the following equations is as follows: �� � ���� � �����+ Fp
(8) �� � ����� � ����+ Fs
Thus, the solution of this system is as follows:
������ � �� � ����� ������ � � ������ (9)
=� � ������ � � ������ �
�����
Another alternative expression of the Leontief inverse by the partitioned matrix multipliers is as follows:
�∗ � �� � ���� � � �� �������� �� � =� �� ����
���� �� � (10)
(6)
We could define the matrix K as the external matrix multiplier of the S sector (m×m), and the matrix L as the external matrix multiplier of the P sector (l×l).
Thus, we have arrived at the fact that the total of the propagation effects in P and S sectors’ industries are expected to take the values LB and KT, respectively, that is, “the internal matrix multiplier” pre-multiplied by “the external matrix multiplier.”
6
� � �� � ������� (6) We could define the matrix K as the external matrix multiplier of the S sector (m × m), and the matrix L as the external matrix multiplier of the P sector (l × l).
Thus, we have arrived at the fact that the total of the propagation effects in P and S sectors’ industries are expected to take the values LB and KT, respectively, that is, “the internal matrix multiplier” pre-multiplied by “the external matrix multiplier.”
�� � � �� � �
�∗ � �� � ���� � �� � ����� ������ � �
=� � ������ � � ������ (7)
Finally, if Xp denotes the output vector of P sector’s industries, Xs denotes the output vector
of S sector’s industries, and Fp and Fs denote the final demand vectors of P and S sectors, respectively, then the following equations is as follows: �� � ���� � �����+ Fp
(8) �� � ����� � ����+ Fs
Thus, the solution of this system is as follows:
������ � �� � ����� ������ � � ������ (9)
=� � ������ � � ������ �
�����
Another alternative expression of the Leontief inverse by the partitioned matrix multipliers is as follows:
�∗ � �� � ���� � � �� �������� �� � =� �� ����
���� �� � (10)
(7)
Finally, if Xp denotes the output vector of P sector’s industries, Xs denotes the output vector of S sector’s industries, and Fp and Fs denote the final demand vectors of P and S sectors, respectively, then the following equations is as follows:
6
� � �� � ������� (6) We could define the matrix K as the external matrix multiplier of the S sector (m × m), and the matrix L as the external matrix multiplier of the P sector (l × l).
Thus, we have arrived at the fact that the total of the propagation effects in P and S sectors’ industries are expected to take the values LB and KT, respectively, that is, “the internal matrix multiplier” pre-multiplied by “the external matrix multiplier.”
�� � � �� � �
�∗ � �� � ���� � �� � ����� ������ � �
=� � ������ � � ������ (7)
Finally, if Xp denotes the output vector of P sector’s industries, Xs denotes the output vector
of S sector’s industries, and Fp and Fs denote the final demand vectors of P and S sectors, respectively, then the following equations is as follows: �� � ���� � �����+ Fp
(8) �� � ����� � ����+ Fs
Thus, the solution of this system is as follows:
������ � �� � ����� ������ � � ������ (9)
=� � ������ � � ������ �
�����
Another alternative expression of the Leontief inverse by the partitioned matrix multipliers is as follows:
�∗ � �� � ���� � � �� �������� �� � =� �� ����
���� �� � (10)
(8)
Thus, the solution of this system is as follows:
6
� � �� � ������� (6) We could define the matrix K as the external matrix multiplier of the S sector (m × m), and the matrix L as the external matrix multiplier of the P sector (l × l).
Thus, we have arrived at the fact that the total of the propagation effects in P and S sectors’ industries are expected to take the values LB and KT, respectively, that is, “the internal matrix multiplier” pre-multiplied by “the external matrix multiplier.”
�� � � �� � �
�∗ � �� � ���� � �� � ����� ������ � �
=� � ������ � � ������ (7)
Finally, if Xp denotes the output vector of P sector’s industries, Xs denotes the output vector
of S sector’s industries, and Fp and Fs denote the final demand vectors of P and S sectors, respectively, then the following equations is as follows: �� � ���� � �����+ Fp
(8) �� � ����� � ����+ Fs
Thus, the solution of this system is as follows:
������ � �� � ����� ������ � � ������ (9)
=� � ������ � � ������ �
�����
Another alternative expression of the Leontief inverse by the partitioned matrix multipliers is as follows:
�∗ � �� � ���� � � �� �������� �� � =� �� ����
���� �� � (10)
(9)
Another alternative expression of the Leontief inverse by the partitioned matrix multipliers is as follows:
6
� � �� � ������� (6) We could define the matrix K as the external matrix multiplier of the S sector (m × m), and the matrix L as the external matrix multiplier of the P sector (l × l).
Thus, we have arrived at the fact that the total of the propagation effects in P and S sectors’ industries are expected to take the values LB and KT, respectively, that is, “the internal matrix multiplier” pre-multiplied by “the external matrix multiplier.”
�� � � �� � �
�∗ � �� � ���� � �� � ����� ������ � �
=� � ������ � � ������ (7)
Finally, if Xp denotes the output vector of P sector’s industries, Xs denotes the output vector
of S sector’s industries, and Fp and Fs denote the final demand vectors of P and S sectors, respectively, then the following equations is as follows: �� � ���� � �����+ Fp
(8) �� � ����� � ����+ Fs
Thus, the solution of this system is as follows:
������ � �� � ����� ������ � � ������ (9)
=� � ������ � � ������ �
�����
Another alternative expression of the Leontief inverse by the partitioned matrix multipliers is as follows:
�∗ � �� � ���� � � �� �������� �� � =� �� ����
���� �� � (10) (10)
The identity between this expression and equation (8) can be readily proved.2.

The Analytical Survey and Empirical Study of Economic Impact of the Natural Disasters: Input-Output framework
− 27 −
III. The Analytical Method of the Economic Impacts on Natural Disasters
Okuyama, Sonis, and Hewings (1999) stated that Miyazawa’s concept of the interrelational income multiplier was designed to analyze the structure of income distribution by endogenizing consumption demands in the standard Leontief model and included that the income formation process has clear advantages for linking production with consumption processes (Okuyama, Sonis, and Hewings, 1999, p.115).
Miyazawa considered the following system:
7
The identity between this expression and equation (8) can be readily proved.2. III. The Analytical Method of the Economic Impacts on Natural Disasters Okuyama, Sonis, and Hewings (1999) stated that Miyazawa’s concept of the interrelational income multiplier was designed to analyze the structure of income distribution by endogenizing consumption demands in the standard Leontief model and included that the income formation process has clear advantages for linking production with consumption processes (Okuyama, Sonis, and Hewings, 1999, p.115).
Miyazawa considered the following system:
���� � �� | �� | ���
��� � ���� ����
where X is a vector coefficient output, Y is a vector of total income for some r-fold division of income groups, A is a block matrix of direct input coefficients, V is a matrix of value-added ratios, f is a vector of final demands except household consumption, and g is a vector of exogenous income for r-fold income groups. Solving this system yields
���� � ���� � ����� |������ | � ����� ����
where
B =�� � ���� is the Leontief inverse matrix, BC is a matrix of production induced by endogenous consumption, VB is a matrix of endogenous income earned from production,
L = VBC is a matrix of expenditures from endogenous income, and
K =�� � ���� is a matrix of the Miyazawa interrelational income multipliers. Sonis and Hewings (1993) extended this framework using the following perspective:
���� � ����� |������ | � ���|��|�� �
�|��|�� �
�|��|�� � � �|��
��|� � ��������
where
�� �� � � � ����� � ��� � ����� is an enlarged Leontief inverse. From (12) and (13), we get the following Miyazawa interrelational multiplier matrix:
(11)
where X is a vector coefficient output, Y is a vector of total income for some r-fold division of income groups, A is a block matrix of direct input coefficients, V is a matrix of value-added ratios, f is a vector of final demands except household consumption, and g is a vector of exogenous income for r-fold income groups. Solving this system yields
7
The identity between this expression and equation (8) can be readily proved.2. III. The Analytical Method of the Economic Impacts on Natural Disasters Okuyama, Sonis, and Hewings (1999) stated that Miyazawa’s concept of the interrelational income multiplier was designed to analyze the structure of income distribution by endogenizing consumption demands in the standard Leontief model and included that the income formation process has clear advantages for linking production with consumption processes (Okuyama, Sonis, and Hewings, 1999, p.115).
Miyazawa considered the following system:
���� � �� | �� | ���
��� � ���� ����
where X is a vector coefficient output, Y is a vector of total income for some r-fold division of income groups, A is a block matrix of direct input coefficients, V is a matrix of value-added ratios, f is a vector of final demands except household consumption, and g is a vector of exogenous income for r-fold income groups. Solving this system yields
���� � ���� � ����� |������ | � ����� ����
where
B =�� � ���� is the Leontief inverse matrix, BC is a matrix of production induced by endogenous consumption, VB is a matrix of endogenous income earned from production,
L = VBC is a matrix of expenditures from endogenous income, and
K =�� � ���� is a matrix of the Miyazawa interrelational income multipliers. Sonis and Hewings (1993) extended this framework using the following perspective:
���� � ����� |������ | � ���|��|�� �
�|��|�� �
�|��|�� � � �|��
��|� � ��������
where
�� �� � � � ����� � ��� � ����� is an enlarged Leontief inverse. From (12) and (13), we get the following Miyazawa interrelational multiplier matrix:
(12)
where
7
The identity between this expression and equation (8) can be readily proved.2. III. The Analytical Method of the Economic Impacts on Natural Disasters Okuyama, Sonis, and Hewings (1999) stated that Miyazawa’s concept of the interrelational income multiplier was designed to analyze the structure of income distribution by endogenizing consumption demands in the standard Leontief model and included that the income formation process has clear advantages for linking production with consumption processes (Okuyama, Sonis, and Hewings, 1999, p.115).
Miyazawa considered the following system:
���� � �� | �� | ���
��� � ���� ����
where X is a vector coefficient output, Y is a vector of total income for some r-fold division of income groups, A is a block matrix of direct input coefficients, V is a matrix of value-added ratios, f is a vector of final demands except household consumption, and g is a vector of exogenous income for r-fold income groups. Solving this system yields
���� � ���� � ����� |������ | � ����� ����
where
B =�� � ���� is the Leontief inverse matrix, BC is a matrix of production induced by endogenous consumption, VB is a matrix of endogenous income earned from production,
L = VBC is a matrix of expenditures from endogenous income, and
K =�� � ���� is a matrix of the Miyazawa interrelational income multipliers. Sonis and Hewings (1993) extended this framework using the following perspective:
���� � ����� |������ | � ���|��|�� �
�|��|�� �
�|��|�� � � �|��
��|� � ��������
where
�� �� � � � ����� � ��� � ����� is an enlarged Leontief inverse. From (12) and (13), we get the following Miyazawa interrelational multiplier matrix:
is the Leontief inverse matrix,
7
The identity between this expression and equation (8) can be readily proved.2. III. The Analytical Method of the Economic Impacts on Natural Disasters Okuyama, Sonis, and Hewings (1999) stated that Miyazawa’s concept of the interrelational income multiplier was designed to analyze the structure of income distribution by endogenizing consumption demands in the standard Leontief model and included that the income formation process has clear advantages for linking production with consumption processes (Okuyama, Sonis, and Hewings, 1999, p.115).
Miyazawa considered the following system:
���� � �� | �� | ���
��� � ���� ����
where X is a vector coefficient output, Y is a vector of total income for some r-fold division of income groups, A is a block matrix of direct input coefficients, V is a matrix of value-added ratios, f is a vector of final demands except household consumption, and g is a vector of exogenous income for r-fold income groups. Solving this system yields
���� � ���� � ����� |������ | � ����� ����
where
B =�� � ���� is the Leontief inverse matrix, BC is a matrix of production induced by endogenous consumption, VB is a matrix of endogenous income earned from production,
L = VBC is a matrix of expenditures from endogenous income, and
K =�� � ���� is a matrix of the Miyazawa interrelational income multipliers. Sonis and Hewings (1993) extended this framework using the following perspective:
���� � ����� |������ | � ���|��|�� �
�|��|�� �
�|��|�� � � �|��
��|� � ��������
where
�� �� � � � ����� � ��� � ����� is an enlarged Leontief inverse. From (12) and (13), we get the following Miyazawa interrelational multiplier matrix:
is a matrix of production induced by endogenous consumption,
7
The identity between this expression and equation (8) can be readily proved.2. III. The Analytical Method of the Economic Impacts on Natural Disasters Okuyama, Sonis, and Hewings (1999) stated that Miyazawa’s concept of the interrelational income multiplier was designed to analyze the structure of income distribution by endogenizing consumption demands in the standard Leontief model and included that the income formation process has clear advantages for linking production with consumption processes (Okuyama, Sonis, and Hewings, 1999, p.115).
Miyazawa considered the following system:
���� � �� | �� | ���
��� � ���� ����
where X is a vector coefficient output, Y is a vector of total income for some r-fold division of income groups, A is a block matrix of direct input coefficients, V is a matrix of value-added ratios, f is a vector of final demands except household consumption, and g is a vector of exogenous income for r-fold income groups. Solving this system yields
���� � ���� � ����� |������ | � ����� ����
where
B =�� � ���� is the Leontief inverse matrix, BC is a matrix of production induced by endogenous consumption, VB is a matrix of endogenous income earned from production,
L = VBC is a matrix of expenditures from endogenous income, and
K =�� � ���� is a matrix of the Miyazawa interrelational income multipliers. Sonis and Hewings (1993) extended this framework using the following perspective:
���� � ����� |������ | � ���|��|�� �
�|��|�� �
�|��|�� � � �|��
��|� � ��������
where
�� �� � � � ����� � ��� � ����� is an enlarged Leontief inverse. From (12) and (13), we get the following Miyazawa interrelational multiplier matrix:
is a matrix of endogenous income earned from production,
7
The identity between this expression and equation (8) can be readily proved.2. III. The Analytical Method of the Economic Impacts on Natural Disasters Okuyama, Sonis, and Hewings (1999) stated that Miyazawa’s concept of the interrelational income multiplier was designed to analyze the structure of income distribution by endogenizing consumption demands in the standard Leontief model and included that the income formation process has clear advantages for linking production with consumption processes (Okuyama, Sonis, and Hewings, 1999, p.115).
Miyazawa considered the following system:
���� � �� | �� | ���
��� � ���� ����
where X is a vector coefficient output, Y is a vector of total income for some r-fold division of income groups, A is a block matrix of direct input coefficients, V is a matrix of value-added ratios, f is a vector of final demands except household consumption, and g is a vector of exogenous income for r-fold income groups. Solving this system yields
���� � ���� � ����� |������ | � ����� ����
where
B =�� � ���� is the Leontief inverse matrix, BC is a matrix of production induced by endogenous consumption, VB is a matrix of endogenous income earned from production,
L = VBC is a matrix of expenditures from endogenous income, and
K =�� � ���� is a matrix of the Miyazawa interrelational income multipliers. Sonis and Hewings (1993) extended this framework using the following perspective:
���� � ����� |������ | � ���|��|�� �
�|��|�� �
�|��|�� � � �|��
��|� � ��������
where
�� �� � � � ����� � ��� � ����� is an enlarged Leontief inverse. From (12) and (13), we get the following Miyazawa interrelational multiplier matrix:
is a matrix of expenditures from endogenous income, and
7
The identity between this expression and equation (8) can be readily proved.2. III. The Analytical Method of the Economic Impacts on Natural Disasters Okuyama, Sonis, and Hewings (1999) stated that Miyazawa’s concept of the interrelational income multiplier was designed to analyze the structure of income distribution by endogenizing consumption demands in the standard Leontief model and included that the income formation process has clear advantages for linking production with consumption processes (Okuyama, Sonis, and Hewings, 1999, p.115).
Miyazawa considered the following system:
���� � �� | �� | ���
��� � ���� ����
where X is a vector coefficient output, Y is a vector of total income for some r-fold division of income groups, A is a block matrix of direct input coefficients, V is a matrix of value-added ratios, f is a vector of final demands except household consumption, and g is a vector of exogenous income for r-fold income groups. Solving this system yields
���� � ���� � ����� |������ | � ����� ����
where
B =�� � ���� is the Leontief inverse matrix, BC is a matrix of production induced by endogenous consumption, VB is a matrix of endogenous income earned from production,
L = VBC is a matrix of expenditures from endogenous income, and
K =�� � ���� is a matrix of the Miyazawa interrelational income multipliers. Sonis and Hewings (1993) extended this framework using the following perspective:
���� � ����� |������ | � ���|��|�� �
�|��|�� �
�|��|�� � � �|��
��|� � ��������
where
�� �� � � � ����� � ��� � ����� is an enlarged Leontief inverse. From (12) and (13), we get the following Miyazawa interrelational multiplier matrix:
is a matrix of the Miyazawa interrelational income multipliers.Sonis and Hewings (1993) extended this framework using the following perspective:
7
The identity between this expression and equation (8) can be readily proved.2. III. The Analytical Method of the Economic Impacts on Natural Disasters Okuyama, Sonis, and Hewings (1999) stated that Miyazawa’s concept of the interrelational income multiplier was designed to analyze the structure of income distribution by endogenizing consumption demands in the standard Leontief model and included that the income formation process has clear advantages for linking production with consumption processes (Okuyama, Sonis, and Hewings, 1999, p.115).
Miyazawa considered the following system:
���� � �� | �� | ���
��� � ���� ����
where X is a vector coefficient output, Y is a vector of total income for some r-fold division of income groups, A is a block matrix of direct input coefficients, V is a matrix of value-added ratios, f is a vector of final demands except household consumption, and g is a vector of exogenous income for r-fold income groups. Solving this system yields
���� � ���� � ����� |������ | � ����� ����
where
B =�� � ���� is the Leontief inverse matrix, BC is a matrix of production induced by endogenous consumption, VB is a matrix of endogenous income earned from production,
L = VBC is a matrix of expenditures from endogenous income, and
K =�� � ���� is a matrix of the Miyazawa interrelational income multipliers. Sonis and Hewings (1993) extended this framework using the following perspective:
���� � ����� |������ | � ���|��|�� �
�|��|�� �
�|��|�� � � �|��
��|� � ��������
where
�� �� � � � ����� � ��� � ����� is an enlarged Leontief inverse. From (12) and (13), we get the following Miyazawa interrelational multiplier matrix:
(13)
where
7
The identity between this expression and equation (8) can be readily proved.2. III. The Analytical Method of the Economic Impacts on Natural Disasters Okuyama, Sonis, and Hewings (1999) stated that Miyazawa’s concept of the interrelational income multiplier was designed to analyze the structure of income distribution by endogenizing consumption demands in the standard Leontief model and included that the income formation process has clear advantages for linking production with consumption processes (Okuyama, Sonis, and Hewings, 1999, p.115).
Miyazawa considered the following system:
���� � �� | �� | ���
��� � ���� ����
where X is a vector coefficient output, Y is a vector of total income for some r-fold division of income groups, A is a block matrix of direct input coefficients, V is a matrix of value-added ratios, f is a vector of final demands except household consumption, and g is a vector of exogenous income for r-fold income groups. Solving this system yields
���� � ���� � ����� |������ | � ����� ����
where
B =�� � ���� is the Leontief inverse matrix, BC is a matrix of production induced by endogenous consumption, VB is a matrix of endogenous income earned from production,
L = VBC is a matrix of expenditures from endogenous income, and
K =�� � ���� is a matrix of the Miyazawa interrelational income multipliers. Sonis and Hewings (1993) extended this framework using the following perspective:
���� � ����� |������ | � ���|��|�� �
�|��|�� �
�|��|�� � � �|��
��|� � ��������
where
�� �� � � � ����� � ��� � ����� is an enlarged Leontief inverse. From (12) and (13), we get the following Miyazawa interrelational multiplier matrix:
is an enlarged Leontief inverse. From (12) and (13), we get the following Miyazawa interrelational multiplier matrix:
8
� � � � �∆�����
The changes in direct input EA, consumption EC, and value added EV, of the system are presented by the following matrix:
� � ���|����|������
Then, after the calamity, equation (13) will become
� �|�� � ��|�� �
∆��� |��|� � �
�|� � ���|� � �
� � ∆��� |∆����� � ����� � ���∆���|� � �� � ���∆����� � ���� ����
where
B(E) =�� � � � ����� K(E) =�� � �� � ��������� � ������ �� � �� � ��� � ����
∆��� � �� � �� � ��� � �� � ����� � ������ � �� � � � �� � ����� � ��� � � � ����� � ∆������ (17) � �� � ∆�����∆ Consider the changes in the final demand resulting from the event df of the gross output dX and of the total income dY. If g, the exogenous income in (12), can be ignored, and by applying (16), the change in gross output is
�� � ∆����� � ��� � ∆� � � �∆��� � ∆�� � ∆����� (18)
�� � �� � ���∆����� � ��� � �∆� � ���� � ��∆��� � ∆�� � ��∆���� � �∆����� � ��∆����� where ��∆��� � ∆� is the effect from the changes in the enlarged Leontief inverse, ��∆���� is the effect from the changes in value added, �∆����� is the mixed effect from the value
(14)
The changes in direct input , consumption , and value added , of the system are presented by the following matrix:
8
� � � � �∆�����
The changes in direct input EA, consumption EC, and value added EV, of the system are presented by the following matrix:
� � ���|����|������
Then, after the calamity, equation (13) will become
� �|�� � ��|�� �
∆��� |��|� � �
�|� � ���|� � �
� � ∆��� |∆����� � ����� � ���∆���|� � �� � ���∆����� � ���� ����
where
B(E) =�� � � � ����� K(E) =�� � �� � ��������� � ������ �� � �� � ��� � ����
∆��� � �� � �� � ��� � �� � ����� � ������ � �� � � � �� � ����� � ��� � � � ����� � ∆������ (17) � �� � ∆�����∆ Consider the changes in the final demand resulting from the event df of the gross output dX and of the total income dY. If g, the exogenous income in (12), can be ignored, and by applying (16), the change in gross output is
�� � ∆����� � ��� � ∆� � � �∆��� � ∆�� � ∆����� (18)
�� � �� � ���∆����� � ��� � �∆� � ���� � ��∆��� � ∆�� � ��∆���� � �∆����� � ��∆����� where ��∆��� � ∆� is the effect from the changes in the enlarged Leontief inverse, ��∆���� is the effect from the changes in value added, �∆����� is the mixed effect from the value
(15)

弘前大学大学院地域社会研究科年報 第 9 号
− 28 −
Then, after the calamity, equation (13) will become
8
� � � � �∆�����
The changes in direct input EA, consumption EC, and value added EV, of the system are presented by the following matrix:
� � ���|����|������
Then, after the calamity, equation (13) will become
� �|�� � ��|�� �
∆��� |��|� � �
�|� � ���|� � �
� � ∆��� |∆����� � ����� � ���∆���|� � �� � ���∆����� � ���� ����
where
B(E) =�� � � � ����� K(E) =�� � �� � ��������� � ������ �� � �� � ��� � ����
∆��� � �� � �� � ��� � �� � ����� � ������ � �� � � � �� � ����� � ��� � � � ����� � ∆������ (17) � �� � ∆�����∆ Consider the changes in the final demand resulting from the event df of the gross output dX and of the total income dY. If g, the exogenous income in (12), can be ignored, and by applying (16), the change in gross output is
�� � ∆����� � ��� � ∆� � � �∆��� � ∆�� � ∆����� (18)
�� � �� � ���∆����� � ��� � �∆� � ���� � ��∆��� � ∆�� � ��∆���� � �∆����� � ��∆����� where ��∆��� � ∆� is the effect from the changes in the enlarged Leontief inverse, ��∆���� is the effect from the changes in value added, �∆����� is the mixed effect from the value
(16)
where
8
� � � � �∆�����
The changes in direct input EA, consumption EC, and value added EV, of the system are presented by the following matrix:
� � ���|����|������
Then, after the calamity, equation (13) will become
� �|�� � ��|�� �
∆��� |��|� � �
�|� � ���|� � �
� � ∆��� |∆����� � ����� � ���∆���|� � �� � ���∆����� � ���� ����
where
B(E) =�� � � � ����� K(E) =�� � �� � ��������� � ������ �� � �� � ��� � ����
∆��� � �� � �� � ��� � �� � ����� � ������ � �� � � � �� � ����� � ��� � � � ����� � ∆������ (17) � �� � ∆�����∆ Consider the changes in the final demand resulting from the event df of the gross output dX and of the total income dY. If g, the exogenous income in (12), can be ignored, and by applying (16), the change in gross output is
�� � ∆����� � ��� � ∆� � � �∆��� � ∆�� � ∆����� (18)
�� � �� � ���∆����� � ��� � �∆� � ���� � ��∆��� � ∆�� � ��∆���� � �∆����� � ��∆����� where ��∆��� � ∆� is the effect from the changes in the enlarged Leontief inverse, ��∆���� is the effect from the changes in value added, �∆����� is the mixed effect from the value
(17)
Consider the changes in the final demand resulting from the event df of the gross output dX and of the total income dY. If g, the exogenous income in (12), can be ignored, and by applying (16), the change in gross output is
8
� � � � �∆�����
The changes in direct input EA, consumption EC, and value added EV, of the system are presented by the following matrix:
� � ���|����|������
Then, after the calamity, equation (13) will become
� �|�� � ��|�� �
∆��� |��|� � �
�|� � ���|� � �
� � ∆��� |∆����� � ����� � ���∆���|� � �� � ���∆����� � ���� ����
where
B(E) =�� � � � ����� K(E) =�� � �� � ��������� � ������ �� � �� � ��� � ����
∆��� � �� � �� � ��� � �� � ����� � ������ � �� � � � �� � ����� � ��� � � � ����� � ∆������ (17) � �� � ∆�����∆ Consider the changes in the final demand resulting from the event df of the gross output dX and of the total income dY. If g, the exogenous income in (12), can be ignored, and by applying (16), the change in gross output is
�� � ∆����� � ��� � ∆� � � �∆��� � ∆�� � ∆����� (18)
�� � �� � ���∆����� � ��� � �∆� � ���� � ��∆��� � ∆�� � ��∆���� � �∆����� � ��∆����� where ��∆��� � ∆� is the effect from the changes in the enlarged Leontief inverse, ��∆���� is the effect from the changes in value added, �∆����� is the mixed effect from the value
(18)
8
� � � � �∆�����
The changes in direct input EA, consumption EC, and value added EV, of the system are presented by the following matrix:
� � ���|����|������
Then, after the calamity, equation (13) will become
� �|�� � ��|�� �
∆��� |��|� � �
�|� � ���|� � �
� � ∆��� |∆����� � ����� � ���∆���|� � �� � ���∆����� � ���� ����
where
B(E) =�� � � � ����� K(E) =�� � �� � ��������� � ������ �� � �� � ��� � ����
∆��� � �� � �� � ��� � �� � ����� � ������ � �� � � � �� � ����� � ��� � � � ����� � ∆������ (17) � �� � ∆�����∆ Consider the changes in the final demand resulting from the event df of the gross output dX and of the total income dY. If g, the exogenous income in (12), can be ignored, and by applying (16), the change in gross output is
�� � ∆����� � ��� � ∆� � � �∆��� � ∆�� � ∆����� (18)
�� � �� � ���∆����� � ��� � �∆� � ���� � ��∆��� � ∆�� � ��∆���� � �∆����� � ��∆����� where ��∆��� � ∆� is the effect from the changes in the enlarged Leontief inverse, ��∆���� is the effect from the changes in value added, �∆����� is the mixed effect from the value
(19)
where
8
� � � � �∆�����
The changes in direct input EA, consumption EC, and value added EV, of the system are presented by the following matrix:
� � ���|����|������
Then, after the calamity, equation (13) will become
� �|�� � ��|�� �
∆��� |��|� � �
�|� � ���|� � �
� � ∆��� |∆����� � ����� � ���∆���|� � �� � ���∆����� � ���� ����
where
B(E) =�� � � � ����� K(E) =�� � �� � ��������� � ������ �� � �� � ��� � ����
∆��� � �� � �� � ��� � �� � ����� � ������ � �� � � � �� � ����� � ��� � � � ����� � ∆������ (17) � �� � ∆�����∆ Consider the changes in the final demand resulting from the event df of the gross output dX and of the total income dY. If g, the exogenous income in (12), can be ignored, and by applying (16), the change in gross output is
�� � ∆����� � ��� � ∆� � � �∆��� � ∆�� � ∆����� (18)
�� � �� � ���∆����� � ��� � �∆� � ���� � ��∆��� � ∆�� � ��∆���� � �∆����� � ��∆����� where ��∆��� � ∆� is the effect from the changes in the enlarged Leontief inverse, ��∆���� is the effect from the changes in value added, �∆����� is the mixed effect from the value
is the effect from the changes in the enlarged Leontief inverse,
8
� � � � �∆�����
The changes in direct input EA, consumption EC, and value added EV, of the system are presented by the following matrix:
� � ���|����|������
Then, after the calamity, equation (13) will become
� �|�� � ��|�� �
∆��� |��|� � �
�|� � ���|� � �
� � ∆��� |∆����� � ����� � ���∆���|� � �� � ���∆����� � ���� ����
where
B(E) =�� � � � ����� K(E) =�� � �� � ��������� � ������ �� � �� � ��� � ����
∆��� � �� � �� � ��� � �� � ����� � ������ � �� � � � �� � ����� � ��� � � � ����� � ∆������ (17) � �� � ∆�����∆ Consider the changes in the final demand resulting from the event df of the gross output dX and of the total income dY. If g, the exogenous income in (12), can be ignored, and by applying (16), the change in gross output is
�� � ∆����� � ��� � ∆� � � �∆��� � ∆�� � ∆����� (18)
�� � �� � ���∆����� � ��� � �∆� � ���� � ��∆��� � ∆�� � ��∆���� � �∆����� � ��∆����� where ��∆��� � ∆� is the effect from the changes in the enlarged Leontief inverse, ��∆���� is the effect from the changes in value added, �∆����� is the mixed effect from the value
is the effect from the changes in value added,
8
� � � � �∆�����
The changes in direct input EA, consumption EC, and value added EV, of the system are presented by the following matrix:
� � ���|����|������
Then, after the calamity, equation (13) will become
� �|�� � ��|�� �
∆��� |��|� � �
�|� � ���|� � �
� � ∆��� |∆����� � ����� � ���∆���|� � �� � ���∆����� � ���� ����
where
B(E) =�� � � � ����� K(E) =�� � �� � ��������� � ������ �� � �� � ��� � ����
∆��� � �� � �� � ��� � �� � ����� � ������ � �� � � � �� � ����� � ��� � � � ����� � ∆������ (17) � �� � ∆�����∆ Consider the changes in the final demand resulting from the event df of the gross output dX and of the total income dY. If g, the exogenous income in (12), can be ignored, and by applying (16), the change in gross output is
�� � ∆����� � ��� � ∆� � � �∆��� � ∆�� � ∆����� (18)
�� � �� � ���∆����� � ��� � �∆� � ���� � ��∆��� � ∆�� � ��∆���� � �∆����� � ��∆����� where ��∆��� � ∆� is the effect from the changes in the enlarged Leontief inverse, ��∆���� is the effect from the changes in value added, �∆����� is the mixed effect from the value is the mixed effect from the value added
and final demand changes.Miyazawa’s internal and external multipliers were derived to partition the standard Leontief
inverse into the internal propagation activities and external propagation activities, respectively, for some strategic industries or regions.
Consider a two-region system represented by the following block structure:
9
added and final demand changes. Miyazawa’s internal and external multipliers were derived to partition the standard Leontief
inverse into the internal propagation activities and external propagation activities, respectively, for some strategic industries or regions.
Consider a two-region system represented by the following block structure:
� � � ����������������2��
whereA11 and �22 are intraregional matrices of direct inputs within the first and second region, and �12 and �21 are the interregional matrices representing direct input connections between regions 1 and 2. The standard Leontief inverse will have the following form:
� � �� � ���� � � ��������������
��21�
Miyazawa claimed that this standard Leontief inverse displays only the total ultimate effects of the economy, and introduced the decomposed elements of the Leontief inverse in order to separate the components of the two regions as follows:
�� � �� � ������;�� � �� � ������ (22)
where��and �� are the Miyazawa internal matrix multiplier for regions 1 and 2, respectively. With these internal matrix multipliers, interregional propagation activities will be shown as four rectangular sub-matrix multipliers as follows:
�� � ������ �� � ������2�� �� � ������ �� � ������2��
where�� is the matrix multiplier indicating input from region 1 to region 2 induced by internal propagation in region 1; �� is the matrix multiplier for internal propagation in region 1 to region 2 induced by internal propagation in region 2; �� is the matrix multiplier of input from region 1 to region 2 induced by internal propagation in region 2; and �� is the matrix multiplier for internal propagation in region 2 induced by transactions moving from region 2 to region 1. From these sub-matrix multipliers, the external matrix multipliers for the regions can be
derived as follows3:
(20)
where A11 and A22 are intraregional matrices of direct inputs within the first and second region, and A12 and A21 are the interregional matrices representing direct input connections between regions 1 and 2. The standard Leontief inverse will have the following form:
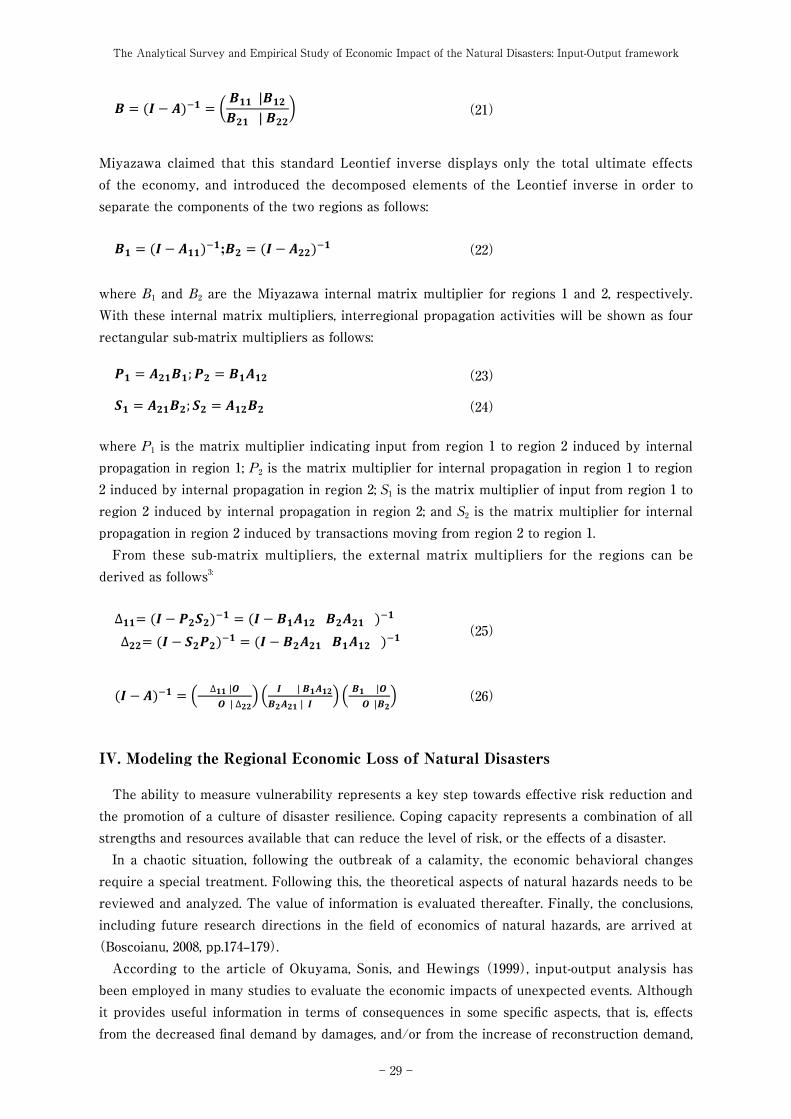
The Analytical Survey and Empirical Study of Economic Impact of the Natural Disasters: Input-Output framework
− 29 −
9
added and final demand changes. Miyazawa’s internal and external multipliers were derived to partition the standard Leontief
inverse into the internal propagation activities and external propagation activities, respectively, for some strategic industries or regions.
Consider a two-region system represented by the following block structure:
� � � ����������������2��
whereA11 and �22 are intraregional matrices of direct inputs within the first and second region, and �12 and �21 are the interregional matrices representing direct input connections between regions 1 and 2. The standard Leontief inverse will have the following form:
� � �� � ���� � � ��������������
��21�
Miyazawa claimed that this standard Leontief inverse displays only the total ultimate effects of the economy, and introduced the decomposed elements of the Leontief inverse in order to separate the components of the two regions as follows:
�� � �� � ������;�� � �� � ������ (22)
where��and �� are the Miyazawa internal matrix multiplier for regions 1 and 2, respectively. With these internal matrix multipliers, interregional propagation activities will be shown as four rectangular sub-matrix multipliers as follows:
�� � ������ �� � ������2�� �� � ������ �� � ������2��
where�� is the matrix multiplier indicating input from region 1 to region 2 induced by internal propagation in region 1; �� is the matrix multiplier for internal propagation in region 1 to region 2 induced by internal propagation in region 2; �� is the matrix multiplier of input from region 1 to region 2 induced by internal propagation in region 2; and �� is the matrix multiplier for internal propagation in region 2 induced by transactions moving from region 2 to region 1. From these sub-matrix multipliers, the external matrix multipliers for the regions can be
derived as follows3:
(21)
Miyazawa claimed that this standard Leontief inverse displays only the total ultimate effects of the economy, and introduced the decomposed elements of the Leontief inverse in order to separate the components of the two regions as follows:
9
added and final demand changes. Miyazawa’s internal and external multipliers were derived to partition the standard Leontief
inverse into the internal propagation activities and external propagation activities, respectively, for some strategic industries or regions.
Consider a two-region system represented by the following block structure:
� � � ����������������2��
whereA11 and �22 are intraregional matrices of direct inputs within the first and second region, and �12 and �21 are the interregional matrices representing direct input connections between regions 1 and 2. The standard Leontief inverse will have the following form:
� � �� � ���� � � ��������������
��21�
Miyazawa claimed that this standard Leontief inverse displays only the total ultimate effects of the economy, and introduced the decomposed elements of the Leontief inverse in order to separate the components of the two regions as follows:
�� � �� � ������;�� � �� � ������ (22)
where��and �� are the Miyazawa internal matrix multiplier for regions 1 and 2, respectively. With these internal matrix multipliers, interregional propagation activities will be shown as four rectangular sub-matrix multipliers as follows:
�� � ������ �� � ������2�� �� � ������ �� � ������2��
where�� is the matrix multiplier indicating input from region 1 to region 2 induced by internal propagation in region 1; �� is the matrix multiplier for internal propagation in region 1 to region 2 induced by internal propagation in region 2; �� is the matrix multiplier of input from region 1 to region 2 induced by internal propagation in region 2; and �� is the matrix multiplier for internal propagation in region 2 induced by transactions moving from region 2 to region 1. From these sub-matrix multipliers, the external matrix multipliers for the regions can be
derived as follows3:
(22)
where B1 and B2 are the Miyazawa internal matrix multiplier for regions 1 and 2, respectively. With these internal matrix multipliers, interregional propagation activities will be shown as four rectangular sub-matrix multipliers as follows:
9
added and final demand changes. Miyazawa’s internal and external multipliers were derived to partition the standard Leontief
inverse into the internal propagation activities and external propagation activities, respectively, for some strategic industries or regions.
Consider a two-region system represented by the following block structure:
� � � ����������������2��
whereA11 and �22 are intraregional matrices of direct inputs within the first and second region, and �12 and �21 are the interregional matrices representing direct input connections between regions 1 and 2. The standard Leontief inverse will have the following form:
� � �� � ���� � � ��������������
��21�
Miyazawa claimed that this standard Leontief inverse displays only the total ultimate effects of the economy, and introduced the decomposed elements of the Leontief inverse in order to separate the components of the two regions as follows:
�� � �� � ������;�� � �� � ������ (22)
where��and �� are the Miyazawa internal matrix multiplier for regions 1 and 2, respectively. With these internal matrix multipliers, interregional propagation activities will be shown as four rectangular sub-matrix multipliers as follows:
�� � ������ �� � ������2�� �� � ������ �� � ������2��
where�� is the matrix multiplier indicating input from region 1 to region 2 induced by internal propagation in region 1; �� is the matrix multiplier for internal propagation in region 1 to region 2 induced by internal propagation in region 2; �� is the matrix multiplier of input from region 1 to region 2 induced by internal propagation in region 2; and �� is the matrix multiplier for internal propagation in region 2 induced by transactions moving from region 2 to region 1. From these sub-matrix multipliers, the external matrix multipliers for the regions can be
derived as follows3:
(23)
9
added and final demand changes. Miyazawa’s internal and external multipliers were derived to partition the standard Leontief
inverse into the internal propagation activities and external propagation activities, respectively, for some strategic industries or regions.
Consider a two-region system represented by the following block structure:
� � � ����������������2��
whereA11 and �22 are intraregional matrices of direct inputs within the first and second region, and �12 and �21 are the interregional matrices representing direct input connections between regions 1 and 2. The standard Leontief inverse will have the following form:
� � �� � ���� � � ��������������
��21�
Miyazawa claimed that this standard Leontief inverse displays only the total ultimate effects of the economy, and introduced the decomposed elements of the Leontief inverse in order to separate the components of the two regions as follows:
�� � �� � ������;�� � �� � ������ (22)
where��and �� are the Miyazawa internal matrix multiplier for regions 1 and 2, respectively. With these internal matrix multipliers, interregional propagation activities will be shown as four rectangular sub-matrix multipliers as follows:
�� � ������ �� � ������2�� �� � ������ �� � ������2��
where�� is the matrix multiplier indicating input from region 1 to region 2 induced by internal propagation in region 1; �� is the matrix multiplier for internal propagation in region 1 to region 2 induced by internal propagation in region 2; �� is the matrix multiplier of input from region 1 to region 2 induced by internal propagation in region 2; and �� is the matrix multiplier for internal propagation in region 2 induced by transactions moving from region 2 to region 1. From these sub-matrix multipliers, the external matrix multipliers for the regions can be
derived as follows3:
(24)
where P1 is the matrix multiplier indicating input from region 1 to region 2 induced by internal propagation in region 1; P2 is the matrix multiplier for internal propagation in region 1 to region 2 induced by internal propagation in region 2; S1 is the matrix multiplier of input from region 1 to region 2 induced by internal propagation in region 2; and S2 is the matrix multiplier for internal propagation in region 2 induced by transactions moving from region 2 to region 1.
From these sub-matrix multipliers, the external matrix multipliers for the regions can be derived as follows3:
10
∆��� �� � ������� � �� � ����� ����� ��� (25) ∆��� �� � ������� � �� � ����� ����� ���
�� � ���� � � ∆������∆��
� ���������������� � ����
����� (26)
IV. Modeling the Regional Economic Loss of Natural Disasters
The ability to measure vulnerability represents a key step towards effective risk reduction and the promotion of a culture of disaster resilience. Coping capacity represents a combination of all strengths and resources available that can reduce the level of risk, or the effects of a disaster. In a chaotic situation, following the outbreak of a calamity, the economic behavioral changes require a special treatment. Following this, the theoretical aspects of natural hazards needs to be reviewed and analyzed. The value of information is evaluated thereafter. Finally, the conclusions, including future research directions in the field of economics of natural hazards, are arrived at (Boscoianu, 2008, pp.174–179).
According to the article of Okuyama, Sonis, and Hewings (1999), input-output analysis has been employed in many studies to evaluate the economic impacts of unexpected events. Although it provides useful information in terms of consequences in some specific aspects, that is, effects from the decreased final demand by damages, and/or from the increase of reconstruction demand, many of these studies have failed to take account of the interregional effects and the relationship between output production and income formation process in their analyses.4.
Yamano, Kajitani, and Shumuta (2004) examine the economic impacts of natural disasters by integrating district-level economic data and Japanese interregional input-output model. Their model deals with the direct and indirect output losses due to disruptions of electricity, damages of transport network, and decrease in economic demand. They compiled the 500 m district-level output and employment data to analyze the precise output losses. Numerical example of Hyogo prefecture shows that the indirect economic loss is much larger than the direct output loss in most districts. The damages on material manufacturers and business centers induce a greater economic loss to the suburban areas.
Okuyama (2003) observes that the concepts of risk and uncertainty have been used in disaster related literature, but they are used in an ambiguous concept. Knight (1921) had made the distinction between risk and uncertainty, while von Neumann and Morgenstern (1944) had advocated one of the ‘risk’ schools (Okuyama, 2003: 10). Savage (1954) had advocated expected utility function with subjective probabilities theory.
Davidson (1991) reconsidered the Knightian uncertainty as the only relevant form of
(25)
10
∆��� �� � ������� � �� � ����� ����� ��� (25) ∆��� �� � ������� � �� � ����� ����� ���
�� � ���� � � ∆������∆��
� ���������������� � ����
����� (26)
IV. Modeling the Regional Economic Loss of Natural Disasters
The ability to measure vulnerability represents a key step towards effective risk reduction and the promotion of a culture of disaster resilience. Coping capacity represents a combination of all strengths and resources available that can reduce the level of risk, or the effects of a disaster. In a chaotic situation, following the outbreak of a calamity, the economic behavioral changes require a special treatment. Following this, the theoretical aspects of natural hazards needs to be reviewed and analyzed. The value of information is evaluated thereafter. Finally, the conclusions, including future research directions in the field of economics of natural hazards, are arrived at (Boscoianu, 2008, pp.174–179).
According to the article of Okuyama, Sonis, and Hewings (1999), input-output analysis has been employed in many studies to evaluate the economic impacts of unexpected events. Although it provides useful information in terms of consequences in some specific aspects, that is, effects from the decreased final demand by damages, and/or from the increase of reconstruction demand, many of these studies have failed to take account of the interregional effects and the relationship between output production and income formation process in their analyses.4.
Yamano, Kajitani, and Shumuta (2004) examine the economic impacts of natural disasters by integrating district-level economic data and Japanese interregional input-output model. Their model deals with the direct and indirect output losses due to disruptions of electricity, damages of transport network, and decrease in economic demand. They compiled the 500 m district-level output and employment data to analyze the precise output losses. Numerical example of Hyogo prefecture shows that the indirect economic loss is much larger than the direct output loss in most districts. The damages on material manufacturers and business centers induce a greater economic loss to the suburban areas.
Okuyama (2003) observes that the concepts of risk and uncertainty have been used in disaster related literature, but they are used in an ambiguous concept. Knight (1921) had made the distinction between risk and uncertainty, while von Neumann and Morgenstern (1944) had advocated one of the ‘risk’ schools (Okuyama, 2003: 10). Savage (1954) had advocated expected utility function with subjective probabilities theory.
Davidson (1991) reconsidered the Knightian uncertainty as the only relevant form of
(26)
IV. Modeling the Regional Economic Loss of Natural Disasters
The ability to measure vulnerability represents a key step towards effective risk reduction and the promotion of a culture of disaster resilience. Coping capacity represents a combination of all strengths and resources available that can reduce the level of risk, or the effects of a disaster.
In a chaotic situation, following the outbreak of a calamity, the economic behavioral changes require a special treatment. Following this, the theoretical aspects of natural hazards needs to be reviewed and analyzed. The value of information is evaluated thereafter. Finally, the conclusions, including future research directions in the field of economics of natural hazards, are arrived at
(Boscoianu, 2008, pp.174‒179).According to the article of Okuyama, Sonis, and Hewings (1999), input-output analysis has
been employed in many studies to evaluate the economic impacts of unexpected events. Although it provides useful information in terms of consequences in some specific aspects, that is, effects from the decreased final demand by damages, and/or from the increase of reconstruction demand,
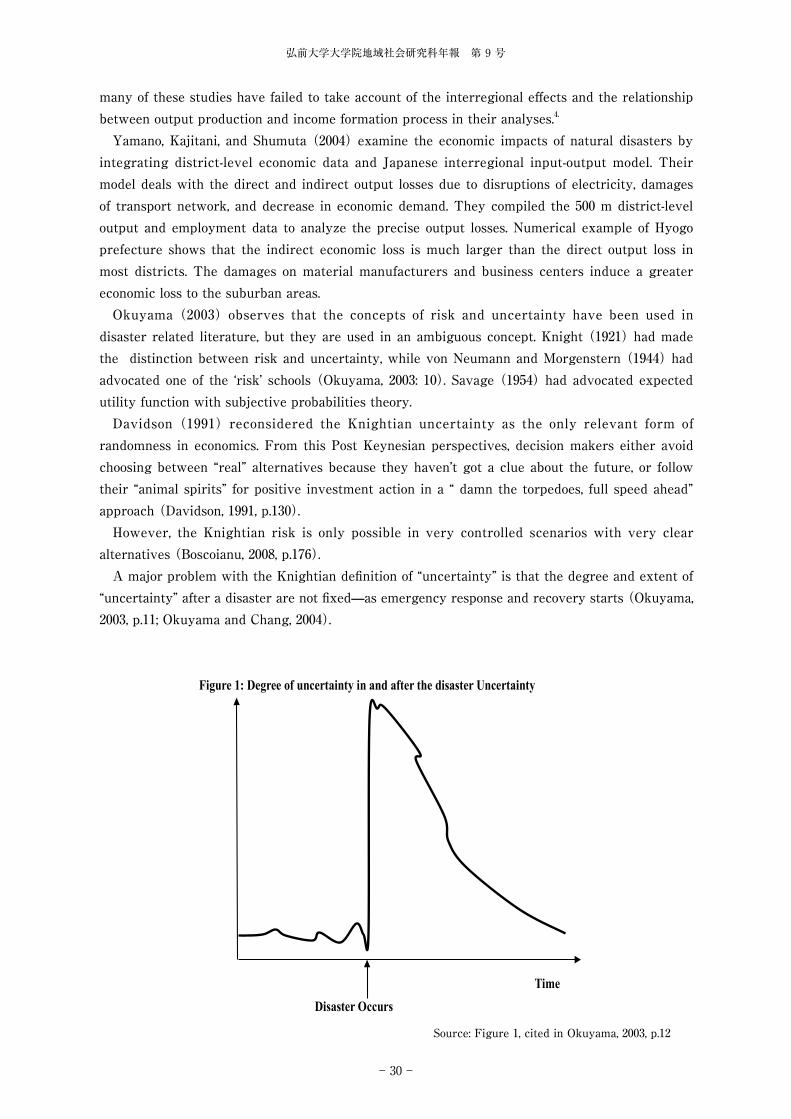
弘前大学大学院地域社会研究科年報 第 9 号
− 30 −
many of these studies have failed to take account of the interregional effects and the relationship between output production and income formation process in their analyses.4.
Yamano, Kajitani, and Shumuta (2004) examine the economic impacts of natural disasters by integrating district-level economic data and Japanese interregional input-output model. Their model deals with the direct and indirect output losses due to disruptions of electricity, damages of transport network, and decrease in economic demand. They compiled the 500 m district-level output and employment data to analyze the precise output losses. Numerical example of Hyogo prefecture shows that the indirect economic loss is much larger than the direct output loss in most districts. The damages on material manufacturers and business centers induce a greater economic loss to the suburban areas.
Okuyama (2003) observes that the concepts of risk and uncertainty have been used in disaster related literature, but they are used in an ambiguous concept. Knight (1921) had made the distinction between risk and uncertainty, while von Neumann and Morgenstern (1944) had advocated one of the ‘risk’ schools (Okuyama, 2003: 10). Savage (1954) had advocated expected utility function with subjective probabilities theory.
Davidson (1991) reconsidered the Knightian uncertainty as the only relevant form of randomness in economics. From this Post Keynesian perspectives, decision makers either avoid choosing between “real” alternatives because they haven’t got a clue about the future, or follow their “animal spirits” for positive investment action in a “ damn the torpedoes, full speed ahead” approach(Davidson, 1991, p.130).
However, the Knightian risk is only possible in very controlled scenarios with very clear alternatives (Boscoianu, 2008, p.176).
A major problem with the Knightian definition of “uncertainty” is that the degree and extent of “uncertainty” after a disaster are not fixed—as emergency response and recovery starts (Okuyama, 2003, p.11; Okuyama and Chang, 2004).
Figure 1: Degree of uncertainty in and after the disaster Uncertainty
Time Disaster Occurs
Source: Figure 1, cited in Okuyama, 2003, p.12

The Analytical Survey and Empirical Study of Economic Impact of the Natural Disasters: Input-Output framework
− 31 −
To simplify, let us consider the basic neo-classical model of the Solow-Swan (1956) type. We can denote the production function without technological progress, in intensive form
y = f(k). Let us denote saving rate s, capital depreciation δ , and population growth rate n as constant variables. The change in per capita capital stock over time is as follows:
k = dk/dt = s – f(k) – (n+δ)k (28)
Let us consider a steady state economy and a catastrophic shock without casualties in labor population. The per capita capital level decreases from the steady state level y* to the damaged level yd . The economy goes out of its steady state and yields a space (B- C) for the recovery. Because of the extra output allocated towards the reconstruction of damaged capital stocks, the recovery saving rate sr , may accelerate the speed of recovery (D- C > B- C). As the economy recovers, the recovery saving rate returns to the normal rate S (D goes to A).
Figure 2: Solow-Swan-type model and the dynamics of recovery after the disaster (n+δ)k f(k) y* srf(k) yd D sf(k) A B C kd k* k
Source: Figure 2, Okuyama 2003: p.15
The dynamics of recovery from a disaster can be expressed by introducing the growth rate k (B- C), which becomes zero due to the intersection to two lines,
sf(k)/k = (n+δ) (29)
V. Input-Output Analysis of the Great Earthquake5
Then we have to limit the analysis of decreasing production.Let us denote the direct damage ratio d (1 > d > 0). Now, let us denote the remaining
production ratio λ,λ = 1-d.
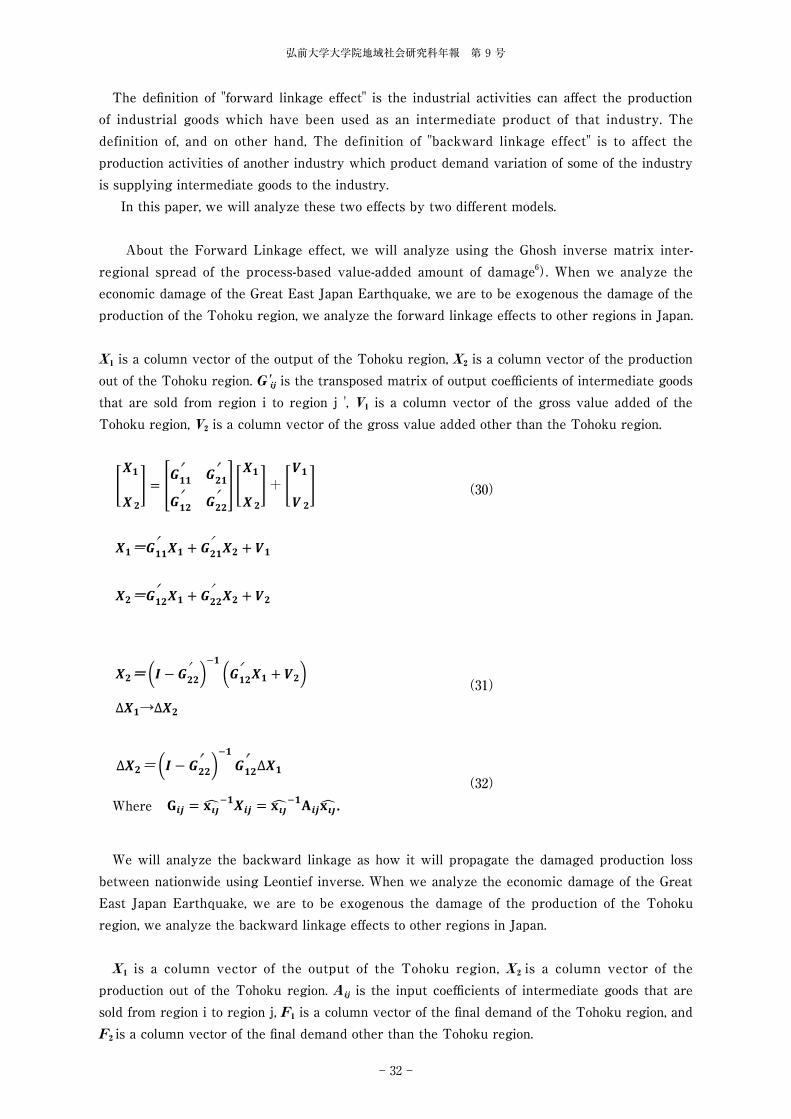
弘前大学大学院地域社会研究科年報 第 9 号
− 32 −
The definition of "forward linkage effect" is the industrial activities can affect the production of industrial goods which have been used as an intermediate product of that industry. The definition of, and on other hand, The definition of "backward linkage effect" is to affect the production activities of another industry which product demand variation of some of the industry is supplying intermediate goods to the industry.
In this paper, we will analyze these two effects by two different models.
About the Forward Linkage effect, we will analyze using the Ghosh inverse matrix inter-regional spread of the process-based value-added amount of damage6). When we analyze the economic damage of the Great East Japan Earthquake, we are to be exogenous the damage of the production of the Tohoku region, we analyze the forward linkage effects to other regions in Japan.
X1 is a column vector of the output of the Tohoku region, X2 is a column vector of the production out of the Tohoku region. G'ij is the transposed matrix of output coefficients of intermediate goods that are sold from region i to region j ', V1 is a column vector of the gross value added of the Tohoku region, V2 is a column vector of the gross value added other than the Tohoku region.
12
V. Input-Output Analysis of the Great Earthquake5 Then we have to limit the analysis of decreasing production.
Let us denote the direct damage ratio d (1 > d > 0). Now, let us denote the remaining production ratio λ,λ = 1 – d.
The definition of "forward linkage effect" is the industrial activities can affect the production of
industrial goods which have been used as an intermediate product of that industry. The definition of,
and on other hand, The definition of "backward linkage effect" is to affect the production activities
of another industry which product demand variation of some of the industry is supplying
intermediate goods to the industry.
In this paper, we will analyze these two effects by two different models.
About the Forward Linkage effect, we will analyze using the Ghosh inverse matrix inter-regional
spread of the process-based value-added amount of damage6). When we analyze the economic damage of the Great East Japan Earthquake, we are to be exogenous the damage of the production of the Tohoku region, we analyze the forward linkage effects to other regions in Japan. ��is a column vector of the output of the Tohoku region, �� is a column vector of the production out of the Tohoku region. ���� isthetransposed matrix of output coefficients of intermediate goods that are sold from region i to region j ', �� is a column vector of the gross value added of the Tohoku region,�� is a column vector of the gross value added other than the Tohoku region.
���
��� � ����
′ ���′
���′ ���
′� ���
���+ �
��
��� (30)
��=���′�� � ���
′�� � ��
��=���′�� � ���
′�� � ��
��= �� � ���′ �
������
′�� � ��� (31)
���→���
(30)
12
V. Input-Output Analysis of the Great Earthquake5 Then we have to limit the analysis of decreasing production.
Let us denote the direct damage ratio d (1 > d > 0). Now, let us denote the remaining production ratio λ,λ = 1 – d.
The definition of "forward linkage effect" is the industrial activities can affect the production of
industrial goods which have been used as an intermediate product of that industry. The definition of,
and on other hand, The definition of "backward linkage effect" is to affect the production activities
of another industry which product demand variation of some of the industry is supplying
intermediate goods to the industry.
In this paper, we will analyze these two effects by two different models.
About the Forward Linkage effect, we will analyze using the Ghosh inverse matrix inter-regional
spread of the process-based value-added amount of damage6). When we analyze the economic damage of the Great East Japan Earthquake, we are to be exogenous the damage of the production of the Tohoku region, we analyze the forward linkage effects to other regions in Japan. ��is a column vector of the output of the Tohoku region, �� is a column vector of the production out of the Tohoku region. ���� isthetransposed matrix of output coefficients of intermediate goods that are sold from region i to region j ', �� is a column vector of the gross value added of the Tohoku region,�� is a column vector of the gross value added other than the Tohoku region.
���
��� � ����
′ ���′
���′ ���
′� ���
���+ �
��
��� (30)
��=���′�� � ���
′�� � ��
��=���′�� � ���
′�� � ��
��= �� � ���′ �
������
′�� � ��� (31)
���→��� (31)
13
���= �� � ���′ �
�����′ ��� (32)
Where ��� � ��������� � ������������� .
We will analyze the backward linkage as how it will propagate the damaged production loss between nationwide using Leontief inverse. When we analyze the economic damage of the Great East Japan Earthquake, we are to be exogenous the damage of the production of the Tohoku region, we analyze the backward linkage effects to other regions in Japan.
��is a column vector of the output of the Tohoku region,��� is a column vector of the production out of the Tohoku region.���� is the input coefficients of intermediate goods that are sold from region i to region j,��� is a column vector of the final demand of the Tohoku region, and �� is a column vector of the final demand other than the Tohoku region.
���
��� � ���� ���
��� ���� ���
���+ �
��
��� (33)
��=����� � ����� � �� ��=����� � ����� � ��
��=�� � ������������ � ��� (34)
���→��� ���=�� � ����
�������� (35)
Where ��� � �������������. Ⅵ.Empirical Studies on the economic impact of the Great East Japan Earthquake
Calculating the share of the total number of employees in the stricken area counties, which output value of each industry in each prefecture (GRP in fiscal year 2008) calculated, it was estimated as the scale of damage.
Cabinet Office Government of Japan(2011) estimates the damaged stock of the Great east Japan Earthquake as table 1.
(32) Where
We will analyze the backward linkage as how it will propagate the damaged production loss between nationwide using Leontief inverse. When we analyze the economic damage of the Great East Japan Earthquake, we are to be exogenous the damage of the production of the Tohoku region, we analyze the backward linkage effects to other regions in Japan.
X1 is a column vector of the output of the Tohoku region, X2 is a column vector of the production out of the Tohoku region. Aij is the input coefficients of intermediate goods that are sold from region i to region j, F1 is a column vector of the final demand of the Tohoku region, and F2 is a column vector of the final demand other than the Tohoku region.
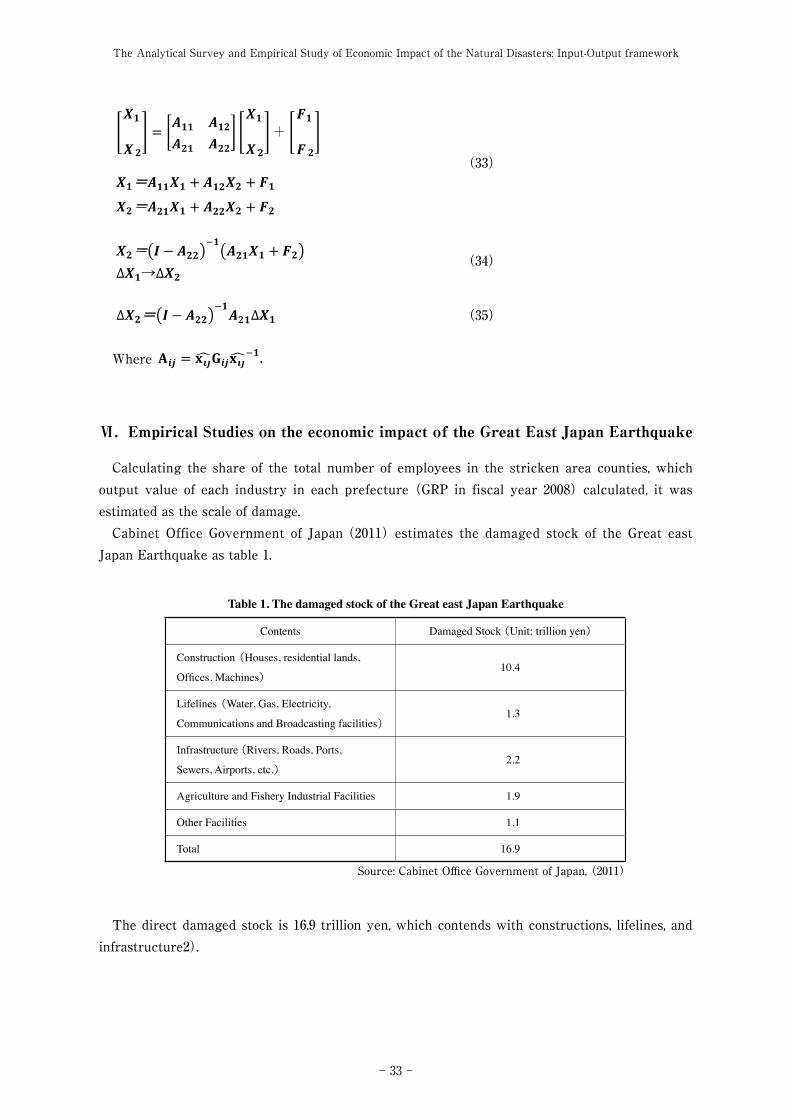
The Analytical Survey and Empirical Study of Economic Impact of the Natural Disasters: Input-Output framework
− 33 −
13
���= �� � ���′ �
�����′ ��� (32)
Where ��� � ��������� � ������������� .
We will analyze the backward linkage as how it will propagate the damaged production loss between nationwide using Leontief inverse. When we analyze the economic damage of the Great East Japan Earthquake, we are to be exogenous the damage of the production of the Tohoku region, we analyze the backward linkage effects to other regions in Japan.
��is a column vector of the output of the Tohoku region,��� is a column vector of the production out of the Tohoku region.���� is the input coefficients of intermediate goods that are sold from region i to region j,��� is a column vector of the final demand of the Tohoku region, and �� is a column vector of the final demand other than the Tohoku region.
���
��� � ���� ���
��� ���� ���
���+ �
��
��� (33)
��=����� � ����� � �� ��=����� � ����� � ��
��=�� � ������������ � ��� (34)
���→��� ���=�� � ����
�������� (35)
Where ��� � �������������. Ⅵ.Empirical Studies on the economic impact of the Great East Japan Earthquake
Calculating the share of the total number of employees in the stricken area counties, which output value of each industry in each prefecture (GRP in fiscal year 2008) calculated, it was estimated as the scale of damage.
Cabinet Office Government of Japan(2011) estimates the damaged stock of the Great east Japan Earthquake as table 1.
(33)
13
���= �� � ���′ �
�����′ ��� (32)
Where ��� � ��������� � ������������� .
We will analyze the backward linkage as how it will propagate the damaged production loss between nationwide using Leontief inverse. When we analyze the economic damage of the Great East Japan Earthquake, we are to be exogenous the damage of the production of the Tohoku region, we analyze the backward linkage effects to other regions in Japan.
��is a column vector of the output of the Tohoku region,��� is a column vector of the production out of the Tohoku region.���� is the input coefficients of intermediate goods that are sold from region i to region j,��� is a column vector of the final demand of the Tohoku region, and �� is a column vector of the final demand other than the Tohoku region.
���
��� � ���� ���
��� ���� ���
���+ �
��
��� (33)
��=����� � ����� � �� ��=����� � ����� � ��
��=�� � ������������ � ��� (34)
���→��� ���=�� � ����
�������� (35)
Where ��� � �������������. Ⅵ.Empirical Studies on the economic impact of the Great East Japan Earthquake
Calculating the share of the total number of employees in the stricken area counties, which output value of each industry in each prefecture (GRP in fiscal year 2008) calculated, it was estimated as the scale of damage.
Cabinet Office Government of Japan(2011) estimates the damaged stock of the Great east Japan Earthquake as table 1.
(34)
13
���= �� � ���′ �
�����′ ��� (32)
Where ��� � ��������� � ������������� .
We will analyze the backward linkage as how it will propagate the damaged production loss between nationwide using Leontief inverse. When we analyze the economic damage of the Great East Japan Earthquake, we are to be exogenous the damage of the production of the Tohoku region, we analyze the backward linkage effects to other regions in Japan.
��is a column vector of the output of the Tohoku region,��� is a column vector of the production out of the Tohoku region.���� is the input coefficients of intermediate goods that are sold from region i to region j,��� is a column vector of the final demand of the Tohoku region, and �� is a column vector of the final demand other than the Tohoku region.
���
��� � ���� ���
��� ���� ���
���+ �
��
��� (33)
��=����� � ����� � �� ��=����� � ����� � ��
��=�� � ������������ � ��� (34)
���→��� ���=�� � ����
�������� (35)
Where ��� � �������������. Ⅵ.Empirical Studies on the economic impact of the Great East Japan Earthquake
Calculating the share of the total number of employees in the stricken area counties, which output value of each industry in each prefecture (GRP in fiscal year 2008) calculated, it was estimated as the scale of damage.
Cabinet Office Government of Japan(2011) estimates the damaged stock of the Great east Japan Earthquake as table 1.
(35)
Where
13
���= �� � ���′ �
�����′ ��� (32)
Where ��� � ��������� � ������������� .
We will analyze the backward linkage as how it will propagate the damaged production loss between nationwide using Leontief inverse. When we analyze the economic damage of the Great East Japan Earthquake, we are to be exogenous the damage of the production of the Tohoku region, we analyze the backward linkage effects to other regions in Japan.
��is a column vector of the output of the Tohoku region,��� is a column vector of the production out of the Tohoku region.���� is the input coefficients of intermediate goods that are sold from region i to region j,��� is a column vector of the final demand of the Tohoku region, and �� is a column vector of the final demand other than the Tohoku region.
���
��� � ���� ���
��� ���� ���
���+ �
��
��� (33)
��=����� � ����� � �� ��=����� � ����� � ��
��=�� � ������������ � ��� (34)
���→��� ���=�� � ����
�������� (35)
Where ��� � �������������. Ⅵ.Empirical Studies on the economic impact of the Great East Japan Earthquake
Calculating the share of the total number of employees in the stricken area counties, which output value of each industry in each prefecture (GRP in fiscal year 2008) calculated, it was estimated as the scale of damage.
Cabinet Office Government of Japan(2011) estimates the damaged stock of the Great east Japan Earthquake as table 1.
Ⅵ.Empirical Studies on the economic impact of the Great East Japan Earthquake
Calculating the share of the total number of employees in the stricken area counties, which output value of each industry in each prefecture (GRP in fiscal year 2008) calculated, it was estimated as the scale of damage.
Cabinet Office Government of Japan(2011) estimates the damaged stock of the Great east Japan Earthquake as table 1.
Table 1. The damaged stock of the Great east Japan Earthquake
Contents Damaged Stock (Unit: trillion yen)
Construction(Houses, residential lands,
Offices, Machines)10.4
Lifelines(Water, Gas, Electricity,
Communications and Broadcasting facilities) 1.3
Infrastructure (Rivers, Roads, Ports,
Sewers, Airports, etc.) 2.2
Agriculture and Fishery Industrial Facilities 1.9
Other Facilities 1.1
Total 16.9
Source: Cabinet Office Government of Japan,(2011)
The direct damaged stock is 16.9 trillion yen, which contends with constructions, lifelines, and infrastructure2).
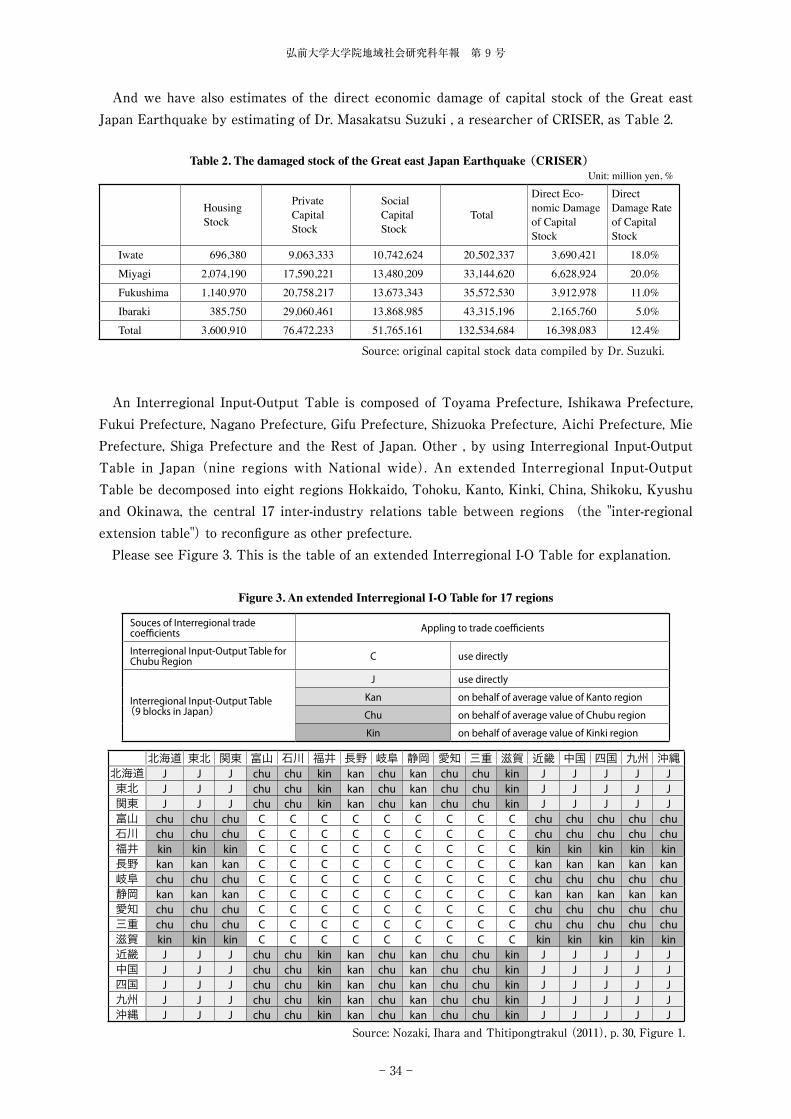
弘前大学大学院地域社会研究科年報 第 9 号
− 34 −
And we have also estimates of the direct economic damage of capital stock of the Great east Japan Earthquake by estimating of Dr. Masakatsu Suzuki , a researcher of CRISER, as Table 2.
Housing Stock
PrivateCapital Stock
Social Capital Stock
Total
Direct Eco-nomic Damage of Capital Stock
Direct Damage Rate of Capital Stock
Iwate 696,380 9,063,333 10,742,624 20,502,337 3,690,421 18.0%
Miyagi 2,074,190 17,590,221 13,480,209 33,144,620 6,628,924 20.0%
Fukushima 1,140,970 20,758,217 13,673,343 35,572,530 3,912,978 11.0%
Ibaraki 385,750 29,060,461 13,868,985 43,315,196 2,165,760 5.0%
Total 3,600,910 76,472,233 51,765,161 132,534,684 16,398,083 12.4%
Source: original capital stock data compiled by Dr. Suzuki.
Table 2. The damaged stock of the Great east Japan Earthquake(CRISER)Unit: million yen, %
An Interregional Input-Output Table is composed of Toyama Prefecture, Ishikawa Prefecture,
Fukui Prefecture, Nagano Prefecture, Gifu Prefecture, Shizuoka Prefecture, Aichi Prefecture, Mie Prefecture, Shiga Prefecture and the Rest of Japan. Other , by using Interregional Input-Output Table in Japan (nine regions with National wide). An extended Interregional Input-Output Table be decomposed into eight regions Hokkaido, Tohoku, Kanto, Kinki, China, Shikoku, Kyushu and Okinawa, the central 17 inter-industry relations table between regions (the "inter-regional extension table") to reconfigure as other prefecture.
Please see Figure 3. This is the table of an extended Interregional I-O Table for explanation.
Figure 3. An extended Interregional I-O Table for 17 regions
Souces of Interregional trade coe�cients Appling to trade coe�cients
Interregional Input-Output Table for Chubu Region C use directly
Interregional Input-Output Table(9 blocks in Japan)
J use directly
Kan on behalf of average value of Kanto region
Chu on behalf of average value of Chubu region
Kin on behalf of average value of Kinki region
北海道 東北 関東 富山 石川 福井 長野 岐阜 静岡 愛知 三重 滋賀 近畿 中国 四国 九州 沖縄北海道 J J J chu chu kin kan chu kan chu chu kin J J J J J東北 J J J chu chu kin kan chu kan chu chu kin J J J J J関東 J J J chu chu kin kan chu kan chu chu kin J J J J J富山 chu chu chu C C C C C C C C C chu chu chu chu chu石川 chu chu chu C C C C C C C C C chu chu chu chu chu福井 kin kin kin C C C C C C C C C kin kin kin kin kin長野 kan kan kan C C C C C C C C C kan kan kan kan kan岐阜 chu chu chu C C C C C C C C C chu chu chu chu chu静岡 kan kan kan C C C C C C C C C kan kan kan kan kan愛知 chu chu chu C C C C C C C C C chu chu chu chu chu三重 chu chu chu C C C C C C C C C chu chu chu chu chu滋賀 kin kin kin C C C C C C C C C kin kin kin kin kin近畿 J J J chu chu kin kan chu kan chu chu kin J J J J J中国 J J J chu chu kin kan chu kan chu chu kin J J J J J四国 J J J chu chu kin kan chu kan chu chu kin J J J J J九州 J J J chu chu kin kan chu kan chu chu kin J J J J J沖縄 J J J chu chu kin kan chu kan chu chu kin J J J J J
Source: Nozaki, Ihara and Thitipongtrakul (2011), p. 30, Figure 1.

The Analytical Survey and Empirical Study of Economic Impact of the Natural Disasters: Input-Output framework
− 35 −
On the four prefectures of Iwate Prefecture Miyagi, Fukushima, Ibaraki were greater scale of damage caused by earthquake and tsunami, to estimate the income loss affected areas of the municipality affected by the following method. Upon estimation, for the sake of simplicity, let us assume that damage of the earthquake that occurred in all the Tohoku region to do the calculations money transferred to the amount of damage in Ibaraki Prefecture.
① We estimate the number of employees by industry, municipal disaster, the ratio of employees in the economic census (small classification by prefecture). For selection of the municipality affected, out of the "specific local governments affected", was selected as reference information published municipal newspaper, suffered earthquake damage, the tsunami.
② The total production by citizens and industry by prefecture of economic calculation by multiplying the rate of employees and the rate of directly damage ratio stock on each prefecture to calculate the loss of income by industry.
Using the extended " Interregional Input-Output table", a direct impact on economic losses in the Tohoku make an estimate of indirect damage. Here, the affected municipalities have been assumed to identify the municipalities that are specified in the affected areas, production activities in the region has been stopped for one year.
The total loss of income of the damaged regions is about 1.097 trillion yen.
Iwate Miyagi Fukushima Ibaraki Total
Agriculture, Forestry, and Fisheries 1,810 10,003 5,207 645 17,666mining 341 121 151 90 703Coal mining, crude petroleum and natural gas 0 2 0 0 2Food and Beverage 11,011 31,323 7,372 2,149 51,900Textile products 1 10 7 1 19Wearing apparel and other textile products 41 102 33 10 187Timber and wooden products,Furniture and fixtures 1,924 3,923 1,877 291 8,014
Pulp, paper, paperboard, building paper 214 9,459 1,455 401 11,529Printing, plate making and book binding 315 6,977 752 270 8,314Chemical fertilizer 163 518 6,215 1,395 8,291Synthetic resins 99 143 132 257 631Final chemical products, n.e.c. 13 1,004 2,390 118 3,524Petroleum refinery products and Coal products 28 5,773 13 19 5,834Plastic products 851 3,407 1,147 577 5,982ceramic, stone and clay products 590 1,827 1,960 669 5,045iron or steel products 899 2,391 797 7,276 11,363Non-ferrous metal products 0 1,387 1,213 6,002 8,603Metal products 772 4,857 3,221 1,264 10,115general machines 2,769 4,187 3,960 12,143 23,058Machinery for office and service industry 0 244 492 374 1,110electronic components 422 1,398 429 3,725 5,974Other electronic components 0 966 103 130 1,200Household electronics equipment 0 99 179 2,948 3,226Communication machinery and devices 208 1,517 7,844 1,874 11,442Semiconductor devices and Integrated circuits 0 1,789 550 3,745 6,084Motor vehicle 13 847 3,370 798 5,028Other transportation equipment and repair of transportation equipment 4,406 3 342 72 4,823
Precision instruments 37 937 918 620 2,512Miscellaneous manufacturing products 402 1,872 967 217 3,458construction 10,281 35,844 12,001 4,567 62,694Electricity 2,075 6,840 33,497 3,682 46,094Gas and heat supply 372 3,922 1,523 279 6,096Water supply and Waste management service 1,861 12,964 7,069 1,114 23,008Commerce 13,076 101,127 15,664 6,644 136,511Finance and insurance 4,906 17,504 7,000 2,550 31,961Real estate agencies and rental services 17,535 93,083 18,121 9,741 138,480Transport 5,734 67,691 8,581 5,118 87,124Information services 107 4,700 809 3,536 9,153Other Information services 993 10,890 1,147 574 13,604Public administration 13,280 47,437 17,249 4,769 82,735Education and Research 174 3,354 859 2,536 6,924Other Public Services 5,035 55,763 14,821 5,659 81,278Goods rental and leasing services 733 4,473 778 208 6,192Other business services 2,715 11,268 5,865 2,295 22,143Personal services 20,515 66m883 17,047 9,733 114,177Activities not elsewhere classified 705 1,427 395 194 2,721Total 127,445 643,146 215,647 111,344 1,097,581
Table 4. The Loss of Income of the damaged regionsunit: million yen
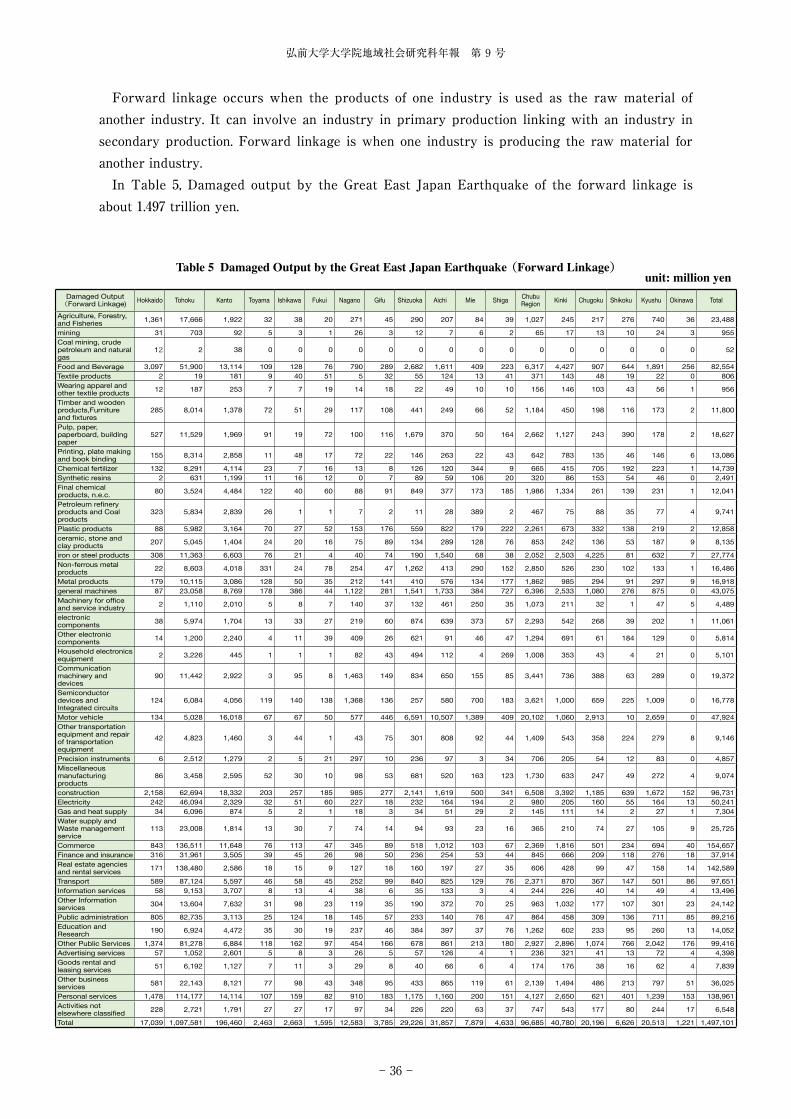
弘前大学大学院地域社会研究科年報 第 9 号
− 36 −
Forward linkage occurs when the products of one industry is used as the raw material of another industry. It can involve an industry in primary production linking with an industry in secondary production. Forward linkage is when one industry is producing the raw material for another industry.
In Table 5, Damaged output by the Great East Japan Earthquake of the forward linkage is about 1.497 trillion yen.
Damaged Output(Forward Linkage) Hokkaido Tohoku Kanto Toyama Ishikawa Fukui Nagano Gifu Shizuoka Aichi Mie Shiga Chubu
Region Kinki Chugoku Shikoku Kyushu Okinawa Total
Agriculture, Forestry, and Fisheries 1,361 17,666 1,922 32 38 20 271 45 290 207 84 39 1,027 245 217 276 740 36 23,488
mining 31 703 92 5 3 1 26 3 12 7 6 2 65 17 13 10 24 3 955Coal mining, crude petroleum and natural gas
12 2 38 0 0 0 0 0 0 0 0 0 0 0 0 0 0 0 52
Food and Beverage 3,097 51,900 13,114 109 128 76 790 289 2,682 1,611 409 223 6,317 4,427 907 644 1,891 256 82,554Textile products 2 19 181 9 40 51 5 32 55 124 13 41 371 143 48 19 22 0 806Wearing apparel and other textile products 12 187 253 7 7 19 14 18 22 49 10 10 156 146 103 43 56 1 956
Timber and wooden products,Furniture and fixtures
285 8,014 1,378 72 51 29 117 108 441 249 66 52 1,184 450 198 116 173 2 11,800
Pulp, paper, paperboard, building paper
527 11,529 1,969 91 19 72 100 116 1,679 370 50 164 2,662 1,127 243 390 178 2 18,627
Printing, plate making and book binding 155 8,314 2,858 11 48 17 72 22 146 263 22 43 642 783 135 46 146 6 13,086
Chemical fertilizer 132 8,291 4,114 23 7 16 13 8 126 120 344 9 665 415 705 192 223 1 14,739Synthetic resins 2 631 1,199 11 16 12 0 7 89 59 106 20 320 86 153 54 46 0 2,491Final chemical products, n.e.c. 80 3,524 4,484 122 40 60 88 91 849 377 173 185 1,986 1,334 261 139 231 1 12,041
Petroleum refinery products and Coal products
323 5,834 2,839 26 1 1 7 2 11 28 389 2 467 75 88 35 77 4 9,741
Plastic products 88 5,982 3,164 70 27 52 153 176 559 822 179 222 2,261 673 332 138 219 2 12,858ceramic, stone and clay products 207 5,045 1,404 24 20 16 75 89 134 289 128 76 853 242 136 53 187 9 8,135
iron or steel products 308 11,363 6,603 76 21 4 40 74 190 1,540 68 38 2,052 2,503 4,225 81 632 7 27,774Non-ferrous metal products 22 8,603 4,018 331 24 78 254 47 1,262 413 290 152 2,850 526 230 102 133 1 16,486
Metal products 179 10,115 3,086 128 50 35 212 141 410 576 134 177 1,862 985 294 91 297 9 16,918general machines 87 23,058 8,769 178 386 44 1,122 281 1,541 1,733 384 727 6,396 2,533 1,080 276 875 0 43,075Machinery for office and service industry 2 1,110 2,010 5 8 7 140 37 132 461 250 35 1,073 211 32 1 47 5 4,489
electronic components 38 5,974 1,704 13 33 27 219 60 874 639 373 57 2,293 542 268 39 202 1 11,061
Other electronic components 14 1,200 2,240 4 11 39 409 26 621 91 46 47 1,294 691 61 184 129 0 5,814
Household electronics equipment 2 3,226 445 1 1 1 82 43 494 112 4 269 1,008 353 43 4 21 0 5,101
Communication machinery and devices
90 11,442 2,922 3 95 8 1,463 149 834 650 155 85 3,441 736 388 63 289 0 19,372
Semiconductor devices and Integrated circuits
124 6,084 4,056 119 140 138 1,368 136 257 580 700 183 3,621 1,000 659 225 1,009 0 16,778
Motor vehicle 134 5,028 16,018 67 67 50 577 446 6,591 10,507 1,389 409 20,102 1,060 2,913 10 2,659 0 47,924Other transportation equipment and repair of transportation equipment
42 4,823 1,460 3 44 1 43 75 301 808 92 44 1,409 543 358 224 279 8 9,146
Precision instruments 6 2,512 1,279 2 5 21 297 10 236 97 3 34 706 205 54 12 83 0 4,857Miscellaneous manufacturing products
86 3,458 2,595 52 30 10 98 53 681 520 163 123 1,730 633 247 49 272 4 9,074
construction 2,158 62,694 18,332 203 257 185 985 277 2,141 1,619 500 341 6,508 3,392 1,185 639 1,672 152 96,731Electricity 242 46,094 2,329 32 51 60 227 18 232 164 194 2 980 205 160 55 164 13 50,241Gas and heat supply 34 6,096 874 5 2 1 18 3 34 51 29 2 145 111 14 2 27 1 7,304Water supply and Waste management service
113 23,008 1,814 13 30 7 74 14 94 93 23 16 365 210 74 27 105 9 25,725
Commerce 843 136,511 11,648 76 113 47 345 89 518 1,012 103 67 2,369 1,816 501 234 694 40 154,657Finance and insurance 316 31,961 3,505 39 45 26 98 50 236 254 53 44 845 666 209 118 276 18 37,914Real estate agencies and rental services 171 138,480 2,586 18 15 9 127 18 160 197 27 35 606 428 99 47 158 14 142,589
Transport 589 87,124 5,597 46 58 45 252 99 840 825 129 76 2,371 870 367 147 501 86 97,651Information services 58 9,153 3,707 8 13 4 38 6 35 133 3 4 244 226 40 14 49 4 13,496Other Information services 304 13,604 7,632 31 98 23 119 35 190 372 70 25 963 1,032 177 107 301 23 24,142
Public administration 805 82,735 3,113 25 124 18 145 57 233 140 76 47 864 458 309 136 711 85 89,216Education and Research 190 6,924 4,472 35 30 19 237 46 384 397 37 76 1,262 602 233 95 260 13 14,052
Other Public Services 1,374 81,278 6,884 118 162 97 454 166 678 861 213 180 2,927 2,896 1,074 766 2,042 176 99,416Advertising services 57 1,052 2,601 5 8 3 26 5 57 126 4 1 236 321 41 13 72 4 4,398Goods rental and leasing services 51 6,192 1,127 7 11 3 29 8 40 66 6 4 174 176 38 16 62 4 7,839
Other business services 581 22,143 8,121 77 98 43 348 95 433 865 119 61 2,139 1,494 486 213 797 51 36,025
Personal services 1,478 114,177 14,114 107 159 82 910 183 1,175 1,160 200 151 4,127 2,650 621 401 1,239 153 138,961Activities not elsewhere classified 228 2,721 1,791 27 27 17 97 34 226 220 63 37 747 543 177 80 244 17 6,548
Total 17,039 1,097,581 196,460 2,463 2,663 1,595 12,583 3,785 29,226 31,857 7,879 4,633 96,685 40,780 20,196 6,626 20,513 1,221 1,497,101
Table 5 Damaged Output by the Great East Japan Earthquake(Forward Linkage)unit: million yen

The Analytical Survey and Empirical Study of Economic Impact of the Natural Disasters: Input-Output framework
− 37 −
And Backward Linkage is the relationship between a firm or industry and the suppliers of its inputs, or raw materials. An increase in the output of the firm or industry is transmitted backward, yielding an increase in the demand for inputs. Development planners usually prefer to target industries with significant backward linkages, so that investments have additional multiplier effects in generating benefits for other sectors and in helping to further growth in input industries.
In Table 6, Damaged output by the Great East Japan Earthquake is about 4.952 trillion yen.
Damaged Output(Forward Linkage) Hokkaido Tohoku Kanto Toyama Ishikawa Fukui Nagano Gifu Shizuoka Aichi Mie Shiga Chubu
Region Kinki Chugoku Shikoku Kyushu Okinawa Total
Agriculture, Forestry, and Fisheries 17,632 17,666 13,555 325 122 79 3,531 289 5,393 1,476 480 268 11,962 2,258 2,970 5,023 8,943 186 80,195
mining 1,012 703 7,551 375 13 157 439 375 275 1,350 199 59 3,242 1,647 3,938 4,146 4,400 59 26,698Coal mining, crude petroleum and natural gas
18,156 2 78,211 466 45 45 1,445 33 182 5,678 0 34 7,928 7,163 12,206 3,665 3,050 758 131,140
Food and Beverage 10,735 51,900 28,065 127 65 26 2,418 443 12,577 3,820 515 785 20,775 6,814 2,258 1,652 5,210 126 127,536Textile products 48 19 3,268 320 949 1,811 73 1,212 1,028 3,630 209 1,048 10,280 2,580 1,313 501 213 5 18,228Wearing apparel and other textile products 387 187 4,167 69 29 174 91 272 152 1,031 67 63 1,946 1,569 1,695 279 558 2 10,789
Timber and wooden products,Furniture and fixtures
2,722 8,014 10,199 696 149 314 677 1,499 4,034 3,456 613 419 11,858 3,938 2,866 2,086 1,657 3 43,343
Pulp, paper, paperboard, building paper
7,990 11,529 16,943 1,721 59 711 403 2,135 17,248 3,459 442 1,429 27,606 9,369 4,031 6,869 2,267 6 86,610
Printing, plate making and book binding 785 8,314 29,059 162 326 122 1,157 240 2,374 2,947 204 409 7,940 4,545 1,102 399 1,284 13 53,441
Chemical fertilizer 2,771 8,291 71,336 1,380 145 582 242 395 3,024 3,597 12,086 592 22,043 13,013 25,445 5,232 6,692 18 154,842Synthetic resins 74 631 18,978 281 103 301 26 218 1,678 991 3,503 374 7,475 2,839 4,223 1,283 1,287 0 36,789Final chemical products, n.e.c. 1,099 3,524 47,820 3,614 369 907 639 1,496 10,981 5,378 2,862 2,808 29,055 15,409 4,679 2,514 4,803 2 108,906
Petroleum refinery products and Coal products
30,869 5,834 125,088 1,320 32 75 235 35 489 5,470 11,468 56 19,179 8,994 16,660 5,246 3,564 1,057 216,492
Plastic products 1,169 5,982 44,526 1,639 290 1,227 1,943 3,636 10,238 14,142 2,792 5,559 41,467 10,029 4,444 2,099 2,793 5 112,514ceramic, stone and clay products 2,625 5,045 13,636 451 157 311 655 1,631 1,107 4,126 1,918 1,669 12,025 3,435 2,546 1,039 3,389 6 43,747
iron or steel products 10,569 11,363 117,962 1,838 194 58 412 807 1,905 32,350 527 556 38,649 45,650 49,693 1,566 31,203 3 306,658Non-ferrous metal products 488 8,603 34,522 8,373 394 1,565 1,107 1,111 12,803 10,001 7,087 1,641 44,082 5,672 7,617 6,422 3,052 1 110,459
Metal products 3,521 10,115 40,538 3,611 451 641 3,422 3,920 6,740 9,978 2,728 3,267 34,758 16,230 4,262 1,846 3,264 9 114,542general machines 1,095 23,058 29,618 1,562 1,815 144 4,893 2,500 7,047 9,519 2,017 5,005 34,502 17,372 6,525 2,136 3,583 1 117,890Machinery for office and service industry 5 1,110 4,117 11 12 10 244 258 220 3,405 168 102 4,429 814 81 2 70 8 10,636
electronic components 258 5,974 6,048 121 178 131 1,377 770 6,106 4,533 3,480 339 17,037 2,521 553 115 849 0 33,354
Other electronic components 94 1,200 3,959 23 28 266 1,064 145 2,520 328 182 379 4,936 2,778 402 487 630 0 14,486
Household electronics equipment 38 3,226 850 3 0 1 151 203 1,009 253 7 961 2,588 1,291 78 12 34 0 8,118
Communication machinery and devices
55 11,442 2,258 3 394 828 67 779 798 129 166 2,812 882 314 42 147 0 17,952
Semiconductor devices and Integrated circuits
740 6,084 29,309 1,965 805 1,927 10,058 347 3,371 4,877 7,049 3,675 34,074 10,613 4,867 2,655 3,605 0 91,947
Motor vehicle 499 5,028 23,620 159 47 24 1,197 2,226 14,211 39,449 3,828 1,135 62,275 2,217 8,934 38 2,204 0 104,815Other transportation equipment and repair of transportation equipment
720 4,823 10,554 12 311 2 348 736 2,473 5,551 118 160 9,710 3,941 1,363 2,420 817 43 34,391
Precision instruments 52 2,512 2,351 4 7 49 696 19 1,031 274 17 96 2,192 772 328 105 482 0 8,794Miscellaneous manufacturing products
1,141 3,458 28,216 1,001 265 69 489 862 5,358 7,717 2,167 2,021 19,950 7,133 4,797 702 4,304 22 69,723
construction 1,114 62,694 17,244 289 94 175 876 199 2,066 1,565 586 243 6,093 3,831 1,083 388 1,028 18 93,494Electricity 3,873 46,094 22,045 1,055 640 2,981 8,939 808 13,433 3,822 1,605 36 33,318 4,743 4,929 1,731 3,022 50 119,805Gas and heat supply 100 6,096 5,516 21 11 7 38 25 218 3,540 187 20 4,067 2,328 194 48 118 1 18,469Water supply and Waste management service
634 23,008 7,461 155 69 72 718 462 1,236 1,123 345 264 4,443 2,091 871 288 607 15 39,419
Commerce 17,996 136,511 281,436 1,365 1,169 554 3,029 1,276 10,805 25,526 2,325 986 47,035 60,608 13,659 7,232 17,007 439 581,923Finance and insurance 6,467 31,961 82,525 947 390 406 1,755 1,402 7,227 5,628 1,680 897 20,333 13,787 4,716 3,360 4,858 194 168,201Real estate agencies and rental services 6,230 138,480 28,051 148 70 42 299 116 938 1,282 317 116 3,329 4,294 921 432 1,352 75 183,164
Transport 17,208 87,124 95,331 1,249 450 592 3,395 1,525 17,179 14,323 3,192 1,360 43,266 19,738 12,922 5,608 13,752 1,663 296,613Information services 341 9,153 109,501 111 130 43 893 63 1,280 1,260 84 33 3,898 2,360 402 132 425 26 126,237Other Information services 5,131 13,604 118,790 372 432 100 1,140 525 2,727 2,560 1,142 294 9,294 9,195 2,134 1,199 2,504 171 162,023
Public administration 296 82,735 2,686 57 17 16 110 84 373 210 146 41 1,053 517 201 107 256 7 87,858Education and Research 2,080 6,924 66,768 678 72 171 2,134 737 4,881 5,335 439 1,443 15,890 11,849 3,803 1,436 2,421 12 111,183
Other Public Services 671 81,278 2,010 65 21 17 104 88 247 231 92 76 941 356 397 221 459 35 86,367Advertising services 3,682 1,052 86,817 119 56 41 458 78 1,373 1,501 82 23 3,731 4,909 786 285 1,027 48 102,336Goods rental and leasing services 1,999 6,192 76,983 239 272 85 918 282 1,645 2,452 257 99 6,247 5,023 1,088 453 1,909 148 100,041
Other business services 9,264 22,143 144,142 841 354 419 3,539 873 6,932 8,883 1,359 629 23,831 18,781 4,782 1,817 4,805 125 229,690
Personal services 225 114,177 5,988 16 6 5 85 25 195 173 33 78 616 325 109 32 193 8 121,673Activities not elsewhere classified 1,415 2,721 13,328 285 66 85 544 424 2,587 1,412 593 217 6,213 2,598 1,050 550 1,116 34 29,024
Total 196,074 1,097,581 2,012,949 39,645 11,721 17,544 69,232 36,869 211,694 270,409 81,328 41,932 780,374 378,821 234,237 85,902 161,213 5,404 4,952,555
Table 6 Damaged Output by the Great East Japan Earthquake(Backward Linkage)unit: million yen
弘前大学大学院地域社会研究科年報 第 9 号
− 38 −
Ⅶ.Concluding Remarks
We surveyed the analytical approaches about the economic impacts on unscheduled natural disasters, and estimated the indirect economic damages of the Great East Japan Earthquake on March 11, 2011 by means of Interregional Input-Output table in Japan.
According to the article of Okuyama, Sonis and Hewings (1999), input-output analysis has been employed in many studies to evaluate economic impacts of unscheduled events. Although it provides useful information in terms of consequences in some specific aspects, i.e., effects from the decreased final demand by damages, and/or from the increase of reconstruction demand, many of these studies have failed to take account the interregional effects of impacts and the relationship between output production and income formation process in their analysis.
Yamano, Kajitani, and Shumuta (2004) examine the economic impacts of natural disasters by integrating district level economic data and Japanese interregional input-output model. Their model deals with the direct and indirect output losses due to the disruptions of electricity, damages of transport network, and the decrease in economic demand. They compiled the 500m district level output and employment data to analyze the precise output losses. Numerical example of Hyogo prefecture shows that the indirect economic loss is much larger than the direct output losses in most districts. The damages on material manufacturers and business center will induce a great economic loss compared to suburban area.
As Okuyama (2003) states, the concepts of risk and uncertainty have been used in the disaster related literature, but they are used to be in an ambiguous concept.
Calculating the share of the total number of employees in the stricken area counties, which output value of each industry in each prefecture (GRP in fiscal year 2008) calculated, it was estimated as the scale of damage.
ReferencesTsunenori Ashiya and Toshiki Jinushi(1999) “Estimating an Input-Output table for the economic impact study of
the Great Hanshin Awaji Earthquake,” Business Journal of PAPAIOS, 8(4): 6‒14.Tsunenori Ashiya and Toshiki Jinushi(2001) “The Great Earthquake and Structural change of Industrial
Classification”, The Kokumin Keizaigaku Zasshi, 183(1): 79‒97.Mircea Boscoianu(2008), “Emerging Research Directions for Modeling the Impact, Short Time Recuperation and
Long Term Recovery in the Case of Natural Hazards,” Environmental Problems and Development, 2008, pp.174‒179.
Cabinet Office Government of Japan,(2011), “On the estimates of the damaged stock of the Great east Japan Earthquake,” Cabinet Office Government of Japan(Disaster prevention), June 24, 2011.
Cochrane, Halord C.,(2004) “Indirect Losses from Natural Disasters: Measurement and Myth,” in chapter 3 of Yasuhide Okuyama and Stephanie E. Chang(edited), Modeling the Spatial and Economic Effencts of Disasters, New York, Springer.
Davidson, Paul, (1991) “Is Probability Theory Relevant for Uncertainty?: A Post Keynesian perspective”, Journal of Economic Perspectives, (1): pp.129‒43.
Toshitaka Katada, Yoshifumi Ishikawa, Shunji Kimura and Takashi Satou(2004), “A Study on the structure of damage to establishments by the heavy rainfall disaster in Tokai region”, Doboku Keikakugaku Kenkyu Ronbunshu, 29.
Nobuhiro Hosoe,(2011), “An Input-Output Analysis of Impact of Voluntary Self-restraint on the Recreation Industries,” GRIPS Discussion Paper 11‒04.
Yoshihisa Inada, Hiroaki Irie, Akihiro Shima and Takumi Toizumi,(2011), “Macroeconomic Impact of the damage by the Great east Japan earthquake: the complex damage of earthquake, Tsunami, and nuclear power generation”, (in Japanese), KISER REPORT.

The Analytical Survey and Empirical Study of Economic Impact of the Natural Disasters: Input-Output framework
− 39 −
Endnote1) Nozaki, Ihara and Thitipongtrakul(2011).2) Cabinet Office Government of Japan,(2011). And about the private and social capital stock from 1974-2008,
thanks for Dr. Suzuki, a researcher of Chubu Industrial and Regional Advancement Center.
Yoshifumi Ishikawa(2005) “Analysis of the Spatial Impacts of the Niigata Chuetsu Earthquake,” Doboku Keikakugaku Kenkyu Ronbunshu, 31.
Ministry of Economy, Trade and Industry(2005), An Inter-regional Input-Output Table in Japan.Knight, Frank H.,(1921) Risk, Uncertainty and Profit, 1964 reprint, New York, NY; August Kelley.Michiya Nozaki, Takeo Ihara and Nontachai Thitipongtrakul(2011), “How to Grasp the Economic Impact of the
Great East Japan Earthquake: An Influence for Chubu Region” (in Japanese), Business Journal of PAPAIOS Input-Output Analysis – Innovation & I-O Technique–, Vol.19, No.3.
Miyazawa, K.,(1976), Input-Output Analysis and the Structure of Income Distribution, Springer-Verlag.Yasuhide Okuyama, Michal Sonis and Geoffrey Hewings(1999), “Economic Impacts of an Unscheduled, Disruptive
Event: A Miyazawa Multiplier Analysis”, in Understanding and Interpreting Economic Structure, G.J.D. Hewings, M.Sonis, M.Madden and Y.Kimura(edited), Springer‒Verlag.
Yasuhide Okuyama(2003) “Economics of natural Disasters: A Critical Review”, Research Paper 2003–12, paper presented at the 50th North American Meeting, Regional Science Association International, November 20‒22, 2003, Philadelphia, PA.
Yasuhide Okuyama, Michal Sonis and Geoffrey Hewings, (2004) “Measuring Economic Impacts of Disasters: Interregional Input-Output Analysis Using Sequential Interindustry Model”, in chapter 5 of Yasuhide Okuyama and Stephanie E. Chang(edited), Modeling the Spatial and Economic Effencts of Disasters, New York, Springer.
Savage, L.J., (1954) The Foundations of Statistics, New York, NY; Dover.Shuntaro Shishido(supervised), PAPAIOS(edited), (2010), Handbook of Input-Output Analysis, Toyo keizai
shinpousha.Solow, Robert M.,(1956) “A Contribution to the Theory of Economic Growth,” Quarterly Journal of Economics, 70
(1): 65‒94.Swan, Trevor W., (1956) “Economic Growth and Capital Accumulation,” Economic Record, 32(November):
334‒361.von Neumann and O. Morgenstern (1944) The Theory of Games and Economic Behavior, Princeton, NJ; Princeton
University Press.Norihiko Yamano, Yoshio Kajitani, and Yoshiharu Shumuta(2004), “Modeling the Regional Economic Loss of
Natural Disasters: Indirect Loss Diffusion due to the Electricity Disruptions and Interindustry Economic Activities,” Regional Economic Applications Laboratory Discussion Paper, 2004, University of Illinois.

研 究 科 日 誌(2011年10月〜 2012年9月)
研究科日誌 (2011年10月~2012年9月)
− 43 −
研究科日誌(2011年10月~2012年9月)Chronology(Oct.2011-Sep.2012)
●地域社会研究会研究報告発表会
2012年度 第 1回研究報告発表会� 2012年 6 月30日(土)�場所:コラボ弘大 4 階 演習室
・「ビンテイジ・モデルによる借地借家法の研究と今後の研究の計画について」� 飯田清子(11期生地域産業研究湯講座)
2012年度 第 2回研究報告発表会� 2012年 7 月28日(土)�場所:総合教育棟101講義室
・「子どもの人間力を拓く「遊び」の可能性に関する実践学的研究」� 原子 純(11期生地域政策研究講座)
2012年度 第 3回研究報告発表会� 2012年 8 月25日(土)�場所:コラボ弘大 4 階 演習室
・「人間の生得的な行動特性に応じた道徳授業の研究-進化生物学の知見を基盤として-」� 鑓水 浩(11期生地域政策研究講座)
2012年度 第 4回研究報告発表会� 2012年 9 月22日(土)�場所:コラボ弘大 8 階 八甲田ホール
・「小学生のレジリエンスに関する研究」� 田中文夫(11期生地域政策研究講座)・「深浦町地域おこし協力隊の取り組みについて」� 山本大輔(深浦町職員)
●大学院地域社会研究科行事
八戸震災調査関連・ 4 月23日(月) 八戸市避難所調査報告会� 檜槇 貢、佐々木純一郎、平井太郎、丹野 正(弘大名誉教授)、大山祐太(10期生)・ 8 月28日(火)~30日(木) 八戸市被災調査� 石山晃子(10期生)・ 9 月28日(金)~30日(日) 八戸市被災調査� 檜槇 貢、佐々木純一郎、平井太郎、丹野 正(弘大名誉教授)� 大山祐太(10期生)、木村紀子(10期生)、竹ヶ原公(10期生)、鷲頭 豊(10期生)
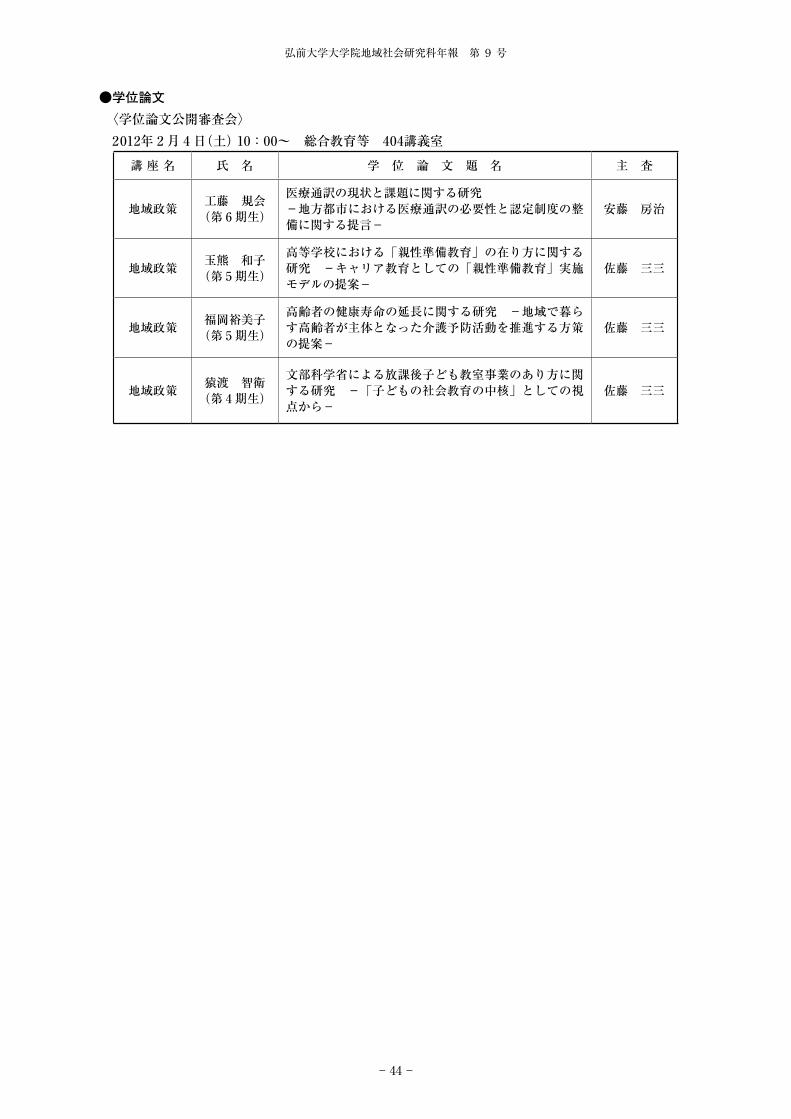
弘前大学大学院地域社会研究科年報 第 9 号
− 44 −
●学位論文 〈学位論文公開審査会〉 2012年 2 月 4 日(土)�10:00~ 総合教育等 404講義室
講�座�名 氏 名 学 位 論 文 題 名 主 査
地域政策 工藤 規会(第 6 期生)
医療通訳の現状と課題に関する研究-地方都市における医療通訳の必要性と認定制度の整備に関する提言-
安藤 房治
地域政策 玉熊 和子(第 5 期生)
高等学校における「親性準備教育」の在り方に関する研究 -キャリア教育としての「親性準備教育」実施モデルの提案-
佐藤 三三
地域政策 福岡裕美子(第 5 期生)
高齢者の健康寿命の延長に関する研究 -地域で暮らす高齢者が主体となった介護予防活動を推進する方策の提案-
佐藤 三三
地域政策 猿渡 智衛(第 4 期生)
文部科学省による放課後子ども教室事業のあり方に関する研究 -「子どもの社会教育の中核」としての視点から-
佐藤 三三
− 45 −
弘前大学大学院地域社会研究科年報 投稿要領平成20年9月制定
本年報は弘前大学大学院地域社会研究科によって発行される学術雑誌である。地域社会に関する研究成果を内外の研究者から広く募集し、その成果を掲載発表することにより、地域社会の発展に寄与することを目的とする。
1.発行時期年1回発行する(12月刊行予定)。
2.投稿締切投稿は随時とするが、当該年度内の本年報に掲載を希望する論文等の投稿締切日については年度
初めの原稿募集案内に明記している。3.カテゴリー
提出原稿は「論文」「研究ノート」「その他」という、三つのカテゴリーのいずれかを明示して提出する。
4.提出物○CDまたはUSB○ハードコピー(本研究科院生および外部投稿者は3部、本研究科修了者、研究科教員および編
集委員会が依頼した執筆者は1部)。※原稿は図表等のスペースを含めて日本語の場合は32,000字以内(A4用紙1枚につき1,600字、
計20頁)とする。ただし要旨の字数は含まない。※論文及び研究ノートの場合、いずれも英文300wordsの要旨・キーワード(4項目まで)と日
本語800字の要旨・キーワード(4項目まで)を含むこと。「その他」の場合は英文タイトルのみとし、投稿者の希望により英文300wordsの要旨と日本語800字の要旨を付すこともできる。
※原稿には投稿者の所属、肩書および連絡先(住所、電話・FAX番号、メールアドレス)を付記し、氏名にはフリガナとローマ字表記を添えること。
5.査読本研究科院生および外部投稿者により提出された原稿は、2名のレフェリーによる査読を経て、
編集委員会において採用の可否を決定する。6.校正
校正は原則として著者が行い、3校までとする。7.原稿
原稿は採用の可否にかかわらず返却しない。また掲載された論文等の抜刷りは50部まで無料である。8.Web上の公開に関する手続き
本年度に掲載される論文及び研究ノートはPDFファイルの形で、地域社会研究科のWeb上に公開する。ただし、著者の承諾が得られた論文及び研究ノートは、全内容を公開し、部分的に承諾が得られなかった論文及び研究ノートは、承諾を得られなかった箇所を除いて公開する。Web上に公開された論文及び研究ノートの著作権は、地域社会研究科に帰属する。
また、公開に伴いガード等が必要とされる事項については、編集委員会が対応・処理する。投稿者または投稿者の代表者は、投稿にあたって、「論文及び研究ノートのWeb公開に関する承諾書」(弘前大学大学院地域社会研究科、平成17年10月26日承認)に、署名・捺印し、意思表示を行うものとする。
9.原稿の提出先・連絡先〒036-8560 弘前大学文京町1番地 学務部教務課教務企画グループ電話:0172-39-3960(直通) E-mail:[email protected]
− 46 −
弘前大学大学院地域社会研究科年報 執筆要領平成20年9月制定
Ⅰ.全般的留意点
1.原則としてワードプロセッサーを使用して作成した原稿を提出する。2.原稿は横書きと縦書きの両方も可とする。
Ⅱ.本文
1.本文が始まる前にタイトル、氏名、要旨、キーワードの順に和文とその英訳を挿入する。タイトルは内容に即して平明・簡潔にする。
2.項目の区分について横書きでは(1) Ⅰ,Ⅱ,Ⅲ,・・・・・[節](2) 1,2,3,・・・・・[項]縦書きでは(1) 一,二,三,・・・・・・・・[節](2) (一),(二),(三),・・・・・[項]
3.数字について 横書きでは原則としてアラビア数字を使う。ただし、本文中ではコンマを用いず、万以上の数字には万、億、兆などを用いる。概数の場合は、十数人、数十年などとする。[例]23億500万円 1万2000人 第2次5カ年計画 表1 0~5歳
縦書きでは原則として漢数字を使う。 [例]二十三億五百万円
4.年は西暦を使用する。特別の暦法による暦を使用する場合には西暦年を[ ]で付記する。
5.ワープロ印刷設定にあたっては、行間を十分あける。大文字・小文字、数字、アルファベットの違いを明確にする。とくに[ー]と[-]の違いに留意すること。
Ⅲ.文献の引用および注
1.文献の引用および注は、横書きでは原則として本文中の該当箇所の右肩に片括弧付きの番号で表示する。[例]三内丸山遺跡5)は、・・・・・である6)。縦書きでは原則として本文中の該当箇所の右に両括弧付きの番号で表示する。[例]藩。
2.出典または注は、本文末尾に一括して番号順に記載する。その際、雑誌の場合は、著者名、論文等の題名、掲載雑誌名、巻・号、頁、発行年を、また単行本の場合は著者名、書名、出版社名、頁、発行年を記載することを原則とする。[例]福島真人「内面と力-ジャワ神秘主義と伝統的政治モデル-」『民族学研究』52(4)(3月)pp.330-350、1988年。
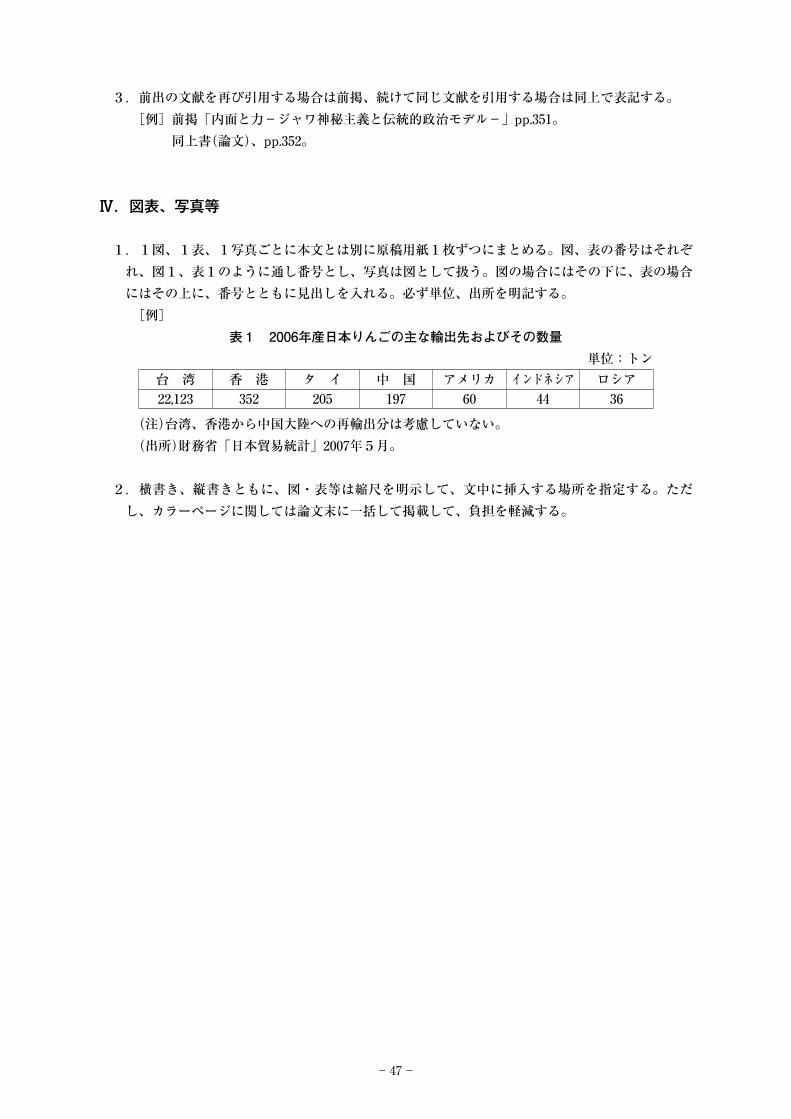
− 47 −
3.前出の文献を再び引用する場合は前掲、続けて同じ文献を引用する場合は同上で表記する。[例]前掲「内面と力-ジャワ神秘主義と伝統的政治モデル-」pp.351。
同上書(論文)、pp.352。
Ⅳ.図表、写真等
1.1図、1表、1写真ごとに本文とは別に原稿用紙1枚ずつにまとめる。図、表の番号はそれぞれ、図1、表1のように通し番号とし、写真は図として扱う。図の場合にはその下に、 表の場合にはその上に、番号とともに見出しを入れる。必ず単位、出所を明記する。[例]
表1 2006年産日本りんごの主な輸出先およびその数量単位:トン
台 湾 香 港 タ イ 中 国 アメリカ インドネシア ロシア22,123 352 205 197 60 44 36
(注)台湾、香港から中国大陸への再輸出分は考慮していない。(出所)財務省「日本貿易統計」2007年5月。
2.横書き、縦書きともに、図・表等は縮尺を明示して、文中に挿入する場所を指定する。ただし、カラーページに関しては論文末に一括して掲載して、負担を軽減する。
執筆者紹介
編集委員会
児 玉 忠(委員長)森 樹 男黄 孝 春山 田 厳 子藤 田 昇 治大 坪 正 一
弘前大学大学院地域社会研究科年 報第9号
弘前大学大学院地域社会研究科
2012年12月
平成25年3月20日印刷平成25年3月28日発行
編集兼発行者
弘前市文京町3番地電話 0172-36-2111(大代表)
印刷所 やまと印刷株式会社住 所 弘前市神田4-4-5電 話 0172-34-4111
論 文
[在学者] 徐 小淑:弘前大学大学院地域社会研究科(後期博士課程)地域政策研究講座 在学中
[論文博士] 野崎 道哉:平成21年3月 博士(学術)取得(弘前大学大学院地域社会研究科) 公益財団法人中部圏社会経済研究所研究員
論 文
[在学者]
編集委員会
論文
地方大学における産学連携ポリシーの試み:地域イノベーション創出共同体形成事業の評価と展望
野 崎 道 哉 ………… 3
内生的な経済・産業発展を目指す地方地域-競争と協働の精神と公的大学の役割-
清 剛 治 ………… 15
先端科学技術を支える新しい技術職員/組織への期待-「技術職員の産学官連携とのかかわり」全国アンケート調査によせて-
清 剛 治 ………… 33
高齢者の介護予防活動のあり方の検討 -A県一地区の悉皆調査から- 福 岡 裕美子 ………… 55
機械設備の更新投資と生産性 嶋 恵 一 ………… 69
不確実性と設備投資 嶋 恵 一 ………… 83
戦後青森県産りんごにおける輸出構造の形成とその要因について 黄 孝 春/成 田 拓 未/Carpenter Victor Lee ………… 95
論文(縦書き)
世界遺産白神山地における森林資源の歴史的活用 -流木山を中心に- 長谷川 成 一 ………… 194
研究ノート
イザベラ・バードの生前に出版されたUnbeaten Tracks in Japanの4種の版における違い―― 思考・行動の変化を反映した改訂 ―― 高 畑 美代子 ………… 115
研究科日誌(2009年10月~2010年9月) ………… 149
弘前大学大学院地域社会研究科 年報投稿要領 ………… 155
弘前大学大学院地域社会研究科 年報執筆要領 ………… 156
目 次
論文
中国高等学校社会系教科『思想政治』における経済教育─社会主義市場経済下の経済認識と経済的価値観の統一的育成─ 徐 小 淑 ………… 3
The Analytical Survey and Empirical Study of Economic Impact of the Natural Disasters: Input-Output framework 野 崎 道 哉 ………… 23
研究科日誌(2011年10月~2012年9月) ………… 43
弘前大学大学院地域社会研究科 年報投稿要領 ………… 45
弘前大学大学院地域社会研究科 年報執筆要領 ………… 46

弘前大学大学院
地域社会研究科
年 報第 9号
Regional Studies
2012
Regional StudiesDoctoral Course
Graduate School of Hirosaki University
弘前大学大学院地域社会研究科
2012年12月
ISSN 1349-8282


![全道学校説明会/第1回 · 2020-04-16 · 全道 込制 込制 魅力、 。 校内見学も できます。 が 。 [国公立] 北海道大学 3、弘前大学 1、金沢大学](https://img.dokumen.tips/doc/110x75/5f1d1d9c1cd8cb045d6ed388/eeic1-2020-04-16-e-e-e-e-.jpg)


