Embed Size (px)
Citation preview

E-MAIL VIRUSES DETECTION: DETECT E-MAIL VIRUS BY
NETWORK TRAFFIC
A Thesis in TCC402
Presented To
The Faculty of
School of Engineering and Applied Science
University of Virginia
In Partial Fulfillment
of the Requirement for the Degree
Bachelor of Science in Computer Science
By
Lap Fan Lam
March 24, 2002
On my honor as a University student, on this assignment I have neither given nor received unauthorized aid as defined by the Honor Guidelines for Papers in TCC Courses. ____________________________________________ (Full Signature)
Approved: _____________________________________________ (Technical Advisor) (Type Full Name) (Signature) Approved: _____________________________________________ (TCC Advisor) (Type Full Name) (Signature)

i
Technical Report Outline
GLOSSARY:...................................................................................................................................................1
ABSTRACT ....................................................................................................................................................2
1 INTRODUCTION......................................................................................................................................3
IMPORTANCE OF DETECTING E-MAIL VIRUSES ...................................................................................... 3
PROBLEMS WITH TRADITIONAL ANTI-VIRUS METHODS....................................................................... 5
RATIONAL/SCOPE........................................................................................................................................ 5
OVERVIEW OF THE CONTENTS OF THE REST OF THE REPORT ............................................................... 6
2 VIRUS DETECTION................................................................................................................................7
3 ELECTRONIC MAIL VIRUS DETECTION METHODOLOGY..............................................9
DETECTION METHODOLOGY ..................................................................................................................... 9
ASSUMPTION.............................................................................................................................................. 10
IMPLEMENTATION ..................................................................................................................................... 10
4 SIMULATION RESULTS .....................................................................................................................16
DATA COLLECTION METHOD.................................................................................................................. 16
SIMULATION RESULTS.............................................................................................................................. 17
5 SIMULATION RESULTS ANALYSIS .............................................................................................21
FALSE POSITIVE ALERT ANALYSIS......................................................................................................... 21
FALSE NEGATIVE RATE ANALYSIS......................................................................................................... 22
TRUE POSITIVE ALERT ............................................................................................................................. 22
6 CONCLUSION .........................................................................................................................................23
SUMMARY .................................................................................................................................................. 23
INTERPRETATION....................................................................................................................................... 23
RECOMMENDATION................................................................................................................................... 23

ii
REFERENCE: ..............................................................................................................................................25
APPENDIX A ...............................................................................................................................................27
VIRUS DETECTION METHODS.................................................................................................................. 27
APPENDIX B ................................................................................................................................................29
VIRUS BACKGROUND INFORMATION..................................................................................................... 29

iii
Table of Figures
Figure 1. Control Simulation Results................................................................................ 18
Figure 2. Single Virus Simulation Results........................................................................ 19
Figure 3. Multiple Virus Simulation. ................................................................................ 20
Figure 4. High e-mails messages can potentially trigger false virus alert. ...................... 21

1
Glossary:
• E-mail: Electronic mail.
• True negative: No virus present in the system. Anti-virus program also signals
there is no virus present. Correct signal from the anti-virus program.
• False negative: Virus present in the system. Anti-virus program signals there is no
virus present. Incorrect signal from the anti-virus program.
• True positive: Virus present in the system. Anti-virus program signals there is
virus present. Correct signal from the anti-virus program.
• False positive: No virus present in the system. Anti-virus program signals there is
virus present. Incorrect signal from the anti-virus program.

2
Abstract
Electronic mail viruses cause substantial damage and cost of traditional anti-virus
method is very expensive.
This report presents a new anti-virus method, which runs anti-virus program on mail
server and detects e-mail viruses by mentoring network traffic. The program is called e-
mail traffic monitor. E-mail traffic monitors can potentially reduce anti-virus cost since it
only needs to install on mail server. E-mail traffic monitor can also detect new virus
based on their behavior.
Simulation model and e-mail traffic monitor prototype has been developed in this
project to test whether this method is possible. This report states whether this is possible
based on the simulations results.

3
1 Introduction
This report suggests detecting and stopping the spread of e-mail virus at mail
servers. A simulated network model and an e-mail traffic monitor prototype are
developed to investigate whether it is possible to detect electronic mail viruses by
monitoring electronic mails passing through the mail servers.
Importance of Detecting E-mail Viruses
Daily activities of both business and home users rely heavily on the Internet
especially e-mail services. Disruptions in Internet normal operation can cost huge
monetary damages to business and home users in addition to inconvenience. In some
extreme cases, disruption of Internet operations can put national security at risk. For
example, the Department of Health Services experienced disruptions in e-mail services
ranging from a few hours to a few days after “Love Bug” infestation. If a biological
outbreak had occurred simultaneously with the “Love Bug” infestation, the health and
stability of the Nation would have been compromised with the lack of computer network
communication [6].
In order to keep Internet functioning normally, it is important to make sure that
Internet free from harmful disruptions. Since e-mail viruses can easily disable large
number of computer within a short period of time, e-mail virus has the ability to disrupt
Internet activities. In addition, an e-mail virus, unlike denial-of-service attack, which
targets a specific network, usually targets all Internet users.
Although anti-virus companies and organizations have developed many
methods to detect electronic mail viruses, only four major methods are widely used. They

4
are scanners, heuristic analysis, behavior block, and integrity checker. These are the four
major methods to detect virus. Details of these four anti-virus methods are in the
appendix A of this report. Appendix B gives the background information of viruses.
Because anti-virus programs usually cannot detect new viruses without software
update, anti-virus companies and Internet users have to spend huge amount of money to
update their anti-virus programs every year. The amount of time and money spend on
anti-virus is a huge burden for all Internet users.
Even though software update is expensive, it is essential that Internet users keep
their anti-virus software up to date. The cost of failure to detect and stop e-mail viruses
can be very high. For example, “I love you”, also called the “Love Bug”, which is a
hybrid between e-mail virus and a worm, caused five to ten billons business damages
worldwide alone [1]. The multiplication of these e-mail viruses create huge amount of
network traffic, which increases workloads on mail servers. The e-mail viruses also drag
down networks and mail servers similar to the denial of service attack [4]. As a result,
many Internet users found many of their favorite web sites are down, including some of
the e-mail service page.
The deadliest characteristic of modern e-mail viruses is that it is generally not
hard to create a new virus. For instance, original suspect of the virus “I love you” was a
college dropout who did not even get his computer science degree.
Luckily, studies have shown that if immunization is applied on selected computer
nodes in the network, the number of computers infected, and infection rate can be
effectively reduced [2]. This means that if anti-virus programs can detect and stop e-mail

5
viruses at their early phase, then we will be able to dramatically reduced cost of e-mail
viruses’ damages.
Problems with Traditional Anti-virus Methods
There are four major methods to detect computer viruses. They are scanners,
heuristic analysis, behavior block, and integrity checker.
All the anti-virus methods share the same major problems: incomplete protection
and high cost. Anti-virus software has to install and run on every computer to give
complete safety coverage, but it doest not mean anti-virus software can guarantee these
computers are virus free. Lost of data due to incomplete e-mail virus protection can be
disastrous. What would happen if Sprint loss its clients monthly bills?
Running anti-virus software also costs computational power. In addition, install
anti-virus software on every computer also costs software license fee. For a company of
size of a hundred, cost of a hundred software license is a heavy extra financial burden for
the company.
Rational/Scope
It might be possible to solve the problem above if it is possible to detect and stop
e-mail viruses at the mail server at early stage of the spread of virus without software
update. Damage from e-mail viruses will be greatly reduced. In addition, the cost of
developing and maintaining anti-virus programs will be minimized.

6
Possible Solution for Problems
This report suggests building an e-mail traffic monitor that runs on a mail server.
This monitor is going to generate virus alert based on the e-mail traffic passing through a
mail server. Since a mail server is a single point of entrances and exit to any other
destination, the monitor should be able to protect network computers served by stopping
e-mail viruses at the mail server.
Overview of the Contents of the Rest of the Report
Chapter two of the report will talk about all the related previous work on
computer virus. Chapter three of the report will explain the electronic mail virus detection
methodology. Chapter four will present the simulation results. Chapter five will discuss
simulation result. Finally, chapter six will be the conclusion of this report.

7
2 Virus Detection
Refer to Appendix A for description about traditional virus detection. Anti-virus
organizations and companies have developed many innovative ideas to detect viruses.
The following show two of those new methods to detect viruses.
“Data Mining Methods for Detection of New Malicious Executables,” it shows
ways of artificial intelligence to detect viruses. The authors have created three learning
algorithms in this project. Each of learning algorithms is capable of extracting malicious
executables and generates rules sets for detecting the corresponding viruses [12]. Then
they uses the rules sets that learning algorithms generated to detect viruses. This data
mining approach proves to be fairly successful in detecting known viruses. It can detect
97.76% of the known viruses, but none of the three algorithms is reliable in detecting
new viruses. The false virus alarm rate of this data mining detection is almost the same as
the rate of the four traditional anti-virus methods mentioned in chapter one.
In the second example, Balzer has developed e-mail wrapper to detect viruses in
e-mail attachments [13]. His focus was on e-mail attachment because most of the viruses
propagates by electronic mails are sent as e-mail attachments. The wrapper provides run-
time monitoring and authorization to ensure that the content executes safely so that any
harmful behaviors are blocked. Monitoring and authorization are accomplished by
mediating the interfaces used by the processes to access and modify resources. In this
way, the wrapper can detect violation process specific rules. When the rules are violated,
the wrapper will inform users, and users will determine whether to allow or prohibits the
offending operations. This approach proves to be very successful. It has successfully
stopped small number of viruses received since it was deployed in September 2000

8
(including I love you and the Anna-Kornikova viruses) [13]. This approach is very
similar to the way behavior blocker works, but the difference is that wrappers only
monitor e-mail attachment while behavior blockers monitor on all computer programs.
The next chapter of paper is going to talk about the virus detection method, which
monitors the e-mail traffic.

9
3 Electronic Mail Virus Detection Methodology
The statistical data of e-mail viruses from MessageLabs, which captures daily and
monthly viruses’ activity, gives us the foundation of this paper.
Detection Methodology
According to the virus activities statistics from MessageLabs, most of the known
successful viruses spread exponentially during first few days of its existence [15]. Human
daily activities directly affect activities of e-mail viruses. The e-mail viruses’ activities
grow dramatically during the morning as people go to work and use e-mail. Then it peaks
during noon and starts to drop as people leave the office. Moreover, the e-mail viruses’
activities drop to its minimum at midnight. Almost all e-mail viruses follow this activity
pattern.
E-mail viruses’ activity also has life cycle that will help us to identify them. First,
e-mail virus infects a host; then, infected host send e-mail viruses to infect other hosts;
this life cycle continues until there is an anti-virus solution, or other method to stop it. By
identifying this life cycle, anti-virus program may be able to detect virus by building a
tree structure that connects infected computers in chronological order. In this tree
structure, e-mails that contain virus then become the edges between tree nodes. By
correctly defining the minimum size of for an e-mail virus tree, it is logical that anti-virus
program should be able to detect the presence of e-mail.
However, an e-mail virus does not infect every host who has received the e-mail
virus. For instance, if an e-mail virus is sent to an operating platform, which the e-mail
virus cannot run on, the host of that operating platform stays virus free. This situation

10
may cause insufficient data to draw a tree. Fortunately, a large virus activity data set can
solve this problem. Since e-mail virus activity grows exponentially during its early stage,
early e-mail virus activities can supply such data set.
Assumption
Since simulation abstract the real model into a simpler model, the simulation runs
with several assumptions.
• Every user within the simulated network regis tered with only one e-mail service
provider.
• The e-mail service provider can access all the e-mails circulating between its
clients within the network.
• The number of users in the network is limited and stays constant.
• Each user’s mailbox has a maximum capacity on his/her mailbox which resides
on the server.
Implementation
This simulation model has two parts: A simulated network based on Raptor, and
an e-mail traffic monitor.
Raptor is a program that simulates a network environment [14]. This project uses
Raptor as the basis for network model. E-mail traffic monitor intercepts messages pass
between nodes within a network and generates appropriate virus alerts base on the
intercepted messages.
The following is the detail implementation of the simulated network and the e-
mail traffic monitor.

11
Simulate Network
The network is simulated using on Raptor [14]. Simulated network has two
layers. The lower layer is a raptor. The upper layer is a network model.
Ø Raptor
Raptor uses threads to represent nodes in a network. Every thread in Raptor
represents a single node within the simulated network. Raptor has the ability to pass
messages between different threads. Raptor also synchronizes every thread (node) within
the simulated network so that every thread (node) has to wait for all the threads finish
current task before it can execute the next task.
Ø Network Model
Network model in this project creates one single thread to serve as a server for
other threads (client threads) in all simulations. The server thread receives messages from
client threads. According to each message’s destination, the server thread then directs the
message to its desire destination threads. Therefore, the server thread is acting as a
medium of message exchange, and the server thread can access all the messages it has
received. This means the server thread has access to all the messages in the network.
Each of the client threads in the simulated model has an object called machine.
Machine object stores information of each client thread. For example, machine stores the
name of the client thread and the address book of the parent client thread. The stored
information in a machine object directly determines the behavior it parent client thread.
The parent client thread will not send virus e-mails if the stored information in the child

12
machine object specifies that the parent client thread is virus free. The machine stored
information changes over time. For example, e-mail virus infects a client thread will
change the stored information of the machine so that the client thread will behave
differently.
E-mail Traffic Monitor
E-mail traffic monitor runs in the server thread. There is only one server thread
for the simulated network. E-mail traffic monitor intercepts and stores related e-mails,
which the server thread receives.
E-mail monitor then groups stored e-mails according to their attachment size. E-
mails in each group are sorted according to the chronological order that the monitor has
received them. Finally, the monitor finally will try to build a tree from the messages in
each group. The monitor then will determine whether there is e-mil virus by analyzing
the tree structure.
There are three major parts that performs the actions above. The monitor also has
three important values. The details are as follow.
Ø Monitoring Range (value)
For simplification purposes, natural numbers represents IP addresses in the
simulations. Monitoring range has two numbers that specify a range of numbers between
these two numbers. For example, 1 and 9 specify all number between 1 and 9. Email
traffic monitor uses monitoring range to determine which messages it should intercept.
For instance, if there are 99 client threads, e-mails can only send to 99 computers. All e-
mails in this example can only address to any number between 1 and 99. Email sender’s

13
computer number also is between 1 and 99. In this case, if traffic monitor has a
monitoring range between 4 to 9, it will only intercept emails messages which are
sending to computer number between 4 and 9, or the sender computer number is between
4 and 9.
Ø Message Storage
E-mail traffic monitors will store a monitored message if it has an attachment. E-
mail traffic monitor stores a monitor message using the attachment size as an index; in
addition, all messages are stored in a chronological order.
Ø Priority Index List
The monitor does not scan all the messages it has stored. It only scans messages
according to priorities. Priority index list store the message priorities.
Priority index list is a link list. Link list consists of nodes. Each node contains
three pieces of information: number of occurrences, last updated time, and attachment
size.
For example, if the monitor have stores four messages in the last four time unit,
each has an attachment of size 200, there will be a node in the list contain this
information (number of occurrences is 4, last updated time is 4, and attachment size is
200). Index list will store the nodes in descending number of occurrences order so the
nodes at front have the highest occurrences.
In order to reduce the accumulative effect of time on the number of occurrence on
each node, index list will reduce the number of occurrences of a node as if index list does
update that node for a period of time. For example, if scan range (please refer to

14
following sections) is 4 time unit and current time is 10, index list will halves the
occurrences of all nodes which last updated time between time 6 (10 minus 4) and time
10.
Index list will delete a node when that node’s information is no longer useful to
traffic monitor. Traffic monitor does not need any node which the last updated time
exceeded two scan range (please refer to following sections). For example, if scan range
of traffic monitor is 4 and current time is 56, index list will delete any node that the last
updated time is smaller than time 52 (56 minus 4).
Ø Scan Range (value)
Scan range is a number which specifies a time window. Time unit is measured in
time step. When all the client threads have finished one turn, a time step is passed
Monitor uses scan range to decide how many messages it. For example, if the scan range
is 7 and current is 67, traffic monitor will scan all the messages received between 60 (67
minus 7) and 67.
Scan range also determines how many messages in the message storage. Traffic
monitor discards all messages which have been received earlier than one scan range ago.
Ø Virus Detection Engine
Virus Detection engine runs according to a schedule. The virus detection engine
runs repeatedly. It will wait for a specific time before it runs again. The user specified the
time traffic monitor should wait .
When the virus detection engine runs, first it retrieves information from index list.
Index list provides detection engine the ten highest occurring attachment size. Then the

15
virus detection engine uses attachment size as index to retrieve ten sets of messages. For
each message set, detection engine tries to build a tree structure the messages. Detection
engine gives score to each tree it builds according to the number of tree branches, tree
depth, and the number of child nodes. If the result tree score is bigger than the monitor’s
default score, the scan engine gives a virus alert.
Ø Score Value
Score is a number that determines how sensitive the detection engine to e-mail
viruses. Change in score will vary the number of virus alert; because detection engine
detects viruses by giving score to tree structure derived from received messages. If the
score is too low, detection engine will have a high probability of giving false virus alert.
If the score is too high, detection engine will have a high probability of failing to detect
viruses. In the derived virus message tree, connection to one child at first level of the tree
structure adds one point to the total score of the tree. The scoring of a child node doubles
as the tree depth of the child increase by one. If any result virus tree score is bigger than
monitor’s default score, the scan engine will generate a virus alert.

16
4 Simulation Results
Data Collection Method
There are five different input parameters, which would affect the simulation
output results. There are two types of simulations: control simulations and virus
contaminated simulations. In control simulation, there is no e-mail virus. In virus
contaminated simulation, there will be different types of viruses within the network.
Input Parameters
• Number of nodes in the network: Number of nodes represents the number of
computers within the network.
• Monitor Virus Scan Interval: This is a number that indicates how often the e-mail
traffic monitor is going to run virus scan.
• Number of viruses present: This number determines the number of viruses present
in the network and indirectly determines the e-mail activity.
• Monitor Range: The number of nodes (computers) that the mail traffic monitor is
going to monitor. A large monitor range increases the workload of the monitor.
• Monitor Score: This is a number that determines how sensitive the e-mail traffic
monitors to e-mail viruses activities. The smaller the number, the more sensitive
the monitor to e-mail viruses activities.
Control Simulations
Simulation will run without the presence of e-mail viruses as control experiment.

17
Because there is no virus present in control experiment, any virus alert generated by
detection engine of traffic monitor will be false alert. As a result, results from control
experiments determine whether traffic monitor gives false virus alert.
Viruses Contaminated Simulations
Simulations will run in two different virus environments.
• Single Virus: Simulations run with the present of single viruses.
• Multi-virus: Simulations run with presence of multiple types of e-mail viruses.
Simulation Data
Each simulation gives result in two files.
• Log.txt: Records email activities. It selectively records information of e-mails
which have highest occurring attachment size..
• VirusAlert.txt: Records each virus alert that the e-mail traffic monitor generates.
Simulation Results
There are two types of simulations: control simulations and viruses simulations.
These two types of simulations begin with the same initial setting except that control
simulations have no e-mail viruses. The following is the simulation results.

18
Control Simulations
There are six control simulations. Each control simulation starts with a hundred
nodes. 99 nodes are clients (e-mail users), and one node is the server (e-mail server). The
monitor scan range is four. The monitor will generate an alert if it can build a tree from
the intercepted messages with score bigger than 30. In this setting, it is desire that there is
no virus alert. Every client has a random chance of replying and generating e-mails.
Every client also has a different probability of infected by e-mail virus. After a virus has
infected a client, the virus will change the client behavior according to the virus
characteristics. All the control simulations started with the same initial setting describe
above.
There is one out of seven control simulations in which the monitor generates a
false virus alert. The monitor has a false alert rate of 15% in the control experiment.
The result of the control simulations are shown below:
Initial Settings Number of Nodes 100 Score 30 Scan range 4 Monitor range 4 Status No virus
Simulation Trial Virus Alert
Number of Alerts
Total Scan Messages
Total Time
Average messages
1 0 0 452 18 25 2 0 0 545 18 30 3 1 24 3825 18 213 4 0 0 176 18 10 5 0 0 394 15 26 6 0 0 346 18 19 7 0 0 457 18 25
Figure 1. Control Simulation Results.

19
Viruses’ Simulations
Viruses contaminated simulations have the same setting as control experiment
except that e-mail viruses are present. Viruses contaminated simulations have two types:
single virus simulation and multiple virus generation. All the control simulations started
with the same initial setting as the control experiment except the number of e-mail
viruses present.
The following is the results of the single virus simulations. There is only one type
of viruses present in each of the following simulations. Monitor gave five correct virus
alerts in seven single virus simulations. The monitor is 71% accurate to give true positive
alert. The monitor failed to report the presence of virus in two simulations. Therefore, the
false negative rate is 29%.
Figure 2. Single Virus Simulation Results.
Initial Settings Number of nodes 100 Score 30 Scan range 4 Monitor range 4 Status 1 Simulation Number
Number of Virus
Number of Virus Alert
Number of Correct Virus Alert Accuracy
Time Delay
1 1 1 1 100% 9 2 1 1 1 100% 6 3 1 1 1 100% 15 4 1 1 1 100% 6 5 1 0 0 0% None 6 1 1 1 100% 12 7 1 0 0 0% None

20
The following is the results of multiple virus simulations. There is more than one
type of viruses in each of the following simulations.
The first four simulations ran with two viruses. Monitor gave eight correct virus
alerts. Therefore, the true positive rate of the monitor is 75%. Monitor failed to detect 2
viruses in one simulation. Hence, the false negative rate is 25%.
The last simulation had three viruses. Monitor successfully detects two viruses;
therefore, the true positive rate is 75%. The false negative rate is 25% because the
monitor failed to detect one virus.
Figure 3. Multiple Virus Simulation.
Initial Settings Number of Nodes 100 Score 30 Scan range 4 Monitor range 4 Status 2 viruses Simulation Number
Number of Virus
Number of Virus Alert
Number of Correct Virus Alert Accuracy
Time Delay
1 2 2 2 100% 3 2 2 2 2 100% 6 3 2 2 0 0% 6 4 2 2 2 100% 6
Three Virus Simulation Status 3 viruses Simulation Number
Number of Virus
Number of Virus Alert
Number of Correct Virus Alert Accuracy
Time Delay
5 3 2 2 66% 6
21
5 Simulation Results Analysis
The simulation results from the previous chapter show that the monitor is fairly
accurate in detecting e-mail viruses. However, it also has some weakness: first, it
produces some false virus alert; second, it fails to detect some of the virus. This chapter
will examine simulation results.
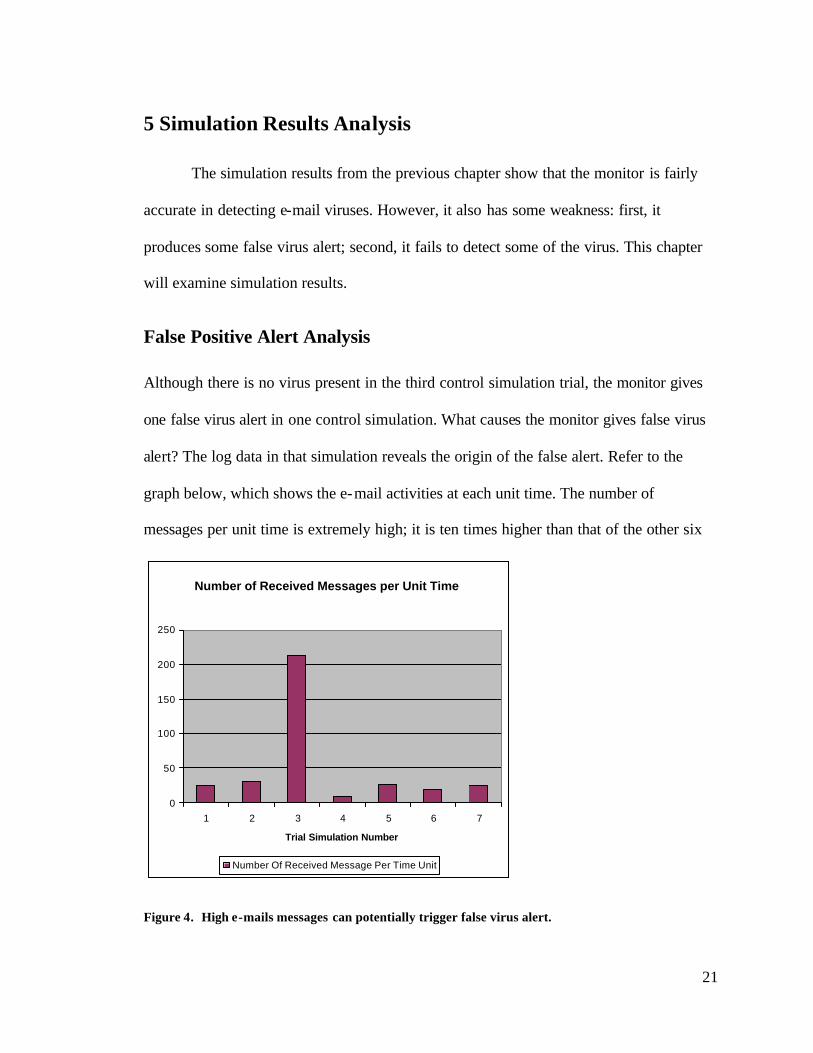
False Positive Alert Analysis
Although there is no virus present in the third control simulation trial, the monitor gives
one false virus alert in one control simulation. What causes the monitor gives false virus
alert? The log data in that simulation reveals the origin of the false alert. Refer to the
graph below, which shows the e-mail activities at each unit time. The number of
messages per unit time is extremely high; it is ten times higher than that of the other six
Number of Received Messages per Unit Time
0
50
100
150
200
250
1 2 3 4 5 6 7
Trial Simulation Number
Number Of Received Message Per Time Unit
Figure 4. High e-mails messages can potentially trigger false virus alert.

22
control simulations. Therefore, large amount of e-mail activity can potentially trigger
false virus alert. If a attachment hash is using instead of attachment length, it can reduce
change of false virus alert. It is because using attachment hash reduces the chance of
falsely categorized two different attachment with different content but same length as the
same attachment.
False Negative Rate Analysis
The monitor failed to detect two viruses in trial simulation 3 of the viruses
contaminated simulations. It also failed to detect one of the three viruses in trial
simulation 5. On the other hand, the traffic monitor successfully detected most of the
viruses in trial simulation. Because the monitor was able to detect most of the viruses, it
proves that the monitor itself can detect viruses. Base on this fact, there is one possible
explanation that the monitor cannot detect some viruses. If there is only a few client
threads, which are within the monitoring range of the traffic monitor, are infected with
the virus. The monitor will not have enough infected tree nodes to build a tree that can
trigger a virus alert.
True Positive Alert
The simulation results show that the monitor can detect e-mail viruses. The
monitor can only detect e-mail viruses with accuracy around 70%. It is relatively accurate
considering that the monitor has no knowledge of any e-mail viruses.

23
6 Conclusion
This chapter gives final conc lusion of this project based on the simulation results.
It will also give future recommendation and direction for who interests in further research
in this field.
Summary
The simulation result analysis shows that the monitor is able to detect e-mail
viruses by monitoring e-mail traffic. However, simulation analysis shows that monitor
cannot detect all the viruses and sometimes generate false virus alert.
Interpretation
This project has succeeded gives theoretical foundations to detect virus by
analyzing e-mail traffic pass through mail server. The simulation result suggests that it is
possible to detect e-mail virus within a network. It is a robust method since it can detect
new e-mail viruses on the go.
However, the virus detection mechanism requires further improvements before
practical usage. Even when it becomes ready for practical usage, it should not be used as
the only protection against e-mail viruses. It should be used to strengthen protection
against e-mail viruses.
Recommendation
This virus detection mechanism requires further improvements and modifications
before put it into practical usage. Since the report on this virus detection mechanism

24
comes from network simulation, it does not guarantee this virus detection mechanism is
going work exactly the same on a real network. This virus detection mechanism should
be tested on a physical network. This is because this virus detection mechanism runs on
mail servers, which are critical points in electronic communications.
Finally, there still two concerns for this virus detection method. First, each mail
server in reality potentially could have thousands of users in a real network; running the
e-mail traffic monitor consumes extra computational resources that on mail server can
effectively delay e-mail services. Second, a computer user usually has several e-mail
accounts. In order to protect the user’s computer, every user’s e-mail service providers
have to install this traffic monitor.

25
Reference:
[1] ZDNet UK. New page. 9 May 2000. ZDNet UK. 9 May 2000
<http://www.zdnet.co.uk/news/2000/18/ns-15265.html>.
[2] Chenxi Wang, John Knight, and M. Elder. “On Computer Viral Infection and the
Effect of Immunization.” Technical Report UVA-CS-99-32, Department of
Computer Science, University of Virginia, 1999.
[3] Jake Ferry. “A Study and Evaluation of Virus Protection Software Marketed to
Average Computer Users.” Dissertation ES200006, Department of Computer
Science, University of Virginia, 2000.
[4] David Moore, Geoffrey Voelker, and Stefan Savage. “Infe rring Internet Denial-of-
Serve Activity.” Proceedings of the 10th USENIX Security Symposium,
August 2001.
[5] Brian Utt. “Detection and Identification of Intruders in Network Systems.”
Dissertation CS990033, Department of Computer Science, University of
Computer Science, 1999.
[6] Jack Brock. “ “I Love You” Computer Virus Highlights Need for Improved Alert
and Coordination Capabilities.” In Proceeding of Critical Infrastructure
Protection ’00 (May 18), GAO.
[7] Eugene Kaspersky. “Viruses and the Internet- Whatever Next?” Virus Bulletin,
p14-17, February 1999.
[8] L.M. Adleman. “Advances in Cryptology.” Crypto ’88. Proceeding, Lecture Notes
in Computer Science 403, Springer, Berlin. 1990. pp. 354-374.

26
[9] Richard Ford. “Malware: Troy Revisited.” Computer & Security, v 18 n 2 1999, p
105-108.
[10] Paul Dochery, and Peter Simpson. “Macro Attacks: What Next After Melissa?”
Computers & Security, v 18 n 5 1999, p 391-395.
[11] Vesselin Bontchev. “Macro Virus identification problems.” Computer & Security, v
17 n1 1998, p69-89.
[12] Zadok, Stolfo, Schultz, and Eskin. “Data Mining Methods for Detection of New
Malicious Executables.” Technical Report, Department of Computer Science,
University of Virginia, 2001.
[13] Robert Balzer. “Assuring the Safety of Opening E-mail Attachment.” DARPA
Information Survivability Conference & Exposition II, 2001. DISCEX '01.
Proceedings , Volume: 2 , 2000.
[14] The Raptor Simulator. Home page. 19 Mar. 2002. The Raptor Simulator. 19 Mar.
2002 <http://www.cs.virginia.edu/~survive/raptor/>.
[15] MessageLabs. Home page. 19 Mar. 2202. MessageLabs. 19 Mar. 2002
<http://www.messagelabs.com/>

27
Appendix A
Virus detection Methods
Virus scanner is probably the most widely used method to detect virus, and virus
scanner is by far the most accurate and effective way in detecting computer viruses.
However, scanner requires constant update, which adds cost to maintain. Virus scanner
alone cannot guarantee a computer is virus free, because virus updates usually come out
after e-mail viruses have inflicted major damage. That is why anti-virus programs usually
use three methods mention in the following to strengthen their ability to detect viruses.
Even though Heuristic analysis, behavior block, and integrity checker add strength to the
anti-virus programs, they have the same weaknesses, which they tend to have a high false
virus alert rate.
Heuristic analysis analyzes computer files. Then, it tries to predict what a
computer file is trying to do. If the action of a computer file violates the rules of heuristic
analysis, heuristic analysis will generate a virus alert. However, heuristic analysis cannot
always predict what exactly a computer file is doing, because computer files have billions
of variations. Thus, heuristic analysis generates many false positive, false negative alerts
as well as some true positive, true negative virus alerts.
Behavior block monitors program behavior. If the program is trying to do
something that the program is not supposed to do, behavior block will blocks the
programs action and fire a virus alert. Behavior block acts almost the same as heuristic
analysis, except that behavior block check program behavior at run time while heuristic

28
analysis checks computer file’s action before a computer file runs. Therefore, behavior
block has the same problems as heuristic analysis.
Integrity checker checks computer files’ integrity using check sum. If the checksum
value of a computer file does not match its old checksum value stored in the integrity
checker, integrity checker will give a virus alert. Nevertheless, because computer files are
constant modified by the computer and the user, integrity checker does not give accurate
virus alerts.

29
Appendix B
Virus Background Information
Computer virus is not a new topic in the computer field. It was originally the
results of both programming bugs from careless programmers, and malicious codes from
malicious programmers. The first report of computer virus was in 1981. Adleman is
credited with coining the term “computer virus.” Cohen is credited with doing the first
serious research in computer virus [8].
In the last 7-year, viruses have changed its course in its way of infecting its targets.
Electronic e-mails now have become the most common medium for virus infection.
Unlike old way of virus propagation, which spread virus by sharing disks, electronic
messaging can infect millions of computer in an hour without any physical contact.
Many of the e-mail viruses today use the “Trojan Horse” strategy. They contain
hidden functions that can exploit the privileges of the user with a resulting security threat.
This all begins when the desktop platform become homogenizes and people start share
files [9]. In the infamous virus “Melissa”, the virus will take control of Outlook once the
user click on the Melissa- infected attachment, and virus will send out copies of the virus
to first fifty people on the mailing list. However, “Melissa” was not the first one to use
such technique, virus such as Sharefun also used the same technique [10].
“Melissa” and “I love you” are belonged to a virus set called macro virus. Macro
viruses usually are embedded programs of Microsoft Office documents. It is extremely
tricky to remove macro viruses. For example, if an anti-virus program improperly
disinfects a macro virus, the improper disinfections process can create a new macro virus

30
[11]. In this example, anti-virus program disinfections process generates a new variety of
the same virus, whose behaviors become unpredictable. Macro virus has also presented
another problem. As the macro in old office document formats is converted to new office
formats, macro virus would become hard to recognize because office converter adds
information into the macro virus. Same difficulty applies when macro is converted from
new office document formats back to old office document formats [11].