Embed Size (px)
Citation preview

E�ects of e-commerce on local labor markets
Anahid Bauer*
November 4, 2021
Abstract
How has the expansion of e-commerce over the past decade a�ected labor markets? Utiliz-ing the variation of state legislation on e-commerce sales tax collection -the Amazon Tax- whichreduced out-of-state e-commerce retailers’ price advantage, I �nd declines in employment andwages in e-commerce complementary sectors, such as warehousing and last-mile transportation.In the retail sector, I observe declines in local employment and the number of establishments.E�ects in retail are heterogeneous by sub-sector. While big box retail employment increases,other brick-and-mortar retail employment decreases. As the Amazon Tax may induce brick-and-mortar retailers to incorporate online channels, I analyze changes in retail occupationalstructure. In non-urban areas, I �nd an increase in the share of o�ce and service occupationsand a decrease in the share of sales and related occupations. Through a general equilibriummodel, I �nd that these results are consistent with an economy in which consumers substitutee-commerce purchases for big box purchases, which leads to the crowding out of other brick-and-mortar retail.
Latest version
*Department of Economics, University of Illinois Urbana-Champaign (e-mail [email protected])
1
Introduction
In the last decade, there has been an increase in the presence of online retailers (Amazon.com,eBay.com, Alibaba.com, Zappos, Newegg, Safeway, etc) which had led to the rapid growth of e-commerce transactions from 4.2% of total sales in the �rst quarter of 2010 to 10.5% of total salesin the �rst quarter of 2019 in the United States.1. Given that retail is a key local economic activityand that the retail workforce represents 11% of the total workforce in the US, it is paramount tounderstand the e�ects of e-commerce on local labor markets. Gebelo� and Russell (2017), Kane andTomer (2017) and Tomer and Kane (2021) suggest the expansion of e-commerce may harm retailworkforce, especially outside of metropolitan areas. On the other hand, Hortacsu and Syverson(2015) casts doubt on e-commerce driving force due to its smaller size compared to Warehouse Clubsand Supercenters, while Mandel (2017) associates e-commerce with job creation and wage growth. Inthis paper, I evaluate the e�ects of e-commerce on local labor markets of related industries throughthe enactment of the Amazon Tax, a state legislation that removes a price advantage for out-of-stateonline retailers.
The main identi�cation challenge to evaluate the e�ects of e-commerce introduction in local la-bor markets is that e-commerce sales grow everywhere at a pace given by local economic conditions.Hence, it may not be possible to distinguish between e-commerce exposure and local economic con-ditions to di�erentiate treated and control areas. I exploit the fact that out-of-state e-commerce re-tailers have had a price advantage which dissipates when the Amazon Tax legislation is enacted toidentify the e�ects of e-commerce on local labor markets. The price advantage originates in out-of-state e-commerce retailers not being required to collect state sales taxes for more than two decades.Starting in 2008, to recover tax revenue losses, state governments enacted legislation, which is knownas the Amazon Tax.2
Using employment and establishment counts from County Business Patterns as well as wagesand occupation’s employment shares from the American Community Survey, I examine the e�ectsof the Amazon Tax enactment in four states in 2013. I use a di�erence-in-di�erences design, exploit-ing the exogenous variation provided by the year of enactment of the Amazon Tax to evaluate thechanges in incentives for both in-state brick-and-mortar and e-commerce retailers. First, I identify ef-fects in employment rates and number of establishments for retail and warehousing and transporta-tion sectors at commuting zones. I �nd that after the Amazon Tax is enacted, local employmentin transportation and warehousing decrease on average by 34.8 employees per 100,000 working agepopulation per year, which represents a 9.6 percent decrease from its average pre-period mean. More-
1See Figure 12State governments also signed voluntary collection agreements with major e-commerce retailers, like Amazon.com,
Inc (Amazon) whose sales account for 50% of online retail sales by 2018 Berg et al. (2019)
2
over, I observe an average decline in retail employment in commuting zones in states that enactedthe Amazon Tax on average of 74.6 retail employees per 100,000 working age population per yearcompared with retail employment in commuting zones that did not enact the Amazon Tax. Thisdecline represents more than 1 percent of the average retail employment in commuting zones beforethe year of enactment. However, I �nd a di�erential e�ect for warehouse clubs and supercenters andthe remaining brick-and-mortar retailers. After the Amazon Tax is enacted, employment in ware-house clubs and supercenters increased on average by 6.27 percent each year in commuting zonesin treated states, while employment in other brick-and-mortar retailers decreased on average by 2.32percent from its baseline pre-period mean. All observed e�ects on employment are driven by urbancommuting zones.
I also �nd there is a small decrease in the number of establishments of a yearly average of 3.74fewer establishments per 100,000 population in urban commuting zones, which represents a declineof 0.98 percent from the baseline mean. Moreover, I do not observe a statistically signi�cative changein the number of establishments in the transportation and warehousing sector.
As the price advantage is removed, now retailers have incentives to reorganize their labor struc-ture to regain market share from e-commerce retailers. In light of the new incentives, and followingthe same methodology, I evaluate possible changes in wages and the occupational structure of the re-tail sector using the American Community Survey (ACS). I �nd that after the Amazon Tax is enactedthere is a decrease in annual wages and hourly wages of employees in transportation and warehousingof 8.3% and 7.78% respectively. Finally, while I do not �nd statistically signi�cant changes in retailoccupational shares of all commuting zones, I observe that in non-urban commuting zones the salesand related occupational share in retail decreased on average by 2.5 percentage points, and o�ce andservice occupational share in retail increased on average by 1.52 percentage points after the AmazonTax enactment.
Hence, when out-of-state e-commerce retailer price advantage is reduced, last-mile transporta-tion and warehousing employment and wages decline. Additionally, in urban commuting zonesthe competition between warehouse clubs and supercenters and general brick-and-mortar intensi-�es, leading to an increase in employment for the �rst sector and a decrease in employment for thesecond sector, which add to a decline of overall retail employment. Last but not least, while retailemployment does not change in non-urban areas, its composition does. The increase in o�ce andservice occupations and the decline in sales and related occupations suggest that retailers could beturning to a hybrid production model.
To investigate the potential channels leading to these e�ects, I also provide a conceptual frame-work. Through a four-sector general equilibrium model analysis, I �nd that the empirical resultscould be explained by three conditions. First, the consumers’ elasticity of substitution between big-
3

box retail and e-commerce retail is bounded by the consumers’ elasticities of substitution betweenother brick-and-mortar retail and the previous types of retail. Second, workers’ elasticity of substi-tution between being employed at big-box retail and being employed at last-mile transportation andwarehousing is bounded by the workers’ elasticities of substitution between being employed at otherbrick-and-mortar retail and being employed in the previous sectors. Lastly, the relative di�erence inconsumption preferences for di�erent types of retail has to be larger than the relative di�erence inlabor preferences for working in di�erent retail sectors or last-mile transportation and warehousing.
This paper contributes to a growing literature that explores the role of e-commerce in the econ-omy with a new identi�cation strategy. By exploiting the enactment of the Amazon Tax as sourceof exogenous variation, this paper evaluates how the removal of a price advantage changes incentivesfor both e-commerce and brick-and-mortar retailers which may lead to changes in the retail marketstructure. In that sense, this paper extends the literature evaluating e-commerce e�ects on marketstructure, competition, prices, entrance and exit, and spatial distribution (Goldmanis et al., 2010;Bar-isaac et al., 2012; Cavallo, 2017; Vitt, 2020; Pozzi, 2013; Wu, 2020; Fang and Policy, 2020). Asthis literature is mostly descriptive and theoretical, by incorporating the Amazon Tax as the identi-�cation strategy, this paper is the �rst to explore e-commerce causal e�ects.
Furthermore, this paper adds to the understudied literature on the e�ects of e-commerce onlabor markets. Chun (2019) explores how online spending a�ects local retail employment. By in-strumenting the geographic variation in online spending with the age distribution and online pene-tration rates, Chun (2019) �nds a reduction in retail employment. However, this work does not takeinto account for unobserved economic conditions that may a�ect online penetration rates at thesame time than employment. In the same line of research, but with a di�erent approach, Chava et al.(2018) explores the changes in employment status and wages of employees at brick-and-mortar re-tailers when ful�llment centers from a major e-commerce retailer are established in the same county.They �nd a reduction not only in employment, but also in wages of hourly workers due to a reduc-tion in hours employed. One major drawback of this approach is that it does not take into accountthat once a ful�llment center is introduced in a neighbour county in the same state, the e-commerceretailer may be required to collect sales tax for all the counties in that state. Hence, spillover e�ectsover same-state counties may lead to a violation of the stable unit treatment value assumption con-ditions, since counties considered as controls may also be treated. While both studies introduce in-novative strategies to evaluate e-commerce e�ects in employment, both strategies rely on economicretail market conditions. My contributions to this literature are twofold: identi�cation and explor-ing mechanisms. I contribute in regards to the identi�cation by exploiting the enactment of salestax legislation, the Amazon Tax, as a new source of variation. On the other hand, I contribute to theanalysis of local labor market e�ects of e-commerce by exploring changes in the way retail is done,
4
through the occupational requirement.Lastly, this paper contributes to the literature that studies the e�ects of the Amazon Tax. Baugh
et al. (2018) �nds that the Amazon Tax reduces online sales, while Afonso (2019) shows that it in-creases tax revenue. Kacamak and Wilking (2020) shows that the Amazon Tax leads to the presenceof a pass-through to consumers as well as to a reduction in online expenditure. This paper is the�rst to evaluate the Amazon Tax e�ects on the local retail labor market and explore the mechanismsbehind these changes with a general equilibrium model.
In the next section, I explore the institutional background regarding the changes in the retailsector and retail labor market as well as the history of the Amazon Tax. In the third section I describethe data and empirical strategy. In the fourth section I present the main results. In the �fth sectionI introduce a conceptual framework that investigate the potential channels leading to the observede�ects. Finally, the last section summarizes the conclusions.
Institutional Background
The retail sector and the retail labor market
The retail industry is present in almost all the local markets in the United States.3. Also, re-tail has experienced three main changes over the last thirty years. First, the decline of small familyowned stores, also known as Mom-and-pop stores, due to the entrance of big-box stores, as ware-house clubs and supercenters, has been widely studied as the “Wal-mart e�ect”. Second, departmentstores have been experiencing a sharp decline in their number of establishments, that the media hasdenominated as “Retail apocalypse”. Finally, the development of new technologies has made notonly possible but also safe to buy online with the emergence of e-commerce retailers.
In this section I document changes in retail and in the retail labor market using data from theAmerican Community Survey, the Annual Retail Trade Survey and the Occupational Employmentand Wages Survey. The North American Industry Classi�cation System (NAICS) identi�es as e-commerce retailers as those retailers that do not have a store, perform most of their sales online, andare included into “Electronic Shopping and Mail Order Housing (NAICS 4541)”. The remainingretailers, also known as brick-and-mortar retailers, may also sell online, but are classi�ed accordingto their primary business activity.
Before exploring labor market outcomes, it is paramount to observe that the retail labor marketis highly responsive to changes in retail sales. Figure 2 presents e-commerce and brick-and-mortarretail trends for both employment, measured as employees in hundred thousands, and total sales,
3According to County Business Patterns data 99.81 % of the U.S. counties had at least one retail establishment in2003.
5

measured as sales in hundred thousands in 2014 us dollars. There is a high correlation between salesand employment in both sectors up to 2017.
While the origins of e-commerce can be traced to early 1980s, it was not until mid 1990s withthe launching of the �rst web browsers that companies started developing e-commerce platforms.Moreover, the �rst e-commerce companies like Book Stacks Unlimited and Amazon.com, Inc. werefocusing on the online book market. Figure 3 shows the share of online sales with respect to total salesfor e-commerce (NAICS 4541). Online sales reach more than half of the total sales of the sector in theyear 2009, reaching up to 80% in the year 2018. Not only online sales had an immense growth in thee-commerce sector, but also the share of the e-commerce sector as part of retail experienced an a vastgrowth. In 2005 the Electronic Shopping and Mail-Order Houses (NAICS 4541) sector represented5% of the total retail sales, but in 2016 e-commerce retailers represented more than 10% of total retailsales. An additional way to observe the increasing importance of e-commerce is through the growthrate of sales. Figure 1 shows that, for the period 2005-2017, the growth rate of sales of e-commerceretailers is several times the growth rate of sales of brick-and-mortar retailers.
Despite employment and sales being highly correlated for e-commerce and brick-and-mortarretailers, e-commerce retailers employs fewer employees and a di�erent occupational structure thanbrick-and-mortar retailers for the same amount of sales. Figure 4 shows the number of employees per100,000 usd in sales for both sectors for years 2010-2017. While in 2010 e-commerce retailers required1.19 employees per 1 usd in sales, brick-and-mortar retailers required 2.98 times the number of em-ployees that e-commerce retailers. By the year 2017, that di�erence has grown to 3.48 times. Not onlydoes e-commerce employs fewer employees in its own sector that brick-and-mortar retail as well asrelies on employees from last-mile warehousing and transportation sector, but also e-commerce andbrick-and-mortar retail require di�erent types of employees. Figure 6 Panel A presents the occupa-tional structure in retail, grouped for the main three sectors, in the year 2007 using OEWS data. BothE-commerce (NAICS 4541) and Warehouse clubs and supercenters (NAICS 4529) employ more em-ployees from o�ce and service occupations that general brick-and-mortar sectors.4 However, in or-der to sell goods, e-commerce retailers employ less employees of sales and related occupations andrequires from the last-mile transportation and warehousing sector (NAICS 49). Figure 5 shows howthe growth rate of e-commerce retail sales is highly correlated to the growth rate of employment inlast-mile transportation and warehousing in the period studied.
Finally, there is also evidence that the retail sector is moving to a hybrid retail model: an in-crease in brick-and-mortar online sales as well as changes in the retail occupational structure. First,the shares of online sales from brick-and-mortar retailers have more than double between 2005 and
4I split retailers into warehouse clubs and supercenters (NAICS 4529), e-commerce retailers (NAICS 4541) and othergeneral brick-and-mortar retailers (remaining NAICS)
6
2016. Even when those shares remain small, the changes preempt the COVID-19 pandemic.5 Second,the occupational structure of the retail sector also has experienced several changes. Figure 6 PanelB presents the changes in occupational shares for the 5 major occupational groups in retail with re-spect to the corresponding shares in 2005. The retail sector in 2005 represents around 10% of thetotal employed population, and the share of sales and related occupation is 53% of the retail employ-ees. Hence, a reduction in the share of sales and related occupations in retail of 5% from 2005 to 2017represents 1% less employees in sales and related occupations, or more than 1M employees not work-ing in sales and related occupations anymore. Together, this evidence suggests that brick-and-mortarmay have made some adjustments to sell online and adopt a hybrid model.
In order to explain these changes in the retail sector and in the retail labor market �rst and fore-most I consider the evolution of retail competition. The �rst indicator of the type of competitionis that prices from websites and physical stores are similar in US 69% of the time Cavallo (2017).However, Cavallo (2017) analysis of US prices does not include tax rates or contemplate tax ratesdi�erences due to state legislation. As out-of-state online retailers are exempt from collecting salestaxes, they have a price advantage over brick-and-mortar retailers. With a su�cient price advantage,more consumers may choose buying online. Hence, the price advantage could have accelerated thegrowth of e-commerce and could have lead the changes in the retail labor market. Leveling the play-ing �eld, as out-of-state e-commerce retailers are being required to collect sales taxes by new statelegislation, results a reduction of out-of-state online sales documented by (Baugh et al., 2018; Einavet al., 2014). In the next sections, I introduce the details of what the legislation change entailed, tolater focus on the e�ects of the Amazon Tax on local labor markets.
Amazon Tax
The enactment of the Amazon Tax legislation by state governments establishes that out-of-stateretailers are required to collect state sales taxes for purchases realized in-state. This paper studies thee�ect the Amazon Tax legislation has over the local labor market.
To provide some context, consumers across US are responsible for paying sales taxes from out-of-state purchases, also known as “use taxes”. Use taxes are set to discourage circumventing sales taxesthrough out-of-state consumption. Consumers are required to remit use taxes on the income taxreturns annually. However, Manzi (2010) �nds that only 27 states that have sales and income taxesinclude a line on the income tax return to report use tax. Furthermore, he �nds that more than 89%of the of income tax returns of those states do not report any use tax. Low compliance on use taxreporting could be explained due to use taxes not being collected at the time of the purchase and
5See Figure 7
7
consumers relying on retailers to collect sales taxes.6
Moreover, in the 1992 case Quill v. North Dakota, the US Supreme Court ruled that out-of-stateretailers cannot be required to collect state sales taxes due to lack of nexus (physical presence) in thestate. The reason sustained by the Court was that otherwise collecting sales taxes would impermissi-bly burden interstate commerce due to many diverse taxing jurisdictions.7 Hence, since 1992, the USSupreme Court ruling gave a price advantage to out-of-state online retailers over brick-and-mortarretailers. Furthermore, several researchers estimate and forecast revenue losses from uncollected statesales taxes due to e-commerce. Bruce and Fox (2001) estimates these losses were $7B in 2001 and fore-casts those losses to be $29.17B in 2011 (2.83% of total sales tax collection). As estimates and forecastshave been updated the revenue losses have increased.8
As state government’s concerns increased, in 2008, the state of New York enacted the �rst legis-lation that changed the de�nition of nexus to require sales tax collection from out-of-state retailers.The de�nition of nexus as physical presence was replaced by “having a constitutionally su�cientconnection between the state and business”. The new legislation considers retailers that have a�li-ates, associates or subsidiaries in-state to have a su�cient connection with the state, and hence beingrequired to collect sales taxes.9
In the following years, 28 states have implemented sales taxes on out-of-state e-commerce sales bymaking the de�nition of nexus broader. These legislation changes, also known as the “Amazon Tax”,have been associated to increases in sales tax collection and declines in consumption. Afonso (2019)�nds that the Amazon Tax increases local sales tax revenue while comparing tax revenue collection inNorth Dakota counties with South Dakota counties after North Dakota enacted the Amazon Tax.Moreover, he �nds that the policy change bene�ts more urban jurisdictions than rural or tourism-rich jurisdictions due to the urban jurisdiction also collecting local sales taxes. Additionally, Baughet al. (2018) estimates a reduction of Amazon purchases by 9.4% due to Amazon sales tax collection.These �ndings are supported by Kacamak and Wilking (2020), which shows that consumers face
6Since the di�erence between sales taxes and use taxes relies on the location of the retailer, on the remaining of thepaper, I will use sales taxes and use taxes interchangeably.
7Lunder and Pettit (2014)8Bruce and Fox (2004) estimate the losses as $15.5B in 2003 and forecast them as $21.5B in 2008. Bruce et al. (2009)
update the estimates to $23.39B in 2008 and the forecast to $30.67B in 2011 with an high growth sales scenario of $40.82Bfor the same year. Additionally, Omar et al. (2008) estimates that the revenue losses would rise to $62.1B by 2011.
9A previous attempt to increase and simplify sales tax collection, in 2005, 13 state governments signed the StreamlineSales and Use Tax Agreement (SSUTA), while 10 additional states were incorporated as full members at a later date. Theagreement is meant to ease the registration process for businesses operating in multiple sales tax-levying states, as well asset common sales tax-related de�nitions and rules, simplifying rate structures. The agreement also provides exemptionsfor smaller remote sellers from tax collection responsibilities, even though they were already exempt from collecting dueto Quill. Finally, the agreement proposes providing all participating remote sellers free tax software. Nevertheless, as thede�nition of nexus requires physical presence, in SSUTA states, out-of-state retailers collect tax voluntarily. Hence, thee�ect of SSUTA on tax revenue collection is not clear.
8

higher prices and reduced their online expenditure.Previous papers focus on the year in which Amazon.com, Inc. (Amazon) starts collecting sales
taxes, which entails Amazon decision and may lead to endogeneity issues. The timing of Amazon’sdecision to start collecting sales taxes may be correlated with local economic conditions that alsoa�ect other retailers decisions. As previous papers are focusing on consumer behavior, relying onAmazon Tax collection does not bring the same endogeneity issues. Instead, I focus on the AmazonTax enactment dates from state legislation. By focusing on the enactment of the legislation, I intendto avoid any type of anticipation that retailers and consumers may face.
the Amazon Tax de�nition of nexus only allowed state governments to collect sales taxes fromout-of-state retailers that were selling their own goods. However, some online retailers, like Amazon,act both as retailers and marketplace. In a further e�ort to reduce tax revenue losses, state govern-ments enacted new legislation in the years 2017 and 2018, broadening again the de�nition of nexusto include marketplace collection. Hence, I restrict my analysis to the period 2005-2016.
Finally, in the 2018 case South Dakota v. Wayfair, Inc, the US Supreme Court overruled Quillstating not only that physical presence was no longer needed, but also highlights “ the inherentlyunfair competitive advantage of online retailers over retailers with a physical presence in a state andthe economic distortions caused by businesses who intentionally avoid any physical presence in astate.” (Newmark et al., 2019). In other words, Wayfair ruling supports the idea that before theenactment of the Amazon Tax, out-of-state retailers had a price advantage over brick-and-mortarretailers. Removing the price advantage through sales tax collection a�ected consumption patternsand helped the states recover tax revenue losses, however, it is unclear how it a�ected local businessin particular and local labor markets in general.
Data Sources and Empirical Strategy
Data and Sample
I use the variation in state the Amazon Tax enactment to evaluate the e�ects of E-commerceon local labor markets. I combine information from a number of sources regarding employment,number of establishments, occupational shares and wages, for the years 2010-2016.
I de�ne a local labor market as a commuting zone-state unit of observation. Following Dorne(2009), identifying local labor markets using commuting zones presents two advantages: the largecoverage of US, and that, instead of being based on state borders or population, commuting zonesrely principally on economic geography. However, from the 722 commuting zones, 18% cross stateborders, hindering the distinction between treated and control areas due to the Amazon Tax legisla-
9
tion being enacted by states. Therefore, I split commuting zones that cross state borders to de�ne theunits of observation. One advantage of splitting commuting zones by states is that the partition of acommuting zone in an untreated state is a good comparison of the partition of the same commutingzone in a treated state. However, if the local markets are integrated, spillovers may occur, leading tothe violation of stable unit treatment value assumption (SUTVA). As a robustness check, I excludecommuting zones that cross state borders from the analysis.10
To evaluate the e�ects of e-commerce on establishments and employment over time I use datafrom County Business Patterns (CBP). CBP data is elaborated by the U.S. Census Bureau from theBusiness Register (BR), which combines several data sources as the Economic Census, Annual Sur-vey of Manufactures and Current Business Surveys, and IRS administrative records. CBP countyannual data includes the number of establishments, employment during the week of March 12, �rstquarter payroll, and annual payroll of each 6-digit industry. To preserve the con�dentiality of in-dividual employers, U.S. Census Bureau suppressed the number of employees for the majority ofcounty-industry cells. Accordingly, a ag is provided indicating the bin in which the suppressednumber belongs to. Bartik et al. (2018) and Eckert et al. (2021) both overcome the suppression by de-veloping linear programming methods that impute the suppressed values. I use Eckert et al. (2021)imputed version, since not only harmonize industry codes to NAICS 2012, but also bridge countycodes making them consistent through the entire panel. Eckert et al. (2021) impute 1975-2016 CBPemployment values with an algorithm relies on linear programming. The algorithm minimizes thedistance to the midpoint of the agged bin, conditional on being inside the interval and all valuesadding to the parent category both by industry and geography. The algorithm also accounts forinconsistent bounds due to possible errors either in the employment of disclosed cells or in the em-ployment bounds of the suppressed cells.
In 2017, the U.S. Census Bureau changed the disclosure rule for cells with less than 3 establish-ments, removing ags—rendering all algorithms inadequate to impute 2017 and 2018 employmentvalues. Therefore, I restrict my analysis of CBP to the period 2010-2016.
I combine the data on number of establishments and employment with population and workingage population data from Census Intercensal Population Estimates for the periods 2000-2010 and2010-2020. The Census Intercensal Population Estimates is a product from the U.S. Census Bureau,which reconcile the postcensal population and housing units estimates with the census counts at thecounty, state and national level. The annual population county estimates account for births, deathsand migration patterns and are constructed using the Das Gupta method, con�rming that the sumof county estimates amounts to the national level. Finally, I collapse the data to commuting zone -state level using crosswalks from CBP county 2000 and CBP county 2010 de�nitions provided by
10Results are robust to excluding commuting zones that cross state borders from the sample
10
Autor, Dorn and Hanson (2013).To evaluate changes in wages and the occupational structure, I rely on data from the IPUMS-
USA version of the American Community Survey (ACS). ACS data was collected yearly starting in2005. The dataset consists of a yearly 1-in-100 nationally representative sample and contains ques-tions regarding employment status, occupation and pre-taxes wages and salaries received in the pre-vious calendar year (annual income wages). I de ate wages and salaries to 2014 usd and measurechanges in the occupational structure through changes in occupational shares. I harmonize oc-cupational codes to the 2010 Standard Occupational Classi�cation System (SOC). I focus on an-nual income wages of employees in retail (NAICS 44) and last mile transportation and warehousing(NAICS 49) as well as occupational shares of sales and related occupations (SOC 41-) and transporta-tion and material moving occupations (SOC 53-) employees. The smallest identi�able geographicalunit in ACS data is the Public-Use Microdata Area (PUMA) de�ned by the Census Bureau every 10years. To evaluate the e�ects on local labor markets, I collapse the data at commuting zones - state, us-ing crosswalks from PUMA 2000 and PUMA 2010 de�nitions to commuting zone de�nition fromAutor and Dorn (2013) and Autor, Dorn and Hanson (2019).
Additionally, given that the Amazon Tax e�ects in the labor market may be mediated by con-sumption, as a robustness check I control for predictors of changes in consumption and e-commerceconsumption. To predict for changes in consumption, I rely on the median household income esti-mates from the Small Area Income and Poverty Estimates (SAIPE) Program. The SAIPE Programis conducted by the US Census Bureau, which combines data from administrative records, surveydata and population estimates to produce median household income estimates at the county level.To predict changes in e-commerce consumption patterns, I collect location records of Amazon.com,Inc ful�llment centers provided by MWPVL International.11 The main reasons to use Amazon lo-cations as predictor of e-commerce consumption patters are twofold: Amazon is one of the biggeste-commerce retailer in the period studied, and, Amazon sets locations such that it minimizes ship-ping costs according to consumption patterns.12 I complement data on the location of Amazon.com,Inc. ful�llment centers from MWPVL International with information on closed ful�llment centersfrom newspaper articles.13
11MWPVL International is a �rm which provides services on supply chain and logistics network strategy. As partof their research analysis of the current Amazon.com logistics network they collected Amazon.com ful�llment center’slocations.
12See Houde et al. (2017)13Results are robust to the inclusion of time-varying controls, however, these speci�cations may incorporate addi-
tional bias as these controls may also be a�ected by the enactment of the Amazon Tax.
11
Identi�cation
In order to estimate the e�ect of e-commerce on local labor markets, I exploit the idea that thee-commerce growth was fueled by the price advantage that out-of-state e-commerce retailers hadover in-state retailers. Hence, I de�ne the treatment as the enactment of an the Amazon Tax bythe state government. While previous literature evaluating the e�ects of the Amazon Tax de�netreatment when Amazon starts collecting sales taxes, by focus on the enactment of legislation I avoidany possible anticipation.
I consider commuting zones in states that enacted an the Amazon Tax in 2013 as treated obser-vations, while commuting zones in states that did not enacted an the Amazon Tax before 2016 are inthe control group (never treated). Additionally, I exclude from the sample those commuting zonesin states that signed voluntary collection agreements(VCA) and where Amazon was not collectingsales taxes before 2008. The main reason for these exclusions is that while the enactment of newlegislation can be considered exogenous, voluntary collection agreements and amazon deciding tocollect sales taxes before any legislation changes involve negotiation between state o�cials and Ama-zon, Inc, leading to not only possible endogeneity but also anticipation from other actors. Table 1presents a list of states that are in treated and control groups, while Figure 11 shows in which yearsstates enacted such legislation.
In an ideal experiment, state government would randomly enact the Amazon Tax to reduce suchprice advantage, leading to local labor markets in treated states and in control states to be statisticallyidentical in observable and unobservable characteristics. Not only that is not the case, but treatedand control states exhibit di�erences in observable characteristics. Table 2 shows a comparison ofsome observable characteristics in treated and control states before the �rst year of treatment (2005-2007). States that enacted the Amazon Tax have higher sales tax rates, lower household income, andhigher rate of older and more educated population. Moreover, states that enacted the Amazon Taxexhibit a di�erent industry composition that states that did not enact the Amazon Tax.
In the absence of random assignment, the di�erence-in-di�erence (DID) approach estimatesthe policy e�ects in a quasi-experimental setting by comparing the outcome of a treated and controlunits before and after the enactment of the Amazon Tax. While DID approach does not requirethat treated and control units are similar in characteristics, it does rely on the assumption that theoutcome of treated and control units present parallel trends. Hence, by assuming parallel trends, inthe absence of the treatment, treated units would have exhibit same trends as control units. Then,the main identi�cation assumption is that commuting zones in states where the legislation was en-acted and commuting zones in states which did not enact the Amazon Tax exhibit parallel trends inemployment, wages, number of establishments and occupational shares that would have continuein the absence of the treatment.
12
To evaluate the validity of the parallel trend assumption, �rst I visually compare outcomes’ aver-ages between treated and control commuting zones (CZ) in the pre-period. Figures 8, 9 and 10 showthe comparisons for employment/working age population, wages and establishment/population byindustry and retail occupational shares corresponding to CZ treated in 2013 and never treated CZ.With the exception of establishments per population in retail, the remaining outcomes do not ex-hibit parallel pre-trends.
A more formal traditional approach to evaluate the parallel trend assumption consists on testingthe signi�cance of the lead coe�cients in an even study, which I evaluate together with the results inthe next section.
Finally, I assume that there are no spillover e�ects between commuting zones. One possiblethreat to this assumption is that in commuting zones located at state borders, the enactment of theAmazon Tax in a particular state a�ects not only the employment of the commuting zones in thatstate, but also employment in neighbouring commuting zones out of that state. Additionally, com-muting zones that are located in more than one state may face a threat to the assumption if the marketis integrated leading to e�ects in the area located in the non treated state. In order to evaluate thesethreats to the stable unit treatment value assumption (SUTVA), I exclude from the speci�cation allcommuting zones in state borders as well as commuting zones that cross state borders as robustnesscheck.14
Econometric Speci�cation
In order to analyze the e�ects of removing a price advantage for out-of-state e-commerce retailers,I implement the Event Study Di�erence-in-Di�erences methodology.
With County Business Patterns (CBP) data, I estimate the following equations:
Ycy =∑k
ψkDksy + αc + γy + εcy
Ycy = αc + γy + δDsy + εcy
withDksy = I[y− ey = k] being a dummy variable equal to one if state s at year y the Amazon
Tax has been enacted. I focus on two main outcome variables, the ratio of employment over workingage population in a commuting zone c at time y, Empcy
Popcy× 100000, and the ratio of the number
of establishments over total population, EstcyPopcy
× 100000 for both retail and transportation andwarehousing sectors.
14All results are robust to the exclusion of commuting zones that cross state borders from the sample
13

With American Community Survey (ACS) data, I estimate the following equations:
Ycy =∑k
φkDksy + δc + θy + νcy
Ycy = αc + γy + δDsy + εcy
withDksy = I[y−ey = k] being a dummy variable equal to one if state s at year y the Amazon Tax is
enacted. The outcome variables are logarithm of annual income wages of retail and transportationand warehousing employees, as well as the shares of employment on occupations i in commutingzone c at year y, Ycyi = Empcyi
Empcy. I focus on sales occupations, o�ce and service occupations, and
transportation, construction and production occupations, and managerial and professional occu-pations, following the Standard Occupational Classi�cation System.
In both cases, I include commuting zone and year �xed e�ects as well as weights by populationin 2005. Also, as the treatment takes place at the state level, I cluster standard errors at the state.
Since the removal of a price advantage changed consumption patterns a�ecting brick-and-mortarand e-commerce retailers, I focus on two industries: retail (NAICS 44) and it’s main substitute re-lated with e-commerce retail, last mile transportation and warehousing (NAICS 49). Notice that myde�nition of transportation and warehousing (NAICS 49) does not include freight or transporta-tion of passengers, only postal services and courier messengers. For the aforementioned industries,I evaluate the following labor market outcomes Y : employment per working age population, num-ber of establishments per population and wages. Additionally, to evaluate changes in the local oc-cupational structure, I focus on changes in the shares of retail employment for transportation andmaterial moving occupations, production and construction occupations (SOC 53-, 51-, 45-, 47- and29- ), o�ce and service occupations (SOC 43-, and 3X-), sales and related occupations (SOC 41-),and managerial and professional occupations (SOC 1X- and 2X-)
In the following sections I present the results evaluating the di�erence-in-di�erences of commut-ing zones in states that enacted the Amazon Tax in 2013. By focusing only on one group-time ATT,I circumvent the bias in ATT estimates due to di�erential timing. Moreover, as the pre-treatmentperiod covers the period after the Great Recession, the comparison considers commuting zones thatwere already a�ected in the same way, without contamination from the Great Recession e�ects it-self. Finally, since CBP data from years after 2017 cannot be imputed due to disclosure rules changes,and the Marketplace legislation was also enacted in 2017, looking at commuting zones treated in 2013allows me to evaluate the ATT with a 3 year post-period window.
14

Results
Employment E�ects
Among the concerns regarding the growth in e-commerce and the competition it presents fortraditional brick-and-mortar retailers is that e-commerce retail requires fewer local retail employ-ees. Moreover, as e-commerce retail depends on transportation and warehousing, the growth in e-commerce should be accompanied with an increase in employment in the transportation and ware-housing sector. As the enactment of the Amazon Tax may reduce the incentives for e-commerceretail entrance while increasing the incentives for traditional retailers to switch to an hybrid model,as click-and-brick, I start the analysis by evaluating changes in employment in general as well as em-ployment for both retail and last mile transportation and warehousing sectors.
First, I evaluate the parallel trend assumption visually by observing the pre-period event studycoe�cients. Figure 12 presents the event study estimates corresponding to employment/workingage population for main sectors: overall, transportation and warehousing, retail, warehouse clubsand supercenters, and general brick-and-mortar. I observe that in all cases there is no evidence ofpre-trends, however, the pre-period estimates are noisy.
Table 3 presents the di�erence-in-di�erences estimates of the enactment of the Amazon Tax.Panel A presents the estimates for the entire sample, while panel B and C presents the estimates forurban commuting zones and non-urban commuting zones respectively.
I �nd that the di�erence in employment per 100,000 working population after the enactment ofthe Amazon Tax, when compared with prior to it was 326.5 higher among those commuting zonesin states that enacted the Amazon Tax than those commuting zones in states without the AmazonTax enactment.
Moreover, I �nd that in the transportation and warehousing sector, there is a decrease in em-ployment of 34.82 employees per 100,000 working age population in commuting zones in states thatenacted the Amazon Tax compared to commuting zones in states that did not enacted the AmazonTax. This e�ect represents a 9.57% decrease from the pre-period baseline mean.
Additionally, I �nd that in the retail sector, there is also a decrease in employment of 74.56 em-ployees per 100,000 working age population after the enactment of the Amazon Tax in commutingzones in treated states versus commuting zones in states without the enactment of the Amazon Tax.The decline in retail employment represents 1.01% of its pre-period baseline mean.
However, when I di�erentiate between warehouse clubs and supercenters and other brick-and-mortar retailers, I �nd that the decrease in employment is driven by a decrease in employment ofother brick-and-mortar retailers of 2.32% of its baseline mean, while employment in warehouse clubsand supercenters increases by 6.27% with respect of its baseline mean, after the enactment of the
15

Amazon Tax.Panels B and C show that the changes in retail employment in all sub-sectors are driven by
changes in retail employment in urban commuting zones, while retail employment in non-urbanareas exhibit no statistically and economically signi�cative changes.
Wages E�ects
The expansion of e-commerce may have additional consequences on retail and transportationand warehousing employees. Several claims have been made on how e-commerce can harm employ-ees in the retail sector. (Chava et al., 2018) �nds that after Amazon opens a ful�llment center in-come related wages of brick-and-mortar employees decrease, mostly due to a reduction in workinghours. Since the enactment of the Amazon Tax creates incentives not only for Amazon and othere-commerce retailers to set locations in the state, but also for brick-and-mortar retailers to convertto an hybrid system, the e�ects on wages may go in both directions. In this section, I explore whatare the e�ects of the enactment of the Amazon Tax on income wages and hours worked.
First, I evaluate the parallel trend assumption visually by observing the pre-period event studycoe�cients. Figure 14 presents the event study estimates corresponding to the logarithm of annualincome wages for main sectors: overall, transportation and warehousing and retail. I observe that inall cases there is no evidence of pre-trends, however, the pre-period estimates are noisy.
Table 4 presents the di�erence-in-di�erences estimates of the enactment of the Amazon Tax.Panel A presents the estimates for the entire sample, while panel B and C presents the estimates forurban commuting zones and non-urban commuting zones respectively.
I �nd that the di�erence in annual income wages of retail employees after the enactment of theAmazon Tax, when compared with prior to it is 1.19 percent lower among those commuting zones instates that enacted the Amazon Tax than those commuting zones in states without the Amazon Taxenactment, while the hourly wages of retail employees is 1.32 percent lower. Both declines in hourlyand annual wages of retail employees are not statistically signi�cant.
Moreover, I �nd that in the transportation and warehousing sector, there is a decrease of 8.3percent of annual wages and 7.7 percent of hourly wages in commuting zones in states that enactedthe Amazon Tax compared to commuting zones in states that did not enacted the Amazon Tax.These e�ects are both statistically signi�cative at 1% and 5% respectively.
Panels B and C show that the changes in wages of transportation and warehousing employees aredriven by changes in wages for employees in urban commuting zones, while wages of transportationand warehousing employees in non-urban areas exhibit no statistically and economically signi�cativechanges.
16
Establishments E�ects
One of the arguments to remove the price advantage that e-commerce retailers had over brick-and-mortar retailers is that brick-and-mortar establishments were closing at an alarming rate due tothe disadvantage. Moreover, the media named this phenomenon “Retail Apocalypse”, while politi-cians presented the Amazon Tax policies as a way to reduce brick-and-mortar establishments’ clo-sures. I evaluate the e�ect of the Amazon Tax enactment on the number of establishments in bothretail and transportation and warehousing sectors.
First, I evaluate the parallel trend assumption visually by observing the pre-period event studycoe�cients. Figure 13 presents the event study estimates corresponding to number of establish-ments/population for main sectors: overall, transportation and warehousing, retail, warehouse clubsand supercenters, and general brick-and-mortar. I observe that in all cases there is no evidence of pre-trends, however, the pre-period estimates are noisy.
Table 4 presents the di�erence-in-di�erences estimates of the enactment of the Amazon Tax.Panel A presents the estimates for the entire sample, while panel B and C presents the estimates forurban commuting zones and non-urban commuting zones respectively.
I �nd that the di�erence in retail establishments per 100,000 people after the enactment of theAmazon Tax, when compared with prior to it was 1.97 lower among those commuting zones instates that enacted the Amazon Tax than those commuting zones in states without the Amazon Taxenactment.
Moreover, I �nd that in the transportation and warehousing sector, there is a decrease of 0.18establishments per 100,000 people in commuting zones in states that enacted the Amazon Tax com-pared to commuting zones in states that did not enacted the Amazon Tax. This e�ect represents a1.88% decrease from the pre-period baseline mean, however it is not statistically signi�cative.
Additionally, when I di�erentiate between warehouse clubs and supercenters and other brick-and-mortar retailers, I �nd that the decrease in retail establishments is driven by a decrease in thenumber of establishments of other brick-and-mortar retailers of 0.53% of its baseline mean, whilethe number of establishments in warehouse clubs and supercenters increases by 3.14% with respectof its baseline mean, after the enactment of the Amazon Tax. Only the increase in the number ofestablishments in warehouse clubs and supercenters is statistically signi�cant.
Panels B and C show that the changes in retail establishments in all sub-sectors are driven bychanges in retail establishments in urban commuting zones, while retail establishments in non-urbanareas exhibit no statistically and economically signi�cative changes.
17
Occupational Structure E�ects
Given that e-commerce retail and brick-and-mortar retail require employees on di�erent occupa-tions, with di�erent skills, in this section I explore what are the e�ects of the Amazon Tax enactmenton the retail occupational shares of four categories of main occupations of retail: transportation andmaterial moving occupations, production and construction occupations (SOC 53-, 51-, 45-, 47- and29- ), o�ce and service occupations (SOC 43-, and 3X-), sales and related occupations (SOC 41-),and managerial and professional occupations (SOC 1X- and 2X-).
First, I evaluate the parallel trend assumption visually by observing the pre-period event studycoe�cients. Figure 15 presents the event study estimates corresponding to retail occupational shares.I observe that in all cases there is no evidence of pre-trends, however, the pre-period estimates arenoisy.
Table 6 presents the di�erence-in-di�erences estimates of the enactment of the Amazon Tax.Panel A presents the estimates for the entire sample, while panel B and C presents the estimates forurban commuting zones and non-urban commuting zones respectively.
I �nd that the di�erence in the retail share of sales occupations after the enactment of the Ama-zon Tax, when compared with prior to it was 0.397 percentage points lower among those commut-ing zones in states that enacted the Amazon Tax than those commuting zones in states without theAmazon Tax enactment.
Moreover, I �nd that the retail share of managerial and professional occupations faces an increaseof 0.29 percentage points in commuting zones in states that enacted the Amazon Tax compared tocommuting zones in states that did not enacted the Amazon Tax. This e�ect represents a 3.23%increase from the pre-period baseline mean.
Additionally, I �nd that in the retail sector, there is also a decrease the share of transportation,construction and production occupations as well as an increase in the share of o�ce and servicerelated occupations after the enactment of the Amazon Tax in commuting zones in treated statesversus commuting zones in states without the enactment of the Amazon Tax. The decline in theshare of transportation, construction and production occupations represents 0.09% of its pre-periodbaseline mean, while the increase in the share of o�ce and services related occupations represents0.58% of its pre-period baseline mean.
However, neither of the aforementioned e�ects are statistically signi�cative.Panels B and C show that the changes in retail transportation, construction and production
share are driven by changes in urban commuting zones, while changes in the retail occupationalshares of o�ce and services and sales occupations are driven by non-urban areas. Moreover, these lastchanges represent an increase of 7.14 percent of the pre-period baseline mean of o�ce and servicesoccupational shares and a decrease of 4.79 percent of the pre-period baseline mean of sales occu-
18

pational shares respectively in non-urban areas. Both these e�ects are statistically and economicallysigni�cative changes.
Discussion of E�ects of E-commerce
Theoretical framework
Although the primary contribution of this paper is empirical, in this section I provide somestructure for thinking about the e�ects of e-commerce on local labor markets when a price advantageis reduced or removed.
I observe suggestive evidence of a decline of the number of retail establishments, as well as adecline in retail employment, mostly explained by a decline in urban retail employment. In urbanareas I also �nd a decline in employment at department stores and an increase in employment atwarehouse clubs and supercenters, as well as a decline in wages of transportation and warehousingemployees. In non-urban areas I �nd a decline in the retail share of sales and related occupations.
I evaluate these results in the context of the enactment of the Amazon Tax, which force out-of-state online retailers to collect sales taxes removing their price advantage over di�erent types ofbrick-and-mortar retailers.
In the following subsections I present a four-sector general equilibrium model in which I evalu-ate an increase in the tax rate corresponding to out-of-state e-commerce retail sales. I also show underwhich conditions the empirical results hold, and explore the fundamentals behind those conditionsby discussing consumers’ substitution and workers’ substitution.
The Basic Model
In this section I present a four-sector general equilibrium model with one factor of production(labor, L). The four sectors I consider are: general brick-and-mortar retail (B), warehouse clubs andsupercenters (S), out-of-state e-commerce retail (E) and transportation and warehousing (T). Theproduction of the three types of retail (B, S, E) occurs in a constant returns to scale environment:
B = LB, S = LS, E = T = LT (I)
Additionally, out-of-state e-commerce retail is produced in-state with transportation and ware-housing services (W), which in turn are produced with labor. To simplify notation I labelLT = LE .
In this setup, labor has a �xed total supply, but workers can freely move between sectors (withno unemployment). Thus:
19
LB + LS + LE = L (II)
In each sector, labor is paid the value of its marginal product in competitive markets (zero pro�tcondition)15:
pBB = wBLB, pSS = wSLS, pEE = wELE (III)
Workers’ decision regarding how much labor they want to allocate in each sector is given by theircorresponding wages, wB, wS, wE and their indirect utility V (wB, wS, wE), which is re ected inthe elasticities of substitution:
η1 =
d(LS/LB)LS/LB
d(wB/wS)wB/wS
, η2 =
d(LE/LB)LE/LB
d(wB/wE)wB/wE
, η3 =
d(LS/LE)LS/LE
d(wE/wS)wE/wS
(IV)
I assume that workers preferences for working in the di�erent sectors are well-behaved (complete,transitive, monotonic and convex), hence η1 > 0, η2 > 0 and η3 > 0
Finally, consumers maximize their utilityU(B, S,E). Consumer’s preferences are characterizedby the elasticity of substitution (in demand) betweenB, S andE (σ1, σ2, σ3):
σ1 =
d(S/B)S/B
d(pB(1+τB)/pS(1+τS))pB(1+τB)/pS(1+τS)
, σ2 =
d(E/B)E/B
d(pB(1+τB)/pE(1+τE))pB(1+τB)/pE(1+τE)
, σ3 =
d(S/E)S/E
d(pE(1+τE)/pS(1+τS))pE(1+τE)/pS(1+τS)
(V)where the consumer price for i = B, S,E is pi(1 + τi) and τi is an ad valorem tax on i. I
assume that consumers’ preferences are well-behaved (complete, transitive, monotonic and convex),and they see retail from di�erent sectors as substitutes, hence σ1 > 0, σ2 > 0 and σ3 > 0
The consumer budget constraint here is implied by the assumption that the tax revenues arerebated lump sum to consumers and equations in (III).
In this economy, with pre-existing tax rates τB , τS and τE , I evaluate the e�ect of a small increasein the tax rate of out-of-state e-commerce retail (E).
Solving for equilibrium e�ects
In this subsection, I present the equations of change of the model following the log-linearizationmethod of Jones (1965). Totally di�erentiating the production functions from equations in (I):
15While these markets rarely behave as perfectly competitive markets, this simplifying assumption allows me to focusin the competition across channels instead of the competition within each channel
20

B = LB (1)
S = LS (2)
E = LE (3)
Where i is the proportional change of i = B, S,E, i ≡ di/i, and Li is the proportional changeof labor in sector i = B, S,E, Li ≡ dLi/Li
From di�erentiating the resource constraint:
λXLX + λY LY + λZLZ = 0 (4)
Here, the fraction of labor supplied used in the production of retail is given by λi for i = B, S,E,with λi = Li
L. As before, Li ≡ dLi
Liis the proportional change in Li.
I totally di�erentiate the equations in (III)to obtain:
pB + B = wB + LB (5)
pS + S = wS + LS (6)
pE + E = wE + LE (7)
From the de�nition of workers’ elasticity of substitution between sectors:
LB − LS = η1 (wS − wB) (8)
LB − LE = η2 (wE − wB) (9)
LE − LS = η3 (wS − wE) (10)
Finally, from the de�nition of consumer’ elasticity of substitution for types of retail(B, S,E):
B − S = σ1 (pS + τS − pB − τB) (11)
B − E = σ2 (pE + τE − pB − τB) (12)
E − S = σ3 (pS + τS − pE − τE) (13)
With τi = dτi1+τi
This model is characterized by the assumptions of perfect competition, perfect mobility, perfectinformation and perfect certainty, and de�ned by equations (1)-(18).
21
E�ects of the Amazon Tax
I solve for the e�ects of an increase in the ad valorem tax rate on sales of out-of-state e-commerceretail, sector E, while the remaining tax rates do not change, τB = 0,τS = 0. Since I focus on realbehavior, I choose S as numeraire, hence pS = 0. The general solutions are:16
wS = pS = 0 (14a)
wE = pE = wT = pT = −AτE (14b)
wB = pB = −AεLτE (14c)
LE = E = LT = T = [λSσ1εUA︸ ︷︷ ︸Indirect E�ect
+ (λE − 1)σ2(εU − 1)A︸ ︷︷ ︸Direct E�ect
]τE (14d)
LB = LB = [λSσ1εUA+ λEσ2(εU − 1)A] τE (14e)
LS = LS = [(λS − 1)σ1εUA+ λEσ2(εU − 1)A] τE (14f )
where εU and εL are the relative di�erences in preferences for consumers and workers respec-tively: εU = σ3−σ2
σ1−σ2 and εL = η3−η2η1−η2 , andA ≡ 1
1− εLεU
.From (14a), wages in sector S do not change. The change of wages and price in sectorE is pro-
portional with respect toA, which measures the relation between relative di�erences in preferencesfor consumption and labor, from (14b).
The e�ects of increasing the tax rate on sales of E on the production of both B, S and E andtheir respective labor requirements can be split in two e�ects, Direct e�ects, and Indirect e�ects. TheDirect e�ect re ects the trade-o� that the consumer faces when substituting between general brick-and-mortar retail (B) and out-of-state e-commerce retail(E). The Direct E�ect from both (14d),(14e) and (14f) consists of an e�ect given by the elasticity of substitution σ2 between consumptionof B and E, which is in turn weighted by a function of share of labor used in the production ofE and the ratio of elasticity di�erences for consumption (εU ) and A, the relation between relativedi�erences in preferences for consumption and labor.
The Indirect e�ect re ects the trade-o� that the consumer faces when substituting across brick-and-mortar retailers, that is between general brick-and-mortar retail (B) and warehouse clubs and
16See Appendix for derivations
22
supercenters (S). The Indirect E�ect from both (14d), (14e) and (14f) consists of an e�ect given bythe elasticity of substitution σ1 between consumption of B and S, which is in turn weighted bya function of share of labor used in the production of S and the ratio of elasticity di�erences forconsumption (εU ) and A, the relation between relative di�erences in preferences for consumptionand labor.
Both the direct e�ect and the indirect e�ect are a result of changes in relative prices of e-commercepE , since they both include the change in prices and wages in sectorE from equation (14b)
The following propositions show under which conditions a rise on the tax rate on sales of Eleads to a rise or fall of the wages, and prices, ofB andE
Proposition 1 The wage, and price, ofE will fall if an only if:
εL =η3 − η2η1 − η2
<σ3 − σ2σ1 − σ2
= εU
That is, wages in transportation and warehousing will fall if and only if the relative di�erences inpreferences for consumers, εU , is larger than the relative di�erences in preferences for workers, εL.
An example where this proposition holds is a case where consumers’ elasticity of substitutionbetween e-commerce retail and warehouse clubs and supercenter retail, σ3, is larger than consumers’elasticities of substitution for both types of retail with respect of general brick-and-mortar retail, σ2and σ1, while the workers’ elasticities of substitutions are similar across the three sectors.
Proposition 2 The wage, and price, ofB will fall if an only if:
1
εU=σ1 − σ2σ3 − σ2
<η1 − η2η3 − η2
=1
εL
Hence, wages in general brick-and-mortar retail will fall if and only if the inverse of relative di�er-ences in preferences for consumers, εU , is larger than the inverse of relative di�erences in preferencesfor workers, εL. Proposition 2 also holds with the previous example.
The following propositions show under which conditions a rise on the tax rate on out-of-statee-commerce sales, τE > 0, leads to a rise or fall of the labor requirements of the three sectors.
Proposition 3 Let εU and εL are the relative di�erences in preferences for consumers and workersrespectively: εU = σ3−σ2
σ1−σ2 and εL = η3−η2η1−η2 , and C = λSσ1
(λE−1)σ2. E-commerce consumption,E, as well
as labor requirements in transportation and warehousing,LW , will fall if an only if either one of thesecases holds:
Case I: 0 < εL < εU and εU < 11+C
Case II: εL < εU , εL < 0 and εU > 11+C
23
Case III: εL > εU , εL > 0 and εU > 11+C
Case IV: 0 > εL > εU and εU < 11+C
Under cases I and II, Propositions 1 and 2 also hold. The additional requirement for Proposition3 to hold is given by the consumers’ relative elasticity of substitution of general brick-and-mortarretail with respect to other retail sectors, σ1/σ2, weighted by the ratio of labor shares in warehouseclubs and supercenters and e-commerce retail, λS/(λE − 1). Notice that as λE − 1 < 0, C isalso negative. Hence, for case I to hold, it must be the case that 0 ≤ |C| < 1 and larger enoughsuch that εU < 1
1+C.The underlying condition such that the absolute value of C is smaller than 1
is given by λS/(1 − λE) < σ1/σ2, where λS/(1 − λE) = λS/(λS + λB) < 1. An example inwhich case I may be true is if consumers’ elasticity of substitution between general brick-and-mortarand warehouse clubs and supercenters is smaller than their elasticity of substitution between generalbrick-and-mortar and e-commerce retail. For case II to hold, it must be true that either≤ |C| > 1 orεU >
11+C
; then a su�cient condition is thatλS/(1−λE) > σ1/σ2 which holds withσ1 su�cientlysmall.
Under cases III and IV, Propositions 1 and 2 don’t hold, which implies that wages in transporta-tion and warehousing and general brick-and-mortar retail increase when the tax on e-commerce in-crease. Moreover, case III and IV only require εU > 1
1+Cand εU < 1
1+Crespectively, without any
boundary restriction forC .
Proposition 4 Let εU and εL are the relative di�erences in preferences for consumers and workers re-spectively: εU = σ3−σ2
σ1−σ2 and εL = η3−η2η1−η2 , andD = (λS−1)σ1
λEσ2. Retail warehouse clubs and supercenters
consumption, S, as well as its labor requirements will rise if an only if either one of these cases holds:Case V: 0 < εL < εU and εU > 1
1+D
Case VI: εL < εU , εL < 0 and εU < 11+D
Case VII: εL > εU , εL > 0 and εU < 11+D
Case VIII: 0 > εL > εU and εU > 11+D
Under cases V and VI, Propositions 1 and 2 also hold. The additional requirement for Proposi-tion 4 to hold is given by the consumers’ relative elasticity of substitution of general brick-and-mortarretail with respect to other retail sectors, σ1/σ2, weighted by the ratio of labor shares in warehouseclubs and supercenters and e-commerce retail, (λS − 1)/λE . Notice that as λS − 1 < 0, D is alsonegative. Hence, for case V to hold, it can be true that either≤ |D| > 1 or εU > 1
1+D; then a su�-
cient condition is that (1 − λS)/λE = (λB + λE)/λE > σ1/σ2 which holds with σ1 su�cientlysmall, since (1− λS)/λE > 1. For case VI to hold, it must be the case that 0 ≤ |D| < 1 and largerenough such that εU < 1
1+D.The underlying condition such that the absolute value ofD is smaller
24
than 1 is given by (1 − λS)/λE < σ1/σ2, where (1 − λS)/λE = λE + λB/λE > 1. An examplein which case VI may be true is if consumers’ elasticity of substitution between general brick-and-mortar and warehouse clubs and supercenters is smaller than their elasticity of substitution betweengeneral brick-and-mortar and e-commerce retail.
Under cases VII and VIII, Propositions 1 and 2 don’t hold, which implies that wages in trans-portation and warehousing and general brick-and-mortar retail increase when the tax on e-commerceincrease. Moreover, case VII and VIII only require εU < 1
1+Dand εU > 1
1+Drespectively, without
any boundary restriction forD.
Proposition 5 Let εU and εL are the relative di�erences in preferences for consumers and workersrespectively: εU = σ3−σ2
σ1−σ2 and εL = η3−η2η1−η2 , and F = λSσ1
λEσ2. Retail consumption from general brick-
and-mortar retailers, B, as well as their labor requirements will fall if an only if either one of thesecases holds:
Case IX: 11+F
> εU > εL > 0
Case X: εU > 11+F
> 0 > εL
Case XI: εL > εU >1
1+F> 0
Case XII: 0 > εL > εU and εU < 11+F
Under cases IX and X, Propositions 1 and 2 also hold. The additional requirement for Proposi-tion 5 to hold is given by the consumers’ relative elasticity of substitution of general brick-and-mortarretail with respect to other retail sectors, σ1/σ2, weighted by the ratio of labor shares in warehouseclubs and supercenters and e-commerce retail, λS/λE . Notice that as both λS and λE are shares oflabor employed in each sector, λS/λE > 0, then F is also positive and 1/(1 + F ) < 1. For caseIX to hold, it must be true that εU < 1; then a necessary condition is that either σ3 < σ1 with σ2su�ciently small or σ3 > σ1 with σ2 su�ciently large. The opposite is true for cases X and XI.
Under cases XI and XII, Propositions 1 and 2 don’t hold, which implies that wages in transporta-tion and warehousing and general brick-and-mortar retail increase when the tax on e-commerce in-crease. Moreover, case XI and XII only require εU < 1
1+Fand εU > 1
1+Frespectively. Case XII
requires then that εU < 1, or equivalently either σ3 < σ1 with σ2 su�ciently small or σ3 > σ1 withσ2 su�ciently large, while case XI does not impose any additional boundary restriction for F .
Finally, the following proposition shows in which cases a rise on the tax rate on out-of-statee-commerce sales, τE > 0, leads to the observed e�ects present in the empirical results: a fall ofwages in transportation and warehousing and general brick-and-mortar retail, a fall in employmentin transportation and warehousing and general brick-and-mortar retail, and an rise in employmentin warehouse clubs and supercenters.
25
Proposition 6 Let εU and εL are the relative di�erences in preferences for consumers and workersrespectively: εU = σ3−σ2
σ1−σ2 and εL = η3−η2η1−η2 . Both the wages and employment in transportation and
warehousing and general brick-and-mortar retail will fall wT = wE < 0, wB < 0, LT = LE <
0, LB < 0, while employment in warehouse clubs and supercenters will rise, LS > 0, if an only if:1
1+λSσ1λEσ2
> εU > εL > 0, and 1−λEλS
> σ1σ2> λE
1−λS
Under Proposition 6, Propositions 1-5 hold simultaneously. A necessary condition behind Proposi-tion 6 are that either the consumer elasticity of substitution between general brick-and-mortar retailand e-commerce retail is larger than the consumer elasticity of substitution between warehouse clubsand supercenters retail and e-commerce retail, which in turn is larger to the consumer elasticity ofsubstitution between general brick-and-mortar retail and warehouse clubs and supercenters retail,σ2 > σ3 > σ1, or that the consumer elasticity of substitution between general brick-and-mortar re-tail and warehouse clubs and supercenters retail is larger than the consumer elasticity of substitutionbetween warehouse clubs and supercenters retail and e-commerce retail, which in turn is larger tothe consumer elasticity of substitution between general brick-and-mortar retail and e-commerce re-tail, σ1 > σ3 > σ2. Hence, it must be the case that the consumer elasticity of substitution betweenwarehouse clubs and supercenters retail and e-commerce retail is between the remaining consumerelasticities of substitution between brick-and-mortar retail and the other types or retail. Moreover,since 1 > εL > 0, workers’ elasticity of substitution elasticity of substitution between working atwarehouse clubs and supercenters retail and transportation and warehousing is between the remain-ing workers’ elasticities of substitution between working at brick-and-mortar retail and at the othertwo sectors, either η2 > η3 > η1 or η1 > η3 > η2, is also a necessary condition of Proposition 6.
Then given that on average the increase in sales taxes was of 5.6%, for a decrease in wages oftransportation and warehousing employees of 7.7%, it must be true that εU > 2.1εL.
Substitution in the retail market
In this section, I explore the determinants of the elasticities of substitution. As mentioned be-fore, a consumer can either buy from a brick-and-mortar retailer, either a general brick-and-mortar ora warehouse club and supercenter, or buy online from an out-of-state e-commerce retailer. I assumeconsumers buy multiple goods, and for each good acquisition they decide over the three purchasingoptions.
Each purchasing option involves a cost Cij = h(·) associated with the type of retailer j andhow the consumer i perceives the purchase. The �rst di�erence in purchasing costs between buyingfrom a brick-and-mortar retailer and buying from an e-commerce retailer comes from the searchingtime that consumers spend on selecting the product. Searching times, tj = g(θj, ψj) are a�ected
26

by how well the retailer shows the product characteristics, θj , and how much variety,ψj , they o�er.For example, through e-commerce, consumers face lower costs associated to accessing detailed infor-mation of the characteristics of the products, comparing across products, comparing prices acrossdi�erent sites and buying with a click in their computer or mobile device. On one hand, brick-and-mortar store o�ers limited product variety, however, by searching online the vast product varietycan obfuscate the consumer. Moreover, brick-and-mortar retailers proximity to each other createsan environment where consumers can visit many stores and purchase all the goods in the same visit,similar to searching online and comparing many websites. Hence, distance to the store, dj , is a keycost associated to purchases from brick-and-mortar retailers, such as the lack of proximity of somebrick-and-mortar stores, like outlet malls, to consumers creates a challenge for consumers withouttransportation means. Besides, while delivery is not needed in brick-and-mortar stores, it is requiredat online purchases, adding waiting time, mj , and shipping costs, sj , to the associated purchasingcosts. Additionally, pre-purchase interactions at brick-and-mortar stores reduce consumption costsrelated to measure, touch, smell, try and feel the products, which is not possible online. I considerthis cost as experience related costs X , where X = 0 at the store and X = 1 online. Finally thereare some learning costs,Lij associated with purchasing in general. For instance, when buying in thestore the consumer learns where the products are located, if those products are moved to di�erentshelves the consumer will have to re-learn the products location. Furthermore, buying online re-quires developing certain skills as knowing how to browse the Internet and how to recognize safesites and platforms from scams.
Consumers then maximize utility given by:
Uij = vi − pj − Cij
depending on how much their value the good vi, the price they face at each purchasing option pj ,and the associated cost from the purchase,Cij = h(tj, sj,mj, dj, Xj, Lij).
As out-of-state e-commerce retailers do not collect sales taxes, consumers buying from them paya price p, while consumers buying from general brick-and-mortar retailers pay the price p(1 + τ),with τ being the ad valorem sales tax. As warehouse clubs and supercenters usually o�er discountsdue to buying in bulk, consumers buying from them pay the price p′(1+τ). For simplicity, I assumep < p′(1 + τ) < p(1 + τ) and that the associated purchasing cost at both brick-and-mortar retailoptions are the same (Cis).
Hence, in this setting, the elasticities of substitution between purchasing channels are functionsof both the price advantage and consumers’ purchasing associated costs. In that sense, as urban andrural areas have observable characteristics that lead to di�erences in both the type of price advantage
27
and the determinants of purchasing associated costs, I expect di�erences in consumers’ substitutionpatterns. For example, urban areas not only have state sales taxes, they also have local sales taxes.Hence, in urban areas the price advantage is not removed when the Amazon Tax is enacted, onlyreduced, which may lead to a smaller substitution between e-commerce purchases and brick-and-mortar purchases by consumers. On the other hand, consumers in rural areas may face lower prod-uct variety, higher distance to the stores, waiting times, shipping costs, and learning costs due to lackof access to internet. While the �rst two imply higher associated costs for purchases from brick-and-mortar retailers, the last three imply higher associated costs for purchases from e-commerce retailers.Therefore, we may expect larger or smaller substitution from consumers depending which mecha-nisms prime.
Additionally, once the price advantage is removed, general brick-and-mortar retailers may haveincentives to enter to the e-commerce retail market, given that now they compete with e-commerceretailers at the same prices, while e-commerce retailers may have incentives to locate closer to con-sumers, given that now they have to collect taxes everywhere.
Retail production and and substitution in the labor market
In the previous section, I assume that retailers in each sector produce retail with only labor. How-ever, from the empirical analysis, the retail production functions require di�erent combinations oftasks performed by employees from a variety of occupations (skills) according to the type of retail.Let’s consider the main four occupational groups present in retail: sales employeesLsi, professionaland managerial employees Lpi, transportation, production and construction employees Lti, o�ceand service employeesLoi and let θhi be the share of each occupation h required for the productionin sector i = X, Y, Z , andLi be the vector of retail employment required to produce in such sector.
Notice that while out-of-state e-commerce retail requires only last mile transportation and ware-housing services in the local labor market, when located in-state e-commerce retail also requires em-ployees from the main four occupations. For the following analysis, I focus on in-state e-commercerequirements since general brick-and-mortar retailers may have incentives to enter into e-commerceretail market and out-of-state e-commerce retailers may have incentives to locate closer to consumers.To make the distinction clear, I label in-state e-commerce retail sector asO.
In line with the observations from the data, I assume thatLY > LX > LO, that is e-commerceretailers require less employees than general brick-and-mortar retailers and warehouse clubs and su-percenters. I also assume that general brick-and-mortar retailers require larger shares of sales andrelated occupations and smaller shares of the remaining occupations than e-commerce retailers, andthat warehouse clubs and supercenters require a larger share of service and o�ce occupations thangeneral brick-and-mortar retailers, but smaller than e-commerce retailers. Finally, I assume that ware-
28
house clubs and supercenters require smaller shares of transportation, production and constructionoccupations and professional and managerial occupations than both general brick-and-mortar ande-commerce retailers. Hence:
θsY > θsX > θsO, θpO > θpX > θpY , θoO > θoY > θoX and θtO > θtX > θtY .Here, in-state e-commerce retail requirements for transportation and related occupations are
here considering both in-house and out-sourced. Previously, I’ve chosen to consider that out-of-statee-commerce retailers outsource last mile transportation and warehousing instead of conducting thisprocesses in-house as that was how major e-commerce retailers conduct the last mile transportationand warehousing during the period studied.
For the following analysis let’s consider a labor market problem as a simpli�cation of Bartik(2018). In this framework, in-state occupational wages are determined by the inverse labor-demandelasticity σh and a labor productivity shifter αh such that the inverse-labor demand for a given oc-cupation is wh = αhLD
−σhh , where the in-state labor demand LDh for each occupation h be
LDh =∑
j lhj , with j = X, Y,O representing the in-state retail sectors, general brick-and-mortarretail, warehouse clubs and supercenters and e-commerce retail.
In the baseline model, workers chose how much of their work is allocated to each sector. How-ever, as sectors have di�erent requirements over occupations, it is reasonable to assume that workersare in fact choosing over occupations. Hence, in this framework, each worker k has a bundle ofskills, Θk, to perform several tasks. I assume all bundles can be place on a line such that di�erentintervals belong to di�erent occupations. For example, transportation and material moving occu-pations require less complex skills than sales and related occupations or professional occupations.While employees that require less complex skills can acquire additional skills and access to other oc-cupations, skill acquisition is costly, since it requires human capital accumulation. Also, workerswith more complex skills can perform occupations that require less complex skills, however as theyare not the best match to those occupations, they face costs related to adaptation and lower wages.
In that sense, for given distributions of wages, skill bundles, initial occupation h0 and vacan-cies, workers select themselves into occupations such that they maximize their indirect utility overoccupation h:
vkh = ln(wh)− sHcHk × 1(h 6= h0)
Wherewh is the occupational wage, cHk is an idiosyncratic moving cost which is a function of thebundle of skills that the worker has cHk (Θk), and sH is a measure of the importance of this cost. Thissetup is a particular case of Bartik (2018) in which workers do not move across locations (locationmoving cost is set to in�nity).
The labor supply for each occupation will depend on the vector of wagesw, the initial numberof workers in each occupationNh0, and a functionG(·) that assigns probabilities of choosing each
29

occupation based onw and the distribution function of moving costs F (cHi ):
LSh(w) =∑h0
Nh0G(F (cHi ), w)
The equilibrium in the labor market is characterized by the aggregate labor demand being equalto the aggregate labor supply for each occupation:
LDh(w) = LSh(w)
As the labor demand for each occupation is the sum of all retailers labor demands for such oc-cupation, the labor demand in a given occupation will be a�ected by both the importance of eachretailer in the total labor demand, previously de�ned as λj , as well as the shares that the occupationrepresents in each retailer labor demand, θhj .
As an increase in the sales tax rate for out-of-state e-commerce retailers reduces their demand oflast mile transportation and warehousing services, that will lead to a decline of the labor demand andwages of transportation employees in that sector.
Moreover, if as response of the removal of the price advantage there is an increase in employmentin warehouse clubs and supercenters and a decrease in employment of general brick-and-mortar re-tail, we may expect a decline in the labor demand of transportation and professional occupations,and an increase in the labor demand of sales and o�ce occupations. Given the observed wages andoccupational moving costs, transportation employees may be underquali�ed to work in sales or o�ceoccupations, while professional employees may be underquali�ed to work in sales or o�ce occupa-tions, leading to mismatches in the retail local labor market.
Finally, as general brick-and-mortar retailers now have incentives to start selling online, and out-of-state e-commerce retailers now have incentives to locate in the local economy, we may expect adecrease in the labor demand of sales occupations, and an increase in the labor demand of profes-sional, o�ce and transportation occupations. Given the observed wages and occupational movingcosts, sales employees may be overquali�ed to work in transportation occupations, or underquali�edto work in professional or o�ce occupations, leading to mismatches in the retail local labor market.
Conclusion
In this paper, I present evidence of a non-neutral role of e-commerce on local labor markets. I�nd that the enactment of legislation requiring out-of-state e-commerce retailers to collect sales taxes,known as the Amazon Tax, lead to decreases in retail employment and number of establishments(1%), as well as in last-mile warehousing and transportation employment (9.57%) and wages (7.7%),
30
consistent with the �ndings of Chun (2019) and Chava et al. (2018). Moreover, I discover thesee�ects are more pronounced in urban commuting zones, and they are explained by a decrease inemployment of general brick-and-mortar retailers while employment of warehouse and supercentersincreases.
Additionally, in non-urban commuting zones, I observe a change in the retail occupational struc-ture consisting of an increase in the share of o�ce and service related occupations (7.14%) and a de-crease in the share of sales and related occupations (4.79%).
Finally, I show that the e�ects of e-commerce di�er by sector and spatial dimension. Through ageneral equilibrium model, I connect the di�erential e�ects with di�erent elasticities of substitution,which is consistent with Bar-isaac et al. (2012) and Vitt (2020).
These results suggest that even though e-commerce retail is only a small portion of the retail sec-tor, it plays an important role in the local economy, in contrast to the conclusions of Hortacsu andSyverson (2015). The di�erential e�ects in employment in warehouse clubs and supercenters andgeneral brick-and-mortar retail may indicate that once e-commerce retail price advantage is removedthe competition between the �rst two retail sectors could intensify, forcing general brick-and-mortarretailers to downsize or go out of business. On non-urban areas, the compositional changes in em-ployment could imply that retailers may turn into a hybrid model anticipating internet usage growth.
Furthermore, the results may indicate the ine�ectiveness of an increase in sales taxes, such asthe enactment of the Amazon Tax, to slow down or stop the “Retail apocalypse”. The ine�cacy ofthis policy may be caused by erroneous perceptions of elasticities of substitution sizes. Additionalresearch is needed regarding both consumers’ and workers’ preferences to better identify policiesthat protect retail employees from the changes caused by e-commerce growth.
References
Afonso, W. B. (2019). The Impact of the Amazon Tax on Local Sales Tax Revenue in Urban andRural Jurisdictions. Public Budgeting and Finance, 39(2):68–90.
Bar-isaac, H., Caruana, G., and Cunat, V. (2012). Search, Design, and Market Structure. AmericanEconomic Review, 102(2):1140–1160.
Bartik, A. W. (2018). Moving Costs and Worker Adjustment to Changes in Labor Demand: Evi-dence from Longitudinal Census Data. Working Paper.
Bartik, T. J., Biddle, S. C., Hershbein, B. J., and Sotherland, N. D. (2018). WholeData: UnsuppressedCounty Business Patterns Data: Version 1.0 [dataset]. Technical report, W. E. Upjohn Institutefor Employment Research.
31

Baugh, B., Ben-David, I., and Park, H. (2018). Can Taxes Shape an Industry? Evidence from theImplementation of the “Amazon Tax”. Journal of Finance, 73(4):1819–1855.
Berg, N., Knigths, M., and Samarin, A. (2019). Amazon: How the world’s most relentless retailer willcontinue to revolutionize commerce. Kogan Page Limited, New York, United States.
Bruce, D. and Fox, W. F. (2001). State and Local Sales Tax Revenue Losses from E-Commerce :Updated Estimates. 4170(September).
Bruce, D. and Fox, W. F. (2004). State and local sales tax revenue losses from e-commerce: Estimates.State Tax Notes, 33(September):511–518.
Bruce, D., Fox, W. F., and Luna, L. (2009). State and Local Government Sales Tax Revenue Losses.State Tax Notes, 52(7):537–558.
Cavallo, A. (2017). Are online and o�ine prices similar? Evidence from large multi-channel retailers.American Economic Review, 107(1):283–303.
Chava, S., Oettl, A., Singh, M., and Zeng, L. (2018). The Dark Side of Technological Progress?Impact of E-Commerce on Employees at Brick-and-Mortar Retailers. SSRN Electronic Journal.
Chun, H. (2019). Di�usion of E-Commerce and Retail Job Apocalypse : Evidence from CreditCard Data on Online Spending *. pages 1–31.
Eckert, F., Fort, T. C., Schott, P. K., and Yang, N. (2021). Imputing missing values in the US CensusBureau’s County Business Patterns.
Einav, L., Knoep e, D., Levin, J., and Sundaresan, N. (2014). Sales taxes and internet commerce.American Economic Review, 104(1):1–26.
Fang, X. and Policy, E. (2020). Exploring the impact of e-commerce on cities and villages : The caseof Amazon and Alibaba. (August).
Gebelo�, R. and Russell, K. (2017). How the growth of E-commerce is shifting retail jobs. NewYork Times, page B1.
Goldmanis, M., Hortacsu, A., Syverson, C., and Emre, O. (2010). E-Commerce and the MarketStructure of Retail Industries. Economic Journal, 120(545):651–682.
Hortacsu, A. and Syverson, C. (2015). The ongoing evolution of US retail: A format tug-of-war.Journal of Economic Perspectives, 29(4):89–112.
32

Houde, J.-F., Newberry, P., and Seim, K. (2017). Economies of Density in E-Commerce: A Studyof Amazon’s Ful�llment Center Network. National Bureau of Economic Research.
Kacamak, Y. and Wilking, E. (2020). Does it matter who remits ? Evidence from U . S . states ’Voluntary Collection Agreements . SSRN Electronic Journal.
Kane, J. and Tomer, A. (2017). Amazon’s recent hiring spree puts new focus on warehouse jobs andworker needs. Brookings Institution, pages 1–6.
Lunder, E. K. and Pettit, C. A. (2014). ”Amazon laws” and taxation of internet sales: Constitutionalanalysis. Internet Issues and Trends: Selected Analyses, pages 141–159.
Mandel, M. (2017). The Creation of a New Middle Class?: A Historical and Analytic Perspectiveon Job and Wage Growth in the Digital Sector, Part I. Progressive Policy Institute, pages 68–70.
Manzi, N. (2010). Use Tax Collection on Income Tax Returns in Other States The Use Tax andCollection Methods : A Summary. Options, 3529:1–14.
Newmark, N. S., Jr, R. V. W., Newmark, N. S., Walk, R. F., Jr, R. V. W., Border, C., Sales, S., Taxa-tion, U., and South, A. (2019). Cross Border State Sales and Use Taxation After South Dakota v. Wayfair : A New Paradigm for E- Commerce A New Paradigm for E-Commerce. 3(1).
Omar, A., Kwun, O., and Bhutta, M. K. S. (2008). The impact of e-commerce tax policy on stateand local government revenue. pages 1–10.
Pozzi, A. (2013). The e�ect of Internet distribution on brick-and-mortar sales. RAND Journal ofEconomics, 44(3):569–583.
Tomer, A. and Kane, J. W. (2021). Where will online orders get ful�lled? The changing local geog-raphy of e- commerce. pages 1–9.
Vitt, D. C. (2020). Estimating the impact of e-commerce on retail exit and entry using google trends.Economics Bulletin, 40(1).
Wu, S. X. (2020). Adaptation to Online Competition : Equilibrium E�ects on Brick-and-MortarBookstores.
33

Figure 1: Sales growth e-commerce vs brick-and-mortar retailers
Notes: E-commerce share and brick-and-mortar share from total sales computed from Annual RetailTrade Survey years 2003-2017. E-commerce retailers here is short for electronic commerce and mailorder houses industry (NAICS 4541), brick-and-mortar retailers are the remaining retailers.
Figures
Figure 11: States in sample
Enacted Amazon TaxNo Amazon TaxNot in sample
Amazon Tax 2013
Notes: In dark blue states that enacted the Amazon Tax in 2013, in light blue states that never enactedthe Amazon Tax, in gray states excluded from sample because: enacted the Amazon Tax in otheryears,signed voluntary collection agreements with Amazon,Amazon was already collecting sales taxesdue to physical presence.
34
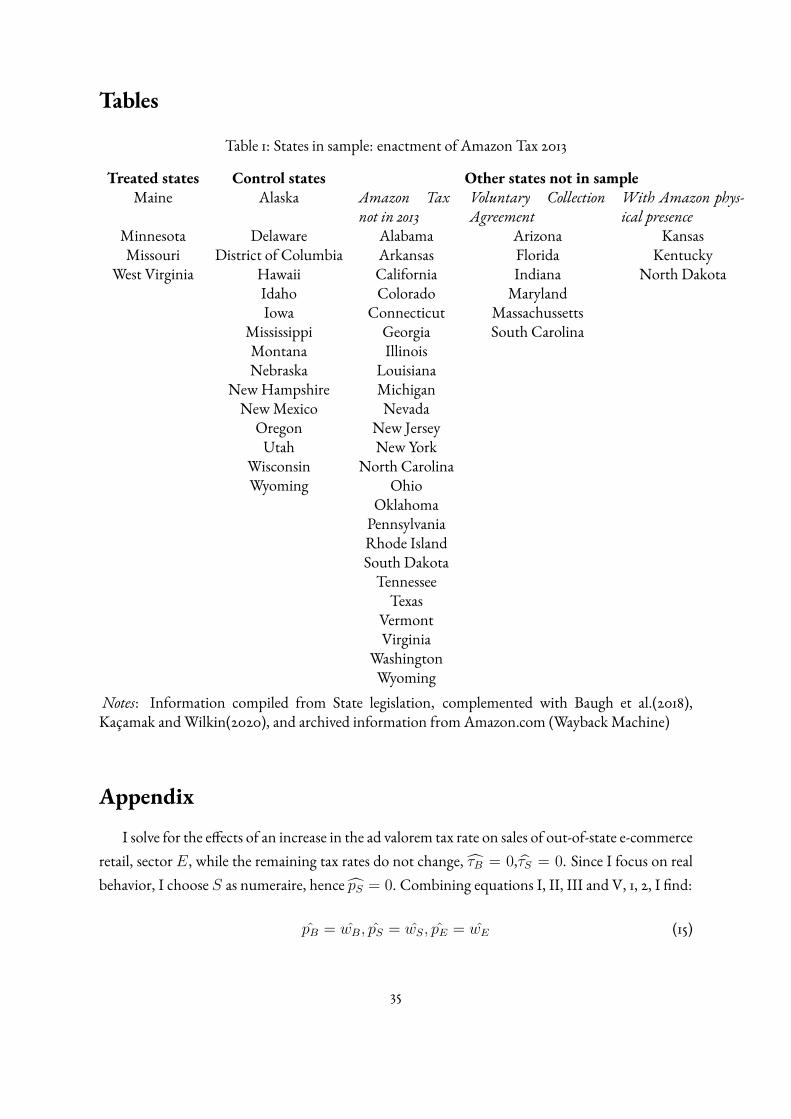
Tables
Table 1: States in sample: enactment of Amazon Tax 2013
Treated states Control states Other states not in sampleMaine Alaska Amazon Tax
not in 2013Voluntary CollectionAgreement
With Amazon phys-ical presence
Minnesota Delaware Alabama Arizona KansasMissouri District of Columbia Arkansas Florida Kentucky
West Virginia Hawaii California Indiana North DakotaIdaho Colorado MarylandIowa Connecticut Massachussetts
Mississippi Georgia South CarolinaMontana IllinoisNebraska Louisiana
New Hampshire MichiganNew Mexico Nevada
Oregon New JerseyUtah New York
Wisconsin North CarolinaWyoming Ohio
OklahomaPennsylvaniaRhode IslandSouth Dakota
TennesseeTexas
VermontVirginia
WashingtonWyoming
Notes: Information compiled from State legislation, complemented with Baugh et al.(2018),Kacamak and Wilkin(2020), and archived information from Amazon.com (Wayback Machine)
Appendix
I solve for the e�ects of an increase in the ad valorem tax rate on sales of out-of-state e-commerceretail, sector E, while the remaining tax rates do not change, τB = 0,τS = 0. Since I focus on realbehavior, I choose S as numeraire, hence pS = 0. Combining equations I, II, III and V, 1, 2, I �nd:
pB = wB, pS = wS, pE = wE (15)
35
As pS = 0 due to S being the numeraire, hence:
wS = pS = 0 (14a)
Combining equations 6,7 and 8, I obtain the expression:
pB =σ3 − σ2σ1 − σ2
(pE + τE) = εU(pE + τE) (16)
Combining equations 3,4 and 5, I obtain the expression:
pB =η3 − η2η1 − η2
pE = εLpE (17)
Combining expressions 15, 16 and 17, I �nd 14b and 14c
wE = pE = wT = pT = −AτE (14b)
wB = pB = −AεLτE (14c)
Combining equation 6 with 14b and 14c, I obtain:
S = B +σ1εLεUεL − εU
τE (18)
Combining equation 7 with 14b and 14c, I obtain:
E = B +σ2εL(εU − 1)
εL − εUτE (19)
Combining expressions 18 and 19 with equation IV and I, I �nd:
LB = LB = [λSσ1εUA+ λEσ2(εU − 1)A] τE (14e)
Combining equation II, 14e and expression 18, I obtain
LS = LS = [(λS − 1)σ1εUA+ λEσ2(εU − 1)A] τE (14f )
Finally, combining equations III, 14e and expression 19 I �nd
LE = E = LT = T = [λSσ1εUA+ (λE − 1)σ2(εU − 1)A]τE (14d)
36

36
38
40
42
44
1
2
3
4
5
6
2000 2005 2010 2015 2020Year
E-commerce and Mail Retailers Brick-and-Mortar Retailers
Sales
(a) Sales
140
145
150
155
2
3
4
5
6
2000 2005 2010 2015 2020Year
E-commerce and Mail Retailers Brick-and-Mortar Retailers
Employment
(b) Employment
Figure 2: Sales vs Employment in retail
Notes: Total sales in millions computed from Annual Retail Trade Survey years 2005-2017. Em-ployment in millions computed from County Business Patters data. Brick-and-mortar retailers areretailers that are not in the electronic commerce and mail order houses industry (NAICS 4541).37
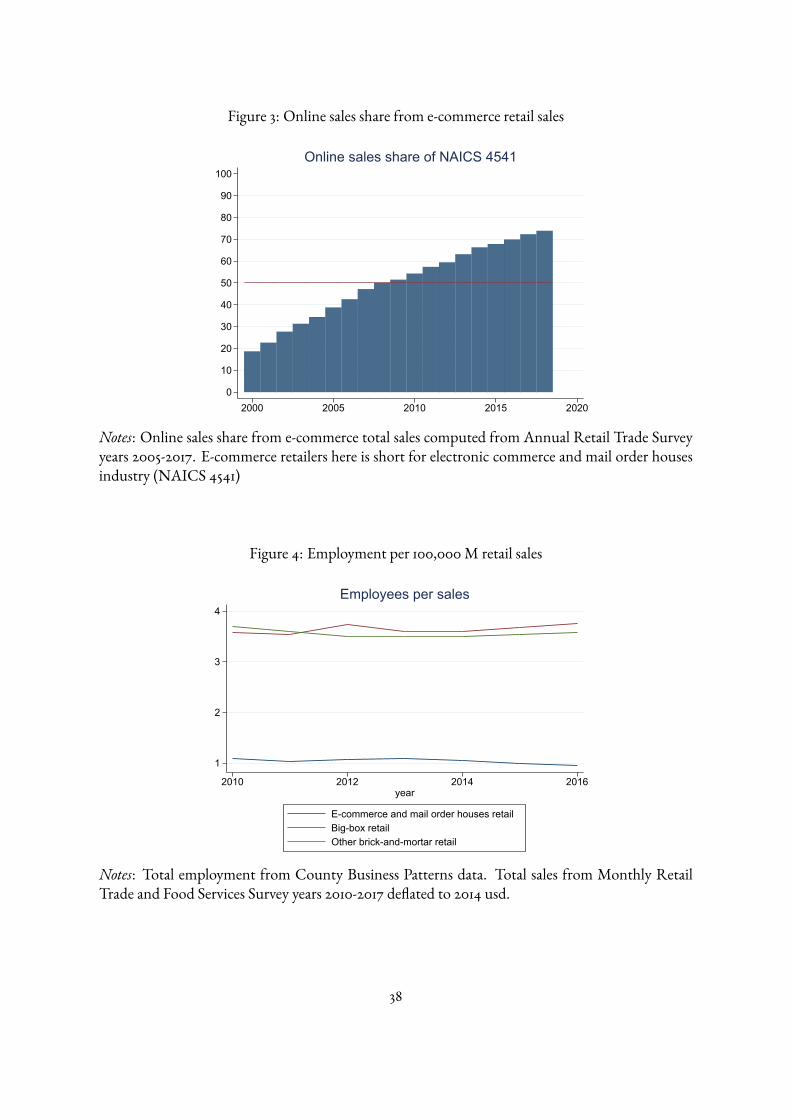
Figure 3: Online sales share from e-commerce retail sales
0
10
20
30
40
50
60
70
80
90
100
2000 2005 2010 2015 2020
Online sales share of NAICS 4541
Notes: Online sales share from e-commerce total sales computed from Annual Retail Trade Surveyyears 2005-2017. E-commerce retailers here is short for electronic commerce and mail order housesindustry (NAICS 4541)
Figure 4: Employment per 100,000 M retail sales
1
2
3
4
2010 2012 2014 2016year
E-commerce and mail order houses retailBig-box retailOther brick-and-mortar retail
Employees per sales
Notes: Total employment from County Business Patterns data. Total sales from Monthly RetailTrade and Food Services Survey years 2010-2017 de ated to 2014 usd.
38
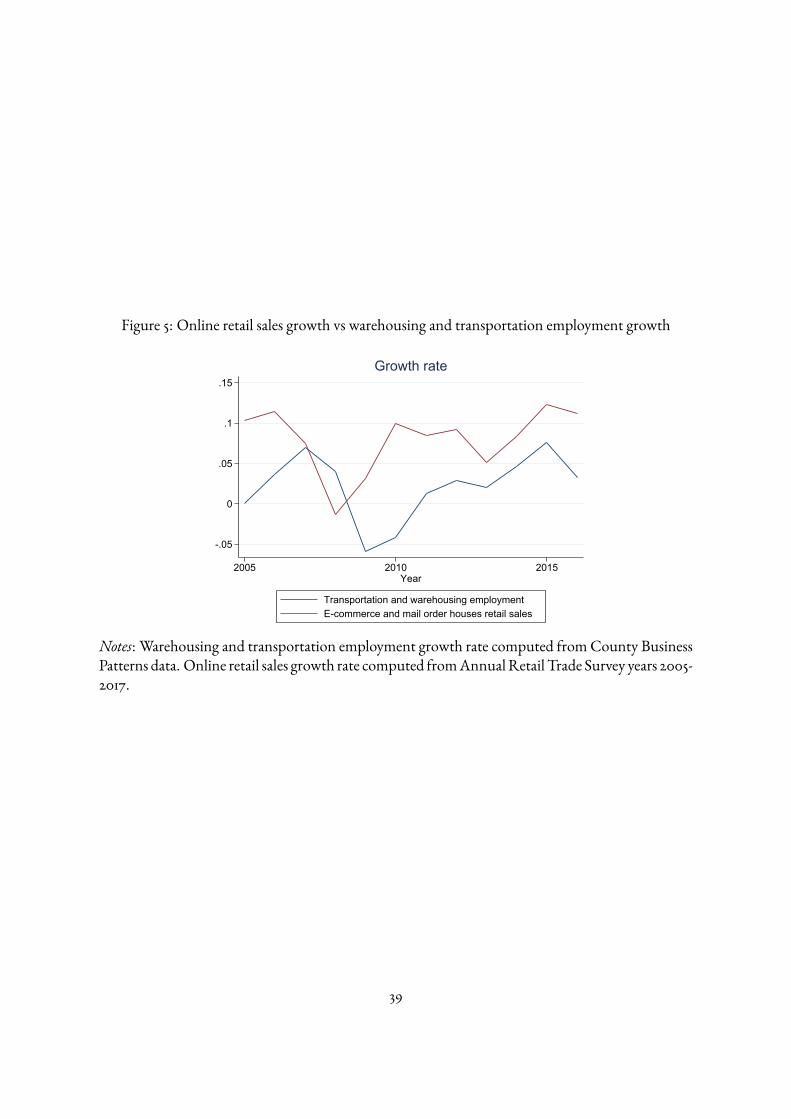
Figure 5: Online retail sales growth vs warehousing and transportation employment growth
-.05
0
.05
.1
.15
2005 2010 2015Year
Transportation and warehousing employmentE-commerce and mail order houses retail sales
Growth rate
Notes: Warehousing and transportation employment growth rate computed from County BusinessPatterns data. Online retail sales growth rate computed from Annual Retail Trade Survey years 2005-2017.
39

11 28 56 5
17 21 55 7
13 51 16 20
Retailers
Occupational Share
Warehouse clubs & supercenters
General brick-and-mortar
E-commerce
Construction, Production & Transportation Service & Office
Sales Managers & Professionals
(a) Retail Occupational Structure 2007
0.90
0.95
1.00
1.05
1.10
1.15
2005 2008 2011 2014 2017year
Occupations
office
other
professional
sales
transportation
share/share2005
(b) Changes in the occupational structure of retail
Figure 6: Occupational Structure in Retail
Notes: Panel A: Share of occupations by sub-industry from Occupational Employment and WageStatistics (OEWS) May 2007. Industries: E-commerce (NAICS 4541), Warehouse Clubs and Super-centers (NAICS 4529), General Brick-and-mortar (NAICS 441, 442, 443, 444, 445, 446, 447, 448,451, 4521, 453, 4542 and 4543). Panel B: Share of occupations from the American Community Surveyyears 2005-2017. The occupational share represents EmploymentiR/EmploymentR where i is theoccupational group and R is retail. Changes are measured with respect to 2005, as shareiR,t/shareiR,2005.Panel A and B occupational shares for major retail occupations: transportation and material moving occupa-tions, production and construction occupations (SOC 53-, 51-, 45-, 47- and 29- ), o�ce and service occupations(SOC 43-, and 3X-), sales and related occupations (SOC 41-), and managerial and professional occupations(SOC 1X- and 2X-)
40
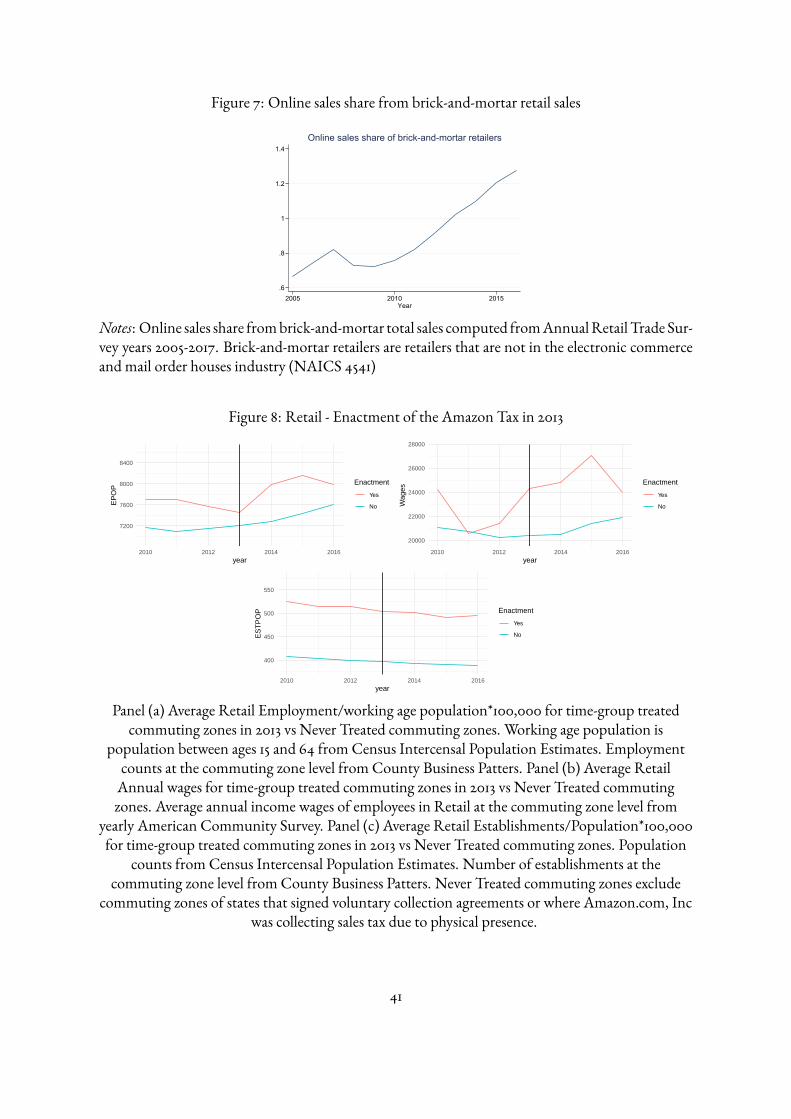
Figure 7: Online sales share from brick-and-mortar retail sales
.6
.8
1
1.2
1.4
2005 2010 2015Year
Online sales share of brick-and-mortar retailers
Notes: Online sales share from brick-and-mortar total sales computed from Annual Retail Trade Sur-vey years 2005-2017. Brick-and-mortar retailers are retailers that are not in the electronic commerceand mail order houses industry (NAICS 4541)
Figure 8: Retail - Enactment of the Amazon Tax in 2013
7200
7600
8000
8400
2010 2012 2014 2016year
EP
OP
Enactment
Yes
No
20000
22000
24000
26000
28000
2010 2012 2014 2016year
Wag
es
Enactment
Yes
No
400
450
500
550
2010 2012 2014 2016year
ES
TP
OP Enactment
Yes
No
Panel (a) Average Retail Employment/working age population*100,000 for time-group treatedcommuting zones in 2013 vs Never Treated commuting zones. Working age population is
population between ages 15 and 64 from Census Intercensal Population Estimates. Employmentcounts at the commuting zone level from County Business Patters. Panel (b) Average Retail
Annual wages for time-group treated commuting zones in 2013 vs Never Treated commutingzones. Average annual income wages of employees in Retail at the commuting zone level from
yearly American Community Survey. Panel (c) Average Retail Establishments/Population*100,000for time-group treated commuting zones in 2013 vs Never Treated commuting zones. Population
counts from Census Intercensal Population Estimates. Number of establishments at thecommuting zone level from County Business Patters. Never Treated commuting zones exclude
commuting zones of states that signed voluntary collection agreements or where Amazon.com, Incwas collecting sales tax due to physical presence.
41
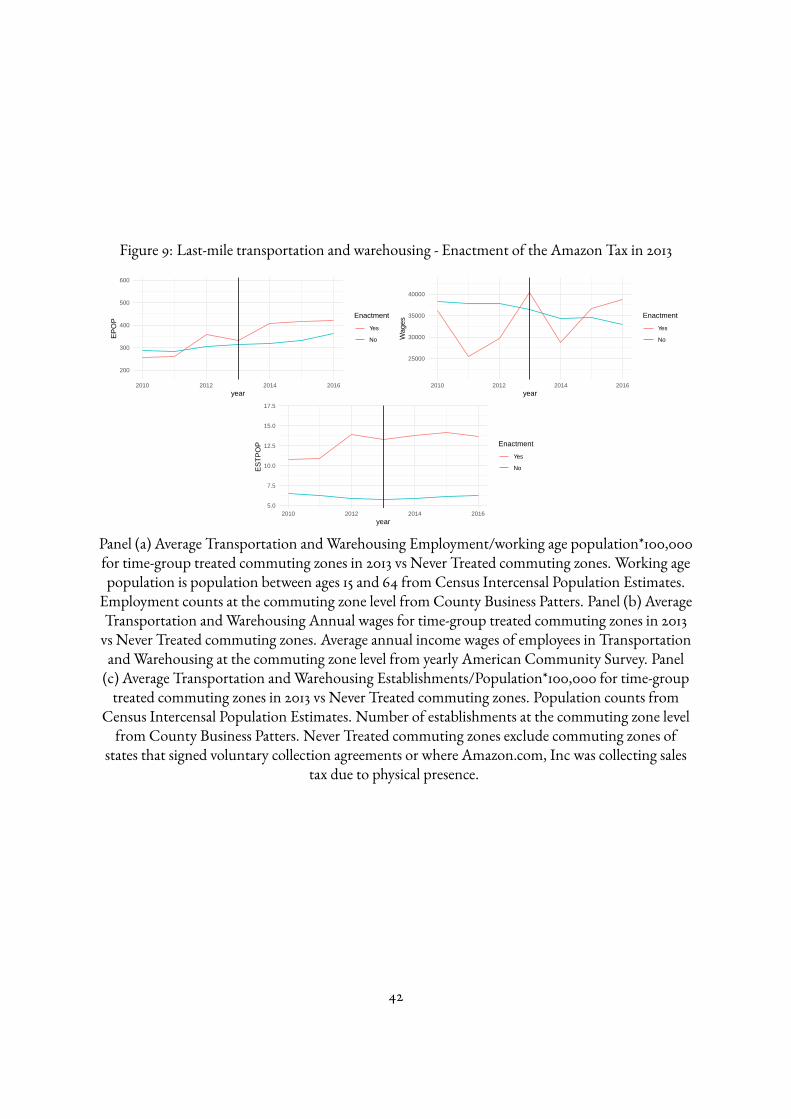
Figure 9: Last-mile transportation and warehousing - Enactment of the Amazon Tax in 2013
200
300
400
500
600
2010 2012 2014 2016year
EP
OP
Enactment
Yes
No
25000
30000
35000
40000
2010 2012 2014 2016year
Wag
es
Enactment
Yes
No
5.0
7.5
10.0
12.5
15.0
17.5
2010 2012 2014 2016year
ES
TP
OP Enactment
Yes
No
Panel (a) Average Transportation and Warehousing Employment/working age population*100,000for time-group treated commuting zones in 2013 vs Never Treated commuting zones. Working agepopulation is population between ages 15 and 64 from Census Intercensal Population Estimates.
Employment counts at the commuting zone level from County Business Patters. Panel (b) AverageTransportation and Warehousing Annual wages for time-group treated commuting zones in 2013
vs Never Treated commuting zones. Average annual income wages of employees in Transportationand Warehousing at the commuting zone level from yearly American Community Survey. Panel
(c) Average Transportation and Warehousing Establishments/Population*100,000 for time-grouptreated commuting zones in 2013 vs Never Treated commuting zones. Population counts from
Census Intercensal Population Estimates. Number of establishments at the commuting zone levelfrom County Business Patters. Never Treated commuting zones exclude commuting zones of
states that signed voluntary collection agreements or where Amazon.com, Inc was collecting salestax due to physical presence.
42

Figure 10: Employment Shares for commuting zones that enacted Amazon Tax in 2013
0.125
0.150
0.175
0.200
0.225
2010 2012 2014 2016year
SH
AR
E Enactment
Yes
No
0.15
0.20
0.25
2010 2012 2014 2016year
SH
AR
E Enactment
Yes
No
0.48
0.52
0.56
0.60
2010 2012 2014 2016year
SH
AR
E Enactment
Yes
No
0.06
0.08
0.10
2010 2012 2014 2016year
SH
AR
E Enactment
Yes
No
Panel (a) Average retail employment share of transportation, construction and productionoccupations for time-group treated commuting zones in 2013 vs Never Treated commuting zones.Panel (b) Average retail employment share of o�ce and service occupations for time-group treatedcommuting zones in 2013 vs Never Treated commuting zones. Panel (c) Average retail employment
share of sales and related occupations for time-group treated commuting zones in 2013 vs NeverTreated commuting zones. Panel (a) Average retail employment share of managerial and
professional occupations for time-group treated commuting zones in 2013 vs Never Treatedcommuting zones. Employment counts by occupation and total employment at the commutingzone level from yearly American Community Survey. Never Treated commuting zones exclude
commuting zones of states that signed voluntary collection agreements or where Amazon.com, Incwas collecting sales tax due to physical presence.
43

-2000
-1000
0
1000
Coe
ffici
ent E
stim
ate
2010 2012 2014 2016Year
(a) Overall
-150
-100
-50
0
50
Coe
ffici
ent E
stim
ate
2010 2012 2014 2016Year
(b) Transportation & warehousing
-300
-200
-100
0
100
Coe
ffici
ent E
stim
ate
2010 2012 2014 2016Year
(c) Retail
-150
-100
-50
0
50
Coe
ffici
ent E
stim
ate
2010 2012 2014 2016Year
(d) Warehouse clubs & supercenters
-300
-200
-100
0
100
Coe
ffici
ent E
stim
ate
2010 2012 2014 2016Year
(e) General brick-and-mortar retail
Figure 12: Employment/working age population by sector
Notes: Each panel shows the coe�cients and 95% con�dence interval for separate event study re-gressions of the ratio between each sector employment and working age population. Regressioncoe�cients are weighted by 2005 population and the standard errors are clustered at the state level.
44

-1
-.5
0
.5
1
Coe
ffici
ent E
stim
ate
2010 2012 2014 2016Year
(a) Transportation & warehousing
-10
-5
0
5
Coe
ffici
ent E
stim
ate
2010 2012 2014 2016Year
(b) Retail
-.5
0
.5
1
1.5
2
Coe
ffici
ent E
stim
ate
2010 2012 2014 2016Year
(c) Warehouse clubs & supercenters
-10
-5
0
5
Coe
ffici
ent E
stim
ate
2010 2012 2014 2016Year
(d) General brick-and-mortar retail
Figure 13: Number of establishments/population by sector
Notes: Each panel shows the coe�cients and 95% con�dence interval for separate event study regres-sions of the ratio between each sector number of establishment and total population. Regressioncoe�cients are weighted by 2005 population and the standard errors are clustered at the state level.
45
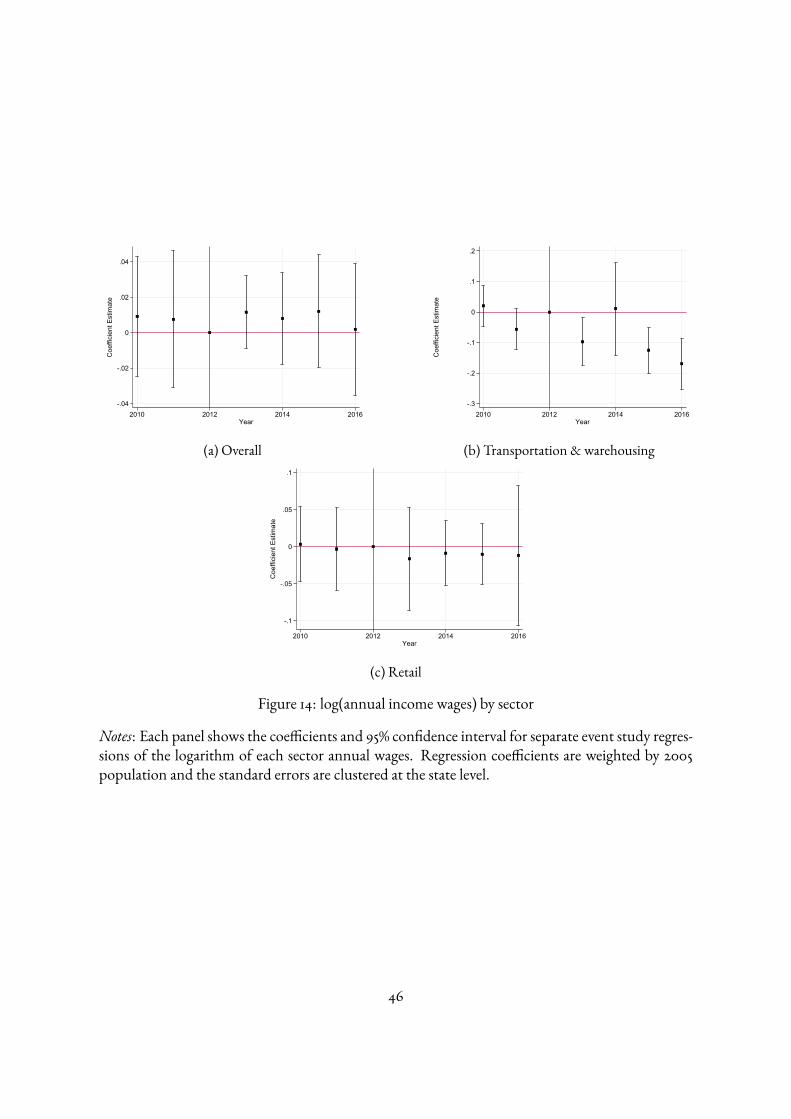
-.04
-.02
0
.02
.04
Coe
ffici
ent E
stim
ate
2010 2012 2014 2016Year
(a) Overall
-.3
-.2
-.1
0
.1
.2
Coe
ffici
ent E
stim
ate
2010 2012 2014 2016Year
(b) Transportation & warehousing
-.1
-.05
0
.05
.1
Coe
ffici
ent E
stim
ate
2010 2012 2014 2016Year
(c) Retail
Figure 14: log(annual income wages) by sector
Notes: Each panel shows the coe�cients and 95% con�dence interval for separate event study regres-sions of the logarithm of each sector annual wages. Regression coe�cients are weighted by 2005population and the standard errors are clustered at the state level.
46

-2
-1
0
1
2
3
Coe
ffici
ent E
stim
ate
2010 2012 2014 2016Year
(a) Transportation, production & construction
-2
-1
0
1
2
3
Coe
ffici
ent E
stim
ate
2010 2012 2014 2016Year
(b) O�ce & services
-6
-4
-2
0
2
4
Coe
ffici
ent E
stim
ate
2010 2012 2014 2016Year
(c) Sales
-4
-2
0
2
4C
oeffi
cien
t Est
imat
e
2010 2012 2014 2016Year
(d) Managerial & professional
Figure 15: retail occupational shares by occupation groups
Notes: Each panel shows the coe�cients and 95% con�dence interval for separate event study regres-sions of the retail occupational shares. Regression coe�cients are weighted by 2005 population andthe standard errors are clustered at the state level. Occupational shares classi�ed as: transportationand material moving occupations, production and construction occupations (SOC 53-, 51-, 45-, 47-and 29- ), o�ce and service occupations (SOC 43-, and 3X-), sales and related occupations (SOC 41-),and managerial and professional occupations (SOC 1X- and 2X-)
47
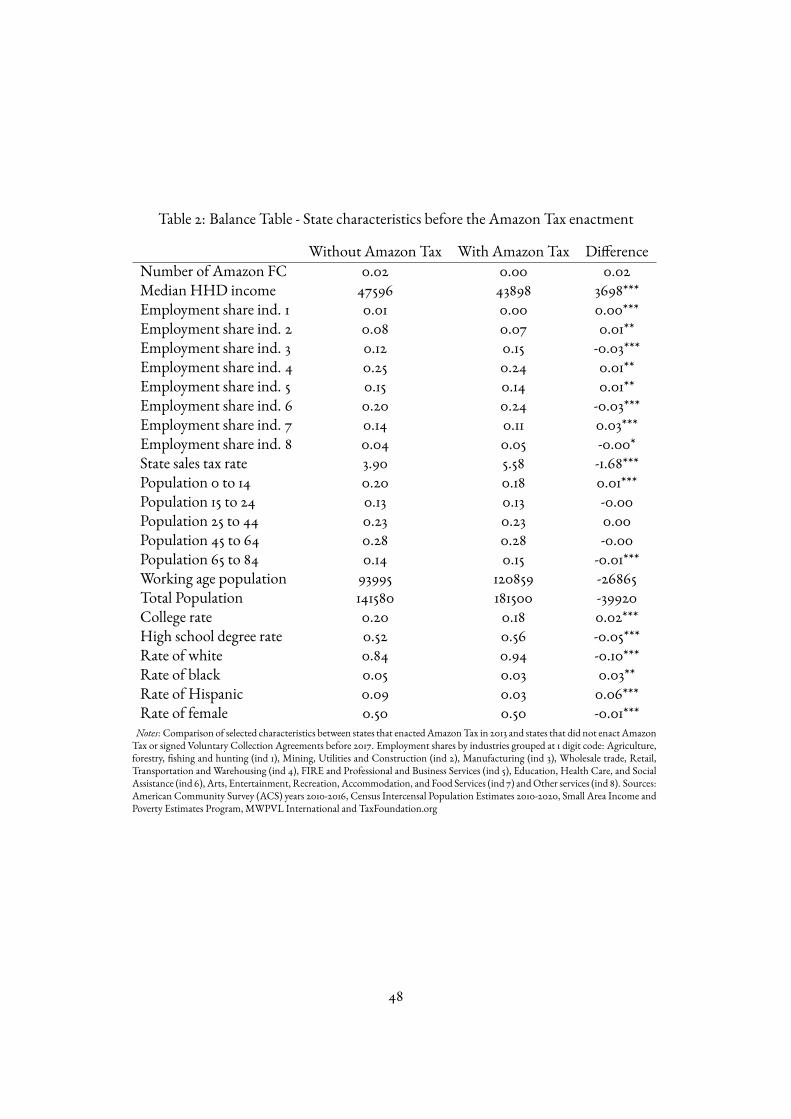
Table 2: Balance Table - State characteristics before the Amazon Tax enactment
Without Amazon Tax With Amazon Tax Di�erenceNumber of Amazon FC 0.02 0.00 0.02Median HHD income 47596 43898 3698***Employment share ind. 1 0.01 0.00 0.00***Employment share ind. 2 0.08 0.07 0.01**Employment share ind. 3 0.12 0.15 -0.03***Employment share ind. 4 0.25 0.24 0.01**Employment share ind. 5 0.15 0.14 0.01**Employment share ind. 6 0.20 0.24 -0.03***Employment share ind. 7 0.14 0.11 0.03***Employment share ind. 8 0.04 0.05 -0.00*State sales tax rate 3.90 5.58 -1.68***Population 0 to 14 0.20 0.18 0.01***Population 15 to 24 0.13 0.13 -0.00Population 25 to 44 0.23 0.23 0.00Population 45 to 64 0.28 0.28 -0.00Population 65 to 84 0.14 0.15 -0.01***Working age population 93995 120859 -26865Total Population 141580 181500 -39920College rate 0.20 0.18 0.02***High school degree rate 0.52 0.56 -0.05***Rate of white 0.84 0.94 -0.10***Rate of black 0.05 0.03 0.03**Rate of Hispanic 0.09 0.03 0.06***Rate of female 0.50 0.50 -0.01***
Notes: Comparison of selected characteristics between states that enacted Amazon Tax in 2013 and states that did not enact AmazonTax or signed Voluntary Collection Agreements before 2017. Employment shares by industries grouped at 1 digit code: Agriculture,forestry, �shing and hunting (ind 1), Mining, Utilities and Construction (ind 2), Manufacturing (ind 3), Wholesale trade, Retail,Transportation and Warehousing (ind 4), FIRE and Professional and Business Services (ind 5), Education, Health Care, and SocialAssistance (ind 6), Arts, Entertainment, Recreation, Accommodation, and Food Services (ind 7) and Other services (ind 8). Sources:American Community Survey (ACS) years 2010-2016, Census Intercensal Population Estimates 2010-2020, Small Area Income andPoverty Estimates Program, MWPVL International and TaxFoundation.org
48

Table 3: Employment
Panel A: Sample all commuting zones
Overall Transportation& Warehousing
Retail Warehouse Clubs& Supercenters
General Brick-and-MortarRetail
Enactment ofAmazon Tax
326.5 -34.82** -74.56** 66.84* -143.3***
(485.6) (13.55) (31.41) (31.85) (40.53)
Baseline mean 46848.09 364.31 7349.84 1062.36 6183.85Observations 2,051 2,051 2,051 2,051 2,051Year and CZ FE YES YES YES YES YES
Panel B: Sample urban commuting zones
Overall Transportation& Warehousing
Retail Warehouse Clubs& Supercenters
General Brick-and-MortarRetail
Enactment ofAmazon Tax
532.4 -33.20* -96.48** 86.22** -181.6***
(533.5) (18.08) (38.84) (38.83) (43.44)
Baseline mean 54564.11 496.60 7866.42 1112.24 6589.61Observations 518 518 518 518 518Year and CZ FE YES YES YES YES YES
Panel C: Sample non-urban commuting zones
Overall Transportation& Warehousing
Retail Warehouse Clubs& Supercenters
General Brick-and-MortarRetail
Enactment ofAmazon Tax
-532.9 -39.13 -1.150 -10.00 0.0713
(328.4) (25.56) (61.91) (30.77) (71.85)
Baseline mean 44240.85 319.61 7175.28 1045.51 6046.74Observations 1,533 1,533 1,533 1,533 1,533Year and CZ FE YES YES YES YES YES
Notes: Enactment of Amazon Tax refers to the di�erence-in-di�erences estimation coe�cient (δ) from Ycy = αc + γy + δDsy + εcy , where outcome variable isEmpcyPopcy
× 100000 for both each corresponding sector (columns). All speci�cations include year and commuting zone �xed e�ects and standard errors cluster at thestate level.
49
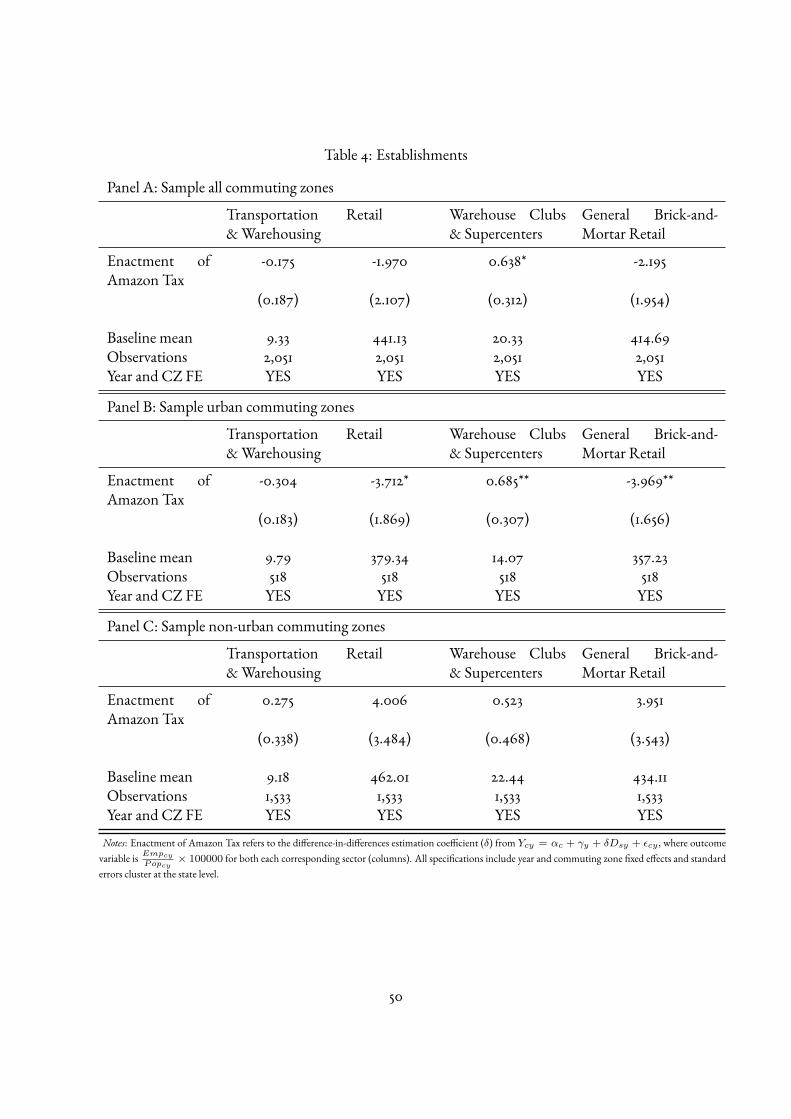
Table 4: Establishments
Panel A: Sample all commuting zones
Transportation& Warehousing
Retail Warehouse Clubs& Supercenters
General Brick-and-Mortar Retail
Enactment ofAmazon Tax
-0.175 -1.970 0.638* -2.195
(0.187) (2.107) (0.312) (1.954)
Baseline mean 9.33 441.13 20.33 414.69Observations 2,051 2,051 2,051 2,051Year and CZ FE YES YES YES YES
Panel B: Sample urban commuting zones
Transportation& Warehousing
Retail Warehouse Clubs& Supercenters
General Brick-and-Mortar Retail
Enactment ofAmazon Tax
-0.304 -3.712* 0.685** -3.969**
(0.183) (1.869) (0.307) (1.656)
Baseline mean 9.79 379.34 14.07 357.23Observations 518 518 518 518Year and CZ FE YES YES YES YES
Panel C: Sample non-urban commuting zones
Transportation& Warehousing
Retail Warehouse Clubs& Supercenters
General Brick-and-Mortar Retail
Enactment ofAmazon Tax
0.275 4.006 0.523 3.951
(0.338) (3.484) (0.468) (3.543)
Baseline mean 9.18 462.01 22.44 434.11Observations 1,533 1,533 1,533 1,533Year and CZ FE YES YES YES YES
Notes: Enactment of Amazon Tax refers to the di�erence-in-di�erences estimation coe�cient (δ) from Ycy = αc + γy + δDsy + εcy , where outcomevariable is Empcy
Popcy× 100000 for both each corresponding sector (columns). All speci�cations include year and commuting zone �xed e�ects and standard
errors cluster at the state level.
50

Table 5: Annual wages and hourly wages
Panel A: Sample all commuting zones
ln(annual income wages) ln(hourly wages)Overall Transportation &
WarehousingRetail Overall Transportation
& WarehousingRetail
Enactment ofAmazon Tax
0.00283 -0.0830*** -0.0119 -0.0107 -0.0770** -0.0132
(0.00985) (0.0228) (0.0199) (0.00739) (0.0310) (0.0204)
Baseline mean 25170.64 36413.11 21520.36 17.84 22.80 14.30Observations 2,051 2,051 2,051 2,051 2,051 2,051Year and CZ FE YES YES YES YES YES YES
Panel B: Sample urban commuting zones
ln(annual income wages) ln(hourly wages)Overall Transportation &
WarehousingRetail Overall Transportation
& WarehousingRetail
Enactment ofAmazon Tax
0.00498 -0.0740** -0.00458 -0.0100 -0.0815* -0.0109
(0.0101) (0.0350) (0.0191) (0.00794) (0.0387) (0.0270)
Baseline mean 27283.75 38113.17 22127.82 19.41 23.84 15.35Observations 518 518 518 518 518 518Year and CZ FE YES YES YES YES YES YES
Panel C: Sample non-urban commuting zones
ln(annual income wages) ln(hourly wages)Overall Transportation &
WarehousingRetail Overall Transportation
& WarehousingRetail
Enactment ofAmazon Tax
-0.00428 -0.114 -0.0403 -0.0106 -0.0572 -0.0212
(0.0193) (0.0966) (0.0326) (0.0109) (0.0806) (0.0177)
Baseline mean 24456.62 35838.67 21315.10 17.31 22.45 13.94Observations 1,533 1,533 1,533 1,533 1,533 1,533Year and CZ FE YES YES YES YES YES YES
Notes: Enactment of Amazon Tax refers to the di�erence-in-di�erences estimation coe�cient (δ) from Ycy = αc + γy + δDsy + εcy , where outcomevariable is annual wages and hourly wages for each corresponding sector (columns). All speci�cations include year and commuting zone �xed e�ects andstandard errors cluster at the state level.
51
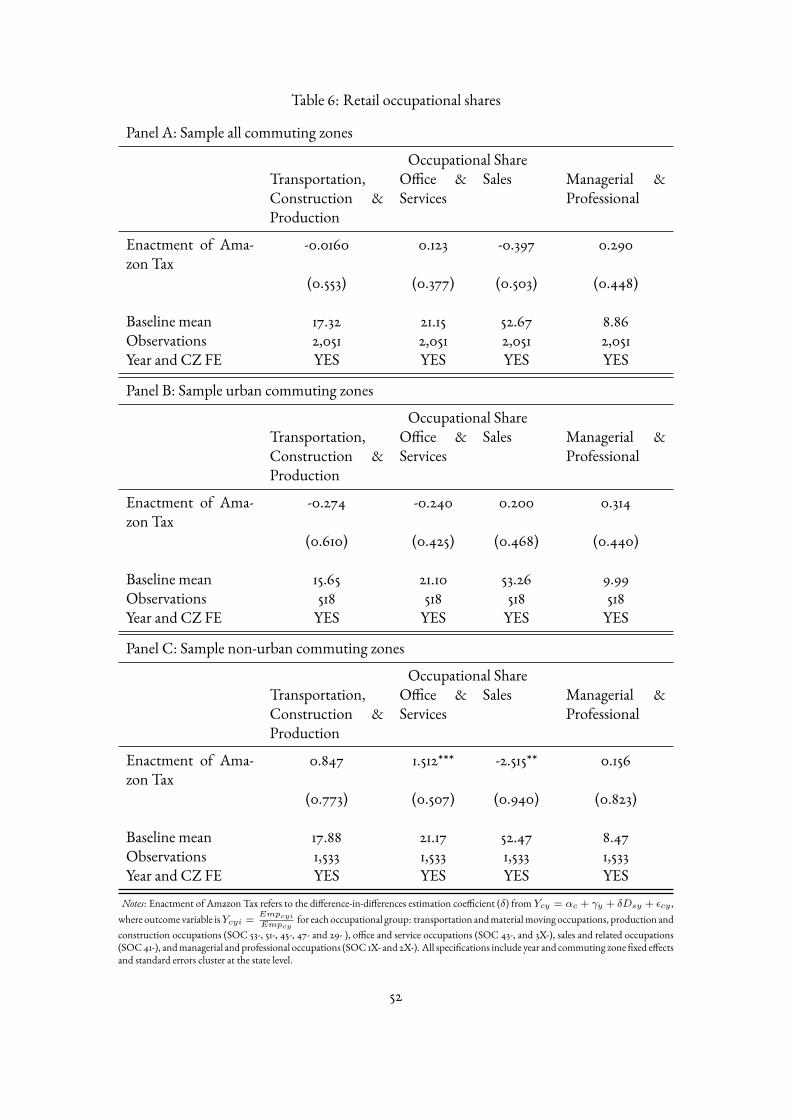
Table 6: Retail occupational shares
Panel A: Sample all commuting zones
Occupational ShareTransportation,Construction &Production
O�ce &Services
Sales Managerial &Professional
Enactment of Ama-zon Tax
-0.0160 0.123 -0.397 0.290
(0.553) (0.377) (0.503) (0.448)
Baseline mean 17.32 21.15 52.67 8.86Observations 2,051 2,051 2,051 2,051Year and CZ FE YES YES YES YES
Panel B: Sample urban commuting zones
Occupational ShareTransportation,Construction &Production
O�ce &Services
Sales Managerial &Professional
Enactment of Ama-zon Tax
-0.274 -0.240 0.200 0.314
(0.610) (0.425) (0.468) (0.440)
Baseline mean 15.65 21.10 53.26 9.99Observations 518 518 518 518Year and CZ FE YES YES YES YES
Panel C: Sample non-urban commuting zones
Occupational ShareTransportation,Construction &Production
O�ce &Services
Sales Managerial &Professional
Enactment of Ama-zon Tax
0.847 1.512*** -2.515** 0.156
(0.773) (0.507) (0.940) (0.823)
Baseline mean 17.88 21.17 52.47 8.47Observations 1,533 1,533 1,533 1,533Year and CZ FE YES YES YES YES
Notes: Enactment of Amazon Tax refers to the di�erence-in-di�erences estimation coe�cient (δ) from Ycy = αc + γy + δDsy + εcy ,where outcome variable isYcyi =
Empcyi
Empcyfor each occupational group: transportation and material moving occupations, production and
construction occupations (SOC 53-, 51-, 45-, 47- and 29- ), o�ce and service occupations (SOC 43-, and 3X-), sales and related occupations(SOC 41-), and managerial and professional occupations (SOC 1X- and 2X-). All speci�cations include year and commuting zone �xed e�ectsand standard errors cluster at the state level.
52