Embed Size (px)
Citation preview

Analysing Gaps and Mismatches for a Stronger ICT Profession European Report
e-Competence in Europe

About the Grand Coalition for Digital Jobs
The European Commission is leading a multi-stakeholder partnership to tackle the lack of digital skills in Europe and the thousands of unfilled ICT-related vacancies across all industry sectors.
The Secretariat of the Grand Coalition has been established to support the initiatives of the European Commission’s Grand Coalition for Digital Jobs.
Disclaimer
The outputs described in this report outline the uptake of the European e-Competence Framework (e-CF) powered tool ‘CEPIS e-Competence Benchmark’ developed by CEPIS.
The CEPIS e-Competence Benchmark has identified the e-competences of over 2,000 ICT professionals from 31 coun-tries across greater Europe. The sample of respondents per profile and per country cannot be considered statistically representative and therefore the survey results analysed in the European report are to be considered as qualitative.
Legal Notice
Neither the European Commission nor any person acting on its behalf may be held responsible for the use to which infor-mation contained in this publication may be put, nor for any errors which may appear despite careful preparation and checking. The views and positions expressed are those of the authors and do not necessarily reflect those of the European Commission.
Reproduction is authorised, provided the source is acknowl-edged, save where otherwise stated.
Acknowledgements
This project was made possible by the participation of many hundreds of research respondents. We are particu-larly grateful for the support and expertise of CEPIS Mem-ber Societies across Europe.
Statement of Originality
This deliverable contains original unpublished work except where clearly indicated otherwise. Acknowledgement of pre-viously published material and of the work of others has been made through appropriate citation, quotation or both.
This report has been prepared by CEPIS in the framework of the European Commission funded DIGITALJOBS project, which established the Secretariat of the Grand Coalition, and received support from the Competitiveness and Innovation Programme (CIP).
Deliverable 4.3: Present national and European-level uptake of e-CF powered tool DIGITALJOBS
3
Table of Content
1 Introduction to the Deliverable and Scope .................................................... 5
2 Executive Summary ......................................................................................... 6
3 Preface ............................................................................................................ 10
4 Context ............................................................................................................ 11
5 Introduction .................................................................................................... 12
6 Methodology ................................................................................................... 13
6.1 Personal Information .................................................................................. 13
6.2 Competence Questionnaire ....................................................................... 13
6.3 Competence Questionnaire ....................................................................... 14
6.4 Proximity Profiles ....................................................................................... 15
6.5 Competence Proficiency Index .................................................................. 15
6.6 Criteria For Inclusion and Country Level Analysis ..................................... 15
6.7 The European Benchmark ......................................................................... 16
7 Respondent Demographics ........................................................................... 17
7.1 Respondents by Country ........................................................................... 17
7.2 Respondents by Age.................................................................................. 18
7.3 Respondents by Gender ............................................................................ 19
7.4 Respondents by Education Level .............................................................. 20
7.5 Respondents by Educational Field ............................................................ 22
7.6 Respondents by Industry Sector ................................................................ 23
7.7 Respondents by Enterprise Size ................................................................ 24
7.8 Respondents by Professional Status ......................................................... 26
7.9 Respondents by Declared ICT Profile ........................................................ 27
8 Proximity Profiles and Competences ........................................................... 30
8.1 Respondents by Proximity Profile ............................................................... 30
8.2 Comparison Between Professional Profile and Proximity Profile................ 32
8.3 Analysis of Competence Proficiency .......................................................... 33
8.4 Competence Clustering .............................................................................. 34
9 Profiles Analysis ............................................................................................ 37
9.1 Business Analyst ....................................................................................... 37
9.2 Developer .................................................................................................. 39
9.3 Digital Media Specialist .............................................................................. 41
9.4 ICT Trainer ................................................................................................. 43

Deliverable 4.3: Present national and European-level uptake of e-CF powered tool DIGITALJOBS
4
9.5 Systems Administrator ............................................................................... 45
9.6 Technical Specialist ................................................................................... 47
9.7 Project Manager ........................................................................................ 49
10 Conclusions .................................................................................................... 52
10.1 Profiles and Demographic Analysis ............................................................ 52
10.2 Conclusions ................................................................................................ 59
10.3 Recommendations ..................................................................................... 61
11 Annex .............................................................................................................. 63
11.1 Competence Proficiency Index ................................................................... 63
11.2 Proximity Profiles – Detail .......................................................................... 68
11.3 Profile Segmentation .................................................................................. 71
11.4 Data Tables ............................................................................................... 75
Deliverable 4.3: Present national and European-level uptake of e-CF powered tool DIGITALJOBS
5
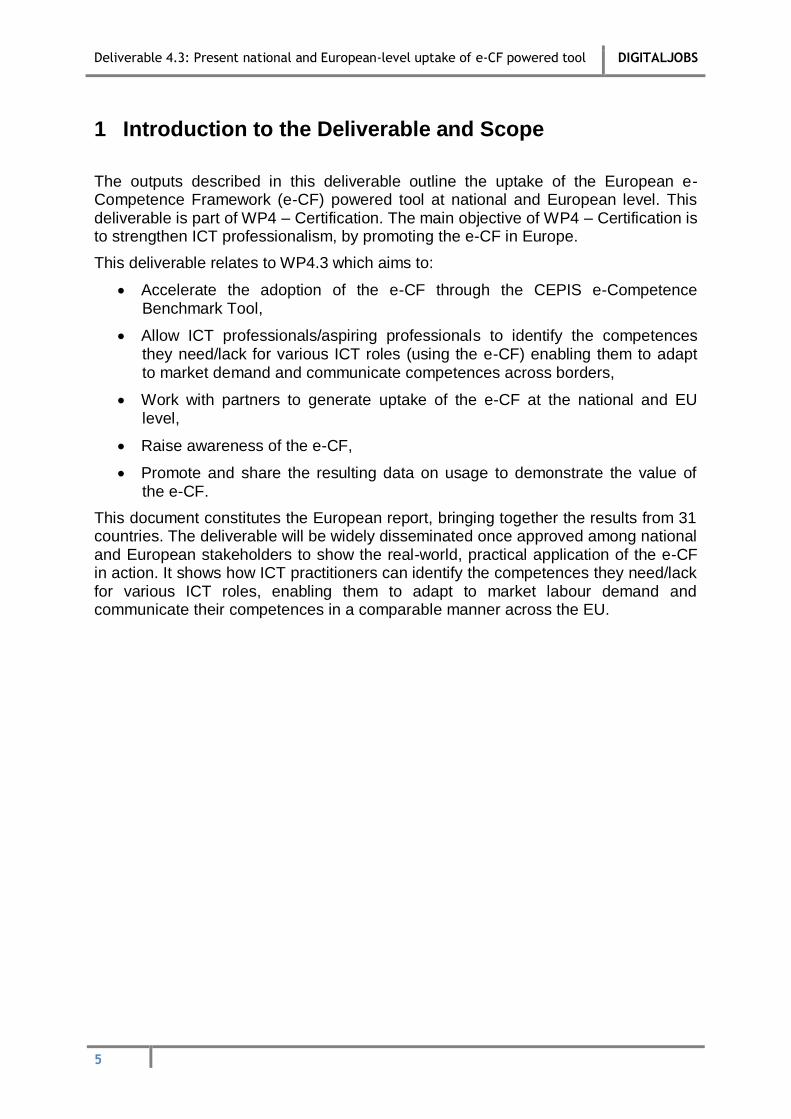
1 Introduction to the Deliverable and Scope
The outputs described in this deliverable outline the uptake of the European e-Competence Framework (e-CF) powered tool at national and European level. This deliverable is part of WP4 – Certification. The main objective of WP4 – Certification is to strengthen ICT professionalism, by promoting the e-CF in Europe.
This deliverable relates to WP4.3 which aims to:
Accelerate the adoption of the e-CF through the CEPIS e-Competence Benchmark Tool,
Allow ICT professionals/aspiring professionals to identify the competences they need/lack for various ICT roles (using the e-CF) enabling them to adapt to market demand and communicate competences across borders,
Work with partners to generate uptake of the e-CF at the national and EU level,
Raise awareness of the e-CF,
Promote and share the resulting data on usage to demonstrate the value of the e-CF.
This document constitutes the European report, bringing together the results from 31 countries. The deliverable will be widely disseminated once approved among national and European stakeholders to show the real-world, practical application of the e-CF in action. It shows how ICT practitioners can identify the competences they need/lack for various ICT roles, enabling them to adapt to market labour demand and communicate their competences in a comparable manner across the EU.

Deliverable 4.3: Present national and European-level uptake of e-CF powered tool DIGITALJOBS
6
2 Executive Summary
Identifying and analysing the e-competences of ICT professionals across Europe can help tackle ICT skills mismatches and shortfalls that threaten Europe’s competitiveness and productivity. It can also help employers, industry (including SMEs and entrepreneurs), policy makers, and educators anticipate the skills requirements of the labour market. The Council of European Professional Informatics Societies (CEPIS) represents 35 national informatics associations in 32 countries across greater Europe. CEPIS, with the essential support of its Member Societies, has undertaken this pioneering research to produce and assess an up-to-date picture of the actual e-competences of ICT professionals across Europe. This document presents the results of the CEPIS e-Competence Benchmark research which has identified the e-competences of over 2,000 ICT professionals in 31 countries across greater Europe. Eight individual country reports have been produced in addition to this European report. Each report provides an in-depth analysis of the level of professional competences and a snapshot of the profession in each country. The research was carried out using an online assessment tool. The tool is based on the European e-Competence Framework (e-CF)1 and the 23 ICT career profiles associated with it. The e-CF is a reference framework of ICT competences that can be used and understood by ICT user and supply companies, ICT practitioners, managers and HR departments, the public sector, educational and social partners across Europe. The e-CF was created by the CEN (European Committee for Standardization) Workshop on ICT Skills2, and is supported by the European Commission. Participants indicated their proficiency level in each of the 36 e-CF competences and provided personal information such as their gender, age, education, and career profile. This information was used as the basis for country reports and this European report. A personal report was automatically generated for each respondent upon completion of the questionnaire. This report provides an analysis of the individual’s own e-competences and how they rate against the e-competences required for a specific career profile. This e-competence gap analysis enables respondents to better identify their levels of e-competence compared to a recognised European framework, and to better assess the e-competences that may need improvement. It also enables respondents to identify the skills they might need to progress into a future ICT role. The feedback from over 2,000 ICT professionals throughout greater Europe shows that most respondents selected Project Manager as their career profile. Database
1 For more information about the European e-Competence Framework see: www.ecompetences.eu 2 For more information about the CEN Workshop see: http://www.cen.eu/work/areas/ICT/Pages/default.aspx

Deliverable 4.3: Present national and European-level uptake of e-CF powered tool DIGITALJOBS
7
Administrator was the least popular choice among the 23 career profiles created by the CEN Workshop on ICT Skills. Overall, very few of the ICT professionals who completed the questionnaire can be considered to be young, with less than one-sixth of all respondents being under 30 years. This indicates that the predicated shortages unlikely to be solved in the near terms. In fact, they may well be exacerbated by the very low level of female ICT professionals. Only 15% of all ICT professionals who participated in this study were female; attracting young and female talent to the profession is imperative to bridge the enduring gaps and shortages. The following recommendations have arisen from the research:
Europe lacks young IT talent. Encouraging more young people to start ICT
careers is essential to safeguard the profession and Europe’s competitiveness. As current ICT professionals age and the demand for skills increases, the stream of young talent is insufficient to meet the demand for qualified professionals. Less than 16% of professionals assessed were in the under 30 age bracket. Campaigns such as the e-Skills for Jobs Campaign can play a major role in changing the image of IT; such campaign should be continued and regular.
The e-CF is alive in Europe (and it works). The European e-Competence
Framework (e-CF) has been put through its paces by thousands across Europe. The results show that it is a valuable tool for categorising and defining e-competences, it’s viability has been tested and proven in this research. It should be continually developed and disseminated across Europe.
The future of the e-CF is bright but should be multilingual as well as more granular. Higher levels of granularity in future versions of the e-CF
would translate into more precise outputs for the individual, at the organisational level as well as provide policy makers with the information the need for future-proofing policy decisions. As the e-CF becomes a European Norm, its national adoption as a veritable linqua franca will be linked to ensuring it can be understood by all in their own languages.
Never stop skilling. Continuous professional development, targeted to
existing and anticipated e-competence gaps is of high importance for the ICT profession. This research found that ICT professionals in Europe often scored their lowest levels of e-competences in the Enable area. Many come into IT without having it as major focus of their education, more come from a totally different field. As a result, a worrying number of practitioners do not have the competences needed for their current role. As IT increasing underpins all sectors of the economy, the fallout of IT project failures poses a major economic as well as societal risk. Skilling, re-skilling and upskilling is the answer for those in employment and those who should be filling the gaps.
Career paths with defined training and education requirements are badly needed. About a third of ICT professionals stated that IT was not the main focus of their education. Large number of respondents failed to match the e-competences needed for the jobs they declared.

Deliverable 4.3: Present national and European-level uptake of e-CF powered tool DIGITALJOBS
8
Get the girls. All countries urgently need to address the gender imbalance
and increase the participation of women in ICT careers. A European Girls in ICT Day that builds on the success of national level events could raise awareness of what an ICT career really is. National Digital Champions should be encouraged to include gender balance as part of their mandate in promoting digital skills. Promoting inspiring role models that demonstrate the creativity, versatility and flexibility of the careers in ICT can also help change the image of ICT for young girls. Member States should provide fiscal incentives for companies to adopt gender equity as part of their organisational culture, hiring practices and career advancement programmes.
Promoting ICT Professionalism is the clear answer to many of the
challenges Europe is facing today. Establish a common body of foundational knowledge, increasing understanding of competency, improving education and training and promoting established codes of ethics/conduct will help build the digital economy Europe needs.
Some additional findings include:
The average age of the ICT professional in Europe is 42 years. The youngest ICT professionals can be found in Belgium with an average age of 37 years. The oldest ICT professionals are in the Netherlands with an average age of 50 years.
A large percentage of respondents (36%) work in large organisations and the majority of ICT professionals hold full-time positions (78%). Most people which work full-time are coming from Norway (95%), whereas the lowest rate can be found in the Netherlands (69%). On the other hand, the number of self-employed people in the Netherlands (23%) are almost triple as high as in Europe (8%).
Project Manager was the popular job profile among respondents. However, only 7% of the respondents match the e-competences needed for that role.
Technical Specialist is the job profile for which most professionals matched the required e-competences. However studies show that this is not the profile most likely to be needed in Europe in the coming years.
Only 23% of respondents had the competences associated with their job. In other words, 77% of all respondents may not have all the competences required for their job.
The more widespread competencies among European ICT professionals belong to the Run area (User Support, Problem Management, etc.) and to the Plan area (Product or Project Planning); the more rare ones belong to the Enable area (Channel Management, Sales Management, etc.) and to the Plan area (Sustainable development).
The findings provide useful indicators of the current e-competences and gaps in Europe. Overall, a high level of education was displayed by ICT professionals who took part in the research, but in many cases the education was not sufficiently

Deliverable 4.3: Present national and European-level uptake of e-CF powered tool DIGITALJOBS
9
focused on IT. While the results vary from country to country, this work confirms that the problems caused by a lack of professionalism in IT are here for the foreseeable future. CEPIS thanks all its members and like-minded organisations who participated in and supported this research, as well as all of the ICT professionals who contributed to the success of the project. This research would not have been possible without the contributions of informatics societies and their members. The research results, as portrayed in the country reports3 and aggregated in the European report; provide an up-to-date picture of actual digital competences of ICT professionals. For job seekers, policy makers, professionals, industry, educators and any other interested parties we hope that this research provides some thought provoking insights about the status of ICT professionals in Europe today.
3 For more information about the country reports see www.cepis.org/professionalecompetence

Deliverable 4.3: Present national and European-level uptake of e-CF powered tool DIGITALJOBS
10
3 Preface
The CEPIS Professional Benchmark research sets out to produce and assess an up-to-date picture of the actual digital competences of ICT professionals across Europe and beyond. This report is based on the CEPIS e-Competence Benchmark an online, interactive tool that enables individuals and organisations to assess their competences against the European e-Competence Framework (e-CF)4. Using the results of the CEPIS e-Competence Benchmark, this report offers a unique view of the status of professional e-competence in Europe and shows the practical application and real-world usage of the e-CF. The research has identified the e-competences of over 2,000 ICT professionals from 31 countries across greater Europe. Individual country reports have been created for countries reaching a threshold of respondents and at least one cluster of a minimum of ten respondents with the same calculated profile. The following should be noted with regard to the demographic of respondents from participating countries:
The research sample was dependent on the available contact database used to promote the research in each country; there may be some variance between these databases and the full population of ICT professionals in the respective countries.
The sample composition may reflect the participation of the membership of participating CEPIS Member Societies.
These criteria apply to the data samples of all countries that took part in the research. Any comparisons between national level results and the European average in this report should be considered as important insights as well as preliminary and qualitative indications which may require more extensive validation. Since the sample of respondents per profile and per country may not be considered statistically representative, the research results are to be considered as qualitative. Each country report5 has been assessed and validated by national experts from the professional bodies in each country before publication and these expert contributions were also used as inputs into this European report. The data gathered in this round of the CEPIS Professional Benchmark research shows that there is a high level of interest among professionals to reflect about their e-competences and job profiles. From the qualitative point of view, the results allow interesting observations on the subject of e-competences and professional profiles. CEPIS and its Member Societies see value in further research in this area that would generate a higher statistical representation of national communities of ICT professionals.
4 For more information about the European e-Competence Framework see: http://www.ecompetences.eu/ 5 To access the available country reports see: http://www.cepis.org/professionalecompetence

Deliverable 4.3: Present national and European-level uptake of e-CF powered tool DIGITALJOBS
11
4 Context The increasing demand for ICT practitioners is hampered not only by the lack of new entrants into the profession, but also by the mismatches in the competences that practitioners have today. While ICT provides crisis-resistant employment, Europe currently is not producing the talent with the right skills to boost competitiveness. The ICT professional bodies and informatics societies that are the members of CEPIS recognise the need to reduce the gap between supply and demand and commit to taking action to redress the balance and promote ICT professionalism. Under the Grand Coalition for Digital Jobs, the European Commission has launched a series of practical initiatives to help fill the growing number of vacant ICT-related jobs across Europe, and to ensure that more people get the training needed to work in the digital economy. To support the roll-out of the Grand Coalition for Digital Jobs, DIGITALEUROPE has collaborated with partners such as ECDL Foundation, CEPIS and others to establish the Secretariat of the Grand Coalition. This deliverable is part of the WP4 within the strategy of the Secretariat of the Grand Coalition. The purpose of this deliverable is to present the national and European-level uptake of an e-CF powered tool, which is a free, online interactive tool for current and future ICT professionals to identify the competences they need for various ICT roles, enabling them to adapt to labour market demand. It will enable individuals and recruiters to map their competences against a range of profiles and better equip themselves for future roles and employment. It will allow companies to benchmark entire departments, identify workforce gaps and plan accordingly. It is powered by the European e-Competence Framework the common language for ICT competences created by the CEN workshop on ICT skills and therefore provides a standard upon which Europeans can better understand what is needed for their current and future IT roles based on the ICT Professional Profiles developed by CEN. Several national reports have been produced for each participating country which aggregate the information for that country and produce a snapshot of the ICT professional landscape. This report will provide information to support policy making, as well as update information for the training industry on market needs. The European level report brings together all of the data from throughout Europe and provide a basic for policy recommendations on future actions to support the ongoing development of the ICT profession.

Deliverable 4.3: Present national and European-level uptake of e-CF powered tool DIGITALJOBS
12
5 Introduction This report provides the results of a European initiative designed to identify the digital competences held by ICT professionals across 28 countries in Europe and beyond. This report is based on the CEPIS e-Competence Benchmark an online, interactive tool that enables individuals and organisations to assess their competences against the European e-Competence Framework (e-CF). Using the results of the CEPIS e-Competence Benchmark, this report offers a unique view of the status of professional e-competence in Europe. As experts predict that the demand for skilled ICT professionals will far outstrip supply, it is more important than ever to provide current and future professionals with the ability to compare their competences against those needed for typical ICT job profiles throughout Europe. This helps identify training and professional development opportunities to transition to new roles and even to start an ICT career. This work was carried out as part of the Grand Coalition for Digital Jobs, an EU-wide initiative to address the competence mismatches and fill vacancies of ICT practitioners to boost employment. The results gathered through this pan-European initiative provide an insight into the level of professional competences and a snapshot of the profession in each country. It also is a means to implement the e-CF demonstrating to individuals and organisations how it can be of immediate and practical benefit. The ability to determine which competencies are underdeveloped on a national and European scale can assist policy makers as well as training providers with timely information for decision making. This in turn can facilitate the development of focused training courses to further educate the workforce so as to meet the needs of the labour market. The research has been conducted via an interactive, free, web-based tool that is powered solely by the European e-Competence Framework. The e-CF has been developed by the CEN (European Committee for Standardization) Workshop on ICT Skills and is supported by the European Commission. This framework identifies 36 ICT competences which are all used in this tool along with the professional job profiles developed by CEN. This project has been led by the Council of European Professional Informatics Societies (CEPIS) and implemented thanks to the Computer Society in each country.

Deliverable 4.3: Present national and European-level uptake of e-CF powered tool DIGITALJOBS
13
6 Methodology This initiative has been conducted in 31 countries in Europe and beyond using an interactive, web-based tool: the CEPIS e-Competence Benchmark. The European results are compiled based on over 2,000 responses provided by participants from these countries. It is important to note that the results presented here reflect the constituency of those who participated in the CEPIS e-Competence Benchmark. In some countries that may have implications for the general statistical significance of the data. The CEPIS e-Competence Benchmark has been completed by individual respondents who consider themselves to be ICT practitioners, or who will soon become one, and is divided into three sections as described below. It is fully compatible with and is based on the e-CF and associated professional profiles.
6.1 Personal Information
In the online tool, each respondent is invited to register and then enter personal information including education background, employment status, organisation size, and industry. They then select the ICT profile that matches their current role from the following 23 professional profiles, grouped into 6 families:6
BUSINESS MANAGEMENT
Chief Information Officer Business Information Manager ICT Operations Manager
DESIGN Business Analyst Systems Analyst Enterprise Architect Systems Architect
SUPPORT Account Manager ICT Trainer ICT Security Specialist ICT Consultant
DEVELOPMENT Developer Digital Media Specialist Test Specialist
SERVICE & OPERATIONS
Database Administrator Systems Administrator Network Specialist Technical Specialist Service Desk Agent7
TECHNICAL MANAGEMENT
Quality Assurance Manager ICT Security Manager Project Manager Service Manager
Figure 1.1 – ICT Professional Profiles
6.2 Competence Questionnaire
In this section of the assessment, the respondent completes the competence questionnaire, which consists of 36 competences. The questionnaire is divided in five areas of competences - Plan, Build, Run, Enable, Manage - that are derived from ICT business processes. For each competence, the level options available are: None, Knowledge, Experience, or Knowledge and Experience. Upon selecting ’Experience’ the respondent is asked to indicate their corresponding level of experience. Additional information, such as
6 For more information on the professional profiles : ftp://ftp.cen.eu/CEN/Sectors/List/ICT/CWAs/CWA%2016458.pdf 7 The profile of Service Desk Agent is excluded from the present analysis as the profile was sufficiently broad to encompass
most respondents, thus skewing the results.

Deliverable 4.3: Present national and European-level uptake of e-CF powered tool DIGITALJOBS
14
examples of the knowledge and skills associated with that competence, is also available to assist the respondent in choosing an appropriate level.
Figure 1.2 – Example of Competence Level and Experience Level
6.3 Competence Questionnaire
Upon completion of the questionnaire, the respondent is presented with personal results. These results are displayed on a graphical radar, split into 36 segments (one for each competence) as illustrated in Figure 1.3. The graphic will show which of the 23 ICT professional profiles best matches the respondent’s e-competences, regardless of the profile the respondent selected. The results are represented in a proximity index which gives an indication of how the respondent’s competences match the requirements of the specific job profile (see Figure 1.4). A high proximity index indicates that the respondent has the necessary competences for this role.
Figure 1.3 – Personal Results: the
‘Radar’
Figure 1.4 – Personal Results:
Proximity Index

Deliverable 4.3: Present national and European-level uptake of e-CF powered tool DIGITALJOBS
15
Moreover, the results also indicate the competences that the individual should seek to improve, as well as the competences that exceed the level required for the given profile. Each respondent can review their proximity to any other professional profile to assess their potential to move into a new role, and export the results into a report that may be printed.
6.4 Proximity Profiles
The Proximity Profile is used to identify and classify respondents into homogeneous groups in terms of specific skills (professional profile). The CEPIS e-Competence Benchmark uses the 23 professional profiles as defined by the CEN Workshop on ICT skills. Each profile is characterised by a specific set of competences (ranging from two to five competences) selected from the 36 competences identified and described in the e-CF. An algorithm produces a score, based on the knowledge and experience reported, for each of the 23 profiles. These scores are then compared with what is required for each profile and expressed as a percentage match. The highest score shows the profile(s) that is closest to the expertise of the respondent. This is referred to as the Proximity Profile. The level of proximity is shown as a percentage: a 100% proximity index means that the competence declared by the respondent completely satisfies the requirements for that profile.
6.5 Competence Proficiency Index
The Competence Proficiency Index (CPI) is used to measure the degree to which the competencies identified by the e-CF framework are represented in Europe today. On the basis of the respondents’ declaration of competence, a Competence Proficiency Index is computed for each of the 36 competence identified in the e-CF. This index, expressed as a percentage, represents the degree of proficiency for each competence with respect to the e-CF. So, a 100% Competence Proficiency Index means that the respondent declared to have relevant experience at each one of proposed levels of competence. The analysis of the Competence Proficiency Index of each competence can be useful to design detailed training paths to cover the competence gaps.
6.6 Criteria for Inclusion and Country Level Analysis
In order to ensure the integrity of the results, certain criteria for inclusion of the results were established at the level of the individual response as well as at the country level. The criteria for individual responses were established so as to exclude responses that are incomplete, or completed in a manner that is implausible. Implausible

Deliverable 4.3: Present national and European-level uptake of e-CF powered tool DIGITALJOBS
16
responses include those that for example have the highest level of knowledge and experience in all competences. Responses that do not comply with the established criteria have been excluded from the results. The data validation ensures that only results meeting the following criteria are included:
knowledge of 5 or more competences,
experience in no more than 31 competences,
Proximity Profile score(s) of at least 40%,
ex-aequo8 top score in 5 profiles or less.
With the high number of participating countries, it was necessary to decide upon the baseline criteria to ensure that the volume and the quality of responses were suitable for country level analysis. The following criteria were adopted to ensure the integrity of the country reports:
a competence profile is included when 10 or more valid questionnaires are completed. In other words a cluster of 10 respondents enables a professional profile to be analysed for that country,
a country profile can be generated where there are more than 50 valid assessments completed, and at least one competence profile has 10 or more valid assessments.
6.7 The European Benchmark
All country results are compared to the European benchmark, sometimes also referred to as European average. In order to avoid distortions due to a higher number of contributions from certain countries, the European benchmark has been computed as a weighted mean, taking into account an equal number of contributions from those countries which, although in varying degrees, have proved to be the major contributors.
8 Assessments which show the same proximity score for more than one profile are counted as many times as the same score
appears.

Deliverable 4.3: Present national and European-level uptake of e-CF powered tool DIGITALJOBS
17
7 Respondent Demographics
The research was launched across 31 countries in Europe and beyond. Over 2,000 current and future ICT practitioners participated in the research. This chapter provides an overview of the demographics of the European respondents.
7.1 Respondents by Country
Reponses to the research were received from 28 countries. However, it is important to note that almost 50% of the respondents came from Italy and Finland. The European benchmark has been calculated as a weighted average in order to overcome this imbalance. 8 countries reached the response threshold to allow for analysis of at least one profile with 10 respondents or more. Based on this information, these European results represent a factual analysis based on the respondents’ sample per country. The total responses obtained have been used to build an average European benchmark to compare data gathered per country, details of which can be found in the country level reports available on the CEPIS website. CEPIS and its Member Societies acknowledge the value of further research in this field with the aim of increasing the number of respondents per country, and facilitating a more detailed view of the status of professional e-competences in Europe. Figure 2.1a shows contributions from countries with more than 50 respondents. All other countries are grouped under the heading ‘Others’.
29,2%
20,4%
11,8%
11,1%
4,4%
5,0%
3,4%
3,0%
11,8%
Italy
Finland
Belgium
Norway
Hungary
Spain
Ireland
Netherlands
Others Total: 1745
Figure 2.1a – Respondents by Country

Deliverable 4.3: Present national and European-level uptake of e-CF powered tool DIGITALJOBS
18
Figure 2.1b gives a more detailed view of the number of respondents by Country and Proximity Profile. The three most popular Proximity Profiles were Technical Specialist (410 cases), ICT Trainer (247), and Systems Administrator (170). The three least popular Proximity Profiles were ICT Security Specialist (15), Service Manager (13), and ICT Consultant (13).
IT FI BE NO HU ES IE NLItaly Finland Belgium Norway Hungary Spain Ireland Netherlands
509 356 206 193 77 87 59 52 206 1745
BM1 Chief Information Officer 19 3 8 8 1 3 2 4 13 61
BM2 Business Information Manager 12 9 1 8 3 2 2 6 43
BM3 ICT Operations Manager 5 7 2 4 1 2 7 28
DS1 Business Analyst 26 26 17 21 4 4 2 1 29 130
DS2 Systems Analyst 12 17 22 7 2 3 3 23 89
DS3 Enterprise Architect 8 4 4 3 1 2 5 3 30
DS4 Systems Architect 27 29 7 10 5 6 7 2 6 99
DV1 Developer 34 45 21 11 5 6 7 3 16 148
DV2 Digital Media Specialist 26 20 14 20 8 6 5 1 17 117
DV3 Test Specialist 7 14 4 6 1 1 9 42
SP1 Account Manager 10 4 8 5 1 1 12 41
SP2 ICT Trainer 77 39 30 18 20 10 9 6 38 247
SP3 ICT Security Specialist 3 2 3 1 2 1 3 15
SP4 ICT Consultant 7 4 1 1 0 13
SR1 Database Administrator 23 19 15 7 5 6 3 1 15 94
SR2 Systems Administrator 76 42 12 13 6 9 6 7 -1 170
SR3 Network Specialist 26 17 8 8 3 4 1 2 69
SR4 Technical Specialist 156 101 42 38 11 25 14 11 12 410
TM1 Quality Assurance Manager 8 6 9 7 2 5 1 2 12 52
TM2 ICT Security Manager 13 8 1 6 3 3 4 1 3 42
TM3 Project Manager 33 30 16 29 1 8 8 6 25 156
TM4 Service Manager 4 3 1 3 4 1 -3 13
612 449 245 231 82 108 78 57 245 2107
Pro
xim
ity p
rofi
le
Total
Total Proximity Profiles
Total Respondents
Others
Figure 2.2b – Respondents by Country and Profile (only cells with 10 or more cases)
7.2 Respondents by Age
The respondents to the research represented various age groups as highlighted in Figure 2.2a9.
9 Note: as ‘<20 yr’ and ‘>60 yr’ classes count for a low % of total assessments (respectively <1% and about 5%), they have been
grouped into the adjacent class. As a result only four age classes are shown: ‘<30 yr’, ‘31-40 yr’, ‘41-40 yr’, and ‘>50 yr’.
22,7%
28,7%
32,7%
15,9%
< 30 yr 30 - 40 yr 40 - 50 yr > 50 yr
Figure 2.3a – Respondents by Age

Deliverable 4.3: Present national and European-level uptake of e-CF powered tool DIGITALJOBS
19
The average age of respondents in Europe is around 42 years. The range for this variable is 13 years wide: from around 37 years for Belgian respondents to 50 years for Dutch respondents. As regards the average age of each ICT profile the range of variation is narrower: 11 years, from almost 38 years for ICT Security Specialists to 49 years for Chief Information Officers.
40,9
36,6
45,2
47,3
42,5
44,0
49,8
42,0
41,7
41,6
Europe
Italy
Finland
Belgium
Norway
Hungary
Spain
Ireland
Netherlands
Others
Figure 2.2b – Respondents by Age and Country
In addition to ICT Security Specialist, the younger profiles are Developer, Systems Administrator, and Database Administrator which are 38 years old on average. Apart from Chief Information Officer, the other older profiles are Account Manager and Business Information Manager (46 years old each), and Service Manager and Enterprise Architect (45 years old each).
7.3 Respondents by Gender
In Europe, female ICT professionals represent only one out of seven respondents. However, the analysis at country level shows some differences. The lowest rates in the sample can be found in Spain and in the Netherlands with 10% of females and the highest rate is in Ireland with 22% females. This supports the fact that gender imbalance persists in the ICT field.
Male
85%
Female
15%
Figure 2.4a – Respondents by Gender

Deliverable 4.3: Present national and European-level uptake of e-CF powered tool DIGITALJOBS
20
The gender differences are even more pronounced for certain ICT profiles such as Systems Architect (5%), Service Manager and Network Specialist (6% each). Project Manager and ICT Trainer (25% each), and Developer (19%) have a higher female presence.
16%
11%
21%
16%
10%
22%
10%
20%
11%
15%Europe
Italy
Finland
Belgium
Norway
Hungary
Spain
Ireland
Netherlands
Others
Figure 2.3b – Respondents by Country and Female Presence
Over recent years, CEPIS has worked in conjunction with the European Centre for Women and Technology (ECWT)10 and other partners to ensure that women are encouraged to become a positive force and influence in the ICT sector. CEPIS has also awarded ICT education grants several times to promising young women with a view to help emphasise the need for more women in the ICT sector11. Further initiatives such as the above highlighted should continue to take place at a European level, within the education system and within ICT companies to promote the ICT profession among the European female population.
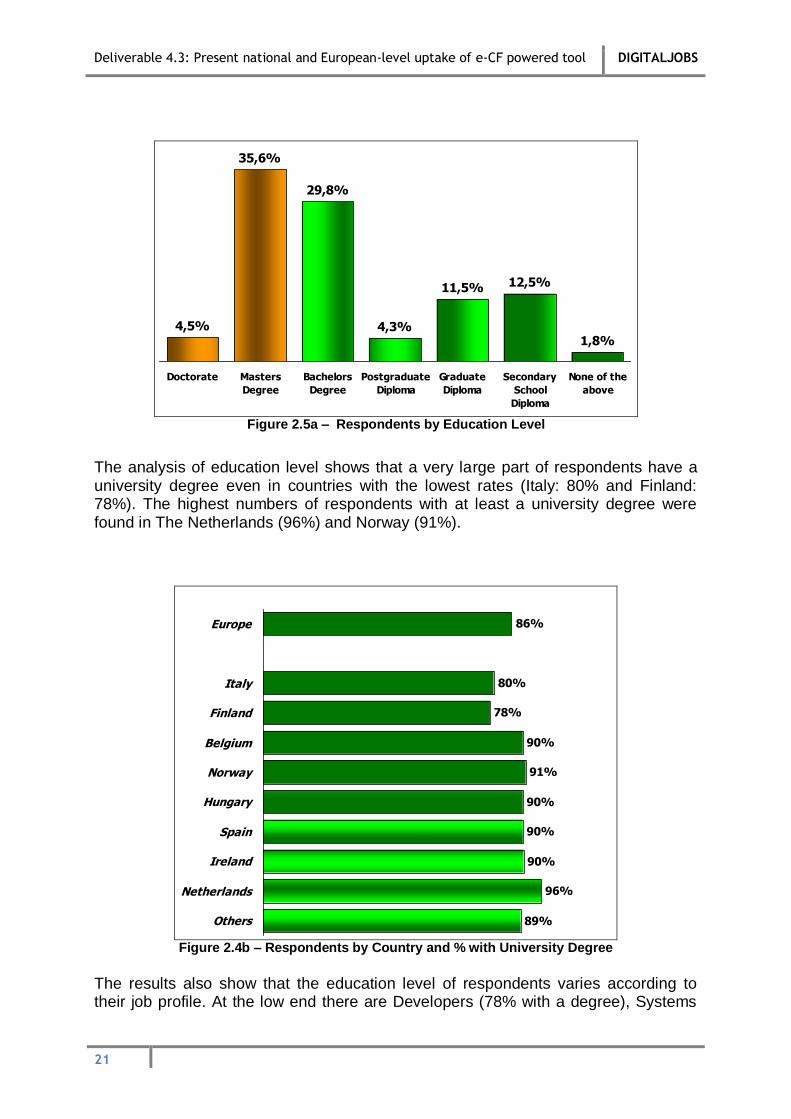
7.4 Respondents by Education Level
The respondents were asked to select the highest education level they had achieved. A very large majority (86%) of the respondents have achieved at least a degree level qualification, showing the importance of third level qualifications in gaining employment in the sector. Moreover, the investment in fourth level education is clearly visible with a noticeable proportion of respondents (40%) having either a master’s or a PhD qualification in this sample.
10 For more information see: www.womenandtechnology.eu 11 For more information see: www.cepis.org/index.jsp?p=636&n=639&a=1982
Deliverable 4.3: Present national and European-level uptake of e-CF powered tool DIGITALJOBS
21
The analysis of education level shows that a very large part of respondents have a university degree even in countries with the lowest rates (Italy: 80% and Finland: 78%). The highest numbers of respondents with at least a university degree were found in The Netherlands (96%) and Norway (91%).
78%
90%
91%
90%
90%
90%
96%
89%
86%
80%
Europe
Italy
Finland
Belgium
Norway
Hungary
Spain
Ireland
Netherlands
Others
Figure 2.4b – Respondents by Country and % with University Degree
The results also show that the education level of respondents varies according to their job profile. At the low end there are Developers (78% with a degree), Systems
4,3%
11,5% 12,5%
1,8%4,5%
29,8%
35,6%
Doctorate Masters
Degree
Bachelors
Degree
Postgraduate
Diploma
Graduate
Diploma
Secondary
School
Diploma
None of the
above
Figure 2.5a – Respondents by Education Level

Deliverable 4.3: Present national and European-level uptake of e-CF powered tool DIGITALJOBS
22
Administrators and Network Specialists (both with 79%). At the high end we found Business Information Managers (all with a degree), Service Managers (95%), and Account Managers and Chief Information Officer (94% each).
7.5 Respondents by Educational Field
The variety of educational backgrounds of ICT practitioners shows that the ICT profession is both attractive and accessible to graduates from different faculties. The increasing demand for ICT practitioners has led to ICT roles being filled with personnel without an informatics background. The results show that 34% of the respondents have an educational background where IT was a side subject or not significant in their studies. In other words, one out of three ICT professionals in Europe does not have a real IT-focused education. This suggests that there may be some difficulties for companies to source candidates with IT qualifications for their advertised roles. It is clear that the ICT industry doesn’t rely on ICT practitioners with IT-focused education to meet their needs.
66%
11%
23%
Main focus Side subject Not significant
Figure 2.6a – Respondents by Educational Field
In all analysed countries we found a prevalence of IT-focused education. The lowest rate of ICT professionals with an IT-focused education are found in Norway (57%) and in Ireland (58%). On the opposite end there are Spain and Hungary, with a respective rate of IT-focused education of 85% and 75%. The rate of IT-focused education varies among certain ICT profiles, with low values of 42% for Account Manager, 48% for Chief Information Officer and 50% for Project Manager, and 84% for Digital Media Specialist and 81% for Database Administrator at the higher end.

Deliverable 4.3: Present national and European-level uptake of e-CF powered tool DIGITALJOBS
23
69%
67%
57%
75%
85%
58%
60%
66%
66%
68%
Europe
Italy
Finland
Belgium
Norway
Hungary
Spain
Ireland
Netherlands
Others
Figure 2.5b – Respondents by Country and % of IT-focused Education
7.6 Respondents by Industry Sector
In Europe, ICT professionals are almost equally split into the supply and demand side of the ICT sector. 49% of respondents declared their focus was mainly on the IT supply side, while 51% came from the demand side. However, this is not the same for each country. In fact, in Italy the proportion of respondents belonging to the demand side is 54% and 57% for ‘Other Countries’, while in Finland there is the prevalence of the supply side with a rate of 56%. Four job profiles show a clear prevalence of the IT demand side: ICT Security Specialist (72%), ICT Security Manager (67%), Business Information Manager (63%) and Enterprise Architect (58%). On the other hand, there is a prevalence of the
IT supply
side
51%
IT demand
side
49%
Figure 2.7a – Respondents by Industry Sector

Deliverable 4.3: Present national and European-level uptake of e-CF powered tool DIGITALJOBS
24
supply side for ICT Operations Manager (62%), Network Specialist (64%) and Account Manager (69%).
44%
48%
47%
51%
49%
51%
48%
57%
49%
54%
Europe
Italy
Finland
Belgium
Norway
Hungary
Spain
Ireland
Netherlands
Others
Figure 2.6b – Respondents by Country and % from IT Demand Side
7.7 Respondents by Enterprise Size
At the European level, the distribution of respondents by enterprise size shows that the majority of ICT professionals work in large enterprises (36%). However, given the sample size of the research, this proportion may not be fully reflective of the ratio of large enterprises across Europe. Previous research has stated that 99% of European companies are in fact SMEs12.
12 For more information see: http://ec.europa.eu/enterprise/policies/sme/facts-figures-analysis/index_en.htm

Deliverable 4.3: Present national and European-level uptake of e-CF powered tool DIGITALJOBS
25
Ireland has a very high proportion of respondents in this sample working in larger organisations (58%). Less than one out of three respondents work in a larger organisation in Italy (31%), Hungary (28%), and in ‘Other Countries’ (23%).
36%
41%
40%
34%
28%
42%
42%
23%
31%
58%
Europe
Italy
Finland
Belgium
Norway
Hungary
Spain
Ireland
Netherlands
Others
Figure 2.7b – Respondents by Country and % in Large (1000+) Enterprises
17,9%
35,9%
13,1%
21,7%
11,4%
1 - 10 11 - 50 51 - 250 251 - 1000 > 1000
Figure 2.8a – Respondents by Enterprise Size

Deliverable 4.3: Present national and European-level uptake of e-CF powered tool DIGITALJOBS
26
11%
17%
11%
8%
7%
14%
8%
9%
16%
16%
13%
12%
11%
15%
19%
9%
4%
12%
22%
18%
21%
25%
23%
14%
18%
33%
18%
18%
19%
18%
16%
26%
20%
16%
36%
41%
40%
34%
28%
42%
42%
23%
13%
15%
6%
21%
13%
17%
58%
31%
Europe
Italy
Finland
Belgium
Norway
Hungary
Spain
Ireland
Netherlands
Others
1 - 10 11 - 50 51 - 250 251 - 1000 > 1000
Figure 2.7c – Respondents by Country and Enterprise Size
The analysis of distribution of respondents by enterprise size suggests that Spain and Ireland are, in general, countries that host larger organisations, while Italy and Hungary seem to host a greater number of smaller companies. The analysis of ICT profiles distribution by enterprise size shows certain variability. Some profiles are more frequently present in larger organisations, such as Business Information Manager (51%), Developer (50%), Project Manager (48%), and Digital Media Specialist (46%). Others are more frequent in smaller enterprises (1-50 employees), such as ICT Consultant (64%) and Account Manager (47%).
7.8 Respondents by Professional Status
A large majority of European respondents hold full time positions (78%) and this variable does not change very much among individual countries either. The lowest level was 56% in Belgium, and the highest level of 95% was found in Norway.

Deliverable 4.3: Present national and European-level uptake of e-CF powered tool DIGITALJOBS
27
Quality Assurance Manager (88%), Test Specialist (86%) and Chief Information Officer (85%) are the ICT profiles with the highest proportion of full time employees, while the ICT profiles with the lowest rates are Systems Analyst and ICT Consultant (60% each), and Database Administrator and Network Specialist (65% each). It is interesting to note that high rates of self-employed were found among ICT Consultant (29%) and Account Manager (31%).
85%
56%
95%
74%
78%
76%
69%
79%
77%
78%Europe
Italy
Finland
Belgium
Norway
Hungary
Spain
Ireland
Netherlands
Others
Figure 2.8b – Respondents by Country and % with Full Time Position
7.9 Respondents by Declared ICT Profile
Figure 2.9 shows the distribution of the ICT profiles chosen by the respondents during registration (before starting the assessment). This subjective point of view is
10,7% 11,4%
77,9%
Full time employee Part time employee /
Self-employed
Student /
Unemployed / Retired
Figure 2.9a – Respondents by ProfessionalStatus

Deliverable 4.3: Present national and European-level uptake of e-CF powered tool DIGITALJOBS
28
based on their gained experience and the actual work they are doing. It differs from Proximity Profile as explained in paragraph 4.1. All 23 ICT profiles from which the respondents were asked to choose their role had some level of response.
# of respondents
123
57
64
76
37
54
70
197
21
48
55
61
41
189
8
132
36
122
14
30
19
245
47
Total initial declarations 1745
7,1%
3,3%
3,6%
4,3%
2,1%
3,1%
4,0%
11,3%
1,2%
2,7%
3,1%
3,5%
2,3%
10,8%
0,5%
7,6%
2,0%
7,0%
0,8%
1,7%
1,1%
14,0%
2,7%
Chief Information Officer BM1
Business Information Manager BM2
ICT Operations Manager BM3
Business Analyst DS1
Systems Analyst DS2
Enterprise Architect DS3
Systems Architect DS4
Developer DV1
Digital Media Specialist DV2
Test Specialist DV3
Account Manager SP1
ICT Trainer SP2
ICT Security Specialist SP3
ICT Consultant SP4
Database Administrator SR1
Systems Administrator SR2
Network Specialist SR3
Technical Specialist SR4
Service Desk Agent SR5
Quality Assurance Manager TM1
ICT Security Manager TM2
Project Manager TM3
Service Manager TM4
Figure 2.10 – Respondents by ICT Profile
The Project Manager profile was the most chosen profile across 5 countries: Finland and The Netherlands (15% each), Norway (17%), Spain and Ireland (20%). In Belgium the most frequently declared profile was Developer (17%), while the ICT Consultant profile was the most frequently declared in Italy (15%) and in Hungary (16%). Other profiles with relevant rate of declaration (that is 13% or more) are:
Developer (in Ireland declared by 15%)
ICT Operations Manager (in Netherlands declared by 13%)
ICT Consultant (in Belgium declared by 15%)
Systems Administrator (in Italy declared by 14%)

Deliverable 4.3: Present national and European-level uptake of e-CF powered tool DIGITALJOBS
29
Technical Specialist (in Finland declared by 13% and in Spain declared by 14%)
Project Manager (in Finland declared by 15% and in Italy declared by 14%)

Deliverable 4.3: Present national and European-level uptake of e-CF powered tool DIGITALJOBS
30
8 Proximity Profiles and Competences
Each respondent evaluates their competence against the 36 e-competences provided, using the following scale: None: none or almost no knowledge of the topic, confused ideas. Basic: knowledge of major concepts, but not exhaustive. Medium: knowledge of concepts and applicative capability, some direct experiences. High: in-depth and thorough knowledge of concepts and applicative capability with comprehensive experience in a complex context. A Proximity Profile was calculated for each respondent in order to indicate the profile that best fits with the e-competences that the respondent has declared. The proximity is represented as a percentage. A Competence Proficiency Index (CPI) was also computed for each competence. The CPI will allow us to carry out further analysis of levels of proficiency against the five competence areas defined in the e-CF as well as analysing the performance of respondents by country against a European benchmark and also for each of the profiles.
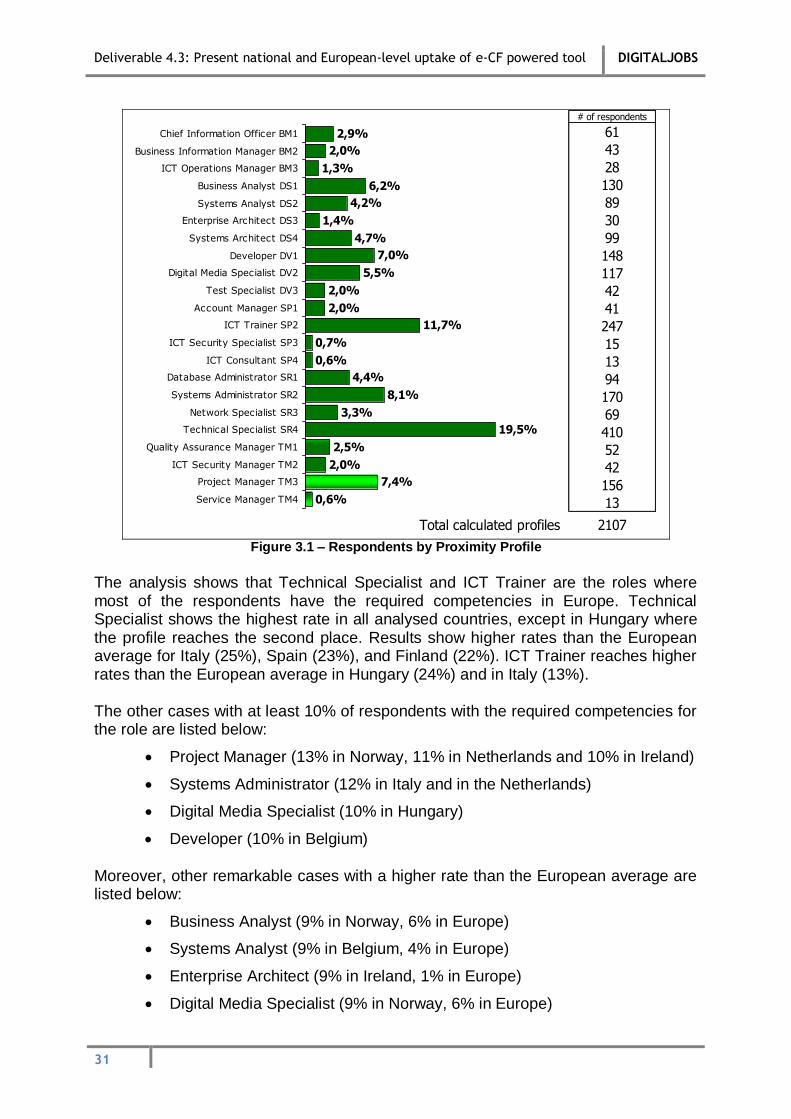
8.1 Respondents by Proximity Profile
Based on the outcome of the calculated proximity profiles we can see a picture of ICT profiles emerge from the e-competences declared by the European respondents.
Deliverable 4.3: Present national and European-level uptake of e-CF powered tool DIGITALJOBS
31
# of respondents
61
43
28
130
89
30
99
148
117
42
41
247
15
13
94
170
69
410
52
42
156
13
Total calculated profiles 2107
2,9%
2,0%
1,3%
6,2%
4,2%
1,4%
4,7%
7,0%
5,5%
2,0%
2,0%
11,7%
0,7%
0,6%
4,4%
8,1%
3,3%
19,5%
2,5%
2,0%
7,4%
0,6%
Chief Information Officer BM1
Business Information Manager BM2
ICT Operations Manager BM3
Business Analyst DS1
Systems Analyst DS2
Enterprise Architect DS3
Systems Architect DS4
Developer DV1
Digital Media Specialist DV2
Test Specialist DV3
Account Manager SP1
ICT Trainer SP2
ICT Security Specialist SP3
ICT Consultant SP4
Database Administrator SR1
Systems Administrator SR2
Network Specialist SR3
Technical Specialist SR4
Quality Assurance Manager TM1
ICT Security Manager TM2
Project Manager TM3
Service Manager TM4
Figure 3.1 – Respondents by Proximity Profile
The analysis shows that Technical Specialist and ICT Trainer are the roles where most of the respondents have the required competencies in Europe. Technical Specialist shows the highest rate in all analysed countries, except in Hungary where the profile reaches the second place. Results show higher rates than the European average for Italy (25%), Spain (23%), and Finland (22%). ICT Trainer reaches higher rates than the European average in Hungary (24%) and in Italy (13%). The other cases with at least 10% of respondents with the required competencies for the role are listed below:
Project Manager (13% in Norway, 11% in Netherlands and 10% in Ireland)
Systems Administrator (12% in Italy and in the Netherlands)
Digital Media Specialist (10% in Hungary)
Developer (10% in Belgium) Moreover, other remarkable cases with a higher rate than the European average are listed below:
Business Analyst (9% in Norway, 6% in Europe)
Systems Analyst (9% in Belgium, 4% in Europe)
Enterprise Architect (9% in Ireland, 1% in Europe)
Digital Media Specialist (9% in Norway, 6% in Europe)

Deliverable 4.3: Present national and European-level uptake of e-CF powered tool DIGITALJOBS
32
Chief Information Officer (7% in the Netherlands, 3% in Europe)
Service Manager (5% in Ireland, 1% in Europe)
8.2 Comparison between Professional Profile and Proximity Profile
An analysis of the profile selected by ICT practitioners and the Proximity Profile, i.e. the profile that fits best with the competences that were declared shows a large variance for many of the profiles in this sample.
29%
7%
3%
31%
21%
11%
16%
27%
8%
9%
38%
73%
2%
2%
0%
28%
4%
42%
0%
38%
39%
32%
2%
23%Total
Co
ncu
rren
ce b
etw
een
decla
red
an
d c
alc
ula
ted
(% o
n d
ecla
red)
Chief Information Officer BM1
Business Information Manager BM2
ICT Operations Manager BM3
Business Analyst DS1
Systems Analyst DS2
Enterprise Architect DS3
Systems Architect DS4
Developer DV1
Digital Media Specialist DV2
Test Specialist DV3
Account Manager SP1
ICT Trainer SP2
ICT Security Specialist SP3
ICT Consultant SP4
Database Administrator SR1
Systems Administrator SR2
Network Specialist SR3
Technical Specialist SR4
Service Desk Agent SR5
Quality Assurance Manager TM1
ICT Security Manager TM2
Project Manager TM3
Service Manager TM4
Declared profile
Calculated profileEurope
Figure 3.2 – Comparison of Declared Profile and Proximity Profile
In general, the difference between the declared and the calculated professional profile highlights the importance of the level of competence granularity to build up each profile. The difference between the calculated and the declared profile may be partly due to a respondents motivation in selecting a career profile from the 23 profiles provided; this might be influenced by the following factors:
The respondents perception of their current career (at the time of filling out the questionnaire)
How satisfied/dissatisfied they are with their current job
The manner in which their career profile is defined in the company/organisation
How the defined profiles are recognised in the national labour market (by salary, etc.) or by the territory in which work experience has been carried out

Deliverable 4.3: Present national and European-level uptake of e-CF powered tool DIGITALJOBS
33
The respondent’s own preference for a particular ICT career irrespective of whether they even have the right competences/experience for that profile at the time of filling out the questionnaire, e.g. a respondent who is seeking a new career direction
In contrast, the calculated profile is generated independently of subjective values. The algorithm used relates to the responses on the levels of e-competence held, and then produces the calculated profile. The level of granularity of questions/responses allow for the profiles to be differentiated independently from the respondent’s own perceptions of the declared career profiles. This is why the declared profiles can differ greatly from their calculated profile. Only 23% of the declared profiles of European respondents in the sample matched their calculated profile. Among the analysed countries, the percentage of matches varies from 16% to 27% between declared and calculated profiles:
16% of the declared profiles in Hungary match the calculated profile
20% in Spain
22% in Finland
23% in Italy and Belgium
24% in Norway
27% in Ireland, the Netherlands, and for ‘Others countries’ For the reasons outlined above, only the data from the calculated profiles is used for the analysis.
8.3 Analysis of Competence Proficiency
Figure 3.3 provides a comparison of the Competence Proficiency Index for the five competence areas: Plan, Build, Run, Enable, and Manage.
24%
25%
29%
15%
18%
Plan
Build
Run
Enable
Manage
Figure 3.3 – Competence Proficiency Index by Competence Areas

Deliverable 4.3: Present national and European-level uptake of e-CF powered tool DIGITALJOBS
34
Results show a noticeable difference among the levels of competence for the five areas: the highest CPI (Run area, 29%) is almost twice larger than the lowest one (Enable area, 15%). The CPI for the Manage Area (18%) is a bit better than the Enable area, while the remaining areas Plan and Build scored a CPI of 24% and 25% respectively. The same order of the five areas found for Europe is more or less replicated in all analysed countries: the Run area always scores the best CPI in the sample, except for the Netherlands where it is overtaken by the Plan area (27% vs. 26%); and the Enable area which always shows the lowest CPIs. A deeper analysis of the Competence Proficiency Indexes of each competence area is fundamental in order to design detailed training paths to cover the competence gaps for each proximity profile of each respondent. The following chart (Figure 3.4) shows the average CPI for all European respondents.
23%20%
18%32%
31%29%
31%9%
23%24%
22%25%
34%
35%32%
21%29%
16%18%
21%15%
16%4%
5%13%
22%20%
11%20%
16%24%
23%13%
18%14%
18%
IS & Business Strategy Alignment A01Service Level Management A02
Business Plan Development A03
Product or Project Planning A04Design Architecture A05
Application Design A06Technology Watching A07
Sustainable development A08
Design & Development B01
Systems Integration B02Testing B03
Solution Deployment B04
Documentation Production B05
User Support C01Change Support C02
Service Delivery C03
Problem Management C04
Information Security Strategy Development D01ICT Quality Strategy Development D02
Education & Training Provision D03
Purchasing D04Sales Proposal Development D05
Channel Management D06Sales Management D07
Contract Management D08
Personnel Development D09Information & Knowledge Management D10
Forecast Development E01
Project & Portfolio Management E02
Risk Management E03Relationship Management E04
Process Improvement E05ICT Quality Management E06
Business Change Management E07
Information Security Management E08IT Governance E09
PLA
NB
UIL
DR
UN
EN
AB
LE
MA
NA
GE
Base: 1745 casesCompetence Proficiency Index - Europe
Figure 3.4 – Competence Proficiency Index
8.4 Competence Clustering
A clustering approach (hierarchical cluster analysis) was used to examine the 22 ICT profiles and to attempt to identify relatively homogeneous groups of profiles based on selected characteristics. This is carried out using an algorithm that starts with a separate cluster in each case and then combines clusters until only one is left. In this

Deliverable 4.3: Present national and European-level uptake of e-CF powered tool DIGITALJOBS
35
analysis we have carried out the 23 profiles of the CEPIS research and 36 variables have been used which are the CPIs of each competencies. The dendrogram13 in Figure 3.5 below shows how the four clusters were generated. The tool analyses and selects the profiles with the nearest CPI values: the first two profiles were Developer and Digital Media Specialist, the third closest profile was Test Specialist, and the fourth was Systems Architect, and so on. Four clusters have been produced with eleven profiles grouped in cluster 1, eight in cluster 2, two profiles in cluster 3 and one in cluster 4.
Developer
Digital Media Specialist
Test Specialist
Systems Architect
Database Administrator
Network Specialist
Technical Specialist
Systems Administrator
Systems Analyst
ICT Trainer
Quality Assurance Manager
Business Information Manager
Business Analyst
ICT Consultant
Project Manager
Chief Information Officer
Enterprise Architect
ICT Operations Manager
ICT Security Manager
ICT Security Specialist
Service Manager
Account Manager
1
clusters
2
3
4
Figure 3.5 – ICT Profiles Clustering - Dendrogram
The four clusters produced from the analysis suggested some interesting considerations, taking into account that the fourth cluster only includes the Account Manager profile, which is quite different compared with the other clustered profiles. The four clusters are categorised and named as follows:
Cluster 1: Mainly technical profiles; the aggregated CPI of the cluster shows that the lowest CPI are in Plan, Enable and Manage area. This cluster groups the very large majority of European respondents, almost three out of four.
Cluster 2: Mainly profiles oriented to management and planning; in this cluster fall almost 23% of the cases; the aggregate CPI of the cluster shows the highest CPI in Plan and Manage areas.
Cluster 3: Only two profiles are grouped in this intensive operational cluster, and they represent only a bit more than 1% of respondents; however this cluster shows high CPIs in each areas, especially in the Run area.
13 A dendrogram is a tree diagram used to illustrate the arrangement of the clusters produced by hierarchical clustering.

Deliverable 4.3: Present national and European-level uptake of e-CF powered tool DIGITALJOBS
36
Cluster 4: Only one profile falls in this cluster, the Account Manager, which is oriented to commercial aspects; it represent almost only 2% of all respondents; it shows very low CPI in Build and Run area but its best result is in the Enable area.
Figure 3.6 compares the different CPI of the four clusters.
0%
10%
20%
30%
40%
50%
60%
70%
80%
IS &
Bu
sin
ess
Stra
tegy
Alig
nm
ent
A0
1
Serv
ice
Leve
l Man
agem
ent
A0
2
Bu
sin
ess
Pla
n D
evel
op
men
t A
03
Pro
du
ct o
r P
roje
ct P
lan
nin
g A
04
Arc
hit
ectu
re D
esig
n A
05
Ap
plic
atio
n D
esig
n A
06
Tech
no
logy
Wat
chin
g A
07
Sust
ain
able
dev
elo
pm
ent
A0
8
Des
ign
& D
evel
op
men
t B
01
Syst
ems
Inte
grat
ion
B0
2
Test
ing
B0
3
Solu
tio
n D
eplo
ymen
t B
04
Do
cum
enta
tio
n P
rod
uct
ion
B0
5
Use
r Su
pp
ort
C0
1
Ch
ange
Su
pp
ort
C0
2
Serv
ice
Del
iver
y C
03
Pro
ble
m M
anag
emen
t C
04
Info
rmat
ion
Sec
uri
ty S
trat
egy
Dev
elo
pm
ent
ICT
Qu
alit
y St
rate
gy D
evel
op
men
t D
02
Edu
cati
on
& T
rain
ing
Pro
visi
on
D0
3
Pu
rch
asin
g D
04
Sale
s P
rop
osa
l Dev
elo
pm
ent
D0
5
Ch
ann
el M
anag
emen
t D
06
Sale
s M
anag
emen
t D
07
Co
ntr
act
Man
agem
ent
D0
8
Per
son
nel
Dev
elo
pm
ent
D0
9
Info
rmat
ion
& K
no
wle
dge
Man
agem
ent
D1
0
Fore
cast
Dev
elo
pm
ent
E01
Pro
ject
& P
ort
folio
Man
agem
ent
E02
Ris
k M
anag
emen
t E0
3
Rel
atio
nsh
ip M
anag
emen
t E0
4
Pro
cess
Imp
rove
men
t E0
5
ICT
Qu
alit
y M
anag
emen
t E0
6
Bu
sin
ess
Ch
ange
Man
agem
ent
E07
Info
rmat
ion
Sec
uri
ty M
anag
emen
t E0
8
IT G
ove
rnan
ce E
09
Cluster 1: Technical
Cluster 2: Management/Planning
Cluster 3: Intensive operational
Cluster 4: Commercial
Figure 3.6 – Competence Proficiency Index

Deliverable 4.3: Present national and European-level uptake of e-CF powered tool DIGITALJOBS
37
9 Profiles Analysis
Over 2,000 Proximity Profiles were generated which referred to 23 ICT professional profiles (Figure 3.1). The eligibility criteria for the analysis of these profiles are as follows:
100 or more cases overall in the seven analysed countries
10 or more cases per country for each profile
Presence in at least four countries Following this criteria, the following 7 profiles for Europe were selected and analysed:
1. Business Analyst 2. Developer 3. Digital Media Specialist 4. ICT Trainer 5. Systems Administrator 6. Technical Specialist 7. Project Manager
A deeper analysis of the data for each of these 7 profiles is presented in this chapter. The basic results of the other profiles are available in section 6.5.2.
9.1 Business Analyst
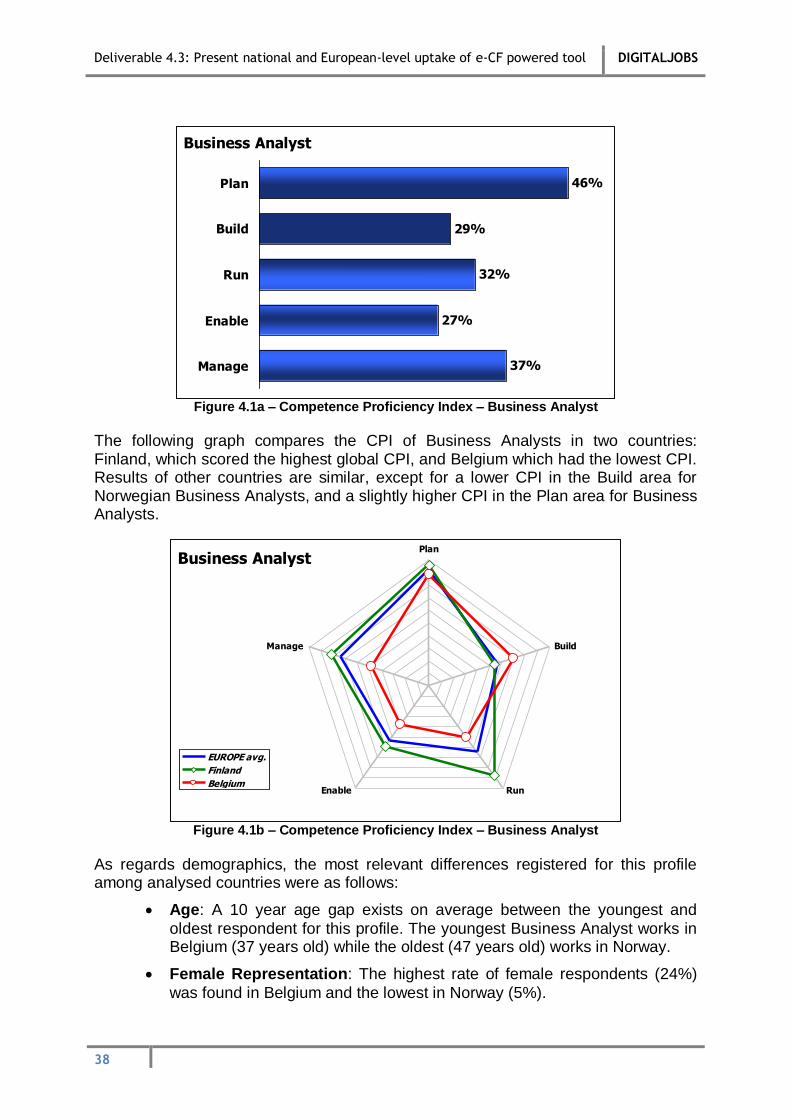
A very large majority (92%) of European Business Analysts in this sample have obtained a university degree or higher, this is the highest rate among the seven analysed Profiles. Moreover, 60% of Business Analysts have obtained a fourth level qualification (Master or PhD), which is the highest rate as well. A noticeable proportion (39%) of Business Analysts come from an education background where IT was not the main focus. However, other profiles show even higher rates of ICT professionals with non IT-focused education. The average Business Analyst is 44 years old, two years older than the average of European ICT professionals. Only a few of the Business Analysts who responded were female (15%), which is equal to the female proportion among European ICT professionals in the sample. Just over a half of Business Analysts come from the IT demand side (54%). The distribution by organisation size for Business Analysts is quite similar to the average distribution, that is 25.4% in micro/small organisations (1-50 employees), 35.4% in medium organisations (51-1000 employees), and 39.2% in large organisations (>1,000 employees). Business Analysts show a high Competence Proficiency Index in the Plan area, the highest among analysed profiles. They also score the highest CPIs in the Enable and Manage areas with 27% and 37% respectively, whilst in the Build and Run areas they reach similar CPIs to the European average of all profiles.
Deliverable 4.3: Present national and European-level uptake of e-CF powered tool DIGITALJOBS
38
46%
29%
32%
27%
37%
Plan
Build
Run
Enable
Manage
Business Analyst
Figure 4.1a – Competence Proficiency Index – Business Analyst
The following graph compares the CPI of Business Analysts in two countries: Finland, which scored the highest global CPI, and Belgium which had the lowest CPI. Results of other countries are similar, except for a lower CPI in the Build area for Norwegian Business Analysts, and a slightly higher CPI in the Plan area for Business Analysts.
Plan
Build
RunEnable
Manage
EUROPE avg.
Finland
Belgium
Business Analyst
Figure 4.1b – Competence Proficiency Index – Business Analyst
As regards demographics, the most relevant differences registered for this profile among analysed countries were as follows:
Age: A 10 year age gap exists on average between the youngest and
oldest respondent for this profile. The youngest Business Analyst works in Belgium (37 years old) while the oldest (47 years old) works in Norway.
Female Representation: The highest rate of female respondents (24%)
was found in Belgium and the lowest in Norway (5%).

Deliverable 4.3: Present national and European-level uptake of e-CF powered tool DIGITALJOBS
39
IT as Main Focus in Education: The highest rate of responses came
from Belgium (65%) while the lowest has been collected in Italy (54%).
Industry Sector Predominance: In Finland, only 42% of the respondents
work in the IT supply side, while in Italy the proportion of Business Analysts working in the IT supply side is 62%.
Presence in Micro/Small Organisations: The highest rate of
respondents working in micro/small organisations was found in Finland (29%) and the lowest in Belgium (17%).
9.2 Developer
A large majority (78%) of European Developers in the sample have obtained a university degree or higher. However, this is the lowest rate among the seven profiles analysed, and it is quite lower than the average for European Professionals (86%). On the other hand, the achievement of fourth level qualification (Masters or PhDs.) shows a similar rate between Developers (39%) and the general average (40%). In Europe, 73% of Developers have an IT-focused education. European Developers are the youngest ICT professionals: they are on average 38 years old, while the average age of all respondents is almost 42 years. The large majority of Developers who responded were male (81%); a rate in line with the general average of 85%. Over half of Developers work in the IT supply side (57%), this is the second highest rate found for an ICT profile at the European level in this sample. Half of the responding Developers work in large organisations (36% is the European average) and about one fourth work in micro/ small organisations (24% is the European average). Developers show a high Competence Proficiency Index for the Build area (50% vs. 25% European average); while in the Enable and in Manage areas Developers score the lowest CPI among all ICT profiles (about 7% lower than the European average for all profiles).

Deliverable 4.3: Present national and European-level uptake of e-CF powered tool DIGITALJOBS
40
20%
50%
35%
9%
10%
Plan
Build
Run
Enable
Manage
Developer
Figure 4.2a – Competence Proficiency Index – Developer
The graph below compares the Competence Proficiency Indexes of Developers in two countries: Finland, which has the highest overall CPI, and Belgium, which has the lowest. Results from other countries are similar to these: we can note more developed competencies for the Norwegian Developer in the Plan and Build areas, while Italian Developers seem to have less competencies in the Manage area.
Plan
Build
RunEnable
Manage
EUROPE avg.
Finland
Belgium
Developer
Figure 4.2b – Competence Proficiency Index - Developer
As regards demographics, the more relevant differences registered for this profile among analysed countries were as follows:
Age: An 11 year gap exists on average between the oldest and youngest
respondent for this profile. The youngest Developer works in Belgium (30 years old) while the oldest (41 years old) works in Norway.
Female Representation: The highest rate of female Developers (36%)
was registered in Norway and the lowest in Italy (9%).

Deliverable 4.3: Present national and European-level uptake of e-CF powered tool DIGITALJOBS
41
IT as Main Focus in Education: The highest rate is registered in Belgium
(86%) while the lowest rate is in Italy (62%).
Industry Sector Predominance: In Finland, 67% of the Developers work
in the IT supply side, while in Italy only 50% of Developers do so.
Presence in Micro/Small Organisations: The highest rate is in Belgium (33%), while the lowest is in Finland (23%). Italy is the only country where less than 50% of the Developers (43%) work in large organisations.
Finally, it is important to report a particular situation for Belgium, where two out of three Developers declared to be students.
9.3 Digital Media Specialist
A large majority (90%) of European Digital Media Specialists in the sample have obtained a university degree or higher. Close to half of Digital Media Specialists (45%) have obtained a fourth level qualification (Masters or PhDs); slightly higher than the European average of 40%. In Europe, 84% of Digital Media Specialists have an IT-focused education, the highest rate among all ICT profiles, and remarkably higher than the average of 66% for European Digital Media Specialists. A large majority of Systems Analysts who responded were male (86%), which is very close to the European average of 85%. Digital Media Specialists mainly work in the IT supply side (58%), this is the highest rate found for an ICT profile at European level. A breakdown by organisation size shows that 46% Digital Media Specialists work in larger organisations (the European average is 36%) and only 4% work in micro organisations (the European average is 11%). Digital Media Specialists show a high Competence Proficiency Index for the Build area, the highest among the professional profiles analysed in this sample (55% vs. 25% European average). However, in the Enable and Manage areas Digital Media Specialists score low CPIs (12% each vs. European average of 15% and 18%). For the remaining areas, Digital Media Specialists have CPIs that are similar to the European average.
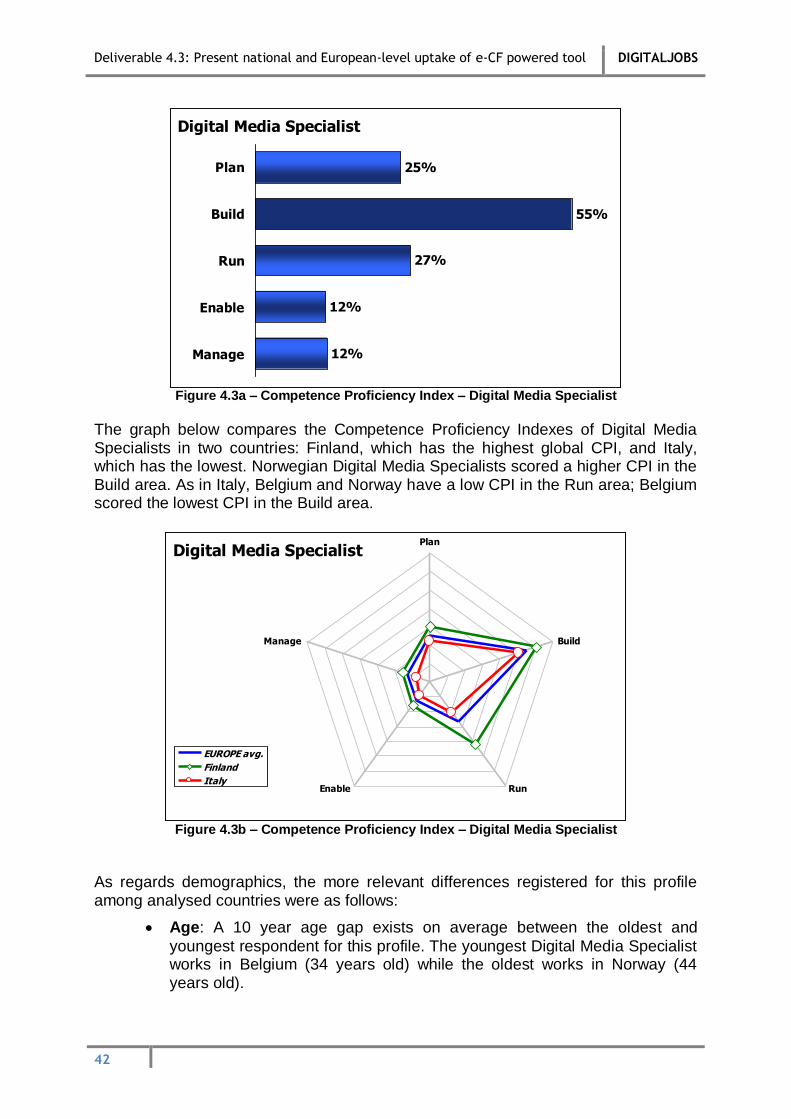
Deliverable 4.3: Present national and European-level uptake of e-CF powered tool DIGITALJOBS
42
25%
55%
27%
12%
12%
Plan
Build
Run
Enable
Manage
Digital Media Specialist
Figure 4.3a – Competence Proficiency Index – Digital Media Specialist
The graph below compares the Competence Proficiency Indexes of Digital Media Specialists in two countries: Finland, which has the highest global CPI, and Italy, which has the lowest. Norwegian Digital Media Specialists scored a higher CPI in the Build area. As in Italy, Belgium and Norway have a low CPI in the Run area; Belgium scored the lowest CPI in the Build area.
Plan
Build
RunEnable
Manage
EUROPE avg.
Finland
Italy
Digital Media Specialist
Figure 4.3b – Competence Proficiency Index – Digital Media Specialist
As regards demographics, the more relevant differences registered for this profile among analysed countries were as follows:
Age: A 10 year age gap exists on average between the oldest and
youngest respondent for this profile. The youngest Digital Media Specialist works in Belgium (34 years old) while the oldest works in Norway (44 years old).

Deliverable 4.3: Present national and European-level uptake of e-CF powered tool DIGITALJOBS
43
Female Representation: There is not much variation in terms of female
representation for this profile. The highest rate of female Digital Media Specialist (20%) was registered in Finland and the lowest in Belgium (14%).
Education Level: All Norwegian Digital Media Specialists have a
university degree while in Italy on 77% have a degree.
Industry Sector Predominance: The majority of Digital Media Specialists (80%) work in the supply side in Finland, while in Italy this figure drops to 38%.
Presence in Micro/Small Organisations: The highest rate is in Italy
(27%), while the lowest in Belgium (0%). On the other side, Italy shows a rate of only 38% of Digital Media Specialists working in large organisations, compared to 60% in Belgium and Finland.
Finally, it is interesting to note that 57% of Digital Media Specialists in Belgium declared to
be students.
9.4 ICT Trainer
A large proportion of ICT Trainers in the sample have obtained a university degree or higher (91%), which is slightly higher than the general average for Europe (86%). Among European ICT Trainers, 53% have obtained a fourth level qualification (Masters or PhDs.), which is remarkably higher than the average of 40%. More than half of ICT Trainers (58%) have an education background where IT was the main focus in the curriculum, compared to 66% of all respondents; this is the lowest proportion among the profiles analysed in this report. ICT Trainers are 45 years old on average, more than 3 years older than the typical ICT professional. They are the oldest ICT professionals in Europe. A large majority of ICT Trainers who responded were male (75%), however this profile (along with Project Manager) has the highest rate of women (25%), which is 10 percentage points higher than the general European female proportion for all respondents in the sample (15%). ICT Trainers are relatively equally distributed between the IT supply and demand side of the ICT sector (47:51). As regards to the distribution by enterprise size, no differences were found compared to the European average. ICT Trainers show Competence Proficiency Indexes almost always lower than the European average. This is particularly the case in the Build and Run areas where ICT Trainers had the lowest CPIs (17% and 22% respectively vs. the average of 25% and 29%). ICT Trainers only scored a CPI higher than the European average in the Enable area (22% vs. 15%). In the Plan and Manage areas, ICT Trainers reached CPIs similar to the European average.

Deliverable 4.3: Present national and European-level uptake of e-CF powered tool DIGITALJOBS
44
23%
17%
22%
22%
17%
Plan
Build
Run
Enable
Manage
ICT Trainer
Figure 4.4a – Competence Proficiency Index – ICT Trainer
The following graph compares the Competence Proficiency Indexes of the ICT Trainer profile in two countries: Spain, which has the highest global CPI, and Hungary, which has the lowest. Results from other countries are quite similar, even with different CPI levels. Finnish ICT Trainers have a deeper level of proficiency than other countries in the Run and Enable areas, while Italian ICT Trainers seem to have more competences in the Build area.
Plan
Build
RunEnable
Manage
EUROPE avg.
Spain
Hungary
ICT Trainer
Figure 4.4b – Competence Proficiency Index – ICT Trainer
As regards demographics, the more relevant differences registered for this profile among analysed countries were as follows:
Age: A 12 year age gap exists on average between the oldest and
youngest respondent for this profile. The youngest ICT Trainer works in Belgium (38 years old) while the oldest works in Norway (50 years old).

Deliverable 4.3: Present national and European-level uptake of e-CF powered tool DIGITALJOBS
45
Female Representation: The highest rate of female ICT Trainers (33%)
was registered in Norway and the lowest in Spain, where no woman declared competences required for this role.
Education Level: All Norwegian ICT Trainers have a university degree,
while only 80% of the ICT Trainers in Spain are graduated in the sample.
IT as Main Focus in Education: The highest rate was found in Spain
(90%) while the lowest was registered in Norway (44%).
Industry Sector Predominance: The majority of Spanish ICT Trainers
(60%) works in the IT supply side, while only 39% of ICT Trainers do so in Norway.
Presence in Micro/Small Organisations: The highest rate is found in
Italy (43%) while the lowest rate is in Belgium (14%). Hungary shows a rate of only 17% of ICT Trainers working in large organisations, while there are 47% in Finland.
9.5 Systems Administrator
79% of European Systems Administrators in this sample have obtained a university degree or higher, which is clearly lower than the general average for European Professionals (86%). Moreover, only 2% of European Systems Administrators have obtained a fourth level qualification (Masters or PhDs.), which is the lowest rate among the analysed profile and clearly lower than the European average of all respondents (40%). 71% of Systems Administrators have an IT-focused education; a proportion slightly higher than the global European average of 66%. The European Systems Administrator respondent is 38 years old on average and about 4 years younger than his/her colleagues. He/she is the second youngest ICT professional. Only a small share of Systems Administrators who responded was female in the sample (13%) which is in line with the overall European average of 15%. Systems Administrators work in similar proportion in the supply (46%) and demand (54%) side of the ICT sector, which shows a opposite pattern than the global average, even if the rates are not too different (51% and 49%). Their distribution by enterprise size is quite similar to the distribution of all respondents, and denotes only a smaller proportion of respondents in larger organisations and a corresponding larger proportion in medium organisations. Systems Administrators show low Competence Proficiency Indexes in the Plan (15%) and Enable (9%) areas; these are the lowest CPIs among the seven profiles analysed in this report. Moreover, in the Manage area the performance of Systems Administrators is rather scarce (11% vs. 18% European average). In addition, results in the Build area are similar to the European average, while in the Run area they are better (36% vs. 29%).
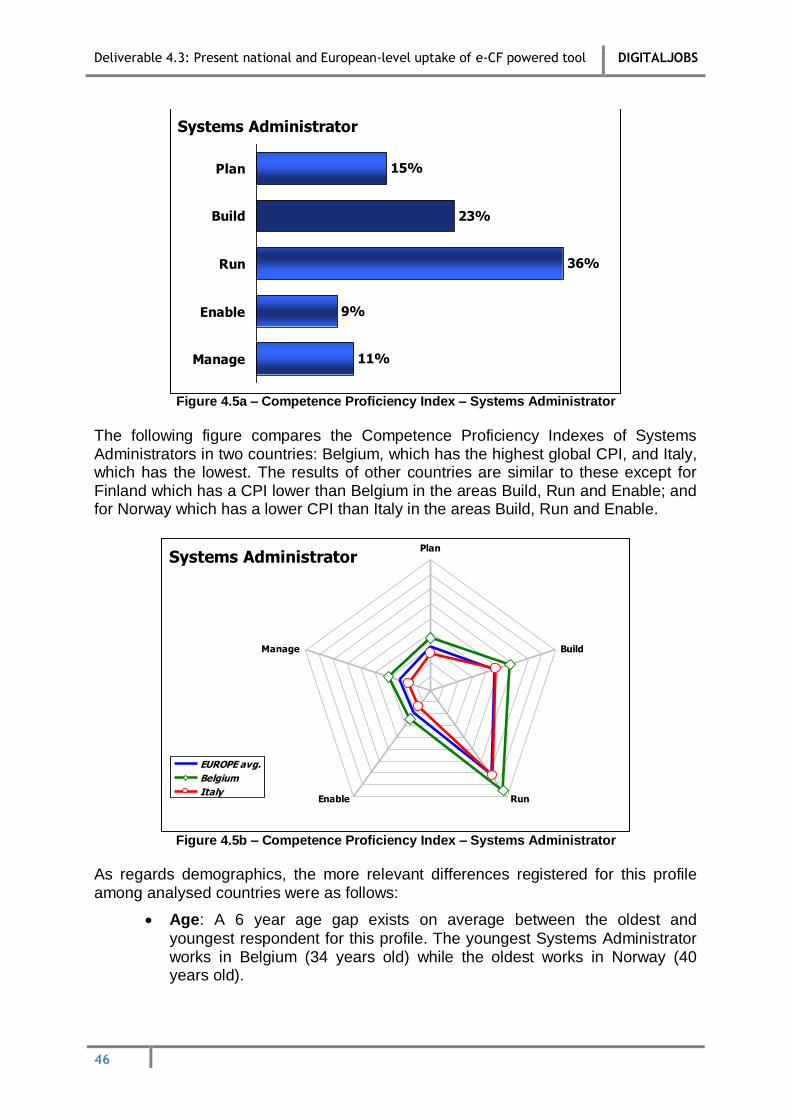
Deliverable 4.3: Present national and European-level uptake of e-CF powered tool DIGITALJOBS
46
15%
23%
36%
9%
11%
Plan
Build
Run
Enable
Manage
Systems Administrator
Figure 4.5a – Competence Proficiency Index – Systems Administrator
The following figure compares the Competence Proficiency Indexes of Systems Administrators in two countries: Belgium, which has the highest global CPI, and Italy, which has the lowest. The results of other countries are similar to these except for Finland which has a CPI lower than Belgium in the areas Build, Run and Enable; and for Norway which has a lower CPI than Italy in the areas Build, Run and Enable.
Plan
Build
RunEnable
Manage
EUROPE avg.
Belgium
Italy
Systems Administrator
Figure 4.5b – Competence Proficiency Index – Systems Administrator
As regards demographics, the more relevant differences registered for this profile among analysed countries were as follows:
Age: A 6 year age gap exists on average between the oldest and
youngest respondent for this profile. The youngest Systems Administrator works in Belgium (34 years old) while the oldest works in Norway (40 years old).

Deliverable 4.3: Present national and European-level uptake of e-CF powered tool DIGITALJOBS
47
Female Representation: The highest rate of female Systems
Administrators (23%) was registered in Norway and the lowest in Belgium (8%).
Education Level: All Systems Administrators in Belgium have a university
degree, while only 68% of their Italian colleagues are graduated.
IT as Main Focus in Education: The highest rate of Systems
Administrators with an IT-focused education was found in Belgium (83%) while the lowest rate was found in Norway (46%).
Industry Sector Predominance: The highest rate was 55% from the
supply side in Finland while in Norway the proportion of Systems Administrators working in the IT supply side was only 38%.
Presence in Large (>1,000 Employees) Organisations: The highest
number of Systems Administrators working in large organisations was found in Italy (43%), while the lowest is was found in Belgium (0%).
9.6 Technical Specialist
80% of European Technical Specialists in this sample have obtained a university degree or higher, a proportion slightly lower than the overall European average for ICT professionals (86%). Moreover, only 27% of Technical Specialists have obtained a fourth level qualification (Masters or PhDs.), which is lower than the total European average of 40%. A large amount of Technical Specialists (67%) have an educational background where IT was the main focus, which is very close to the overall average for all ICT professionals (66%). Technical Specialists are 42 years old on average, which is very close to the average age of the European ICT professional. A wide majority of Technical Specialists who responded were male (88%). As a result, this role has the lowest female representation in this sample. Technical Specialists work in similar proportion for the supply (54%) and demand side (46%) of the ICT sector, which is in line with the European average (51% and 49%). The distribution by enterprise size reflects the overall European results. Technical Specialists show a significantly higher Competence Proficiency Index in the Run area (the highest), while the score of the other areas are similar to the average European CPI.

Deliverable 4.3: Present national and European-level uptake of e-CF powered tool DIGITALJOBS
48
23%
29%
55%
15%
18%
Plan
Build
Run
Enable
Manage
Technical Specialist
Figure 4.6a – Competence Proficiency Index – Technical Specialist
The graph below compares the Competence Proficiency Indexes of Technical Specialists in two countries: Ireland, which has the highest global CPI, and Hungary, which has the lowest. Results of other countries are quite similar to the European average. Spanish Technical Specialists have a deeper level of competencies in the Run area (CPI slightly higher than the Irish CPI), and in the Manage area. Belgian Technical Specialists have CPIs that are very close to Irish professionals in the Build and Enable areas.
Plan
Build
RunEnable
Manage
EUROPE avg.
Ireland
Hungary
Technical Specialist
Figure 4.6b – Competence Proficiency Index – Technical Specialist
As regards demographics, the more relevant differences registered for this profile among analysed countries were as follows:
Age: A 7 year age gap exists on average between the oldest and
youngest respondent for this profile. The youngest Technical Specialist

Deliverable 4.3: Present national and European-level uptake of e-CF powered tool DIGITALJOBS
49
comes from Belgium (40 years old) while the oldest comes from the Netherlands (47 years old).
Female Representation: The highest rate was registered in Ireland (29%)
and the lowest in Hungary and in the Netherlands, where no women declared competences required to be a Technical Specialist.
Education Level: All Technical Specialists in the Netherlands are
graduated, while only 71% of their Finnish colleagues have a university degree.
IT as Main Focus in Education: Results varied greatly for this criteria. The highest rate of Technical Specialists with an IT-focused education was found in Spain (92%) while the lowest was found in Ireland (43%).
Prevalence of Supply Side: The highest rate of Technical Specialists
working in the IT supply side was in Norway (61%), while the lowest rate was found in Hungary with only 36%.
Presence in Micro/Small Organisations: The highest rate of Technical
Specialists working in micro/small organisations was found in Hungary (45%) and the lowest in Spain (9%). On the other side, only 27% of Technical Specialists in Hungary work in large organisations, while in Ireland there are 58%.
9.7 Project Manager
90% of European Project Managers in the sample have obtained a university degree or higher. Moreover, 54% of Project Managers have obtained a fourth level qualification (Masters or PhDs). Only half of Project Managers have an IT-focused background (50%). European Project Managers are equally distributed between the IT supply and demand sides (50:50). The average Project Manager respondent is 44 years old, almost 3 years older than the typical ICT professional. He/she is the second oldest ICT professional in Europe. Project Manager, along with ICT Trainer, is the profile with the highest rate of female representation (25%), which is 10 percentage points higher than the overall European female average (15%). Almost half of Project Managers work in large organisations (48%), this is the second highest rate among ICT profiles in this sample and it is much higher than the European average of 36%. Project Managers show a significantly high CPI for the Plan area (36% vs. 24% European average), the Enable area (23% vs. 15% European average), and the Manage area (38% vs. 18% European average). However, their competences were more limited in the Build area (22% vs. 25% European average) and in the Run area (26% vs. 29% European average).

Deliverable 4.3: Present national and European-level uptake of e-CF powered tool DIGITALJOBS
50
36%
22%
26%
23%
38%
Plan
Build
Run
Enable
Manage
Project Manager
Figure 4.7a – Competence Proficiency Index – Project Manager
The following graph compares the Competence Proficiency Indexes of Project Managers in two countries: Finland, which has the highest overall CPI, and Belgium, which has the lowest. Results of other countries are quite similar to the Finnish ones. However, Belgian Project Managers seem to have less competencies in the Build and Run areas, while their Italian colleagues have a higher CPI in the Plan area.
Plan
Build
RunEnable
Manage
EUROPE avg.
Finland
Belgium
Project Manager
Figure 4.7b – Competence Proficiency Index – Project Manager
As regards demographics, the more relevant differences registered for this profile among analysed countries were as follows:
Age: The average Project Manager respondent is 44 years old on average
in all four countries analysed.
Female Representation: The highest rate of female Project Managers
was registered in Norway (31%) and the lowest in Italy (15%).

Deliverable 4.3: Present national and European-level uptake of e-CF powered tool DIGITALJOBS
51
IT as Main Focus in Education: The highest rate was found in Italy
(58%) while the lowest was found in Belgium (31%).
Industry Sector Predominance: There is not much variations in terms of
Project Managers working in the IT supply side. The highest rate was in Finland (63%), while in Norway the proportion of Project Managers working in the IT supply side was 48%.
Presence in Micro/Small Organisations: Close to one third of Finnish Project Managers (27%) work in micro/small organisations, while less than one tenth of Belgian Project Managers (9%) do so. On the other side, Norway shows a rate of 43% of Project Managers working in large organisations, while in Belgium there are 64%.

Deliverable 4.3: Present national and European-level uptake of e-CF powered tool DIGITALJOBS
52
10 Conclusions
The data gathered in this round of the CEPIS Professional Benchmark research shows a high level of interest among ICT professionals to reflect on their competences and job profile. However, from a statistical point of view, the results need to be tackled with care, as the sample of voluntary respondents who accepted the invitation from the computer society may not be fully representative of the total community of European ICT professionals.
10.1 Profiles and Demographic Analysis
The following section draws conclusions based on the analysis of the segmentation of the profiles that arise from the 1,745 respondents from all over Europe (see section 6.4.2 for details). Figure 5.1 below shows one dimension of the labour market represented by the distribution of profiles in respect of the size of organizations in which each single ICT professional profile works. The distribution of profiles has been segmented on the basis of the dimension of the organisation in which respondents have declared that they work. There is evidence that the majority of respondents in the sample work in larger organisations; in particular profiles such as Quality Assurance Manager, Project Manager, ICT Security Specialist, Business Information Manager, Chief Information Officer and Digital Media Specialist (all with a rate higher than 60%). On the other side, only four profiles, ICT Consultant, Account Manager, Enterprise Architect and Network Specialist (all with rate higher than 20%) work in very small companies (1-10 employees) (section 6.4.2).

Deliverable 4.3: Present national and European-level uptake of e-CF powered tool DIGITALJOBS
53
11%
12%
10%
14%
12%
14%
23%
19%
11%
4%
18%
32%
16%
15%
44%
12%
10%
20%
9%
4%
18%
9%8%
35%
26%
27%
53%
32%
31%
19%
29%
32%
35%
43%
33%
33%
21%
28%
34%
44%
34%
38%
28%
40%
26%32%
54%
62%
63%
34%
56%
55%
58%
52%
57%
61%
39%
35%
50%
64%
28%
54%
46%
46%
53%
68%
42%
65%59%
Average
Chief Information Officer BM1
Business Information Manager BM2
ICT Operations Manager BM3
Business Analyst DS1
Systems Analyst DS2
Enterprise Architect DS3
Systems Architect DS4
Developer DV1
Digital Media Specialist DV2
Test Specialist DV3
Account Manager SP1
ICT Trainer SP2
ICT Security Specialist SP3
ICT Consultant SP4
Database Administrator SR1
Systems Administrator SR2
Network Specialist SR3
Technical Specialist SR4
Quality Assurance Manager TM1
ICT Security Manager TM2
Project Manager TM3
Service Manager TM4
1 .. 10 11 .. 250 251 +
Figure 5.1 – Profile Distribution by Enterprise Size
The analysis of profile segmentation by age (Figure 5.2) shows that the average European ICT professional is 42 years old. The results also show that more than 50% of the respondents are in the 31-50 age group across all profiles. However, the numbers vary greatly depending of the job profile. For instance, senior profiles (with more than 25% being older than 50 years) include Chief Information Officer, Enterprise Architect, ICT Consultant, ICT Trainer, Business Information Manager, ICT Operations Manager, Business Analyst, and Account Manager. In contrast, Network Specialist, Systems Analyst, Developer, Test Specialist, and Database Administrator can be considered as more junior profiles (with more than 25% being younger than 30 years).

Deliverable 4.3: Present national and European-level uptake of e-CF powered tool DIGITALJOBS
54
16%
1%
0%
3%
8%
29%
10%
15%
27%
23%
26%
6%
9%
12%
11%
26%
24%
29%
11%
12%
7%
3%0%
61%
53%
69%
69%
64%
51%
54%
67%
60%
58%
58%
68%
58%
70%
55%
59%
63%
53%
69%
67%
75%
73%87%
23%
46%
31%
28%
28%
20%
36%
18%
13%
19%
16%
26%
33%
18%
34%
15%
13%
17%
20%
20%
18%
24%13%
Average
Chief Information Officer BM1
Business Information Manager BM2
ICT Operations Manager BM3
Business Analyst DS1
Systems Analyst DS2
Enterprise Architect DS3
Systems Architect DS4
Developer DV1
Digital Media Specialist DV2
Test Specialist DV3
Account Manager SP1
ICT Trainer SP2
ICT Security Specialist SP3
ICT Consultant SP4
Database Administrator SR1
Systems Administrator SR2
Network Specialist SR3
Technical Specialist SR4
Quality Assurance Manager TM1
ICT Security Manager TM2
Project Manager TM3
Service Manager TM4
<30yr 31..50 >50yr
Figure 5.2 – Profile Distribution by Age
The segmentation of the profiles by gender (Figure 5.3) provides evidence that female representation is overall extremely limited. There are only two profiles with more than 20% females in this sample: Project Manager and ICT Trainer. In addition, the proportion of female ICT professionals is lower than 10% in about one third of the profiles: Database Administrator, Test Specialist, ICT Consultant, Enterprise Architect, Network Specialist, Systems Architect, and Service Manager.

Deliverable 4.3: Present national and European-level uptake of e-CF powered tool DIGITALJOBS
55
15%
12%
15%
11%
15%
10%
7%
5%
19%
14%
10%
10%
25%
18%
7%
10%
13%
6%
12%
18%
10%
25%6%
85%
88%
85%
89%
85%
90%
93%
95%
81%
86%
90%
90%
75%
82%
93%
90%
87%
94%
88%
82%
90%
75%94%
Average
Chief Information Officer BM1
Business Information Manager BM2
ICT Operations Manager BM3
Business Analyst DS1
Systems Analyst DS2
Enterprise Architect DS3
Systems Architect DS4
Developer DV1
Digital Media Specialist DV2
Test Specialist DV3
Account Manager SP1
ICT Trainer SP2
ICT Security Specialist SP3
ICT Consultant SP4
Database Administrator SR1
Systems Administrator SR2
Network Specialist SR3
Technical Specialist SR4
Quality Assurance Manager TM1
ICT Security Manager TM2
Project Manager TM3
Service Manager TM4
Female Male
Figure 5.3 – Profile Distribution by Gender
86%
94%
100%
89%
92%
86%
82%
85%
78%
90%
85%
94%
91%
93%
88%
82%
79%
79%
80%
93%
88%
90%95%
14%
6%
0%
11%
8%
14%
18%
15%
22%
10%
15%
6%
9%
7%
12%
18%
21%
21%
20%
7%
12%
10%5%
Average
Chief Information Officer BM1
Business Information Manager BM2
ICT Operations Manager BM3
Business Analyst DS1
Systems Analyst DS2
Enterprise Architect DS3
Systems Architect DS4
Developer DV1
Digital Media Specialist DV2
Test Specialist DV3
Account Manager SP1
ICT Trainer SP2
ICT Security Specialist SP3
ICT Consultant SP4
Database Administrator SR1
Systems Administrator SR2
Network Specialist SR3
Technical Specialist SR4
Quality Assurance Manager TM1
ICT Security Manager TM2
Project Manager TM3
Service Manager TM4
University degree Diploma or less
Figure 5.4 – Profile Distribution by Education Level
The segmentation of profiles by educational level (Figure 5.4) shows a very high level of attainment of university degrees. For all the profiles the rate university graduates is over 75%, ranging from 78% for the Developer profile to 100% for the Business Information Manager. In respect to the profile distribution by IT-focused education, there is some evidence to suggest a lack of of IT-focused education that needs to be

Deliverable 4.3: Present national and European-level uptake of e-CF powered tool DIGITALJOBS
56
addressed. This is particularly the case for the following profiles for which 40% of respondents don’t have an IT background: ICT Security Manager, ICT Trainer, Enterprise Architect, Business Information Manager, Project Manager, Chief Information Officer, and Account Manager.
66%
48%
52%
68%
61%
65%
56%
79%
73%
84%
70%
42%
58%
62%
74%
81%
71%
75%
67%
75%
58%
50%76%
34%
52%
48%
32%
39%
35%
44%
21%
27%
16%
30%
58%
42%
38%
26%
19%
29%
25%
33%
25%
42%
50%24%
Average
Chief Information Officer BM1
Business Information Manager BM2
ICT Operations Manager BM3
Business Analyst DS1
Systems Analyst DS2
Enterprise Architect DS3
Systems Architect DS4
Developer DV1
Digital Media Specialist DV2
Test Specialist DV3
Account Manager SP1
ICT Trainer SP2
ICT Security Specialist SP3
ICT Consultant SP4
Database Administrator SR1
Systems Administrator SR2
Network Specialist SR3
Technical Specialist SR4
Quality Assurance Manager TM1
ICT Security Manager TM2
Project Manager TM3
Service Manager TM4
Main focus Secondary subjet
Figure 5.5 – Profile Distribution by IT Education Background
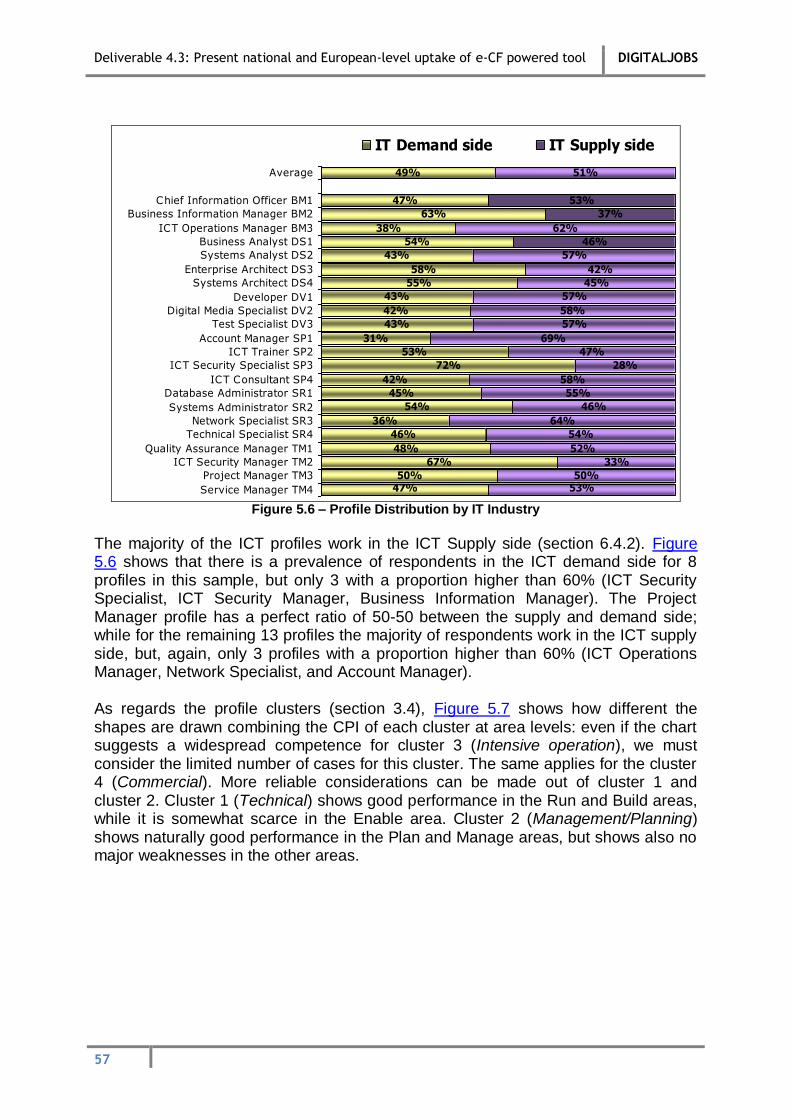
Deliverable 4.3: Present national and European-level uptake of e-CF powered tool DIGITALJOBS
57
49%
47%
63%
38%
54%
43%
58%
55%
43%
42%
43%
31%
53%
72%
42%
45%
54%
36%
46%
48%
67%
50%47%
51%
53%
37%
62%
46%
57%
42%
45%
57%
58%
57%
69%
47%
28%
58%
55%
46%
64%
54%
52%
33%
50%53%
Average
Chief Information Officer BM1
Business Information Manager BM2
ICT Operations Manager BM3
Business Analyst DS1
Systems Analyst DS2
Enterprise Architect DS3
Systems Architect DS4
Developer DV1
Digital Media Specialist DV2
Test Specialist DV3
Account Manager SP1
ICT Trainer SP2
ICT Security Specialist SP3
ICT Consultant SP4
Database Administrator SR1
Systems Administrator SR2
Network Specialist SR3
Technical Specialist SR4
Quality Assurance Manager TM1
ICT Security Manager TM2
Project Manager TM3
Service Manager TM4
IT Demand side IT Supply side
Figure 5.6 – Profile Distribution by IT Industry
The majority of the ICT profiles work in the ICT Supply side (section 6.4.2). Figure 5.6 shows that there is a prevalence of respondents in the ICT demand side for 8 profiles in this sample, but only 3 with a proportion higher than 60% (ICT Security Specialist, ICT Security Manager, Business Information Manager). The Project Manager profile has a perfect ratio of 50-50 between the supply and demand side; while for the remaining 13 profiles the majority of respondents work in the ICT supply side, but, again, only 3 profiles with a proportion higher than 60% (ICT Operations Manager, Network Specialist, and Account Manager). As regards the profile clusters (section 3.4), Figure 5.7 shows how different the shapes are drawn combining the CPI of each cluster at area levels: even if the chart suggests a widespread competence for cluster 3 (Intensive operation), we must consider the limited number of cases for this cluster. The same applies for the cluster 4 (Commercial). More reliable considerations can be made out of cluster 1 and cluster 2. Cluster 1 (Technical) shows good performance in the Run and Build areas, while it is somewhat scarce in the Enable area. Cluster 2 (Management/Planning) shows naturally good performance in the Plan and Manage areas, but shows also no major weaknesses in the other areas.

Deliverable 4.3: Present national and European-level uptake of e-CF powered tool DIGITALJOBS
58
Plan
Build
RunEnable
Manage
Cluster 1: TechnicalCluster 2: Management/PlanningCluster 3: Intensive operationalCluster 4: Commercial
Figure 5.7 – Competence Proficiency Index by Area
The analysis of the CPIs per organisation size shows that some skills are more prevalent in micro and small organisations compared to medium and large organisations (Figure 5.8). The main differences, compared to the European average, are found for the following profiles: Channel Management, Architecture Design, Business Plan Development, Forecast Development (+3% each), IS & Business Strategy Alignment, Sales Proposal Development (+4% each), Sales Management, and Technology Watching (+6% each). On the other side, major gaps for micro and mall organisations appear in Risk Management (-2%), Documentation Production, and Process Improvement (-3%). No significant differences were found for medium and large organisations.

Deliverable 4.3: Present national and European-level uptake of e-CF powered tool DIGITALJOBS
59
Micro & Small
Organisations
Medium & Large
Organisations
IS & Business Strategy Alignment A01Service Level Management A02Business Plan Development A03
Product or Project Planning A04Architecture Design A05
Application Design A06
Technology Watching A07Sustainable development A08
Design & Development B01Systems Integration B02
Testing B03
Solution Deployment B04Documentation Production B05
User Support C01Change Support C02Service Delivery C03
Problem Management C04
Information Security Strategy Development D01
ICT Quality Strategy Development D02Education & Training Provision D03
Purchasing D04
Sales Proposal Development D05Channel Management D06
Sales Management D07
Contract Management D08Personnel Development D09
Information & Knowledge Management D10
Forecast Development E01Project & Portfolio Management E02
Risk Management E03Relationship Management E04
Process Improvement E05ICT Quality Management E06
Business Change Management E07Information Security Management E08
IT Governance E09
CPI Difference vs
whole Europe
MA
NA
GE
PLA
NB
UILD
RU
NE
NA
BLE
0%1%
0%1%
0%0%
-1%0%
-1%0%0%
-1%1%
1%1%1%
0%
0%1%1%
0%0%
-1%-1%
1%1%
1%
-1%1%1%
1%2%
0%1%
0%1%
4%1%
3%1%
3%1%
6%1%
2%1%
-1%2%
-3%
1%0%
-1%2%
2%1%
0%2%
4%3%
6%2%
-1%0%
3%0%
-2%1%
-3%0%0%
1%1%
Figure 5.8 – Competence Proficiency Index: Differences by Enterprise Size
10.2 Conclusions
CEPIS and its Member Societies note the value of continuing this research to ensure an even wider and more representative sample for future statistical analysis. The current research offers some useful results, including:
Profile popularity: The three most popular proximity profiles were
Technical Specialist (410 respondents), ICT Trainer (247), and Systems Administrator (170). The three least popular proximity profiles were ICT Security Specialist (15), Service Manager (13), and ICT Consultant (13).
Low response from young ICT professionals: With only 16% of
respondents under the age of 30, there is a clear need to further promote the ICT profession among young people to ensure adequate supply of upcoming ICT professionals.
Female representation in the ICT sector is still very low: There is still a
high degree of imbalance in the representation of women in ICT. The research results noted the highest level of gender equity for the ICT
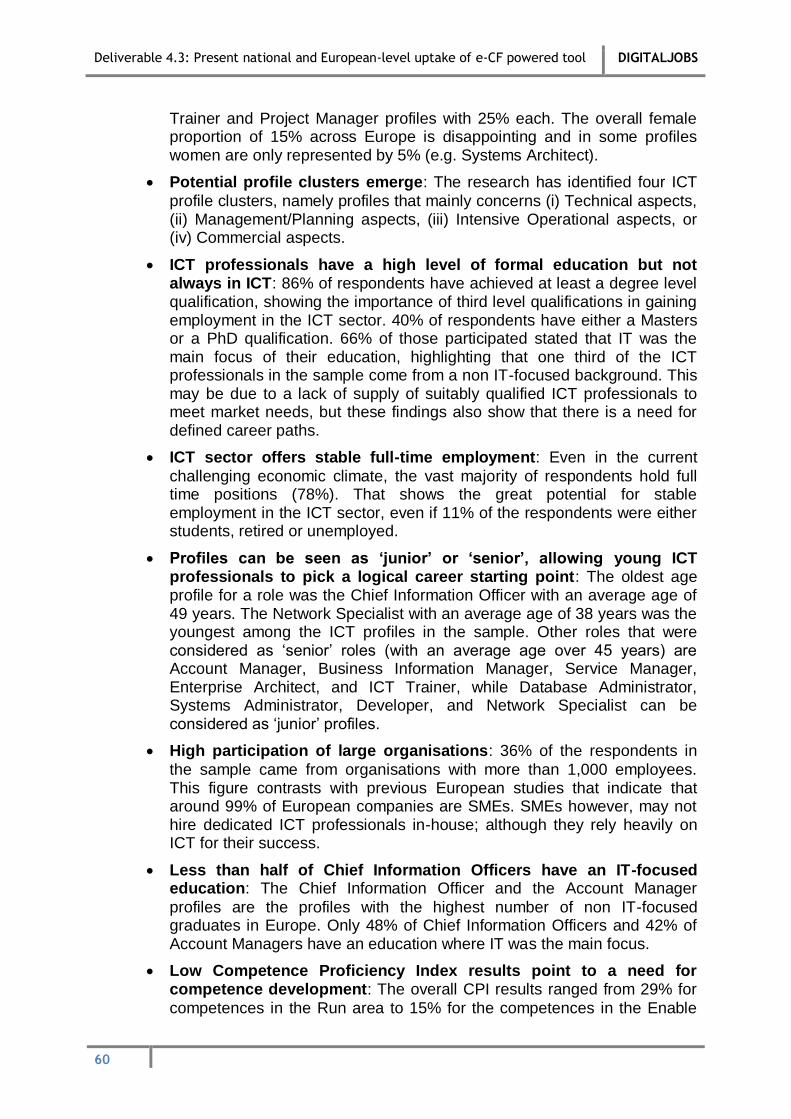
Deliverable 4.3: Present national and European-level uptake of e-CF powered tool DIGITALJOBS
60
Trainer and Project Manager profiles with 25% each. The overall female proportion of 15% across Europe is disappointing and in some profiles women are only represented by 5% (e.g. Systems Architect).
Potential profile clusters emerge: The research has identified four ICT
profile clusters, namely profiles that mainly concerns (i) Technical aspects, (ii) Management/Planning aspects, (iii) Intensive Operational aspects, or (iv) Commercial aspects.
ICT professionals have a high level of formal education but not always in ICT: 86% of respondents have achieved at least a degree level qualification, showing the importance of third level qualifications in gaining employment in the ICT sector. 40% of respondents have either a Masters or a PhD qualification. 66% of those participated stated that IT was the main focus of their education, highlighting that one third of the ICT professionals in the sample come from a non IT-focused background. This may be due to a lack of supply of suitably qualified ICT professionals to meet market needs, but these findings also show that there is a need for defined career paths.
ICT sector offers stable full-time employment: Even in the current
challenging economic climate, the vast majority of respondents hold full time positions (78%). That shows the great potential for stable employment in the ICT sector, even if 11% of the respondents were either students, retired or unemployed.
Profiles can be seen as ‘junior’ or ‘senior’, allowing young ICT professionals to pick a logical career starting point: The oldest age profile for a role was the Chief Information Officer with an average age of 49 years. The Network Specialist with an average age of 38 years was the youngest among the ICT profiles in the sample. Other roles that were considered as ‘senior’ roles (with an average age over 45 years) are Account Manager, Business Information Manager, Service Manager, Enterprise Architect, and ICT Trainer, while Database Administrator, Systems Administrator, Developer, and Network Specialist can be considered as ‘junior’ profiles.
High participation of large organisations: 36% of the respondents in
the sample came from organisations with more than 1,000 employees. This figure contrasts with previous European studies that indicate that around 99% of European companies are SMEs. SMEs however, may not hire dedicated ICT professionals in-house; although they rely heavily on ICT for their success.
Less than half of Chief Information Officers have an IT-focused education: The Chief Information Officer and the Account Manager
profiles are the profiles with the highest number of non IT-focused graduates in Europe. Only 48% of Chief Information Officers and 42% of Account Managers have an education where IT was the main focus.
Low Competence Proficiency Index results point to a need for competence development: The overall CPI results ranged from 29% for
competences in the Run area to 15% for the competences in the Enable

Deliverable 4.3: Present national and European-level uptake of e-CF powered tool DIGITALJOBS
61
area. This lower score can be explained by weaker results in four e-competences that related to the marketing and sales dimension of this competence area, namely Purchasing, Contract Management, Sales Management, Channel Management. An in-depth analysis of the Competence Proficiency Indexes compared to each profile requirement is fundamental in order to design detailed training paths to cover the competence gaps for each Proximity Profile of each respondent.
The response rate and the findings provide useful indicators of ICT professional competences and e-competence gaps in the market, they represent the first pan-European application of the European e-Competence Framework and demonstrate its utility. The findings also give rise to a number of recommendations that can lay the ground for a roadmap to boost the supply of ICT professionals in Europe.
10.3 Recommendations
Based on the findings, the following key recommendations can be put forward:
Promote the ICT profession among young people: Further initiatives
are necessary to promote the ICT profession among young people to ensure that enterprises will have the talent necessary to innovate and compete. To increase the supply of new ICT professionals, coordinated action is needed between education providers, informatics associations and industry. Moreover, support is required from governments and the European Commission. Awareness raising programmes such as e-Skills for Jobs 2014 are a good first step and should be repeated annually with a strong focus on attracting the younger generation. The Grand Coalition for Digital Jobs14 is an example of stakeholders working together towards this aim, but should be further developed to extend its reach.
Redress the gender imbalance in all countries: Urgent measures are
needed to redress the gender imbalance in all countries and increase the participation of women in ICT careers. The continuation and expansion of existing initiatives that focus on role models and mentoring programmes should be replicated and scaled up. Member States should provide fiscal incentives for companies that adopt gender equity as part of their organisational culture, hiring practices and career advancement programmes.
Continuous professional development must play an important role:
The relatively low Competence Proficiency Index returns suggest that continuous professional development can be of great value for ICT professionals. While most ICT professionals are highly educated (86% of respondents have at least a degree qualification), 34% do not have an IT-focused education. These professionals could benefit from supplementing their knowledge and e-competences through the completion of ICT
14 For more information, see ec.europa.eu/digital-agenda/en/grand-coalition-digital-jobs-0

Deliverable 4.3: Present national and European-level uptake of e-CF powered tool DIGITALJOBS
62
certifications. For example, more than half of Chief Information Officers in the sample lack education that is oriented to ICT. A related project on developing an ICT professionalism framework and training programme for Chief Information Officers is one example of a good initiative in this area15.
Apply e-CF as a pan-European tool to categorise competences and identify competence gaps: By using the e-CF as the base for this
assessment, it has become clear that this is a practical tool with value in categorising and defining ICT competences. The work of the CEN Workshop on ICT skills is commended in this respect and we recommend that the e-CF is continually developed and disseminated across Europe. The e-CF is a key tool to facilitate the identification and analysis of e-competences.
Evaluation of these results by the project team of the CEN Workshop on ICT Skills, and in particular the e-Jobs Profiles project since the results
on profile relevance, utility and popularity may be of use in determining future upgrades to the e-Job Profiles.
Finally, CEPIS will endeavour to continue to promote the e-CF assessment tool used in this research to ensure wider participation across Europe for future analysis. Please see www.cepis.org/ecompetencebenchmark for updates.
15 The project is ongoing and carried out by CEPIS and IVI on behalf of the European Commission, Enterprise and Industry
Directorate-General. http://cepis.org/index.jsp?p=827&n=940

Deliverable 4.3: Present national and European-level uptake of e-CF powered tool DIGITALJOBS
63
11 Annex
11.1 Competence Proficiency Index
11.1.1 Competence Proficiency Index for elementary competences
23%
20%
18%
32%
31%
29%
31%
9%
IS & Business Strategy Alignment A01
Service Level Management A02
Business Plan Development A03
Product or Project Planning A04
Design Architecture A05
Application Design A06
Technology Watching A07
Sustainable development A08
Figure 6.1 – Competence Proficiency Index – Plan
23%
24%
22%
25%
34%
Design &
Development B01
Systems Integration
B02
Testing B03
Solution Deployment
B04
Documentation
Production B05
Figure 6.2 – Competence Proficiency Index – Build

Deliverable 4.3: Present national and European-level uptake of e-CF powered tool DIGITALJOBS
64
35%
32%
21%
29%
User Support C01
Change Support C02
Service Delivery C03
Problem
Management C04
Figure 6.3 – Competence Proficiency Index – Run
16%
18%
21%
15%
16%
4%
5%
13%
22%
20%
Information Security Strategy
Development D01
ICT Quality Strategy Development D02
Education & Training Provision D03
Purchasing D04
Sales Proposal Development D05
Channel Management D06
Sales Management D07
Contract Management D08
Personnel Development D09
Information & Knowledge Management
D10
Figure 6.4 – Competence Proficiency Index – Enable

Deliverable 4.3: Present national and European-level uptake of e-CF powered tool DIGITALJOBS
65
11%
20%
16%
24%
23%
13%
18%
14%
18%
Forecast
Development E01
Project & Portfolio
Management E02
Risk Management
E03
Relationship
Management E04
Process
Improvement E05
ICT Quality
Management E06
Business Change
Management E07
Information Security
Management E08
IT Governance E09
Figure 6.5 – Competence Proficiency Index – Manage
11.1.2 Knowledge indexes by IT profile
24%
44%
53%
43%
46%
34%
46%
35%
20%
25%
18%
25%
23%
39%
36%
25%
15%
21%
23%
25%
36%
36%
44%
Plan area - average
Chief Information Officer BM1
Business Information Manager BM2
ICT Operations Manager BM3
Business Analyst DS1
Systems Analyst DS2
Enterprise Architect DS3
Systems Architect DS4
Developer DV1
Digital Media Specialist DV2
Test Specialist DV3
Account Manager SP1
ICT Trainer SP2
ICT Security Specialist SP3
ICT Consultant SP4
Database Administrator SR1
Systems Administrator SR2
Network Specialist SR3
Technical Specialist SR4
Quality Assurance Manager TM1
ICT Security Manager TM2
Project Manager TM3
Service Manager TM4
Figure 6.6 – Competence Proficiency Index – Plan

Deliverable 4.3: Present national and European-level uptake of e-CF powered tool DIGITALJOBS
66
25%
14%
28%
30%
29%
44%
16%
42%
50%
55%
50%
7%
17%
44%
23%
41%
23%
45%
29%
21%
24%
22%
37%
Build area - average
Chief Information Officer BM1
Business Information Manager BM2
ICT Operations Manager BM3
Business Analyst DS1
Systems Analyst DS2
Enterprise Architect DS3
Systems Architect DS4
Developer DV1
Digital Media Specialist DV2
Test Specialist DV3
Account Manager SP1
ICT Trainer SP2
ICT Security Specialist SP3
ICT Consultant SP4
Database Administrator SR1
Systems Administrator SR2
Network Specialist SR3
Technical Specialist SR4
Quality Assurance Manager TM1
ICT Security Manager TM2
Project Manager TM3
Service Manager TM4
Figure 6.7 – Competence Proficiency Index – Build
29%
20%
33%
38%
32%
34%
19%
23%
35%
27%
29%
14%
22%
68%
19%
34%
36%
41%
55%
27%
33%
26%
60%
Run area - average
Chief Information Officer BM1
Business Information Manager BM2
ICT Operations Manager BM3
Business Analyst DS1
Systems Analyst DS2
Enterprise Architect DS3
Systems Architect DS4
Developer DV1
Digital Media Specialist DV2
Test Specialist DV3
Account Manager SP1
ICT Trainer SP2
ICT Security Specialist SP3
ICT Consultant SP4
Database Administrator SR1
Systems Administrator SR2
Network Specialist SR3
Technical Specialist SR4
Quality Assurance Manager TM1
ICT Security Manager TM2
Project Manager TM3
Service Manager TM4
Figure 6.8 – Competence Proficiency Index – Run

Deliverable 4.3: Present national and European-level uptake of e-CF powered tool DIGITALJOBS
67
15%
27%
33%
36%
27%
18%
18%
13%
9%
12%
5%
31%
22%
36%
20%
18%
9%
12%
15%
22%
29%
23%
37%
Enable area - average
Chief Information Officer BM1
Business Information Manager BM2
ICT Operations Manager BM3
Business Analyst DS1
Systems Analyst DS2
Enterprise Architect DS3
Systems Architect DS4
Developer DV1
Digital Media Specialist DV2
Test Specialist DV3
Account Manager SP1
ICT Trainer SP2
ICT Security Specialist SP3
ICT Consultant SP4
Database Administrator SR1
Systems Administrator SR2
Network Specialist SR3
Technical Specialist SR4
Quality Assurance Manager TM1
ICT Security Manager TM2
Project Manager TM3
Service Manager TM4
Figure 6.9 – Competence Proficiency Index – Enable
18%
42%
46%
53%
37%
27%
25%
12%
10%
12%
7%
22%
17%
41%
31%
18%
11%
16%
18%
29%
40%
38%
37%
Manage area - average
Chief Information Officer BM1
Business Information Manager BM2
ICT Operations Manager BM3
Business Analyst DS1
Systems Analyst DS2
Enterprise Architect DS3
Systems Architect DS4
Developer DV1
Digital Media Specialist DV2
Test Specialist DV3
Account Manager SP1
ICT Trainer SP2
ICT Security Specialist SP3
ICT Consultant SP4
Database Administrator SR1
Systems Administrator SR2
Network Specialist SR3
Technical Specialist SR4
Quality Assurance Manager TM1
ICT Security Manager TM2
Project Manager TM3
Service Manager TM4
Figure 6.10 – Competence Proficiency Index – Manage

Deliverable 4.3: Present national and European-level uptake of e-CF powered tool DIGITALJOBS
68
11.2 Proximity Profiles – Detail
11.2.1 Business Analyst
Gender IT EducationEnterprise size
Age Industry sector Educational level
Europe
Business Analyst
Base: 117 respondents
Professional status
79,3%
0,6%
11,7%
8,4%
Full time
employee
Part time
employee
Self-employed
Student/
Unemployed/
Retired
7,9% 10,7%
21,3%
60,1%
Secondary
School Diploma
or less
Graduate
/Postgraduate
Diploma
Bachelors
Degree
Masters Degree
or Doctorate
60,9%
24,5%
14,6%
IT was the
main focus of
my education
IT was a side
subject
IT was not
significant in my
curriculum
12,3% 13,1%
18,7%16,8%
39,2%
1 - 10 11 - 50 51 - 250 251 - 1000 > 1000
54,2%
45,8%
Mainly on IT
demand side
Mainly on IT
supply side
7,8%
27,5%
36,9%
27,7%
..-30 yr 31-40 yr 41-50 yr 51-.. yr
Mean: 44
15,0%
85,0%
FemaleMale
11.2.2 Developer
Europe
Developer
Base: 145 respondents
Professional status
Gender IT EducationEnterprise size
Age Industry sector Educational level
69,3%
1,6%
2,8%
26,2%
Full time
employee
Part time
employee
Self-employed
Student/
Unemployed/
Retired
22,4%
9,4%
29,6%
38,6%
Secondary
School Diploma
or less
Graduate
/Postgraduate
Diploma
Bachelors
Degree
Masters Degree
or Doctorate
72,7%
22,0%
5,3%
IT was the
main focus of
my education
IT was a side
subject
IT was not
significant in my
curriculum
10,5%14,8%
17,5%
7,5%
49,7%
1 - 10 11 - 50 51 - 250 251 - 1000 > 1000
42,8%
57,2%
Mainly on IT
demand side
Mainly on IT
supply side
27,2%
31,8%
27,9%
13,1%
..-30 yr 31-40 yr 41-50 yr 51-.. yr
Mean: 37,9
19,0%
81,0%
FemaleMale

Deliverable 4.3: Present national and European-level uptake of e-CF powered tool DIGITALJOBS
69
11.2.3 Digital Media Specialist
Europe
Digital Media Specialist
Base: 107 respondents
Professional status
Gender IT EducationEnterprise size
Age Industry sector Educational level
80,9%
0,6%
3,0%
15,4%
Full time
employee
Part time
employee
Self-employed
Student/
Unemployed/
Retired
10,2% 12,1%
33,0%
44,7%
Secondary
School Diploma
or less
Graduate
/Postgraduate
Diploma
Bachelors
Degree
Masters Degree
or Doctorate
84,2%
7,5%
8,3%
IT was the
main focus of
my education
IT was a side
subject
IT was not
significant in my
curriculum
3,9%
17,4% 18,0%15,2%
45,5%
1 - 10 11 - 50 51 - 250 251 - 1000 > 1000
42,1%
57,9%
Mainly on IT
demand side
Mainly on IT
supply side
22,7%
31,7%
26,5%
19,2%
..-30 yr 31-40 yr 41-50 yr 51-.. yr
Mean: 39,8
14,2%
85,8%
FemaleMale
11.2.4 ICT Trainer
Gender IT EducationEnterprise size
Age Industry sector Educational level
Europe
ICT Trainer
Base: 264 respondents
Professional status
75,4%
5,6%
8,4%
10,7%
Full time
employee
Part time
employee
Self-employed
Student/
Unemployed/
Retired
9,4%14,6%
22,7%
53,3%
Secondary
School Diploma
or less
Graduate
/Postgraduate
Diploma
Bachelors
Degree
Masters Degree
or Doctorate
58,3%
24,2%
17,5%
IT was the
main focus of
my education
IT was a side
subject
IT was not
significant in my
curriculum
16,5%
10,3%
22,8%
17,0%
33,3%
1 - 10 11 - 50 51 - 250 251 - 1000 > 1000
52,7%
47,3%
Mainly on IT
demand side
Mainly on IT
supply side
8,7%
25,9%
32,4% 33,1%
..-30 yr 31-40 yr 41-50 yr 51-.. yr
Mean: 45
24,8%
75,2%
FemaleMale
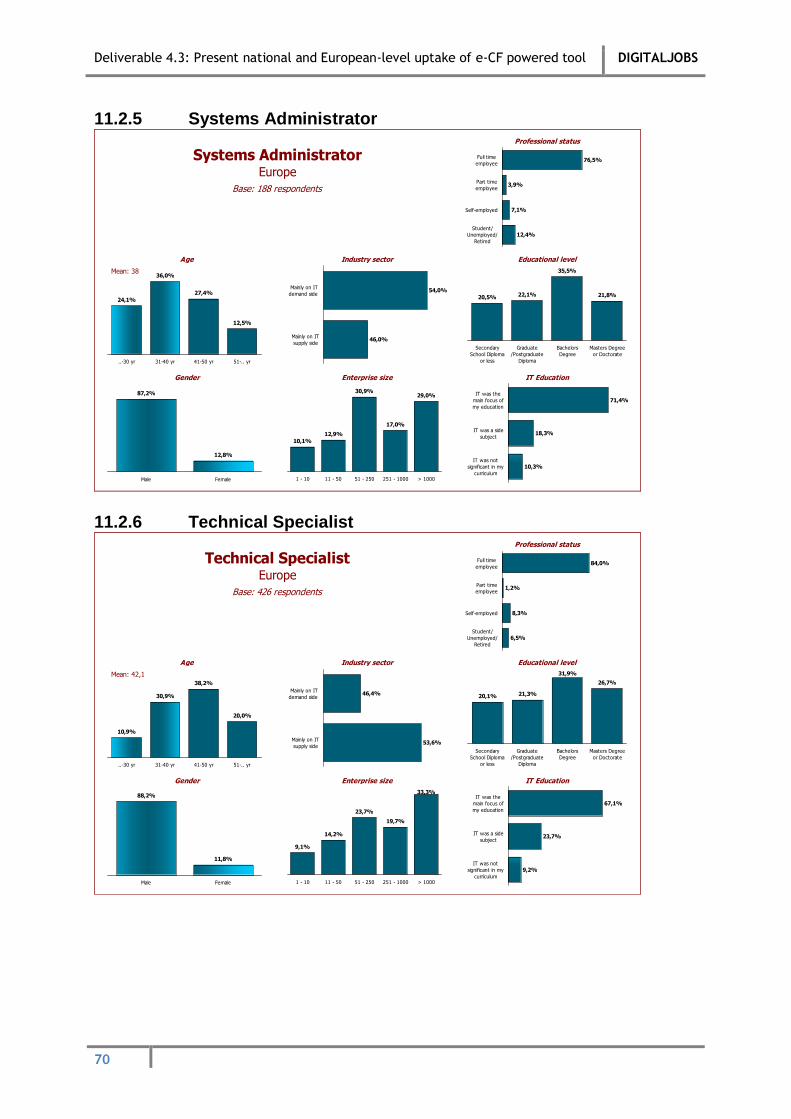
Deliverable 4.3: Present national and European-level uptake of e-CF powered tool DIGITALJOBS
70
11.2.5 Systems Administrator
Europe
Systems Administrator
Base: 188 respondents
Professional status
Gender IT EducationEnterprise size
Age Industry sector Educational level
76,5%
3,9%
7,1%
12,4%
Full time
employee
Part time
employee
Self-employed
Student/
Unemployed/
Retired
20,5% 22,1%
35,5%
21,8%
Secondary
School Diploma
or less
Graduate
/Postgraduate
Diploma
Bachelors
Degree
Masters Degree
or Doctorate
71,4%
18,3%
10,3%
IT was the
main focus of
my education
IT was a side
subject
IT was not
significant in my
curriculum
10,1%
12,9%
30,9%
17,0%
29,0%
1 - 10 11 - 50 51 - 250 251 - 1000 > 1000
54,0%
46,0%
Mainly on IT
demand side
Mainly on IT
supply side
24,1%
36,0%
27,4%
12,5%
..-30 yr 31-40 yr 41-50 yr 51-.. yr
Mean: 38
12,8%
87,2%
FemaleMale
11.2.6 Technical Specialist
Europe
Technical Specialist
Base: 426 respondents
Professional status
Gender IT EducationEnterprise size
Age Industry sector Educational level
84,0%
1,2%
8,3%
6,5%
Full time
employee
Part time
employee
Self-employed
Student/
Unemployed/
Retired
20,1% 21,3%
31,9%
26,7%
Secondary
School Diploma
or less
Graduate
/Postgraduate
Diploma
Bachelors
Degree
Masters Degree
or Doctorate
67,1%
23,7%
9,2%
IT was the
main focus of
my education
IT was a side
subject
IT was not
significant in my
curriculum
9,1%
14,2%
23,7%
19,7%
33,3%
1 - 10 11 - 50 51 - 250 251 - 1000 > 1000
46,4%
53,6%
Mainly on IT
demand side
Mainly on IT
supply side
10,9%
30,9%
38,2%
20,0%
..-30 yr 31-40 yr 41-50 yr 51-.. yr
Mean: 42,1
11,8%
88,2%
FemaleMale

Deliverable 4.3: Present national and European-level uptake of e-CF powered tool DIGITALJOBS
71
11.2.7 Project Manager
Gender IT EducationEnterprise size
Age Industry sector Educational level
Europe
Project Manager
Base: 141 respondents
Professional status
82,5%
0,0%
12,2%
5,3%
Full time
employee
Part time
employee
Self-employed
Student/
Unemployed/
Retired
10,2% 10,6%
25,2%
54,0%
Secondary
School Diploma
or less
Graduate
/Postgraduate
Diploma
Bachelors
Degree
Masters Degree
or Doctorate
49,8%
31,6%
18,7%
IT was the
main focus of
my education
IT was a side
subject
IT was not
significant in my
curriculum
9,1% 9,0%
16,8% 17,1%
48,1%
1 - 10 11 - 50 51 - 250 251 - 1000 > 1000
49,9%
50,1%
Mainly on IT
demand side
Mainly on IT
supply side3,1%
26,1%
46,9%
23,8%
..-30 yr 31-40 yr 41-50 yr 51-.. yr
Mean: 44,3
25,3%
74,7%
FemaleMale
11.3 Profile Segmentation
11.3.1 Profile Distribution by Age
16%
1%
0%
3%
8%
29%
10%
15%
27%
23%
26%
6%
9%
12%
11%
26%
24%
29%
11%
12%
7%
3%0%
61%
53%
69%
69%
64%
51%
54%
67%
60%
58%
58%
68%
58%
70%
55%
59%
63%
53%
69%
67%
75%
73%87%
23%
46%
31%
28%
28%
20%
36%
18%
13%
19%
16%
26%
33%
18%
34%
15%
13%
17%
20%
20%
18%
24%13%
Average
Chief Information Officer BM1
Business Information Manager BM2
ICT Operations Manager BM3
Business Analyst DS1
Systems Analyst DS2
Enterprise Architect DS3
Systems Architect DS4
Developer DV1
Digital Media Specialist DV2
Test Specialist DV3
Account Manager SP1
ICT Trainer SP2
ICT Security Specialist SP3
ICT Consultant SP4
Database Administrator SR1
Systems Administrator SR2
Network Specialist SR3
Technical Specialist SR4
Quality Assurance Manager TM1
ICT Security Manager TM2
Project Manager TM3
Service Manager TM4
<30yr 31..50 >50yr
(Note: the profiles to be analyzed in detail are only those satisfying the condition stated in chapter 4)

Deliverable 4.3: Present national and European-level uptake of e-CF powered tool DIGITALJOBS
72
11.3.2 Profile Distribution by Enterprise Size
11%
12%
10%
14%
12%
14%
23%
19%
11%
4%
18%
32%
16%
15%
44%
12%
10%
20%
9%
4%
18%
9%8%
35%
26%
27%
53%
32%
31%
19%
29%
32%
35%
43%
33%
33%
21%
28%
34%
44%
34%
38%
28%
40%
26%32%
54%
62%
63%
34%
56%
55%
58%
52%
57%
61%
39%
35%
50%
64%
28%
54%
46%
46%
53%
68%
42%
65%59%
Average
Chief Information Officer BM1
Business Information Manager BM2
ICT Operations Manager BM3
Business Analyst DS1
Systems Analyst DS2
Enterprise Architect DS3
Systems Architect DS4
Developer DV1
Digital Media Specialist DV2
Test Specialist DV3
Account Manager SP1
ICT Trainer SP2
ICT Security Specialist SP3
ICT Consultant SP4
Database Administrator SR1
Systems Administrator SR2
Network Specialist SR3
Technical Specialist SR4
Quality Assurance Manager TM1
ICT Security Manager TM2
Project Manager TM3
Service Manager TM4
1 .. 10 11 .. 250 251 +
(Note: the profiles to be analyzed in detail are only those satisfying the condition stated in chapter 4)
11.3.3 Profile Distribution by Gender
15%
12%
15%
11%
15%
10%
7%
5%
19%
14%
10%
10%
25%
18%
7%
10%
13%
6%
12%
18%
10%
25%0%
85%
88%
85%
89%
85%
90%
93%
95%
81%
86%
90%
90%
75%
82%
93%
90%
87%
94%
88%
82%
90%
75%3%
Average
Chief Information Officer BM1
Business Information Manager BM2
ICT Operations Manager BM3
Business Analyst DS1
Systems Analyst DS2
Enterprise Architect DS3
Systems Architect DS4
Developer DV1
Digital Media Specialist DV2
Test Specialist DV3
Account Manager SP1
ICT Trainer SP2
ICT Security Specialist SP3
ICT Consultant SP4
Database Administrator SR1
Systems Administrator SR2
Network Specialist SR3
Technical Specialist SR4
Quality Assurance Manager TM1
ICT Security Manager TM2
Project Manager TM3
Service Manager TM4
Female Male
(Note: the profiles to be analyzed in detail are only those satisfying the condition stated in chapter 4)

Deliverable 4.3: Present national and European-level uptake of e-CF powered tool DIGITALJOBS
73
11.3.4 Profile Distribution by Educational Level
86%
94%
100%
89%
92%
86%
82%
85%
78%
90%
85%
94%
91%
93%
88%
82%
79%
79%
80%
93%
88%
90%3%
14%
6%
0%
11%
8%
14%
18%
15%
22%
10%
15%
6%
9%
7%
12%
18%
21%
21%
20%
7%
12%
10%0%
Average
Chief Information Officer BM1
Business Information Manager BM2
ICT Operations Manager BM3
Business Analyst DS1
Systems Analyst DS2
Enterprise Architect DS3
Systems Architect DS4
Developer DV1
Digital Media Specialist DV2
Test Specialist DV3
Account Manager SP1
ICT Trainer SP2
ICT Security Specialist SP3
ICT Consultant SP4
Database Administrator SR1
Systems Administrator SR2
Network Specialist SR3
Technical Specialist SR4
Quality Assurance Manager TM1
ICT Security Manager TM2
Project Manager TM3
Service Manager TM4
University degree Diploma or less
(Note: the profiles to be analyzed in detail are only those satisfying the condition stated in chapter 4)
11.3.5 Profile Distribution by IT Education
66%
48%
52%
68%
61%
65%
56%
79%
73%
84%
70%
42%
58%
62%
74%
81%
71%
75%
67%
75%
58%
50%2%
34%
52%
48%
32%
39%
35%
44%
21%
27%
16%
30%
58%
42%
38%
26%
19%
29%
25%
33%
25%
42%
50%1%
Average
Chief Information Officer BM1
Business Information Manager BM2
ICT Operations Manager BM3
Business Analyst DS1
Systems Analyst DS2
Enterprise Architect DS3
Systems Architect DS4
Developer DV1
Digital Media Specialist DV2
Test Specialist DV3
Account Manager SP1
ICT Trainer SP2
ICT Security Specialist SP3
ICT Consultant SP4
Database Administrator SR1
Systems Administrator SR2
Network Specialist SR3
Technical Specialist SR4
Quality Assurance Manager TM1
ICT Security Manager TM2
Project Manager TM3
Service Manager TM4
Main focus Secondary subjet
(Note: the profiles to be analyzed in detail are only those satisfying the condition stated in chapter 4)

Deliverable 4.3: Present national and European-level uptake of e-CF powered tool DIGITALJOBS
74
11.3.6 Profile Distribution by IT Industry
49%
47%
63%
38%
54%
43%
58%
55%
43%
42%
43%
31%
53%
72%
42%
45%
54%
36%
46%
48%
67%
50%2%
51%
53%
37%
62%
46%
57%
42%
45%
57%
58%
57%
69%
47%
28%
58%
55%
46%
64%
54%
52%
33%
50%2%
Average
Chief Information Officer BM1
Business Information Manager BM2
ICT Operations Manager BM3
Business Analyst DS1
Systems Analyst DS2
Enterprise Architect DS3
Systems Architect DS4
Developer DV1
Digital Media Specialist DV2
Test Specialist DV3
Account Manager SP1
ICT Trainer SP2
ICT Security Specialist SP3
ICT Consultant SP4
Database Administrator SR1
Systems Administrator SR2
Network Specialist SR3
Technical Specialist SR4
Quality Assurance Manager TM1
ICT Security Manager TM2
Project Manager TM3
Service Manager TM4
IT Demand side IT Supply side
(Note: the profiles to be analyzed in detail are only those satisfying the condition stated in chapter 4)

Deliverable 4.3: Present national and European-level uptake of e-CF powered tool DIGITALJOBS
75
11.4 Data tables
11.4.1 Countries Comparison
IT FI BE NO HU ES IE NL XX
Italy Finland Belgium Norway Hungary Spain IrelandNetherlan
dsOthers
Cases 1745 509 356 206 193 77 87 59 52 206
Age
Mean 41,7 41,6 40,9 36,6 45,2 47,3 42,5 44,0 49,8 42,0Less then 30 years 16% 11% 12% 39% 5% 10% 6% 8% 2% 21%
30 - 40 29% 34% 38% 20% 26% 25% 31% 27% 12% 25%
40 - 50 33% 37% 33% 29% 35% 17% 48% 42% 29% 24%
More then 50 years 23% 18% 18% 13% 33% 48% 15% 22% 58% 30%
GenderFemale 15% 11% 16% 11% 21% 16% 10% 22% 10% 20%
Male 85% 89% 84% 89% 79% 84% 90% 78% 90% 80%
EducationSecondary & other 30% 53% 29% 19% 21% 31% 32% 27% 19% 26%
University (Masters/Bachelors/Phd) 70% 47% 71% 81% 79% 69% 68% 73% 81% 74%
IT EducationalIT was the main focus of my education 66% 68% 69% 67% 57% 75% 85% 58% 60% 66%
IT was a side subject 23% 26% 20% 18% 30% 22% 13% 20% 29% 25%
IT was not significant in my curriculum 11% 6% 11% 15% 13% 3% 2% 22% 12% 9%
Current professional statusFull time employee 78% 77% 85% 56% 95% 74% 78% 76% 69% 79%
Part time employee 2% 3% 3% 1% 1% 5% 3% 2% 4% 2%
Self-employed 8% 14% 4% 10% 3% 10% 11% 10% 23% 9%
Student / Unemployed / Retired 11% 6% 8% 33% 1% 10% 7% 12% 4% 10%
Number of employees1 - 10 11% 17% 11% 8% 7% 14% 8% 9% 16% 16%
11 - 50 13% 15% 12% 11% 15% 19% 9% 13% 4% 12%
51 - 250 22% 21% 18% 21% 25% 23% 14% 6% 18% 33%
251 - 1000 18% 17% 18% 19% 18% 16% 26% 13% 20% 16%
> 1000 36% 31% 41% 40% 34% 28% 42% 58% 42% 23%
Industry (a)My focus is mainly on IT demand side 49% 54% 44% 48% 47% 51% 49% 51% 48% 57%
My focus is mainly on IT supply side organizations 51% 46% 56% 52% 53% 49% 51% 49% 52% 43%
Competence Proficiency IndexA- Plan 24% 23% 24% 22% 27% 19% 25% 27% 27% 23%
B- Build 25% 25% 27% 25% 25% 21% 26% 31% 20% 21%
C- Run 29% 34% 33% 26% 27% 21% 36% 38% 26% 24%
D- Enable 15% 15% 14% 14% 16% 13% 15% 17% 17% 17%
E- Manage 18% 15% 17% 16% 21% 13% 19% 22% 22% 17%
Total
Europe

Deliverable 4.3: Present national and European-level uptake of e-CF powered tool DIGITALJOBS
76
IT FI BE NO HU ES IE NL XX
Italy Finland Belgium Norway Hungary Spain IrelandNetherlan
dsOthers
Competence Proficiency Index
A- Plan 24% 23% 24% 22% 27% 19% 25% 27% 27% 23%A01) IS & Business Strategy Alignment 23% 20% 19% 20% 30% 20% 26% 24% 30% 23%
A02) Service Level Management 20% 21% 20% 16% 22% 20% 24% 17% 21% 19%
A03) Business Plan Development 18% 15% 16% 19% 21% 11% 17% 24% 23% 20%
A04) Product or Project Planning 32% 25% 37% 29% 39% 22% 31% 35% 36% 30%
A05) Architecture Design 31% 34% 34% 25% 34% 23% 32% 38% 31% 28%
A06) Application Design 29% 30% 31% 27% 30% 26% 33% 35% 24% 23%
A07) Technology Watching 31% 32% 31% 31% 32% 27% 32% 36% 33% 30%
A08) Sustainable development 9% 9% 9% 7% 9% 8% 6% 6% 12% 14%
B- Build 25% 25% 27% 25% 25% 21% 26% 31% 20% 21%B01) Design & Development 23% 21% 24% 26% 22% 24% 25% 25% 14% 20%
B02) Systems Integration 24% 28% 27% 23% 22% 15% 29% 29% 22% 21%
B03) Testing 22% 21% 24% 21% 23% 17% 21% 30% 17% 17%
B04) Solution Deployment 25% 29% 30% 22% 23% 18% 23% 36% 21% 19%
B05) Documentation Production 34% 33% 35% 33% 38% 33% 33% 44% 31% 29%
C- Run 29% 34% 33% 26% 27% 21% 36% 38% 26% 24%C01) User Support 35% 42% 36% 29% 36% 28% 44% 43% 28% 29%
C02) Change Support 32% 37% 36% 30% 31% 18% 37% 44% 30% 22%
C03) Service Delivery 21% 24% 24% 20% 18% 15% 27% 32% 25% 17%
C04) Problem Management 29% 33% 35% 24% 26% 23% 36% 36% 25% 25%
D- Enable 15% 15% 14% 14% 16% 13% 15% 17% 17% 17%D01) Information Security Strategy Development 16% 16% 20% 15% 14% 14% 18% 22% 18% 18%
D02) ICT Quality Strategy Development 18% 18% 18% 19% 18% 12% 15% 23% 30% 18%
D03) Education & Training Provision 21% 24% 19% 16% 20% 28% 21% 29% 22% 32%
D04) Purchasing 15% 17% 15% 11% 19% 8% 11% 17% 14% 17%
D05) Sales Proposal Development 16% 15% 18% 15% 19% 11% 15% 16% 13% 15%
D06) Channel Management 4% 6% 2% 4% 4% 4% 2% 4% 4% 6%
D07) Sales Management 5% 5% 5% 6% 5% 5% 5% 3% 6% 6%
D08) Contract Management 13% 13% 11% 11% 17% 11% 15% 15% 20% 12%
D09) Personnel Development 22% 19% 20% 23% 23% 22% 22% 28% 22% 26%
D10) Information & Knowledge Management 20% 17% 18% 20% 20% 20% 26% 22% 22% 22%
E- Manage 18% 15% 17% 16% 21% 13% 19% 22% 22% 17%E01) Forecast Development 11% 8% 9% 12% 13% 10% 10% 12% 14% 15%
E02) Project & Portfolio Management 20% 15% 22% 19% 26% 17% 22% 22% 22% 18%
E03) Risk Management 16% 10% 17% 13% 22% 12% 20% 22% 17% 15%
E04) Relationship Management 24% 23% 23% 23% 27% 14% 27% 31% 22% 21%
E05) Process Improvement 23% 18% 25% 26% 25% 14% 23% 26% 27% 23%
E06) ICT Quality Management 13% 11% 12% 13% 13% 12% 14% 16% 19% 16%
E07) Business Change Management 18% 15% 16% 16% 24% 10% 18% 27% 28% 15%
E08) Information Security Management 14% 14% 14% 12% 14% 12% 15% 16% 22% 14%
E09) IT Governance 18% 17% 16% 14% 23% 17% 17% 24% 26% 20%
Total
Europe

Deliverable 4.3: Present national and European-level uptake of e-CF powered tool DIGITALJOBS
77
IT FI BE NO HU ES IE NL XX
Italy Finland Belgium Norway Hungary Spain IrelandNetherlan
dsOthers
IT Profile (declared)
BM1) Chief Information Officer 7% 7% 5% 6% 8% 6% 10% 7% 8% 10%
BM2) Business Information Manager 3% 3% 2% 4% 4% 4% 1% 2% 12% 3%
BM3) ICT Operations Manager 4% 3% 2% 5% 4% 5% 1% 2% 13% 1%
DS1) Business Analyst 4% 4% 2% 8% 5% 1% 0% 8% 6% 1%
DS2) Systems Analyst 2% 1% 3% 1% 3% 1% 6% 0% 0% 1%
DS3) Enterprise Architect 3% 2% 4% 2% 5% 0% 1% 5% 12% 0%
DS4) Systems Architect 4% 3% 6% 2% 6% 3% 0% 3% 2% 3%
DV1) Developer 11% 8% 13% 17% 7% 13% 10% 15% 6% 13%
DV2) Digital Media Specialist 1% 1% 1% 1% 2% 3% 1% 0% 0% 1%
DV3) Test Specialist 3% 0% 2% 1% 8% 1% 2% 3% 0% 3%
SP1) Account Manager 3% 3% 3% 4% 5% 0% 1% 2% 0% 2%
SP2) ICT Trainer 3% 5% 2% 2% 0% 13% 6% 2% 0% 12%
SP3) ICT Security Specialist 2% 1% 3% 4% 3% 1% 2% 2% 0% 0%
SP4) ICT Consultant 11% 15% 10% 15% 5% 16% 6% 7% 12% 8%
SR1) Database Administrator 0% 1% 0% 0% 1% 1% 1% 0% 0% 0%
SR2) Systems Administrator 8% 14% 5% 6% 6% 3% 8% 8% 6% 6%
SR3) Network Specialist 2% 3% 1% 4% 0% 5% 0% 2% 0% 1%
SR4) Technical Specialist 7% 6% 13% 1% 6% 8% 14% 8% 0% 9%
SR5) Service Desk Agent 1% 0% 2% 0% 1% 0% 0% 0% 0% 1%
TM1) Quality Assurance Manager 2% 1% 1% 2% 3% 1% 2% 0% 2% 2%
TM2) ICT Security Manager 1% 1% 1% 0% 2% 3% 1% 0% 0% 2%
TM3) Project Manager 14% 14% 15% 10% 17% 9% 20% 20% 15% 13%
TM4) Service Manager 3% 1% 4% 1% 2% 3% 6% 3% 8% 6%
Proximity Profile (computed)
BM1) Chief Information Officer 3% 4% 1% 4% 4% 1% 3% 3% 8% 6%
BM2) Business Information Manager 2% 2% 3% 0% 4% 4% 2% 0% 4% 3%
BM3) ICT Operations Manager 2% 1% 2% 1% 2% 0% 1% 0% 4% 3%
DS1) Business Analyst 7% 5% 7% 8% 11% 5% 5% 3% 2% 8%
DS2) Systems Analyst 5% 2% 5% 11% 4% 3% 3% 5% 0% 5%
DS3) Enterprise Architect 2% 2% 1% 2% 2% 1% 2% 0% 10% 1%
DS4) Systems Architect 6% 5% 8% 3% 5% 6% 7% 12% 4% 5%
DV1) Developer 8% 7% 13% 10% 6% 6% 7% 12% 6% 6%
DV2) Digital Media Specialist 7% 5% 6% 7% 10% 10% 7% 8% 2% 3%
DV3) Test Specialist 2% 1% 4% 2% 3% 1% 0% 2% 0% 3%
SP1) Account Manager 2% 2% 1% 4% 3% 1% 0% 0% 2% 4%
SP2) ICT Trainer 14% 15% 11% 15% 9% 26% 11% 15% 12% 27%
SP3) ICT Security Specialist 1% 1% 1% 1% 1% 0% 2% 2% 0% 1%
SP4) ICT Consultant 1% 1% 1% 0% 1% 0% 0% 0% 2% 1%
SR1) Database Administrator 5% 5% 5% 7% 4% 6% 7% 5% 2% 7%
SR2) Systems Administrator 10% 15% 12% 6% 7% 8% 10% 10% 13% 8%
SR3) Network Specialist 4% 5% 5% 4% 4% 4% 5% 2% 0% 0%
SR4) Technical Specialist 24% 31% 28% 20% 20% 14% 29% 24% 21% 14%
SR5) Service Desk Agent 0% 0% 0% 0% 0% 0% 0% 0% 0% 0%
TM1) Quality Assurance Manager 3% 2% 2% 4% 4% 3% 6% 2% 4% 4%
TM2) ICT Security Manager 2% 3% 2% 0% 3% 4% 3% 7% 2% 3%
TM3) Project Manager 9% 6% 8% 8% 15% 1% 9% 14% 12% 5%
TM4) Service Manager 1% 1% 1% 0% 0% 0% 3% 7% 2% 0%
Total
Europe

Deliverable 4.3: Present national and European-level uptake of e-CF powered tool DIGITALJOBS
78
11.4.2 Proximity Profiles Comparison
DS1 DV1 DV2 SP2 SR2 SR4 TM3
Business
AnalystDeveloper
Digital Media
SpecialistICT Trainer
Systems
Administrator
Technical
Specialist
Project
Manager
Cases 1745 117 145 107 264 188 426 141
Age
Mean 41,7 44,0 37,9 39,8 45,0 38,0 42,1 44,3 <30 yr 16% 8% 27% 23% 9% 24% 11% 3%
30 - 40 29% 27% 32% 32% 26% 36% 31% 26%
40 - 50 33% 37% 28% 26% 32% 27% 38% 47%
50 - 60 18% 22% 10% 14% 22% 10% 17% 22%
61 - .. 5% 5% 3% 6% 11% 2% 3% 1%
GenderFemale 15% 15% 19% 14% 25% 13% 12% 25%
Female 85% 85% 81% 86% 75% 87% 88% 75%
EducationSecondary or less 14% 8% 22% 10% 9% 21% 20% 10%
University (Graduate or more) 86% 92% 78% 90% 91% 79% 80% 90%
IT EducationalIT was the main focus of my education 66% 61% 73% 84% 58% 71% 67% 50%
IT was a side subject 23% 24% 22% 7% 24% 18% 24% 32%
IT was not significant in my curriculum 11% 15% 5% 8% 17% 10% 9% 19%
Current professional statusFull time employee 78% 79% 69% 81% 75% 77% 84% 82%
Part time employee 2% 1% 2% 1% 6% 4% 1% 0%
Self-employed 8% 12% 3% 3% 8% 7% 8% 12%
Student / Unemployed / Retired 11% 8% 26% 15% 11% 12% 7% 5%
Number of employees1 - 10 11% 12% 11% 4% 16% 10% 9% 9%
11 - 50 13% 13% 15% 17% 10% 13% 14% 9%
51 - 250 22% 19% 17% 18% 23% 31% 24% 17%
251 - 1000 18% 17% 8% 15% 17% 17% 20% 17%
> 1000 36% 39% 50% 46% 33% 29% 33% 48%
IndustryMainly on IT demand side 49% 54% 43% 42% 53% 54% 46% 50%
Mainly on IT supply side 51% 46% 57% 58% 47% 46% 54% 50%
Proximity index 87,0 92,7 86,1 85,3 87,9 71,7 92,5 88,9Min 40 54 40 40 53 44 41 44
Max 100 100 100 100 100 100 100 100
Competence index
A- Plan 24% 46% 20% 25% 23% 15% 23% 36%
B- Build 25% 29% 50% 55% 17% 23% 29% 22%
C- Run 29% 32% 35% 27% 22% 36% 55% 26%
D- Enable 15% 27% 9% 12% 22% 9% 15% 23%
E- Manage 18% 37% 10% 12% 17% 11% 18% 38%
Total
Europe

Deliverable 4.3: Present national and European-level uptake of e-CF powered tool DIGITALJOBS
79
DS1 DV1 DV2 SP2 SR2 SR4 TM3
Business
AnalystDeveloper
Digital Media
SpecialistICT Trainer
Systems
Administrator
Technical
Specialist
Project
Manager
Cases 1745 117 145 107 264 188 426 141
Competence index
A- Plan 24% 46% 20% 25% 23% 15% 23% 36%A01) IS & Business Strategy Alignment 23% 66% 13% 13% 23% 8% 19% 39%
A02) Service Level Management 20% 36% 7% 9% 19% 15% 23% 32%
A03) Business Plan Development 18% 57% 9% 11% 20% 8% 13% 35%
A04) Product or Project Planning 32% 54% 28% 37% 31% 21% 31% 64%
A05) Architecture Design 31% 48% 32% 39% 26% 22% 34% 34%
A06) Application Design 29% 37% 45% 60% 22% 18% 29% 36%
A07) Technology Watching 31% 46% 28% 33% 32% 23% 33% 30%
A08) Sustainable development 9% 15% 4% 8% 9% 8% 8% 10%
B- Build 25% 29% 50% 55% 17% 23% 29% 22%B01) Design & Development 23% 26% 52% 58% 14% 12% 21% 15%
B02) Systems Integration 24% 23% 40% 40% 14% 31% 32% 19%
B03) Testing 22% 23% 45% 47% 14% 27% 25% 25%
B04) Solution Deployment 25% 31% 37% 62% 14% 26% 36% 18%
B05) Documentation Production 34% 46% 75% 73% 32% 26% 37% 39%
C- Run 29% 32% 35% 27% 22% 36% 55% 26%C01) User Support 35% 40% 40% 30% 30% 61% 52% 34%
C02) Change Support 32% 33% 36% 32% 23% 28% 72% 30%
C03) Service Delivery 21% 23% 22% 24% 16% 20% 48% 17%
C04) Problem Management 29% 33% 41% 24% 20% 33% 53% 25%
D- Enable 15% 27% 9% 12% 22% 9% 15% 23%D01) Information Security Strategy Development 16% 24% 12% 15% 19% 14% 19% 20%
D02) ICT Quality Strategy Development 18% 31% 13% 21% 20% 9% 22% 24%
D03) Education & Training Provision 21% 32% 9% 14% 66% 10% 19% 28%
D04) Purchasing 15% 29% 7% 7% 17% 11% 18% 26%
D05) Sales Proposal Development 16% 27% 12% 18% 18% 12% 16% 29%
D06) Channel Management 4% 5% 2% 2% 5% 2% 3% 5%
D07) Sales Management 5% 9% 3% 3% 6% 3% 4% 9%
D08) Contract Management 13% 24% 3% 5% 14% 11% 14% 27%
D09) Personnel Development 22% 39% 13% 17% 43% 11% 21% 32%
D10) Information & Knowledge Management 20% 44% 16% 21% 25% 11% 21% 29%
E- Manage 18% 37% 10% 12% 17% 11% 18% 38%E01) Forecast Development 11% 22% 3% 7% 12% 4% 8% 19%
E02) Project & Portfolio Management 20% 43% 12% 17% 21% 12% 19% 59%
E03) Risk Management 16% 29% 9% 13% 14% 10% 16% 47%
E04) Relationship Management 24% 41% 18% 17% 23% 16% 24% 53%
E05) Process Improvement 23% 74% 15% 14% 24% 14% 25% 35%
E06) ICT Quality Management 13% 25% 8% 11% 14% 7% 16% 22%
E07) Business Change Management 18% 44% 9% 11% 17% 8% 17% 49%
E08) Information Security Management 14% 21% 10% 10% 11% 20% 17% 17%
E09) IT Governance 18% 33% 6% 8% 19% 10% 18% 27%
Total
Europe
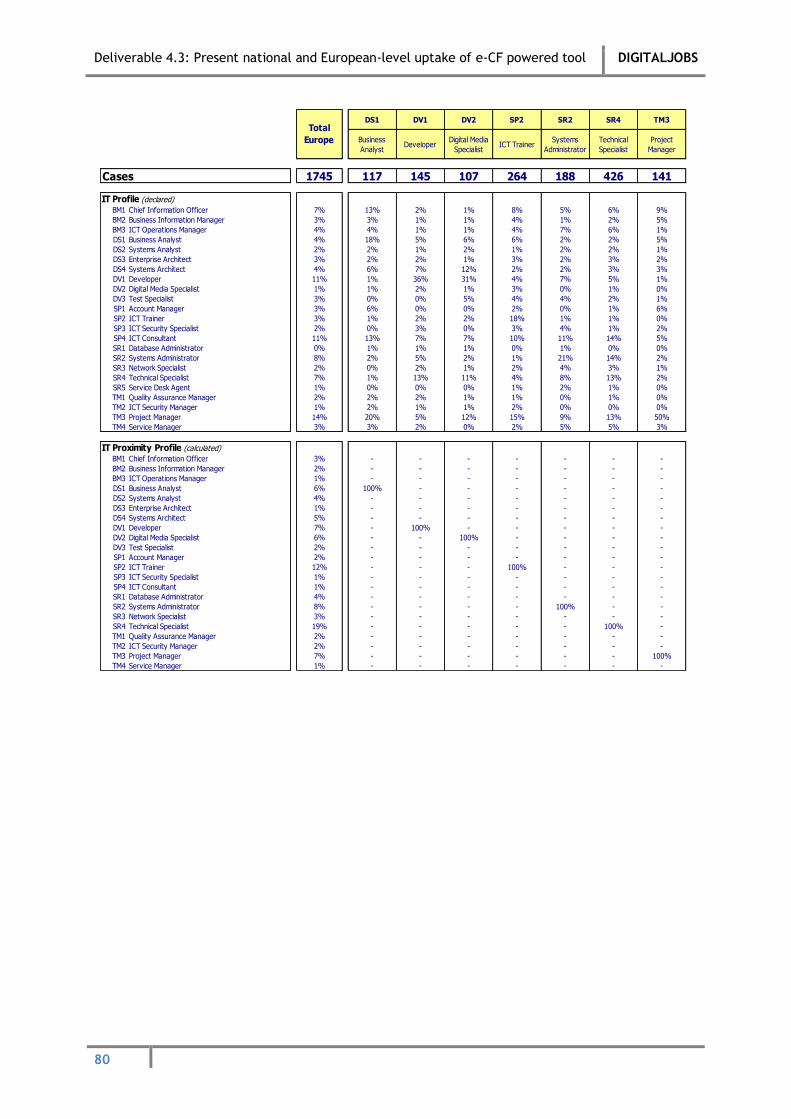
Deliverable 4.3: Present national and European-level uptake of e-CF powered tool DIGITALJOBS
80
DS1 DV1 DV2 SP2 SR2 SR4 TM3
Business
AnalystDeveloper
Digital Media
SpecialistICT Trainer
Systems
Administrator
Technical
Specialist
Project
Manager
Cases 1745 117 145 107 264 188 426 141
IT Profile (declared)
BM1 Chief Information Officer 7% 13% 2% 1% 8% 5% 6% 9%
BM2 Business Information Manager 3% 3% 1% 1% 4% 1% 2% 5%
BM3 ICT Operations Manager 4% 4% 1% 1% 4% 7% 6% 1%
DS1 Business Analyst 4% 18% 5% 6% 6% 2% 2% 5%
DS2 Systems Analyst 2% 2% 1% 2% 1% 2% 2% 1%
DS3 Enterprise Architect 3% 2% 2% 1% 3% 2% 3% 2%
DS4 Systems Architect 4% 6% 7% 12% 2% 2% 3% 3%
DV1 Developer 11% 1% 36% 31% 4% 7% 5% 1%
DV2 Digital Media Specialist 1% 1% 2% 1% 3% 0% 1% 0%
DV3 Test Specialist 3% 0% 0% 5% 4% 4% 2% 1%
SP1 Account Manager 3% 6% 0% 0% 2% 0% 1% 6%
SP2 ICT Trainer 3% 1% 2% 2% 18% 1% 1% 0%
SP3 ICT Security Specialist 2% 0% 3% 0% 3% 4% 1% 2%
SP4 ICT Consultant 11% 13% 7% 7% 10% 11% 14% 5%
SR1 Database Administrator 0% 1% 1% 1% 0% 1% 0% 0%
SR2 Systems Administrator 8% 2% 5% 2% 1% 21% 14% 2%
SR3 Network Specialist 2% 0% 2% 1% 2% 4% 3% 1%
SR4 Technical Specialist 7% 1% 13% 11% 4% 8% 13% 2%
SR5 Service Desk Agent 1% 0% 0% 0% 1% 2% 1% 0%
TM1 Quality Assurance Manager 2% 2% 2% 1% 1% 0% 1% 0%
TM2 ICT Security Manager 1% 2% 1% 1% 2% 0% 0% 0%
TM3 Project Manager 14% 20% 5% 12% 15% 9% 13% 50%
TM4 Service Manager 3% 3% 2% 0% 2% 5% 5% 3%
IT Proximity Profile (calculated)
BM1 Chief Information Officer 3% - - - - - - -
BM2 Business Information Manager 2% - - - - - - -
BM3 ICT Operations Manager 1% - - - - - - -
DS1 Business Analyst 6% 100% - - - - - -
DS2 Systems Analyst 4% - - - - - - -
DS3 Enterprise Architect 1% - - - - - - -
DS4 Systems Architect 5% - - - - - - -
DV1 Developer 7% - 100% - - - - -
DV2 Digital Media Specialist 6% - - 100% - - - -
DV3 Test Specialist 2% - - - - - - -
SP1 Account Manager 2% - - - - - - -
SP2 ICT Trainer 12% - - - 100% - - -
SP3 ICT Security Specialist 1% - - - - - - -
SP4 ICT Consultant 1% - - - - - - -
SR1 Database Administrator 4% - - - - - - -
SR2 Systems Administrator 8% - - - - 100% - -
SR3 Network Specialist 3% - - - - - - -
SR4 Technical Specialist 19% - - - - - 100% -
TM1 Quality Assurance Manager 2% - - - - - - -
TM2 ICT Security Manager 2% - - - - - - -
TM3 Project Manager 7% - - - - - - 100%
TM4 Service Manager 1% - - - - - - -
Total
Europe

AustriaOesterreichisches Computer Gesellschaft (OCG)
BelgiumFederation of Belgian Informatics Associations (FBVI-FAIB)
Bosnia and HerzegovinaAssociation of Informatics in Bosnia and Herze-govina
BulgariaUnion of Automation and Informatics (UAI)
CroatiaCroatian Information Technology Association (CITA)
CyprusCyprus Computer Society (CCS)
Czech RepublicCzech Society for Cybernetics and Informatics (CSKI)
DenmarkDansk IT
FinlandFinnish Information Processing Association (TIVIA)
GermanyGesellschaft für Informatik e.V – German Informatics (GI)
GermanyInformationstechnische Gesellschaft im Verband der Elektrotechnik Elektronik Informationstechnik (VDE)
GreeceHellenic Professionals Informatics Society (HEPIS)
HungaryJohn von Neumann Computer Society (NJSzT)
IcelandIcelandic Society for Information Processing (ISIP)
IrelandThe Irish Computer Society (ICS)
ItalyAssociazione Italiana per l’Informatica ed il Calcolo Automatico (AICA)
LatviaLatvian Information Technology & Telecommunica-tions Association (LIKTA)
LithuaniaLietuvos Kompiuterininku Sajunga (LIKS)
LuxembourgAssociation Luxembourgoise des Ingenieurs (ALI)
MaltaComputer Society of Malta (CSM)
MontenegroDrustvo Informatičara Crne Gore (DICG)
The NetherlandsVereniging van Register Informatica (VRI) / Neder-lands Genootschap voor Informatica (NGI
NorwayDen Norske Dataforening (DND)
PolandPolskie Towarzystwo Informatyczne - Polish Infor-mation Processing Society (PTI-PIPS)
RomaniaAsociatia Pentru Tehnologia Informatiei si Comuni-catii (ATIC)
SerbiaSerbian Information Technology Association (JISA)
SlovakiaSlovak Society for Computer Science (SSCS)
SloveniaSlovenian Society Informatika (SSI)
SpainAsociación de Técnicos de Informática (ATI)
SwedenDF Dataforeningen i Sverige (Swedish Computer Society)
SwitzerlandSwiss Informatics Society (SI)
TurkeyInformatics Association of Turkey (IAT)
United KingdomBCS - The Chartered Institute for IT
The Members of CEPIS

Telephone: +32 (0)2 772 18 36Fax: +32 (0)2 646 30 32E-mail: [email protected]: www.cepis.org
Avenue Roger Vandendriessche 181150 Brussels, Belgium
Council of European Professional Informatics Societies (CEPIS)
About CEPIS uropeT
The Council of European Professional Informatics Societies (CEPIS) is a non-profit organisation seeking to improve and promote a high standard among informatics professionals in recognition of the impact that Informatics has on employ-ment, business and society.
CEPIS represents 33 Member Societies in 32 countries. Established in 1989, CEPIS has grown to represent over 450,000 informatics professionals in Europe and beyond.