Embed Size (px)
Citation preview
E-COMMERCE MEASUREMENT @UNCTAD
Torbjörn Fredriksson([email protected])
Chief, ICT Analysis Section, UNCTAD
Regional Workshop on International Merchandise Trade Statistics Strengthening Data
Compilation and Analytical Capacity
Suzhou, China
11-13 September 2017
CROSS-BORDER E-COMMERCE DATA
In search of Cross-Border E-commerce Trade Data
UNCTAD

WHAT IS ELECTRONIC COMMERCE?
• OECD definition of an e-commerce transaction:
– “...the sale or purchase of goods or services, conducted over computer
networks by methods specifically designed for the purpose of receiving
or placing of orders”.
– Payment and delivery do not have to be conducted online.
– Orders made by telephone calls, fax or manually typed e-mail excluded
• Business-to-business (B2B)
• Business-to-consumer (B2C)
• Consumer-to-consumer (C2C)
• Government-to-business (G2B): e.g. e-procurement
• What is cross-border e-commerce?
3

MAJOR E-COMMERCE MARKETS: TOP 10
Total B2B B2C
Economy $ billion % of GDP $ billion% of all e-
commerce$ billion
1 United States 7,055 39% 6,443 91% 612
2 Japan 2,495 60% 2,382 96% 114
3 China 1,991 18% 1,374 69% 617
4 Korea (Rep.) 1,161 84% 1,113 96% 48
5 Germany (2014) 1,037 27% 944 91% 93
6 United Kingdom 845 30% 645 76% 200
7 France (2014) 661 23% 588 89% 73
8 Canada (2014) 470 26% 422 90% 48
9 Spain 242 20% 217 90% 25
10 Australia 216 16% 188 87% 28
10 above 16,174 34% 14,317 89% 1,857
World 25,293 22,389 2,904
Note: Figures in italics are estimates. Missing data were estimated based on average ratios. Converted to $ using annual average exchange rate. Source: UNCTAD, adapted from US Census Bureau; Japan Ministry of Economy, Trade and Industry; China Bureau of Statistics; KOSTAT (Republic of Korea); EUROSTAT (for Germany); UK Office of National Statistics; INSEE (France); Statistics Canada; Australian Bureau of Statistics and INE (Spain).

B2C E-COMMERCE BY SECTOR & ENTERPRISE SIZE,
UNITED KINGDOM
Retail
25%
Wholesale
16%
Transport &
storage
16%
Information &
communication
13%
Other services
13%
Utilities
8%
Accommodatio
n & food
services
5%
Manufacturing
3%
Construction
1%
Web sales to private customers, 2014
Micro
enterprises
10%
Others
90%
Web sales to private customers, 2014
Note: Micro enterprises refer to entities with less than 10 employees.Source: UNCTAD, based on data from ONS.

CROSS-BORDER E-COMMERCE
• International trade is sluggish, but data traffic online is
surging as is e-commerce
– Global Internet traffic expected to be 66 times higher in 2019
than in 2005
• How much of international trade is e-commerce?
• How much of e-commerce is cross-border?
• Very few official statistics on cross-border e-commerce; some
estimates available
• Developed countries e-commerce predominantly domestic
• In some developing countries cross-border more significant
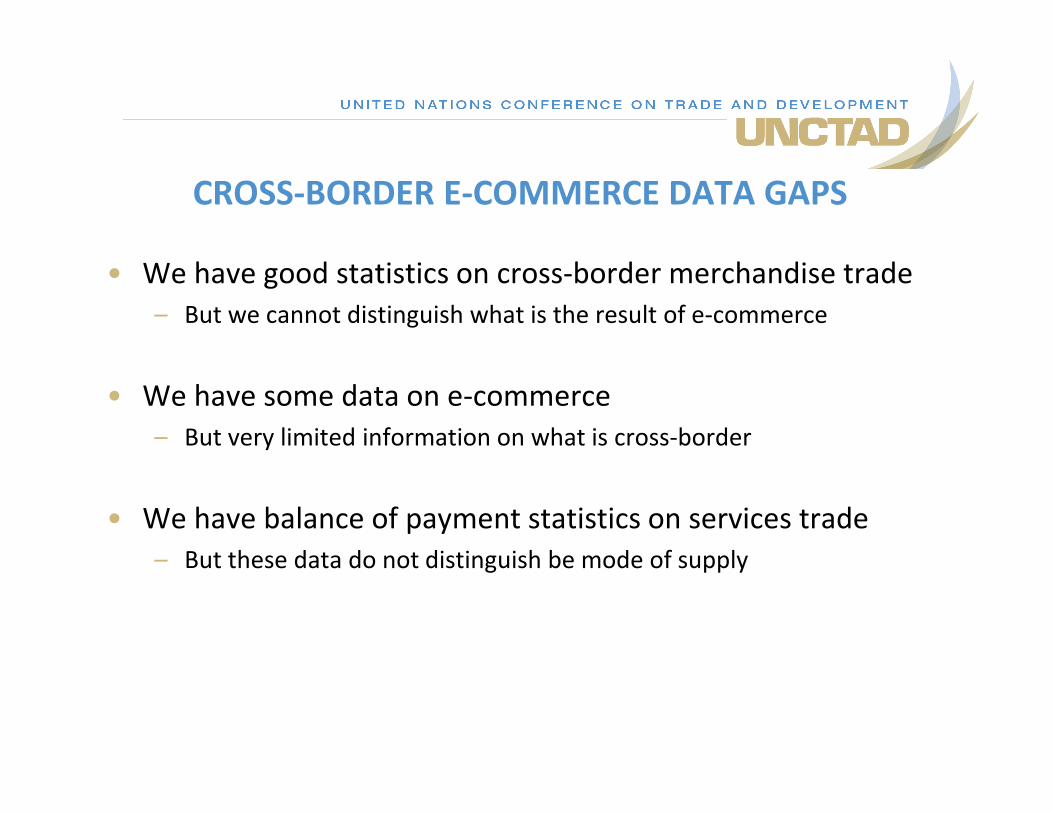
CROSS-BORDER E-COMMERCE DATA GAPS
• We have good statistics on cross-border merchandise trade
– But we cannot distinguish what is the result of e-commerce
• We have some data on e-commerce
– But very limited information on what is cross-border
• We have balance of payment statistics on services trade
– But these data do not distinguish be mode of supply

EUROPEAN UNION
Cross-border shopping in the EU: Proportion of EU online shoppers among Internet users (left) and EU online shoppers buying from
local and overseas sellers (right), 2015
Source: UNCTAD (2017). Information Economy Report 2017: Digitalization, Trade and Development, adapted from EUROSTAT.

CHINA, JAPAN, US AND KOREA (REP. OF)
Cross-border online B2C sales between China, Japan and the United States, 2015 (left) and cross-border online purchases in the Republic of
Korea, various years (right) ($ billion)
Source: UNCTAD (2017). Information Economy Report 2017: Digitalization, Trade and Development, Adapted from Ministry of Economy, Trade and Industry, Japan, and Korean Customs Service.
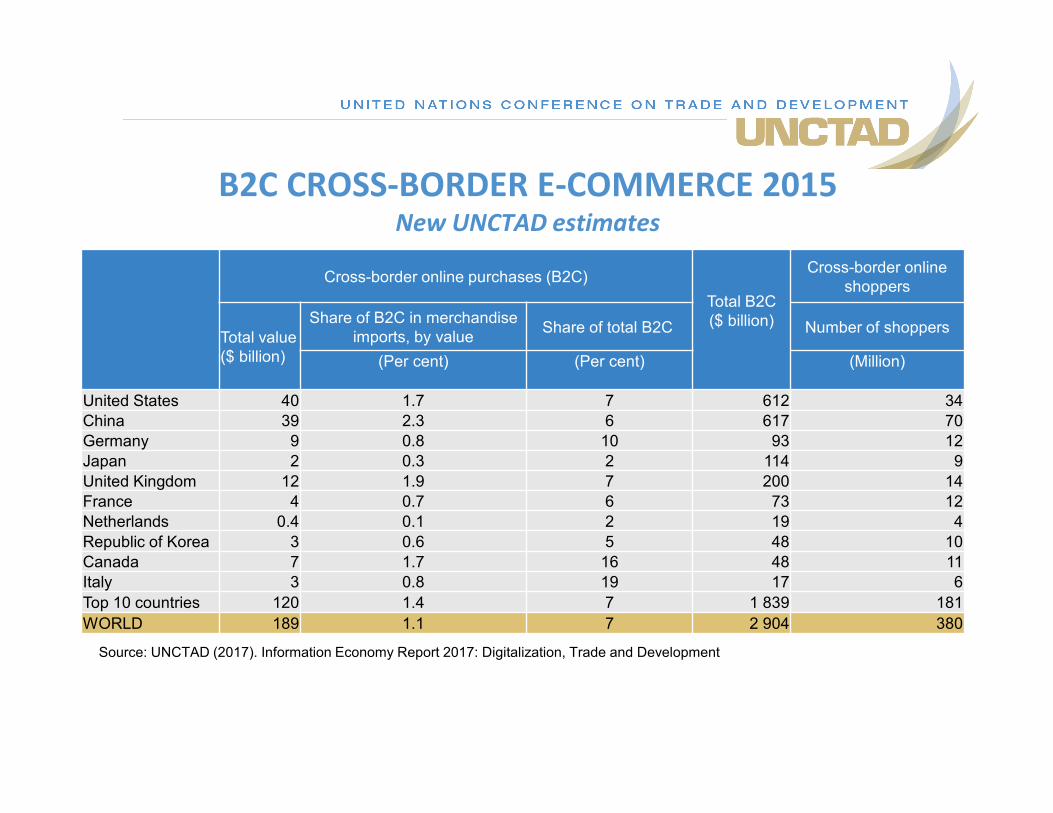
B2C CROSS-BORDER E-COMMERCE 2015New UNCTAD estimates
Cross-border online purchases (B2C)
Total B2C($ billion)
Cross-border online shoppers
Total value ($ billion)
Share of B2C in merchandise imports, by value
Share of total B2C Number of shoppers
(Per cent) (Per cent) (Million)
United States 40 1.7 7 612 34
China 39 2.3 6 617 70
Germany 9 0.8 10 93 12
Japan 2 0.3 2 114 9
United Kingdom 12 1.9 7 200 14
France 4 0.7 6 73 12
Netherlands 0.4 0.1 2 19 4
Republic of Korea 3 0.6 5 48 10
Canada 7 1.7 16 48 11
Italy 3 0.8 19 17 6
Top 10 countries 120 1.4 7 1 839 181
WORLD 189 1.1 7 2 904 380
Source: UNCTAD (2017). Information Economy Report 2017: Digitalization, Trade and Development

UNCTAD E-COMMERCE WEEK 2017
• >1,000 participants, 170 speakers
• Recommendations on measurement:
– Use existing surveys of economic activity and customs
declarations to collect data on e-commerce + add a few
questions
– Use creatively "big data" from financial, transport firms and
Internet trading platforms, as well as postal data, as an input into
public data collection
– Build capacity in developing-country statistical agencies
– Continue partnership by all relevant stakeholders in the
measurement agenda
MORE AND BETTER E-COMMERCE DATA ARE NEEDED
• What are new areas of demand?
• What are future plans to improve data availability?
• What are your priorities for action?
• Where should technical assistance focus for better and faster
results?
THANK YOU